Effects of a One-Time Application of Controlled-Release Nitrogen Fertilizer on Yield and Nitrogen Accumulation and Utilization of Late Japonica Rice in China


Abstract
:1. Introduction
2. Materials and Methods
2.1. Experimental Location
2.2. Plant Materials, Growth Conditions, and Treatments
2.3. Sampling and Measurements
2.4. Equations and Data Analysis
3. Results
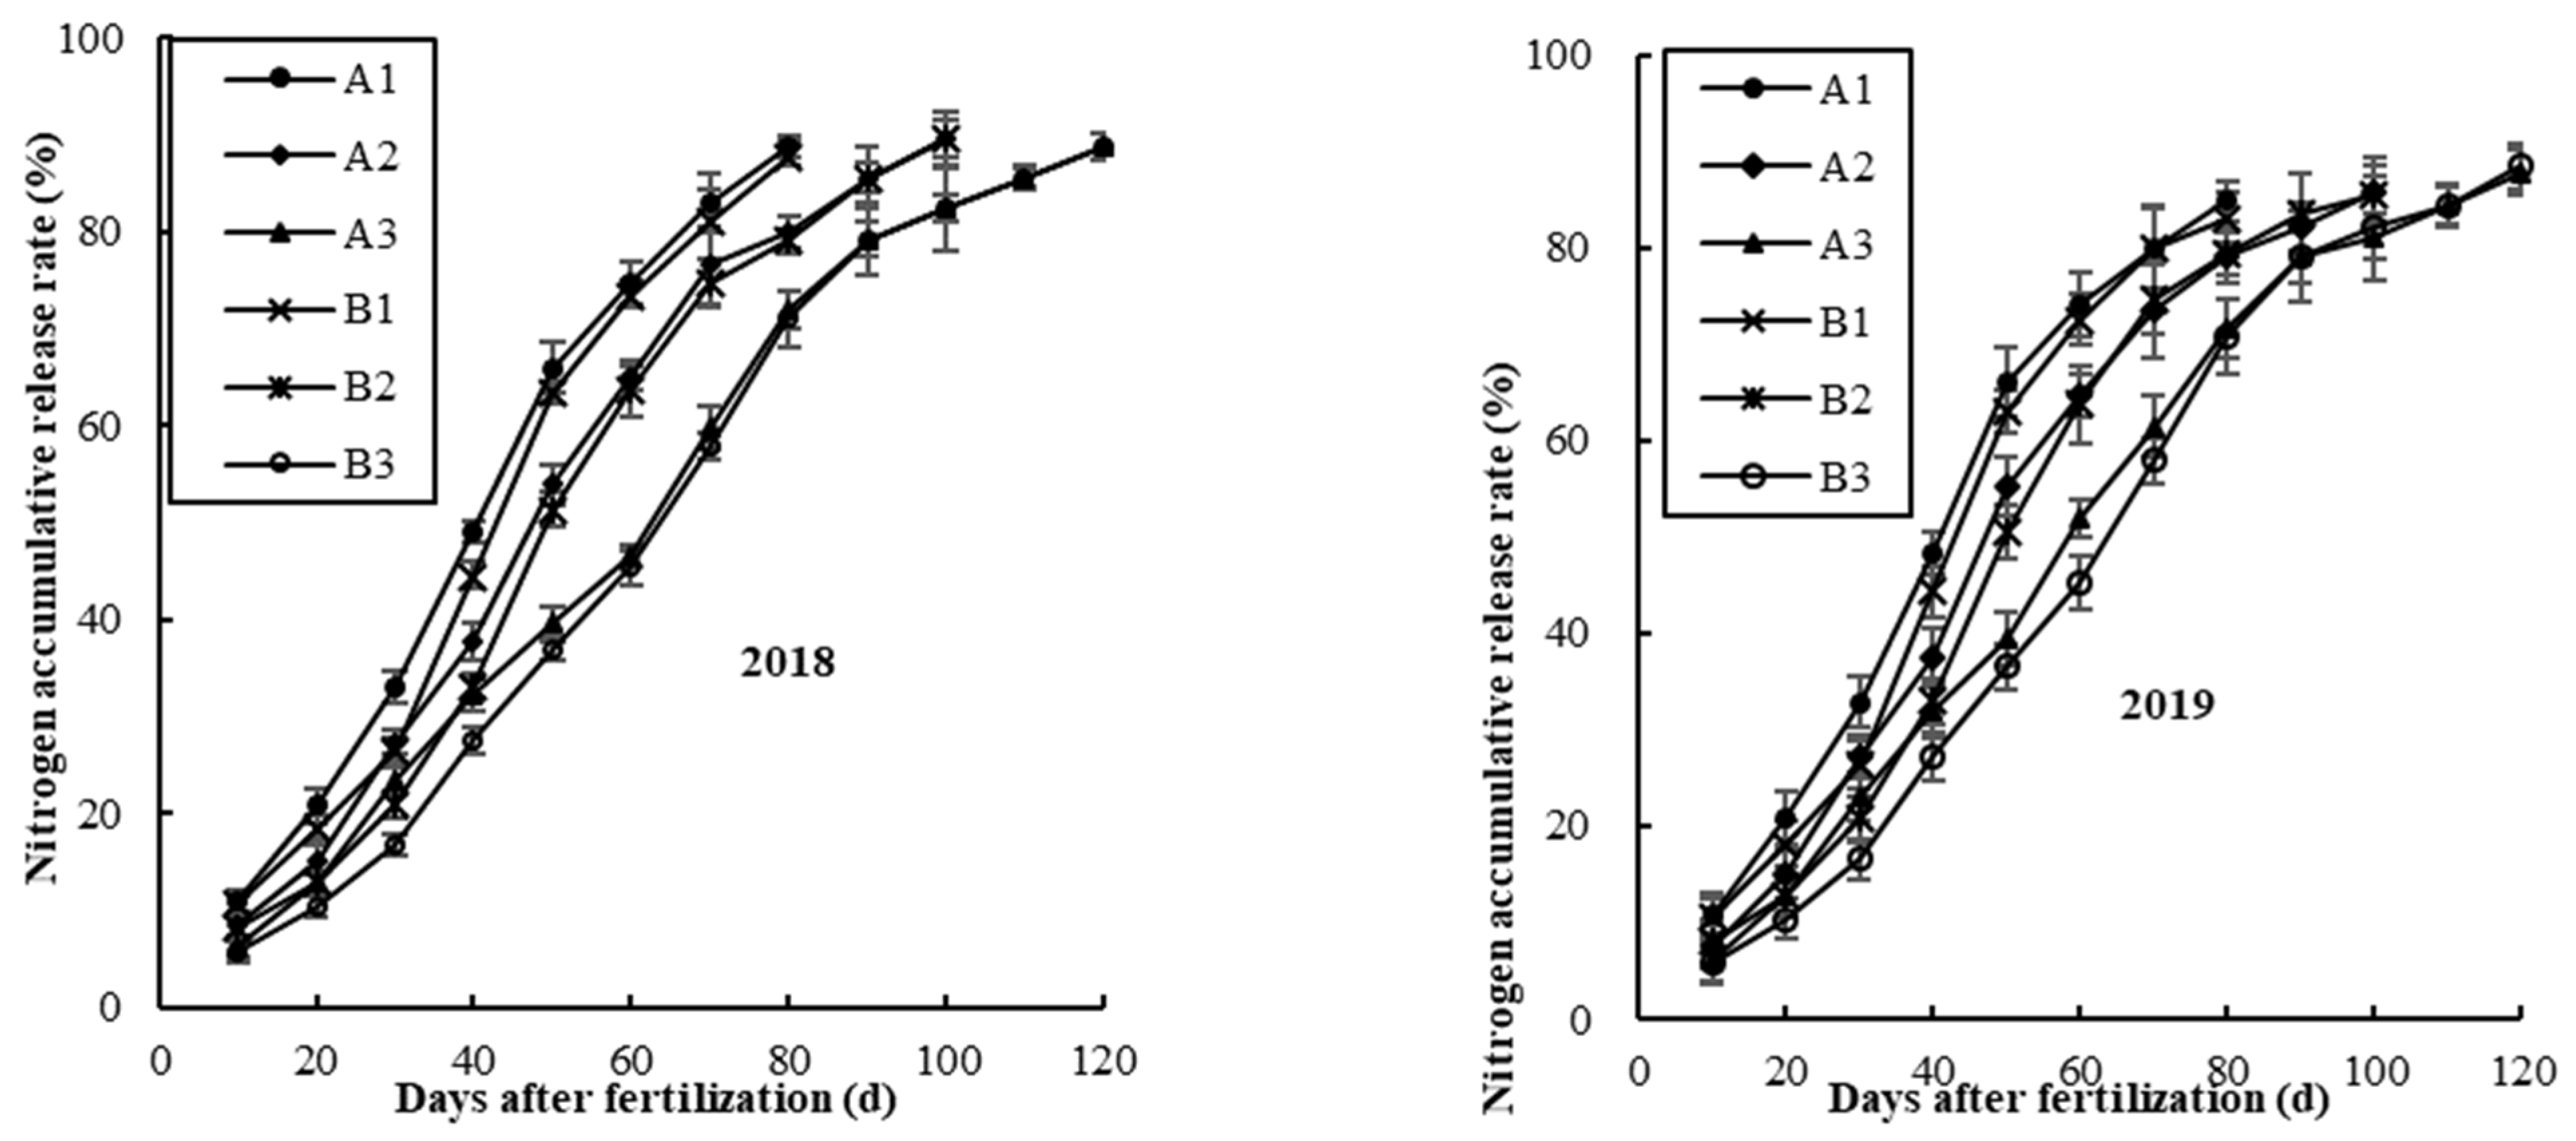
3.1. Cumulative N Release Rate
3.2. Grain Yield and Its Components
3.3. Amount and Percentages of Above-Ground Biomass Accumulation
3.4. Leaf Area Index and Decreasing Rate of Leaf Area
3.5. Crop Growth Rate and Photosynthetic Potential
3.6. Amount and Percentage of N Accumulation
3.7. Nitrogen Accumulation in Organs
3.8. Nitrogen-Use Efficiency
4. Discussion
4.1. Effects of One-Time N Application on N Uptake and Utilization of Late Japonica Rice
4.2. Effects of One-Time N Application on Yield of Late Japonica Rice
5. Conclusions
Author Contributions
Funding
Acknowledgments
Conflicts of Interest
References
- Grant, C.A.; Wu, R.F.; Harker, K.N.; Clayton, G.W.; Bittman, S.; Zebarth, B.J.; Lupwayi, N.Z. Crop yield and nitrogen concentration with controlled release urea and split applications of nitrogen as compared to non-coated urea applied at seeding. Field Crop. Res. 2012, 127, 170–180. [Google Scholar] [CrossRef]
- Duan, J.; Shao, Y.; He, L.; Li, X.; Hou, G.; Li, S.; Feng, W.; Zhu, Y.; Wang, Y.; Xie, Y. Optimizing nitrogen management to achieve high yield. high nitrogen efficiency and low nitrogen emission in winter wheat. Sci. Total Environ. 2019, 697, 134088. [Google Scholar] [CrossRef]
- Peng, S.B.; Buresh, R.J.; Huang, J.L.; Yang, J.C.; Zou, Y.B.; Zhong, X.H.; Wang, G.H.; Zhang, F.S. Strategies for overcoming low agronomic nitrogen use efficiency in irrigated rice systems in China. Field Crop. Res. 2006, 96, 37–47. [Google Scholar] [CrossRef]
- Song, C.; Guan, Y.; Wang, D.; Zewudie, D.; Li, F.M. Palygorskite-coated Fertilizers with a timely release of nutrients increase potato productivity in a rain-fed cropland. Field Crop. Res. 2014, 166, 10–17. [Google Scholar] [CrossRef]
- Geng, J.B.; Sun, Y.B.; Zhang, M.; Li, C.L.; Yang, Y.C.; Liu, Z.G.; Li, S.L. Long-term effects of controlled release urea application on crop yields and soil fertility under rice-oilseed rape rotation system. Field Crop. Res. 2015, 184, 65–73. [Google Scholar] [CrossRef]
- Farmaha, B.S.; Sims, A.L. The Influence of Polymer-Coated Urea and Urea Fertilizer Mixtures on Spring Wheat Protein Concentrations and Economic Returns. Agron. J. 2013, 105, 1328–1334. [Google Scholar] [CrossRef]
- Ye, Y.S.; Liang, X.Q.; Chen, Y.X.; Liu, J.; Gu, G.T.; Guo, R.; Li, L. Alternate wetting and drying irrigation and controlled-release nitrogen fertilizer in late-season rice. Effects on dry matter accumulation yield, water and nitrogen use. Field Crop. Res. 2013, 144, 212–224. [Google Scholar] [CrossRef]
- Miao, X.K.; Xing, X.M.; Ke, J.; Liu, Z.H.; Tang, S.; Ding, C.Q.; Wang, S.H.; Li, G.H. Yield and nitrogen uptake of bowl-seedling machine-transplanted rice with slow-Release nitrogen fertilizer. Agron. J. 2016, 108, 313–320. [Google Scholar] [CrossRef] [Green Version]
- Wei, H.Y.; Li, H.L.; Cheng, J.Q.; Zhang, H.C.; Xu, K.; Guo, B.W.; Hu, Y.J.; Cui, P.Y. Effects of slow/controlled release fertilizer types and their application tegime on yield in rice with different types of panicle. Acta Agron. Sin. 2017, 43, 730–740. [Google Scholar] [CrossRef]
- Wei, H.Y.; Chen, Z.F.; Xing, Z.P.; Zhou, L.; Liu, Q.Y.; Zhang, Z.Z.; Jiang, Y.; Hu, Y.J.; Zhu, J.Y.; Cui, P.Y.; et al. Effects of slow or controlled release fertilizer types and fertilization modes on yield and quality of rice. J. Integr. Agr. 2018, 17, 2222–2234. [Google Scholar] [CrossRef]
- Xing, X.M.; Li, X.C.; Ding, Y.F.; Wang, S.H.; Liu, Z.H.; Tang, S.; Ding, C.Q.; Li, G.H.; Wei, G.B. Effects of types of controlled released nitrogen and fertilization modes on yield and dry mass production. Sci. Agric. Sin. 2015, 48, 4892–4902. [Google Scholar]
- Ni, B.; Liu, M.; Lv, S.; Xie, L.; Wang, Y. Environmentally friendly slow-release nitrogen fertilizer. J. Agric. Food Chem. 2011, 59, 10169–10175. [Google Scholar] [CrossRef]
- Li, Y.; Li, Y.H.; Zhao, J.H.; Sun, Y.J.; Xu, H.; Yan, F.J.; Xie, H.Y.; Ma, J. Effects of slow-and controlled-release nitrogen fertilizer on nitrogen utilization characteristics and yield of machine-transplanted rice. J. Zhejiang Univ. Agric. Life Sci. 2015, 41, 673–684. [Google Scholar]
- Lv, X.H.; Fu, L.D.; Wang, Y.; Sui, X.; Ren, H.; Li, X.; Li, B.J. Effect of proportioning application of slow-release fertilizer and available nitrogen fertilizer on machine transplanted rice yield and nitrogen utilization efficiency. Jiangsu Agric. Sci. 2016, 44, 115–118. [Google Scholar]
- Hu, C.H.; Luo, G.B.; Zeng, J.H.; Pan, X.Z. Influence of different types of slow-release nitrogen fertilizer on rice yield and nitrogen fertilizer use efficiency. Chin. Agric. Sci. Bull. 2011, 27, 174–177. [Google Scholar]
- Zeng, Y.J.; Shi, Q.H.; Pan, X.H.; Han, T. Effects of Nitrogen Application Amount on Characteristics of Nitrogen Utilization and Yield Formation in High Yielding Early Hybrid Rice. Acta Agron. Sin. 2008, 34, 1409–1416. [Google Scholar] [CrossRef]
- Li, M.Y.; Shi, Q.H.; Huang, C.L.; Zeng, L.; Pan, X.H.; Tang, X.M. Effects of Nitrogen Application of Panicle Fertilizer on Source-Sink Characteristics and Nitrogen Fertilizer Use Efficiency of Super Hybrid Rice Ganxin 688. Hybrid Rice. 2010, 25, 63–72. [Google Scholar]
- Wei, H.H.; Meng, T.Y.; Li, C.; Xu, K.; Huo, Z.Y.; Wei, H.Y.; Guo, B.W.; Zhang, H.C.; Dai, Q.G. Comparisons of grain yield and nutrient accumulation and Translocation in high-yielding japonica/indica hybrids.; indica hybrids.; and japonica conventional varieties. Field Crop. Res. 2017, 204, 101–109. [Google Scholar] [CrossRef]
- Ding, Y.F.; Li, G.H.; Li, W.W.; Gao, S.; Wang, Y.H.; Liu, Z.H.; Chen, L.; Ding, C.Q.; Tang, S.; Jiang, Y. Introduction to the one-time Fertilization Technology for Mechanized Transplanting Rice: Side Deep Application of Controlled-release Blend Fertilizer. China Rice. 2020, 26, 11–15. [Google Scholar]
- Li, J.J.; Xu, M.G.; Xin, J.S.; Duan, J.J.; Ren, Y.; Li, D.C.; Huang, J.; Shen, H.P.; Zhang, H.M. Spatial and Temporal Characteristics of Basic Soil Productivity in China. Sci. Agric. Sin. 2016, 49, 510–1519. [Google Scholar]
- Douglas, L.A.; Riazi, A.; Smith, C.J. A semi-micro method for determining total nitrogen in soils and plant material containing nitrite and nitrate. Soil Sci. Soc. Am. J. 1980, 44, 431–433. [Google Scholar] [CrossRef]
- Yang, Y.C.; Zhang, M.; Zheng, L.; Cheng, D.D.; Liu, M.; Geng, Y.Q. Controlled Release Urea Improved Nitrogen Use Efficiency.; Yield.; and Quality of Wheat. Agron. J. 2011, 103, 479. [Google Scholar] [CrossRef]
- Xiong, Q.Q.; Tang, G.P.; Zhong, L.; He, H.H.; Chen, X.R. Response to nitrogen deficiency and compensation on physiological characteristics, yield formation, and nitrogen utilization of rice. Front. Plant Sci. 2018, 9, 1075. [Google Scholar] [CrossRef] [PubMed] [Green Version]
- Hu, Y.J.; Wu, P.; Zhu, M.; Xing, Z.P.; Dai, Q.G.; Huo, Z.Y.; Xu, K.; Wei, H.Y.; Guo, B.W.; Zhang, H.C. Characteristics of Nitrogen Uptake and Utilization of Mechanically-transplanted Pot-tray-nursed Rice Seedlings. Chin. J. Rice Sci. 2018, 32, 257–264. [Google Scholar]
- Lin, L.; Yang, J.; Jiao, J.M.; Li, M.C.; Gui, C.C. Phloem transport capacity of transgenic rice t1c-19 (cry1c*) under several potassium fertilizer levels. PLoS ONE 2018, 13, e0195058. [Google Scholar]
- Ntanos, D.A.; Koutroubas, S.D. Dry matter and N accumulation and translocation for indica and japonica rice under Mediterra-nean conditions. Field Crop. Res. 2002, 74, 93–101. [Google Scholar] [CrossRef]
- Ling, Q.H.; Zhang, H.C.; Dai, Q.G.; Ding, Y.F.; Ling, L.; Su, Z.F.; Xu, M.; Que, J.H.; Wang, S.H. Study on precise and quantitative N application in rice. Sci. Agric. Sin. 2005, 38, 2457–2467. [Google Scholar]
- Zhang, H.C.; Wu, G.C.; Wu, W.G.; Dai, Q.G.; Huo, Z.Y.; Xu, K.; Gao, H.; Wei, H.Y.; Huang, X.F.; Gong, J.L. The SOI model of quantitative cultivation of super-high yielding rice. Sci. Agric. Sin. 2010, 43, 2645–2660. [Google Scholar]
- Wei, H.Y.; Zhang, H.C.; Dai, Q.G.; Huo, Z.Y.; Xu, K.; Hang, J.; Ma, Q.; Zhang, S.F.; Zhang, Q.; Liu, Y.Y. Characteristics of matter production and accumulation in rice genotypes with different N use efficiency. Acta Agron. Sin. 2007, 33, 1802–1809. [Google Scholar]
- Sui, B.; Feng, X.M.; Tian, G.L.; Hu, X.Y.; Shen, Q.R.; Guo, S.W. Optimizing nitrogen supply increases rice yield and nitrogen use efficiency by regulating yield formation factors. Field Crop. Res. 2013, 150, 99–107. [Google Scholar] [CrossRef]
- Zhang, Y.F. Application and research of rice precise and quantitative cultivation technology. J. Jiangsu Agric. Sci. 2012, 40, 77–78. [Google Scholar]
- Meng, T.Y.; Wei, H.H.; Li, X.; Dai, Q.D.; Huo, Z.Y. A better root morpho-physiology after heading contributing to yield superiority of japonica/indica hybrid rice. Field Crop. Res. 2018, 228, 135–146. [Google Scholar] [CrossRef]
- Li, H.; Liu, L.; Wang, Z.; Yang, J.; Zhang, J. Agronomic and physiological performance of high-yielding wheat and rice in the lower reaches of Yangtze River of China. Field Crop. Res. 2012, 133, 119–129. [Google Scholar] [CrossRef]
- Yang, J.C.; Zhang, J.H. Grain filling of cereals under soil drying. New Phytol. 2006, 169, 223–236. [Google Scholar] [CrossRef]
- Li, C.; Wei, H.H.; Xu, J.W.; Wang, Z.J.; Xu, K.; Zhang, H.C.; Dai, Q.G.; Huo, Z.Y.; Wei, H.Y.; Guo, B.W. Characteristics of nitrogen uptake.; utilization and translocation in the indica-japonica hybrid rice of Yongyou series. Plant Nutr. Fertil. Sci. 2016, 22, 177–1186. [Google Scholar]
- Wei, H.Y.; Zhang, H.C.; Blumwald, E.; Li, H.L.; Cheng, J.C.; Dai, Q.G.; Huo, Z.Y.; Xu, K.; Guo, B.W. Different characteristics of high yield formation between inbred japonica super rice and inter-sub-specific hybrid super rice. Field Crop. Res. 2016, 198, 179–187. [Google Scholar] [CrossRef]

| Treatment | Basal N Fertilizer | TF | SPF | SDF | |||||
|---|---|---|---|---|---|---|---|---|---|
| Types of CRNF | CU | CU | CU | CU | |||||
| 40 Days | 60 Days | 80 Days | 100 Days | 120 Days | |||||
| A1 | 27 | 0 | 108 | 0 | 0 | 135 | 0 | 0 | 0 |
| A2 | 27 | 0 | 0 | 108 | 0 | 135 | 0 | 0 | 0 |
| A3 | 27 | 0 | 0 | 0 | 108 | 135 | 0 | 0 | 0 |
| B1 | 0 | 27 | 108 | 0 | 0 | 135 | 0 | 0 | 0 |
| B2 | 0 | 27 | 0 | 108 | 0 | 135 | 0 | 0 | 0 |
| B3 | 0 | 27 | 0 | 0 | 108 | 135 | 0 | 0 | 0 |
| CK | 0 | 0 | 0 | 0 | 0 | 94.5 | 94.5 | 40.5 | 40.5 |
| Cultivar | Treatment | Panicle Number | Spikelet Number per | Seed-Setting | 1000-Grain Weight | Grain Yield |
|---|---|---|---|---|---|---|
| (×104 ha−1) | Panicle | Rate (%) | (g) | (t ha−1) | ||
| 2018 | ||||||
| J58 | CK | 368.70 b | 123.09 b | 92.06 a | 26.15 b | 10.21 b |
| A1 | 360.90 d | 120.66 c | 91.16 b | 25.16 c | 9.53 d | |
| A2 | 370.05 b | 123.25 b | 92.01 a | 26.16 b | 10.29 b | |
| A3 | 342.75 e | 114.54 e | 92.08 a | 26.20 b | 9.16 f | |
| B1 | 365.85 c | 120.35 c | 91.21 b | 25.11 c | 9.68 c | |
| B2 | 378.00 a | 128.71 a | 92.27 a | 26.72 a | 10.96 a | |
| B3 | 345.60 d | 118.97 d | 92.02 a | 26.18 b | 9.31 e | |
| J67 | CK | 335.70 b | 135.20 b | 94.08 a | 25.17 a | 10.08 b |
| A1 | 325.50 cd | 128.87 d | 92.48 b | 24.76 b | 9.31 d | |
| A2 | 337.50 b | 135.68 b | 94.11 a | 25.09 a | 10.19 b | |
| A3 | 315.15 e | 123.30 e | 94.43 a | 25.65 a | 9.03 f | |
| B1 | 328.80 c | 130.22 c | 92.46 b | 24.86 b | 9.47 c | |
| B2 | 345.00 a | 140.31 a | 94.06 a | 25.15 a | 10.69 a | |
| B3 | 319.80 d | 125.48 e | 94.15 a | 25.33 a | 9.19 e | |
| 2019 | ||||||
| J58 | CK | 371.70 b | 128.09 b | 92.70 a | 26.28 a | 10.14 b |
| A1 | 358.95 d | 122.05 d | 91.34 b | 25.13 b | 9.43 d | |
| A2 | 373.50 b | 128.20 b | 92.18 a | 26.32 a | 10.23 b | |
| A3 | 345.45 f | 114.54 f | 92.17 a | 26.25 a | 9.13 f | |
| B1 | 361.95 c | 125.23 c | 91.12 b | 25.11 b | 9.59 c | |
| B2 | 376.80 a | 131.71 a | 92.27 a | 26.20 a | 10.89 a | |
| B3 | 347.70 e | 119.04 e | 92.48 a | 26.05 a | 9.25 e | |
| J67 | CK | 352.95 b | 136.00 b | 94.37 a | 25.32 a | 10.04 b |
| A1 | 343.50 c | 130.39 cd | 92.85 b | 24.76 b | 9.46 d | |
| A2 | 353.10 b | 135.88 b | 94.49 a | 25.31 a | 10.13 b | |
| A3 | 327.45 e | 126.17 e | 94.50 a | 25.51 a | 9.12 f | |
| B1 | 345.15 c | 133.95 c | 92.83 b | 25.09 b | 9.62 c | |
| B2 | 363.00 a | 141.01 a | 94.21 a | 25.40 a | 10.73 a | |
| B3 | 335.10 d | 128.61 d | 94.13 a | 25.14 a | 9.27 e | |
| Analysis of variance | ||||||
| Year (Y) | ns | ns | ns | ns | ns | |
| Treatment (T) | * | * | ns | ** | * | |
| Cultivar (C) | ns | ns | ns | ns | ns | |
| Y × C | * | ** | * | * | * | |
| Y × T | * | ns | ** | ns | ** | |
| T × C | ns | * | ns | * | * | |
| Y × T × C | * | * | * | * | ns | |
| Cultivar | Treatment | Sowing–Jointing | Jointing–Heading | Heading–Maturity | |||
|---|---|---|---|---|---|---|---|
| Biomass | Percentage | Biomass | Percentage | Biomass | Percentage | ||
| (t ha−1) | (%) | (t ha−1) | (%) | (t ha−1) | (%) | ||
| 2018 | |||||||
| J58 | CK | 3.55 d | 17.73 d | 8.29 b | 41.41 d | 8.18 b | 40.86 b |
| A1 | 3.80 a | 19.93 a | 7.80 e | 40.90 e | 7.47 d | 39.17 d | |
| A2 | 3.68 bc | 18.24 c | 8.30 b | 41.15 de | 8.19 b | 40.60 b | |
| A3 | 3.61 cd | 19.30 b | 8.01 c | 42.83 b | 7.08 f | 37.86 e | |
| B1 | 3.73 ab | 19.28 b | 7.91 d | 40.88 e | 7.71 c | 39.84 c | |
| B2 | 3.59 cd | 17.04 e | 8.82 a | 41.86 c | 8.66 a | 41.10 a | |
| B3 | 3.45 e | 18.16 c | 8.27 b | 43.53 a | 7.28 e | 38.32 f | |
| J67 | CK | 3.50 de | 17.71 e | 8.09 c | 40.94 c | 8.17 b | 41.35 b |
| A1 | 3.78 a | 20.29 a | 7.36 f | 39.51 e | 7.49 d | 40.20 d | |
| A2 | 3.65 bc | 18.27 d | 8.14 b | 40.74 d | 8.19 b | 40.99 c | |
| A3 | 3.52 d | 19.11 c | 7.89 e | 42.83 a | 7.01 f | 38.06 f | |
| B1 | 3.70 b | 19.53 b | 7.26 g | 38.31 f | 7.99 c | 42.16 a | |
| B2 | 3.60 c | 17.52 e | 8.46 a | 41.17 b | 8.49 a | 41.31 b | |
| B3 | 3.44 e | 18.34 d | 8.02 d | 42.75 a | 7.30 e | 38.91 e | |
| 2019 | |||||||
| J58 | CK | 3.65 bc | 18.35 cd | 7.98 c | 40.12 c | 8.26 b | 41.53 a |
| A1 | 3.82 a | 20.25 a | 7.46 e | 39.55 d | 7.58 d | 40.19 c | |
| A2 | 3.70 b | 18.45 c | 8.06 b | 40.20 c | 8.29 b | 41.35 ab | |
| A3 | 3.60 c | 19.32 b | 7.91 d | 42.46 a | 7.12 f | 38.22 | |
| B1 | 3.71 b | 19.35 b | 7.48 e | 39.02 e | 7.98 c | 41.63 a | |
| B2 | 3.60 c | 17.19 e | 8.75 a | 41.79 b | 8.59 a | 41.02 b | |
| B3 | 3.43 d | 18.19 d | 7.98 c | 42.31 a | 7.45 e | 39.50 d | |
| J67 | CK | 3.51 de | 17.84 e | 8.00 c | 40.65 c | 8.17 b | 41.51 a |
| A1 | 3.83 a | 20.24 a | 7.61 d | 40.22 c | 7.48 d | 39.53 c | |
| A2 | 3.66 c | 18.44 d | 8.01 c | 40.35 c | 8.18 b | 41.21 a | |
| A3 | 3.55 d | 19.08 c | 7.96 c | 42.77 a | 7.10 f | 38.15 e | |
| B1 | 3.74 b | 19.43 b | 7.66 d | 39.79 d | 7.85 c | 40.78 b | |
| B2 | 3.62 c | 17.54 f | 8.48 a | 41.09 b | 8.54 a | 41.38 a | |
| B3 | 3.46 e | 18.28 d | 8.13 b | 42.95 a | 7.34 e | 38.77 d | |
| Analysis of variance | |||||||
| Year (Y) | ns | ns | ns | ns | ns | ns | |
| Treatment (T) | * | * | * | * | * | * | |
| Cultivar (C) | ns | ** | ns | * | * | * | |
| Y × C | * | ns | * | ns | ns | ns | |
| Y × T | ns | * | ns | * | ns | ns | |
| T × C | * | * | * | * | * | * | |
| Y × T × C | ** | ns | * | ns | * | * | |
| Cultivar | Treatment | Jointing | Heading | Maturity | DRLA (LAI d−1) |
|---|---|---|---|---|---|
| 2018 | |||||
| J58 | CK | 3.45 f | 7.90 b | 2.89 b | 0.0808 cd |
| A1 | 3.78 a | 7.80 c | 2.32 f | 0.0884 a | |
| A2 | 3.68 c | 7.89 b | 2.88 b | 0.0808 cd | |
| A3 | 3.51 e | 7.63 e | 2.62 d | 0.0808 cd | |
| B1 | 3.72 b | 7.82 c | 2.49 e | 0.0860 b | |
| B2 | 3.56 d | 7.99 a | 2.99 a | 0.0806 d | |
| B3 | 3.39 g | 7.72 d | 2.69 c | 0.0811 c | |
| J67 | CK | 3.54 e | 7.84 b | 2.80 b | 0.0826 b |
| A1 | 3.76 a | 7.71 d | 2.31 f | 0.0885 a | |
| A2 | 3.65 c | 7.83 b | 2.79 b | 0.0826 b | |
| A3 | 3.60 d | 7.60 f | 2.60 d | 0.0820 bc | |
| B1 | 3.71 b | 7.76 c | 2.37 e | 0.0884 a | |
| B2 | 3.58 d | 7.94 a | 2.93 a | 0.0821 bc | |
| B3 | 3.46 f | 7.65 e | 2.67 c | 0.0816 c | |
| 2019 | |||||
| J58 | CK | 3.51 d | 7.88 b | 2.83 b | 0.0815 b |
| A1 | 3.77 a | 7.68 d | 2.36 f | 0.0858 a | |
| A2 | 3.69 b | 7.87 b | 2.84 b | 0.0811 b | |
| A3 | 3.65 c | 7.50 e | 2.62 d | 0.0787 c | |
| B1 | 3.72 b | 7.78 c | 2.44 e | 0.0861 a | |
| B2 | 3.54 d | 7.98 a | 2.95 a | 0.0811 b | |
| B3 | 3.35 e | 7.54 e | 2.73 c | 0.0776 d | |
| J67 | CK | 3.53 e | 7.85 b | 2.83 b | 0.0823 b |
| A1 | 3.84 a | 7.67 c | 2.31 f | 0.0879 a | |
| A2 | 3.70 c | 7.87 b | 2.82 b | 0.0828 b | |
| A3 | 3.60 d | 7.54 d | 2.65 d | 0.0802 c | |
| B1 | 3.75 b | 7.73 c | 2.36 e | 0.0880 a | |
| B2 | 3.59 d | 7.97 a | 2.94 a | 0.0825 b | |
| B3 | 3.45 f | 7.60 d | 2.71 c | 0.0802 c | |
| Analysis of variance | |||||
| Year (Y) | ns | ns | ns | ns | |
| Treatment (T) | * | * | * | ns | |
| Cultivar (C) | ns | * | ns | * | |
| Y × C | ns | ns | * | * | |
| Y × T | * | * | ns | ns | |
| T × C | * | * | * | * | |
| Y × T × C | ns | * | * | * | |
| Cultivar | Treatment | Crop Growth Rate (g·m−2·d−1) | Photosynthetic Potential (×104·m2·d·hm−2) | ||||
|---|---|---|---|---|---|---|---|
| Sowing–Jointing | Jointing–Heading | Heading–Maturity | Sowing–Jointing | Jointing–Heading | Heading–Maturity | ||
| 2018 | |||||||
| J58 | CK | 5.63 e | 25.91 b | 13.20 b | 108.68 f | 181.60 b | 334.49 b |
| A1 | 6.03 a | 24.37 d | 12.04 d | 119.07 a | 185.28 a | 313.72 e | |
| A2 | 5.84 c | 25.95 b | 13.20 b | 115.92 c | 185.12 a | 333.87 b | |
| A3 | 5.73 d | 25.03 c | 11.41 f | 110.57 e | 178.24 c | 317.75 d | |
| B1 | 5.92 b | 24.71 c | 12.44 c | 117.18 b | 184.64 a | 319.61 d | |
| B2 | 5.70 d | 27.55 a | 13.97 a | 112.14 d | 184.80 a | 340.38 a | |
| B3 | 5.48 f | 25.85 b | 11.74 e | 106.79 g | 177.76 c | 322.71 c | |
| J67 | CK | 5.47 e | 24.51 bc | 13.40 b | 113.28 c | 187.77 b | 324.52 b |
| A1 | 5.90 a | 22.30 e | 12.27 d | 120.32 a | 189.26 ab | 305.61 e | |
| A2 | 5.70 c | 24.67 b | 13.43 b | 116.80 b | 189.42 ab | 323.91 b | |
| A3 | 5.50 e | 23.91 d | 11.49 f | 115.20 b c | 184.80 c | 311.10 d | |
| B1 | 5.78 b | 21.99 f | 13.09 c | 118.72 a | 189.26 ab | 308.97 d | |
| B2 | 5.63 d | 25.63 a | 13.92 a | 114.56 c | 190.08 a | 331.54 a | |
| B3 | 5.38 f | 24.30 e | 11.96 e | 110.72 d | 183.32 c | 314.76 c | |
| 2019 | |||||||
| J58 | CK | 5.70 c | 24.93 c | 13.32 b | 112.32 d | 182.24 c | 332.01 b |
| A1 | 5.97 a | 23.32 e | 12.23 d | 120.64 a | 183.20 bc | 311.24 e | |
| A2 | 5.78 b | 25.19 b | 13.36 b | 118.08 b | 184.96 a | 332.01 b | |
| A3 | 5.63 d | 24.71 d | 11.49 f | 116.80 c | 178.40 d | 313.72 de | |
| B1 | 5.80 b | 23.38 e | 12.87 c | 119.04 b | 184.00 ab | 316.82 cd | |
| B2 | 5.63 d | 27.36 a | 13.86 a | 113.28 d | 184.32 ab | 338.83 a | |
| B3 | 5.36 e | 24.95 c | 12.02 e | 107.20 e | 174.24 e | 318.37 c | |
| J67 | CK | 5.40 de | 24.24 c | 13.40 b | 114.73 e | 187.77 b | 325.74 b |
| A1 | 5.89 a | 23.07 f | 12.26 d | 124.80 a | 189.92 a | 304.39 f | |
| A2 | 5.64 c | 24.28 c | 13.41 b | 120.25 c | 190.91 a | 326.05 b | |
| A3 | 5.46 d | 24.12 d | 11.64 f | 117.00 d | 183.81 c | 310.80 d | |
| B1 | 5.75 b | 23.21 e | 12.87 c | 121.88 b | 189.42 ab | 307.75 e | |
| B2 | 5.57 c | 25.68 a | 14.00 a | 116.68 d | 190.74 a | 332.76 a | |
| B3 | 5.33 e | 24.64 b | 12.02 e | 112.13 f | 182.33 c | 314.46 c | |
| Analysis of variance | |||||||
| Year (Y) | ns | ns | ns | ns | ns | ns | |
| Treatment (T) | * | * | * | * | * | * | |
| Cultivar (C) | ns | ns | * | ns | ns | * | |
| Y × C | ns | * | ns | ns | ns | * | |
| Y × T | * | * | * | * | * | ns | |
| T × C | ns | ns | ns | ns | ns | ns | |
| Y × T × C | * | * | ** | * | * | * | |
| Cultivar | Treatment | Total N | Sowing to Jointing | Jointing to Heading | Heading to Maturity | |||
|---|---|---|---|---|---|---|---|---|
| Accumulation | Accumulation | Percentage | Accumulation | Percentage | Accumulation | Percentage | ||
| (kg/hm2) | (t/hm2) | (%) | (t/hm2) | (%) | (t/hm2) | (%) | ||
| 2018 | ||||||||
| J58 | CK | 189.55 b | 70.54 d | 37.21 e | 83.85 c | 44.24 c | 35.16 b | 18.55 a |
| A1 | 175.52 d | 75.71 a | 43.13 a | 75.53 e | 43.03 d | 24.28 f | 13.83 c | |
| A2 | 190.75 b | 72.99 b | 38.26 d | 82.55 d | 43.28 d | 35.21 b | 18.46 a | |
| A3 | 163.46 f | 69.40 e | 42.46 b | 65.78 g | 40.24 e | 28.28 d | 17.30 b | |
| B1 | 181.79 c | 71.67 c | 39.43 c | 85.09 b | 46.81 b | 25.03 e | 13.77 c | |
| B2 | 200.46 a | 68.52 f | 34.18 f | 95.05 a | 47.42 a | 36.89 a | 18.40 a | |
| B3 | 170.62 e | 65.14 g | 38.18 d | 74.76 f | 43.82 c | 30.72 c | 18.00 a | |
| J67 | CK | 187.76 b | 70.82 d | 37.72 f | 83.39 b | 44.41 c | 33.55 c | 17.87 d |
| A1 | 172.56 a | 74.86 a | 43.38 b | 74.40 e | 43.12 e | 23.30 g | 13.50 g | |
| A2 | 188.80 b | 72.07 c | 38.17 e | 82.25 c | 43.56 d | 34.48 b | 18.26 b | |
| A3 | 161.15 f | 70.47 de | 43.73 a | 62.48 g | 38.77 g | 28.20 e | 17.50 e | |
| B1 | 180.06 c | 72.91 b | 40.49 c | 81.12 d | 45.05 b | 26.03 f | 14.46 f | |
| B2 | 198.45 a | 69.88 e | 35.21 g | 92.61 a | 46.67 a | 35.96 a | 18.12 c | |
| B3 | 165.33 e | 64.42 f | 38.96 d | 69.60 f | 42.10 f | 31.31 d | 18.94 a | |
| 2019 | ||||||||
| J58 | CK | 188.95 b | 70.33 d | 37.22 f | 88.44 b | 46.81 b | 30.18 c | 15.97 d |
| A1 | 175.44 d | 75.56 a | 43.07 a | 77.17 e | 43.99 e | 22.71 g | 12.94 f | |
| A2 | 189.69 b | 72.63 c | 38.29 e | 84.98 c | 44.80 d | 32.08 b | 16.91 c | |
| A3 | 165.57 f | 69.10 e | 41.73 d | 70.07 g | 42.32 f | 26.40 e | 15.94 d | |
| B1 | 181.45 c | 73.50 b | 40.51 c | 83.01 d | 45.75 c | 24.94 f | 13.74 e | |
| B2 | 202.22 a | 70.24 d | 34.73 g | 97.25 a | 48.09 a | 34.73 a | 17.17 b | |
| B3 | 170.80 e | 66.79 f | 39.10 d | 76.19 f | 44.61 d | 27.82 d | 16.29 a | |
| J67 | CK | 187.76 b | 70.73 d | 37.67 f | 83.86 b | 44.66 b | 33.17 b | 17.67 d |
| A1 | 171.74 d | 74.34 a | 43.29 a | 72.92 e | 42.46 e | 24.48 f | 14.25 g | |
| A2 | 186.35 b | 71.34 c | 38.28 e | 81.62 c | 43.80 c | 33.39 b | 17.92 c | |
| A3 | 161.33 f | 65.12 f | 40.36 c | 67.93 g | 42.11 e | 28.28 d | 17.53 e | |
| B1 | 180.99 c | 73.79 b | 40.77 b | 80.26 d | 44.34 b | 26.94 e | 14.88 f | |
| B2 | 198.40 a | 69.63 e | 35.10 g | 92.86 a | 46.80 a | 35.91 a | 18.10 b | |
| B3 | 166.68 e | 64.22 ge | 38.53 d | 72.05 f | 43.23 d | 30.41 c | 18.24 a | |
| Analysis of variance | ||||||||
| Year (Y) | ns | ns | ns | * | ns | ns | ns | |
| Treatment (T) | * | * | * | ns | * | * | ns | |
| Cultivar (C) | ns | ns | ns | * | ns | * | * | |
| Y × C | ** | * | * | * | ns | ns | ns | |
| Y × T | * | * | * | ns | * | * | * | |
| T × C | ns | ns | ** | ns | * | * | * | |
| Y × T × C | * | * | ns | * | * | ns | * | |
| Cultivar | Treatment | Nitrogen Accumulation (kg/hm2) | NAPH | |||||
|---|---|---|---|---|---|---|---|---|
| Heading | Maturity | |||||||
| Stem | Leaf | Panicle | Stem | Leaf | Panicle | (kg ha−1) | ||
| 2018 | ||||||||
| J58 | CK | 56.05 b | 82.08 b | 16.26 c | 35.86 a | 48.18 c | 105.50 b | 89.24 b |
| A1 | 58.23 a | 78.50 c | 14.51 d | 33.40 c | 40.09 e | 102.03 c | 87.52 c | |
| A2 | 56.45 b | 82.84 b | 16.25 c | 35.18 b | 49.37 b | 106.20 b | 89.95 b | |
| A3 | 50.75 d | 72.40 e | 12.03 f | 30.85 d | 37.35 f | 95.26 e | 83.23 e | |
| B1 | 58.27 a | 79.02 c | 19.47 a | 33.73 c | 43.29 d | 104.77 b | 85.30 d | |
| B2 | 57.68 a | 89.14 a | 16.75 b | 36.43 a | 51.74 a | 112.29 a | 95.54 a | |
| B3 | 52.94 c | 74.19 d | 12.77 e | 31.09 d | 39.95 e | 99.58 d | 86.81 c | |
| J67 | CK | 57.09 c | 84.83 b | 12.29 c | 35.53 b | 44.06 c | 108.17 b | 95.88 b |
| A1 | 57.81 b | 78.29 c | 13.16 b | 33.54 c | 36.85 f | 102.17 d | 89.01 c | |
| A2 | 55.83 d | 86.06 b | 12.43 c | 35.90 ab | 45.05 b | 107.85 b | 95.42 b | |
| A3 | 51.55 e | 70.90 d | 10.50 e | 31.03 d | 34.07 g | 96.05 e | 85.55 d | |
| B1 | 60.85 a | 78.87 c | 14.31 a | 33.43 c | 42.80 d | 103.83 c | 89.52 c | |
| B2 | 57.54 bc | 90.66 a | 14.29 a | 36.26 a | 46.33 a | 115.86 a | 101.57 a | |
| B3 | 51.83 e | 71.20 d | 10.99 d | 30.92 d | 37.68 e | 96.73 e | 85.74 d | |
| 2019 | ||||||||
| J58 | CK | 57.19 a | 83.28 c | 18.30 b | 35.68 ab | 46.16 c | 107.11 b | 88.81 b |
| A1 | 56.04 b | 79.92 d | 16.77 d | 32.44 d | 40.54 e | 102.46 d | 85.69 e | |
| A2 | 55.39 bc | 84.93 b | 17.29 c | 35.98 ab | 47.43 b | 106.28 b | 88.99 b | |
| A3 | 52.60 d | 77.05 e | 9.52f | 31.93 d | 39.38 f | 94.26 f | 84.74 f | |
| B1 | 58.02 a | 79.99 d | 18.50 b | 35.36 b | 41.47 d | 104.62 c | 86.12 d | |
| B2 | 57.95 a | 89.95 a | 19.59 a | 36.39 a | 49.92 a | 115.91 a | 96.32 a | |
| B3 | 54.97 c | 77.90 e | 10.11 e | 33.98 c | 39.03 f | 97.79 e | 87.68 c | |
| J67 | CK | 57.14 b | 83.86 c | 13.59 c | 35.42 b | 44.39 b | 107.95 b | 94.36 c |
| A1 | 56.59 b | 79.21 d | 11.46 e | 34.09 c | 35.41 e | 102.24 d | 90.78 d | |
| A2 | 55.08 c | 85.87 b | 12.01 d | 36.80 a | 41.46 c | 108.09 b | 96.08 b | |
| A3 | 51.10 d | 72.22 f | 9.73 f | 33.94 c | 33.87 f | 93.52 f | 83.79 g | |
| B1 | 58.28 a | 79.69 d | 16.08 a | 36.94 a | 38.24 d | 105.81 c | 89.73 e | |
| B2 | 57.05 b | 89.64 a | 15.80 b | 37.12 a | 46.20 a | 115.08 a | 99.28 a | |
| B3 | 52.01 d | 74.34 e | 9.92 f | 35.82 b | 34.13 f | 96.73 e | 86.81 f | |
| Analysis of variance | ||||||||
| Year (Y) | ns | * | ** | ns | ns | * | * | |
| Treatment (T) | * | * | ns | * | * | ns | * | |
| Cultivar (C) | ns | ns | * | ns | ns | * | ns | |
| Y × C | * | ** | * | * | ns | * | ** | |
| Y × T | * | ** | * | ns | ns | ns | ** | |
| T × C | ns | * | ns | ** | * | * | * | |
| Y × T × C | ** | * | * | * | * | ** | ns | |
| Cultivar | Treatment | RNUE (%) | INUE (kg Grain kg−1) | PNUE (kg kg−1) | ANUE |
|---|---|---|---|---|---|
| 2018 | |||||
| J58 | CK | 40.70 c | 53.88 cd | 39.51 bc | 16.08 c |
| A1 | 35.51 e | 54.31 bc | 38.19 d | 13.56 e | |
| A2 | 41.15 b | 53.93 bcd | 39.75 b | 16.36 b | |
| A3 | 31.04 g | 56.05 a | 39.27 c | 12.19 g | |
| B1 | 37.83 d | 53.22 d | 37.25 f | 14.09 d | |
| B2 | 44.74 a | 54.66 b | 42.11 a | 18.84 a | |
| B3 | 33.69 f | 54.57 b c | 37.83 c | 12.74 f | |
| J67 | CK | 39.04 b | 53.69 b | 41.76 c | 16.30 c |
| A1 | 33.41 d | 53.97 b | 40.29 d | 13.46 e | |
| A2 | 39.43 b | 53.98 b | 42.40 b | 16.72 b | |
| A3 | 29.19 f | 56.01 a | 42.49 b | 12.40 g | |
| B1 | 36.19 c | 52.61 c | 38.84 e | 14.06 d | |
| B2 | 43.00 a | 53.86 b | 43.16 a | 18.56 a | |
| B3 | 30.73 e | 55.60 a | 42.34 b | 13.01 f | |
| 2019 | |||||
| J58 | CK | 40.22 b | 53.67 b | 39.55 c | 15.91 c |
| A1 | 35.22 d | 53.77 b | 37.74 e | 13.29 e | |
| A2 | 40.50 b | 53.90 b | 40.06 b | 16.22 b | |
| A3 | 31.56 f | 55.14 a | 38.55 d | 12.17 g | |
| B1 | 37.44 c | 52.84 c | 37.02 f | 13.86 d | |
| B2 | 45.14 a | 53.88 b | 41.44 a | 18.70 a | |
| B3 | 33.50 e | 54.13 b | 37.60 e | 12.60 f | |
| J67 | CK | 39.30 b | 53.47 d | 41.51 c | 16.31 c |
| A1 | 33.37 e | 55.10 b | 42.49 b | 14.18 e | |
| A2 | 38.78 c | 54.34 c | 42.90 b | 16.64 b | |
| A3 | 29.51 g | 56.51 a | 43.70 a | 12.90 g | |
| B1 | 36.79 d | 53.17 d | 40.15 d | 14.77 d | |
| B2 | 43.24 a | 54.09 c | 43.65 a | 18.88 a | |
| B3 | 31.49 f | 55.65 b | 42.81 b | 13.48 f | |
| Analysis of variance | |||||
| Year (Y) | Ns | ** | ns | * | |
| Treatment (T) | * | ns | * | * | |
| Cultivar (C) | ns | * | ns | ns | |
| Y × C | * | ** | * | * | |
| Y × T | * | ns | * | * | |
| T × C | ns | * | ns | * | |
| Y × T × C | * | ** | * | * | |
Publisher’s Note: MDPI stays neutral with regard to jurisdictional claims in published maps and institutional affiliations. |
© 2021 by the authors. Licensee MDPI, Basel, Switzerland. This article is an open access article distributed under the terms and conditions of the Creative Commons Attribution (CC BY) license (https://creativecommons.org/licenses/by/4.0/).
Share and Cite
Xu, D.; Zhu, Y.; Zhu, H.; Hu, Q.; Liu, G.; Wei, H.; Zhang, H. Effects of a One-Time Application of Controlled-Release Nitrogen Fertilizer on Yield and Nitrogen Accumulation and Utilization of Late Japonica Rice in China. Agriculture 2021, 11, 1041. https://doi.org/10.3390/agriculture11111041
Xu D, Zhu Y, Zhu H, Hu Q, Liu G, Wei H, Zhang H. Effects of a One-Time Application of Controlled-Release Nitrogen Fertilizer on Yield and Nitrogen Accumulation and Utilization of Late Japonica Rice in China. Agriculture. 2021; 11(11):1041. https://doi.org/10.3390/agriculture11111041
Chicago/Turabian StyleXu, Dong, Ying Zhu, Haibin Zhu, Qun Hu, Guodong Liu, Haiyan Wei, and Hongcheng Zhang. 2021. "Effects of a One-Time Application of Controlled-Release Nitrogen Fertilizer on Yield and Nitrogen Accumulation and Utilization of Late Japonica Rice in China" Agriculture 11, no. 11: 1041. https://doi.org/10.3390/agriculture11111041
APA StyleXu, D., Zhu, Y., Zhu, H., Hu, Q., Liu, G., Wei, H., & Zhang, H. (2021). Effects of a One-Time Application of Controlled-Release Nitrogen Fertilizer on Yield and Nitrogen Accumulation and Utilization of Late Japonica Rice in China. Agriculture, 11(11), 1041. https://doi.org/10.3390/agriculture11111041