Article

Incidence of Escherichia coli in Vegetable Crops and Soil Profile Drip Irrigated with Primarily Treated Municipal Wastewater in a Semi-Arid Peri Urban Area

1
Hydrology and Engineering Division, ICAR-Indian Institute of Soil and Water Conservation, Dehradun 248195, India
2
Department of Agricultural Engineering, Indian Agricultural Research Institute, ICAR, New Delhi 110012, India
3
United Nations University Institute for Integrated Management of Material Fluxes and of Resources (UNU-FLORES), United Nations University, Ammonstraße 74, 01067 Dresden, Germany
4
Department of Biochemistry, Hemvati Nandan Bahuguna Garhwal University (A Central University), Srinagar 246174, India
5
Water Resources Systems Division, National Institute of Hydrology, Roorkee 247667, India
*
Author to whom correspondence should be addressed.
Agriculture 2020, 10(7), 291; https://doi.org/10.3390/agriculture10070291
Submission received: 23 June 2020 / Revised: 8 July 2020 / Accepted: 9 July 2020 / Published: 13 July 2020

Abstract

:
This study investigates the incidence of Escherichia coli in cauliflower, bitter gourd and soil profile drip-irrigated with municipal wastewater in a semi-arid peri-urban area in India. There were four treatments: drip irrigation with primarily treated municipal wastewater through inline (non-pressure compensating) surface drip (T1), inline subsurface drip (T2), bioline (pressure compensating) subsurface drip (T3) and bioline surface drip (T4). Results revealed that T1 had the highest concentration of E.coli (35 ± 2.66 and 25 ± 2.26 colony forming unit (CFU) g˗1) and T3 had the lowest concentration of E. coli (29 ± 2.29 and 18.9 ± 2.04 CFU g˗1) for cauliflower and bitter gourd, respectively. In bitter gourd top fruits (1 m above the ground level), the E. coli count was significantly lower (p < 0.05) than in the surface level fruits. There was also a considerable reduction of E. coli counts in bioline drip lateral as compared to the inline drip. A higher concentration of E. coli (470 ± 70.5 and 410 ± 36.9 CFU g˗1 soil) was also found in the top soil (0–0.15 m) in T1 treatment, while the minimum (154 ± 13.86 and 95 ± 14.25 CFU g˗1) was observed in T3. Hence, bioline drip lateral may be a better option for wastewater irrigation as compared to inline drip to reduce microbial contamination of crop and soil.

Graphical Abstract

1. Introduction

Substantial attention is being given to the microbial quality of irrigation water because of the increased incidence of gastrointestinal illness caused by contaminated agricultural produce [1]. Various scientific guidelines and standards have been suggested for microbial water quality to minimize the risks associated with irrigation waters [2,3,4,5,6,7]. In developing countries, the presence of pathogens is of primary concern for the wastewater irrigation [8] and has long been considered as a source of risk in the reuse of the effluent water [9]. The urban and semi-urban areas, particularly those lying along the courses of urban drainage systems in the developing countries [10], are becoming main hubs of vegetable production and low-quality water; e.g., treated/untreated municipal wastewater or surface water runoff is being gradually used for irrigation [11]. Studies have revealed that irrigation water can be a significant source of pathogens during the growing season [7,12,13,14,15]. In India, during 2015, the sewage generation was estimated to be 61,754 million litres per day (MLD) as compared to the developed sewage treatment capacity of 22,963 MLD. Because of this gap in sewage treatment capacity, about 38,791 MLD of untreated sewage (62% of the total sewage) is discharged directly into nearby water bodies [16]. This colossal quantity of wastewater allows its use in irrigation but with increased degree of microbial contamination. Wastewater and its nutrient content can be extensively used for irrigation and other ecosystem services. Its reuse can bring benefits to the farming community, society and municipalities. However, the wastewater reuse also generates negative effects on humans and ecological systems, which need to be given attention [17]. Using municipal wastewater for irrigation is considered an environmentally sound wastewater disposal practice that contributes to minimizing the pollution of the ecosystem subjected to contamination by direct disposal of wastewater into surface or groundwater [18,19]. Besides, wastewater is also a valuable source for plant nutrients and organic matter required to maintain the fertility and productivity of arid soils. Nevertheless, the reuse of wastewater for irrigation is likely to cause environmental problems if not appropriately treated and managed [20,21].
Estimates on wastewater use worldwide indicate that about 20 million hectares of agricultural land are irrigated with (treated and untreated) wastewater [22]. Wastewater has been applied widely to crops, forests, rangelands, parks and golf courses in many parts of the world [23,24,25,26,27]. For this purpose, the drip irrigation systems can be one of the best methods as compared to the flooding and furrow irrigation methods. Ayers and Westcot [28] found that wastewater can be safely applied with drip irrigation systems. However, at the same time, the emitter clogging is also one of the major problems faced by the farmers during applications. This aspect has been thoroughly studied by various researchers worldwide [29,30,31,32,33,34,35,36]. Tripathi et al. [37] found that clogging cannot be avoided completely but filtering can prevent inorganic particles and organic materials suspended in water from entering the drip irrigation system. Most of the studies reported so far in scientific literature use inline (non-pressure compensating) emitter laterals for application of wastewater using a drip irrigation system and it is largely viewed as a common problem for clogging. Here, in this study, we used bioline (pressure compensating) emitter laterals for wastewater application using drip irrigation systems. Bioline is a low volume dripper line designed for on-site wastewater use. Inside the tubing, it has integral and evenly-spaced pressure compensating drippers with a diaphragm, which allow water to flow at a constant rate and thus prevent emitter clogging [38].
Mostly untreated municipal wastewater is frequently used by the farmers for growing vegetables in the outskirt of cities in India [37]. Given the problem of emitters clogging and the subsequent drip irrigation system failure due to wastewater applications, we felt that the efficacy of the bioline emitter laterals should be adjudged for applications of municipal wastewater and the resulting microbial concentration in agricultural produce. As the measurement of actual pathogen levels is expensive and laborious, the enteric bacterium Escherichia coli (E. coli) is frequently used as an indicator to evaluate health risks related to water [39]. However, little data on microbial quality of different vegetable crops is available which necessitates more specific studies to understand the microbial risks [40]. While vegetables are essential elements of the human dietary system around the world, their quality concern is very much important for the human health [41], and this calls for research efforts to assess the levels of microbial contamination in vegetables and fruits irrigated with municipal wastewater.
This study was conducted to investigate the microbial quality of two vegetable crops (cauliflower and bitter gourd) and that of the soil profile drip-irrigated with primarily treated municipal wastewater (PMW) using inline (non-pressure compensating) and bioline (pressure compensating) emitter laterals with the following objectives: (i) to investigate the microbial quality of two vegetable crops (cauliflower and bitter gourd) and soil profile drip-irrigated with PMW using Escherichia coli (E. coli) as an indicator, and (ii) to test the relative efficacy of inline and bioline surface and sub-surface laterals for application of PMW.

2. Materials and Methods

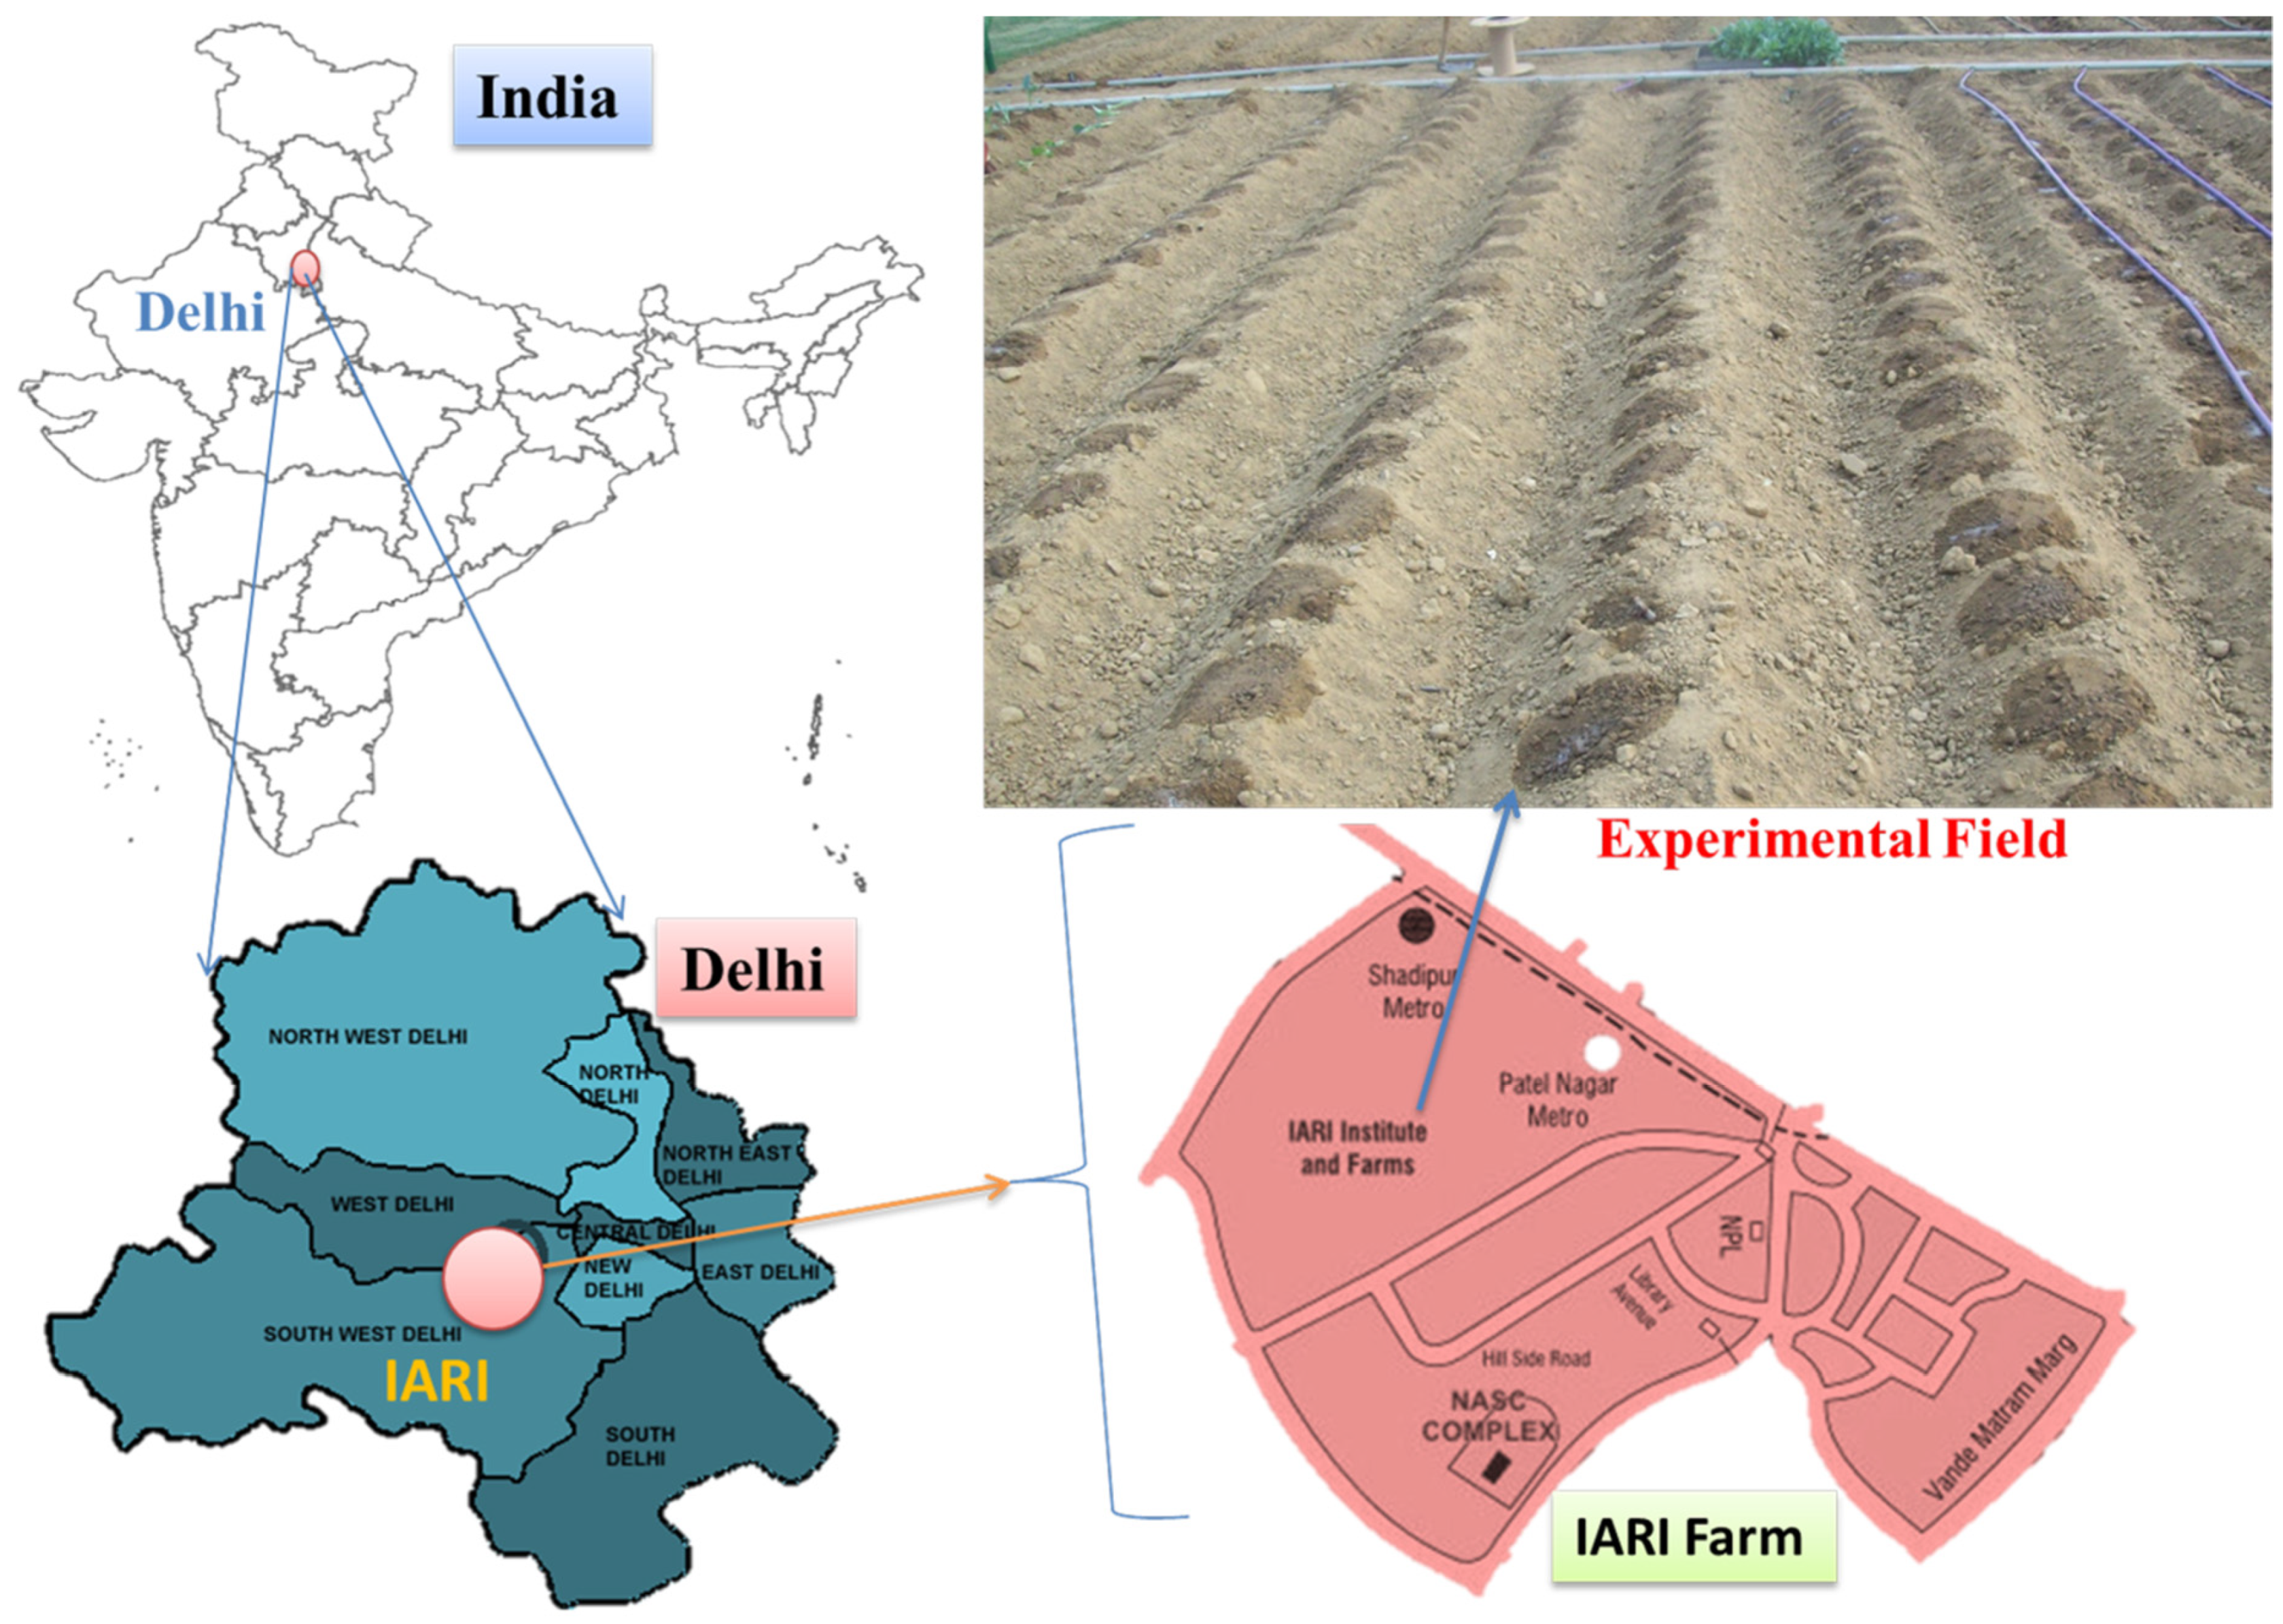
2.1. Location of Experimental Field

The study was conducted in 2010–2011 at the Precision Farming Development Centre (PFDC), Water Technology Centre (WTC), Indian Agricultural Research Institute (IARI), Pusa, New Delhi, India, which is located at 28°37'22" N and 77°8'45" E longitude covering an area of about 475 ha at on average elevation of 230 m above mean sea level. A location map of the experimental site is shown in Figure 1.

2.2. Climatic Condition

The climate of the study area is semi-arid and characterized by a hot summer and cold winter. The temperature of the study area varies from 7.6 °C to 45.2 °C with an average annual temperature of 24 °C. The mean annual rainfall based on a 100 year record is 790 mm. About 80% of the annual rainfall is received during the monsoon (June–September).

2.3. Soil Properties

Soil samples were collected up to a depth of 0.45 m in 0.15 m intervals. The hydrometer method was followed to determine the sand, silt and clay percentages of soil [42]. The soil of the experimental area was deep and well-drained with a sandy loam texture (United State Department of Agriculture) comprising mean values of 64.53 % sand, 15.13 % silt and 21.37 % clay (Table 1). The average value of the bulk density of soil was 1.56 g cm˗3 and the average value of saturated hydraulic conductivity was 1.06 cm h˗1.
Soil fertility status is presented in Table 2. The pH values of soil range from 8.24 to 8.46 with an average of 8.36. As per soil reaction classification given by Brandy [43], the soil of the experimental field was moderately alkaline. Soil electrical conductivity (EC) varied from 0.19 to 0.24 deci Semiens per metre (dS m˗1) with an average value of 0.21 dS m−1. As per the salt problem classification given by Muhr 1965 [44], based on EC values, the soil of the experimental field was classified as normal. As per nutrient availability classification for available nitrogen, the upper depth (0–0.3 m) of soil fell within the medium category while the lower depth (> 0.3 m) was in a low category [45]. In the case of phosphorous and potassium availability in the soil of the experimental field, it was medium as per the limit suggested by Muhr 1965 [44].

2.4. Nursery Raising, Transplanting and Harvesting

Seeds of the Cauliflower: Brassica oleracea var. botrytis (cultivar: Indame 9803) and bitter gourd—Momordica charantia (cultivar: Indame-49) were treated with Bavistin fungicide (manufactured by Biostadt India Limited, Mumbai, India) at 2 g kg˗1 of seed. Cauliflower seeds were sown in the first week of October during 2010 while bitter gourd seeds were sown in the mid of March during 2011. A hand sprayer was used to provide frequent irrigation to the germinated seedling in the nursery. During the germination stage of seedling in the nursery, no wastewater was used. Twenty-five-day-old seedlings were transplanted and the distances between plants and rows were 0.4 and 0.6 m, respectively. Harvesting of the cauliflower crop was done in February 2011 and bitter gourd in July 2011.

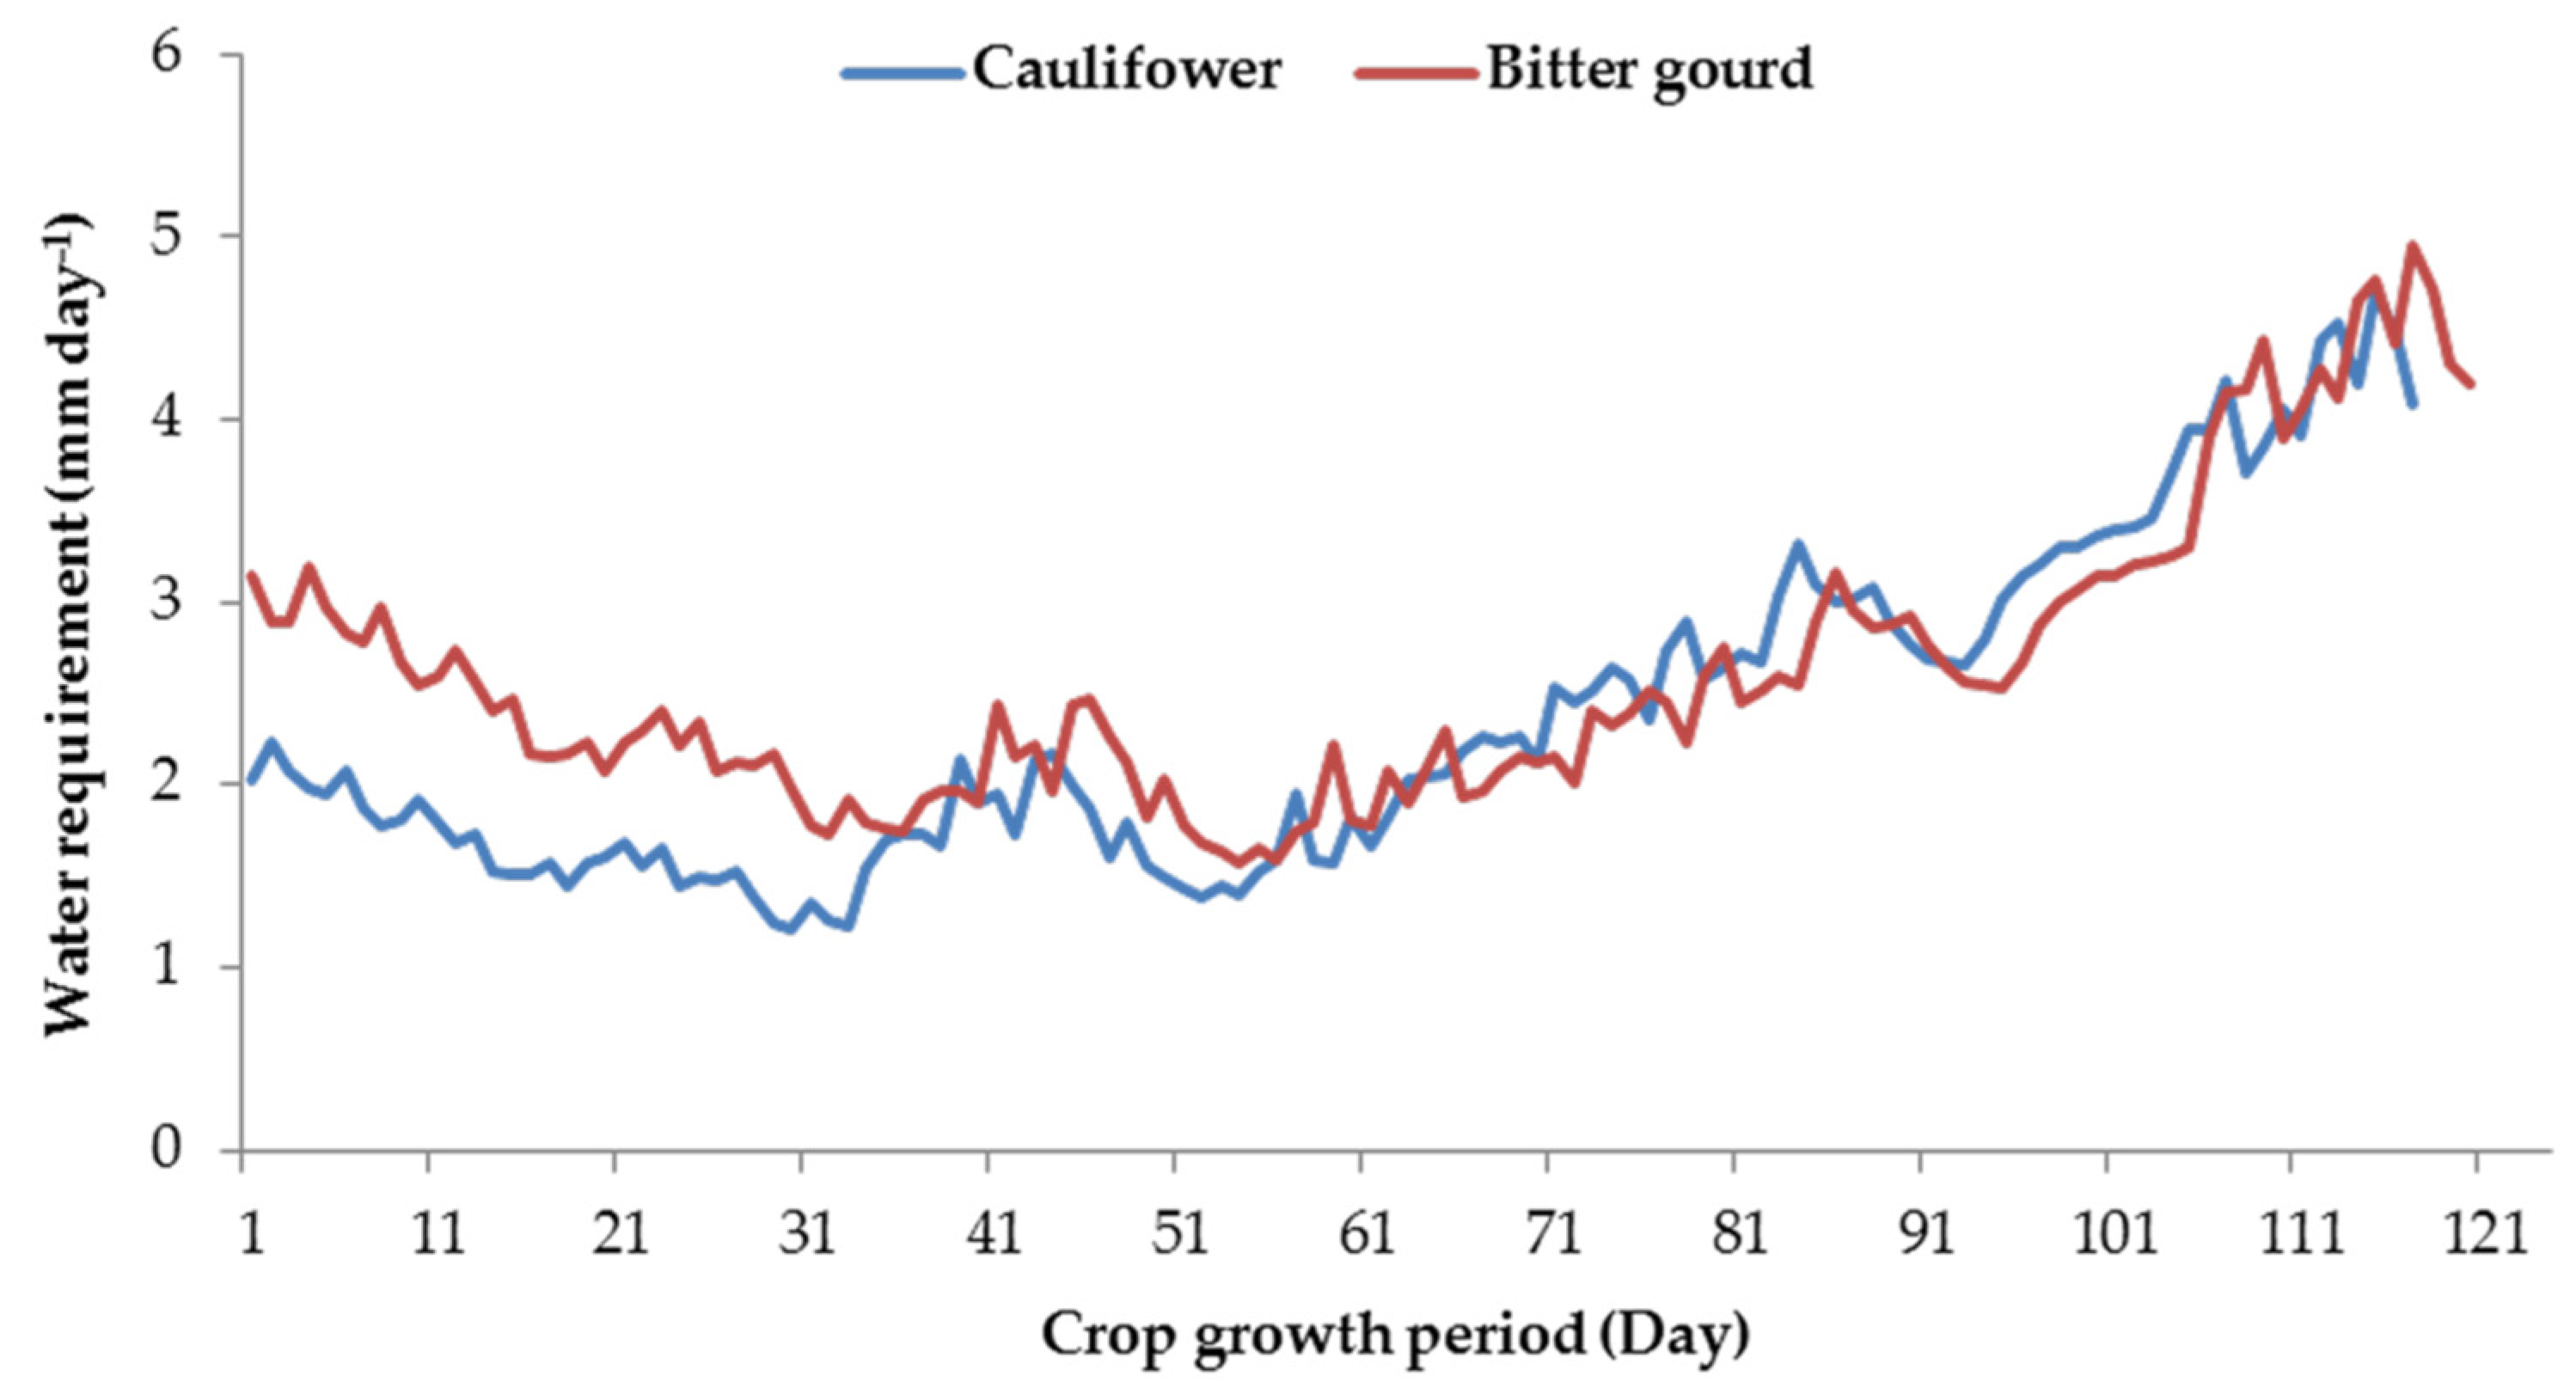
2.5. Crop Water Requirement

Water requirements of both the crops (cauliflower and bitter gourd) were estimated using Panman–Monteith’s semi-empirical formula [46]. Weather data were collected from a nearby (40 m) automatic weather station. The actual evapotranspiration was estimated by multiplying reference evapotranspiration with crop coefficient for different months based on crop growth stages. The cauliflower was a 120 days crop and was divided into four growth stages, namely, initial: 35 days, development stage: 30 days, mid-season stage: 40 days and late-season stage: 15 days. The crop coefficients of 0.7, 0.88, 1.05 and 0.95 at initial, development, curd formation and curd maturity stages, respectively, were adopted during the crop season [47]. The same procedure was also followed for bitter gourd crop to calculate the water requirement. The value of the crop coefficient for bitter gourd crop was assumed to be 0.9 during the experimental trial. The irrigation rate was adjusted considering the rainfall during the crop period. The irrigation efficiency of the drip system was assumed to be 90%. The total amounts of crop evapotranspiration were estimated to be 374 mm and 426 mm for cauliflower and bitter gourd, respectively. The estimated daily water requirements of both crops are shown in Figure 2.

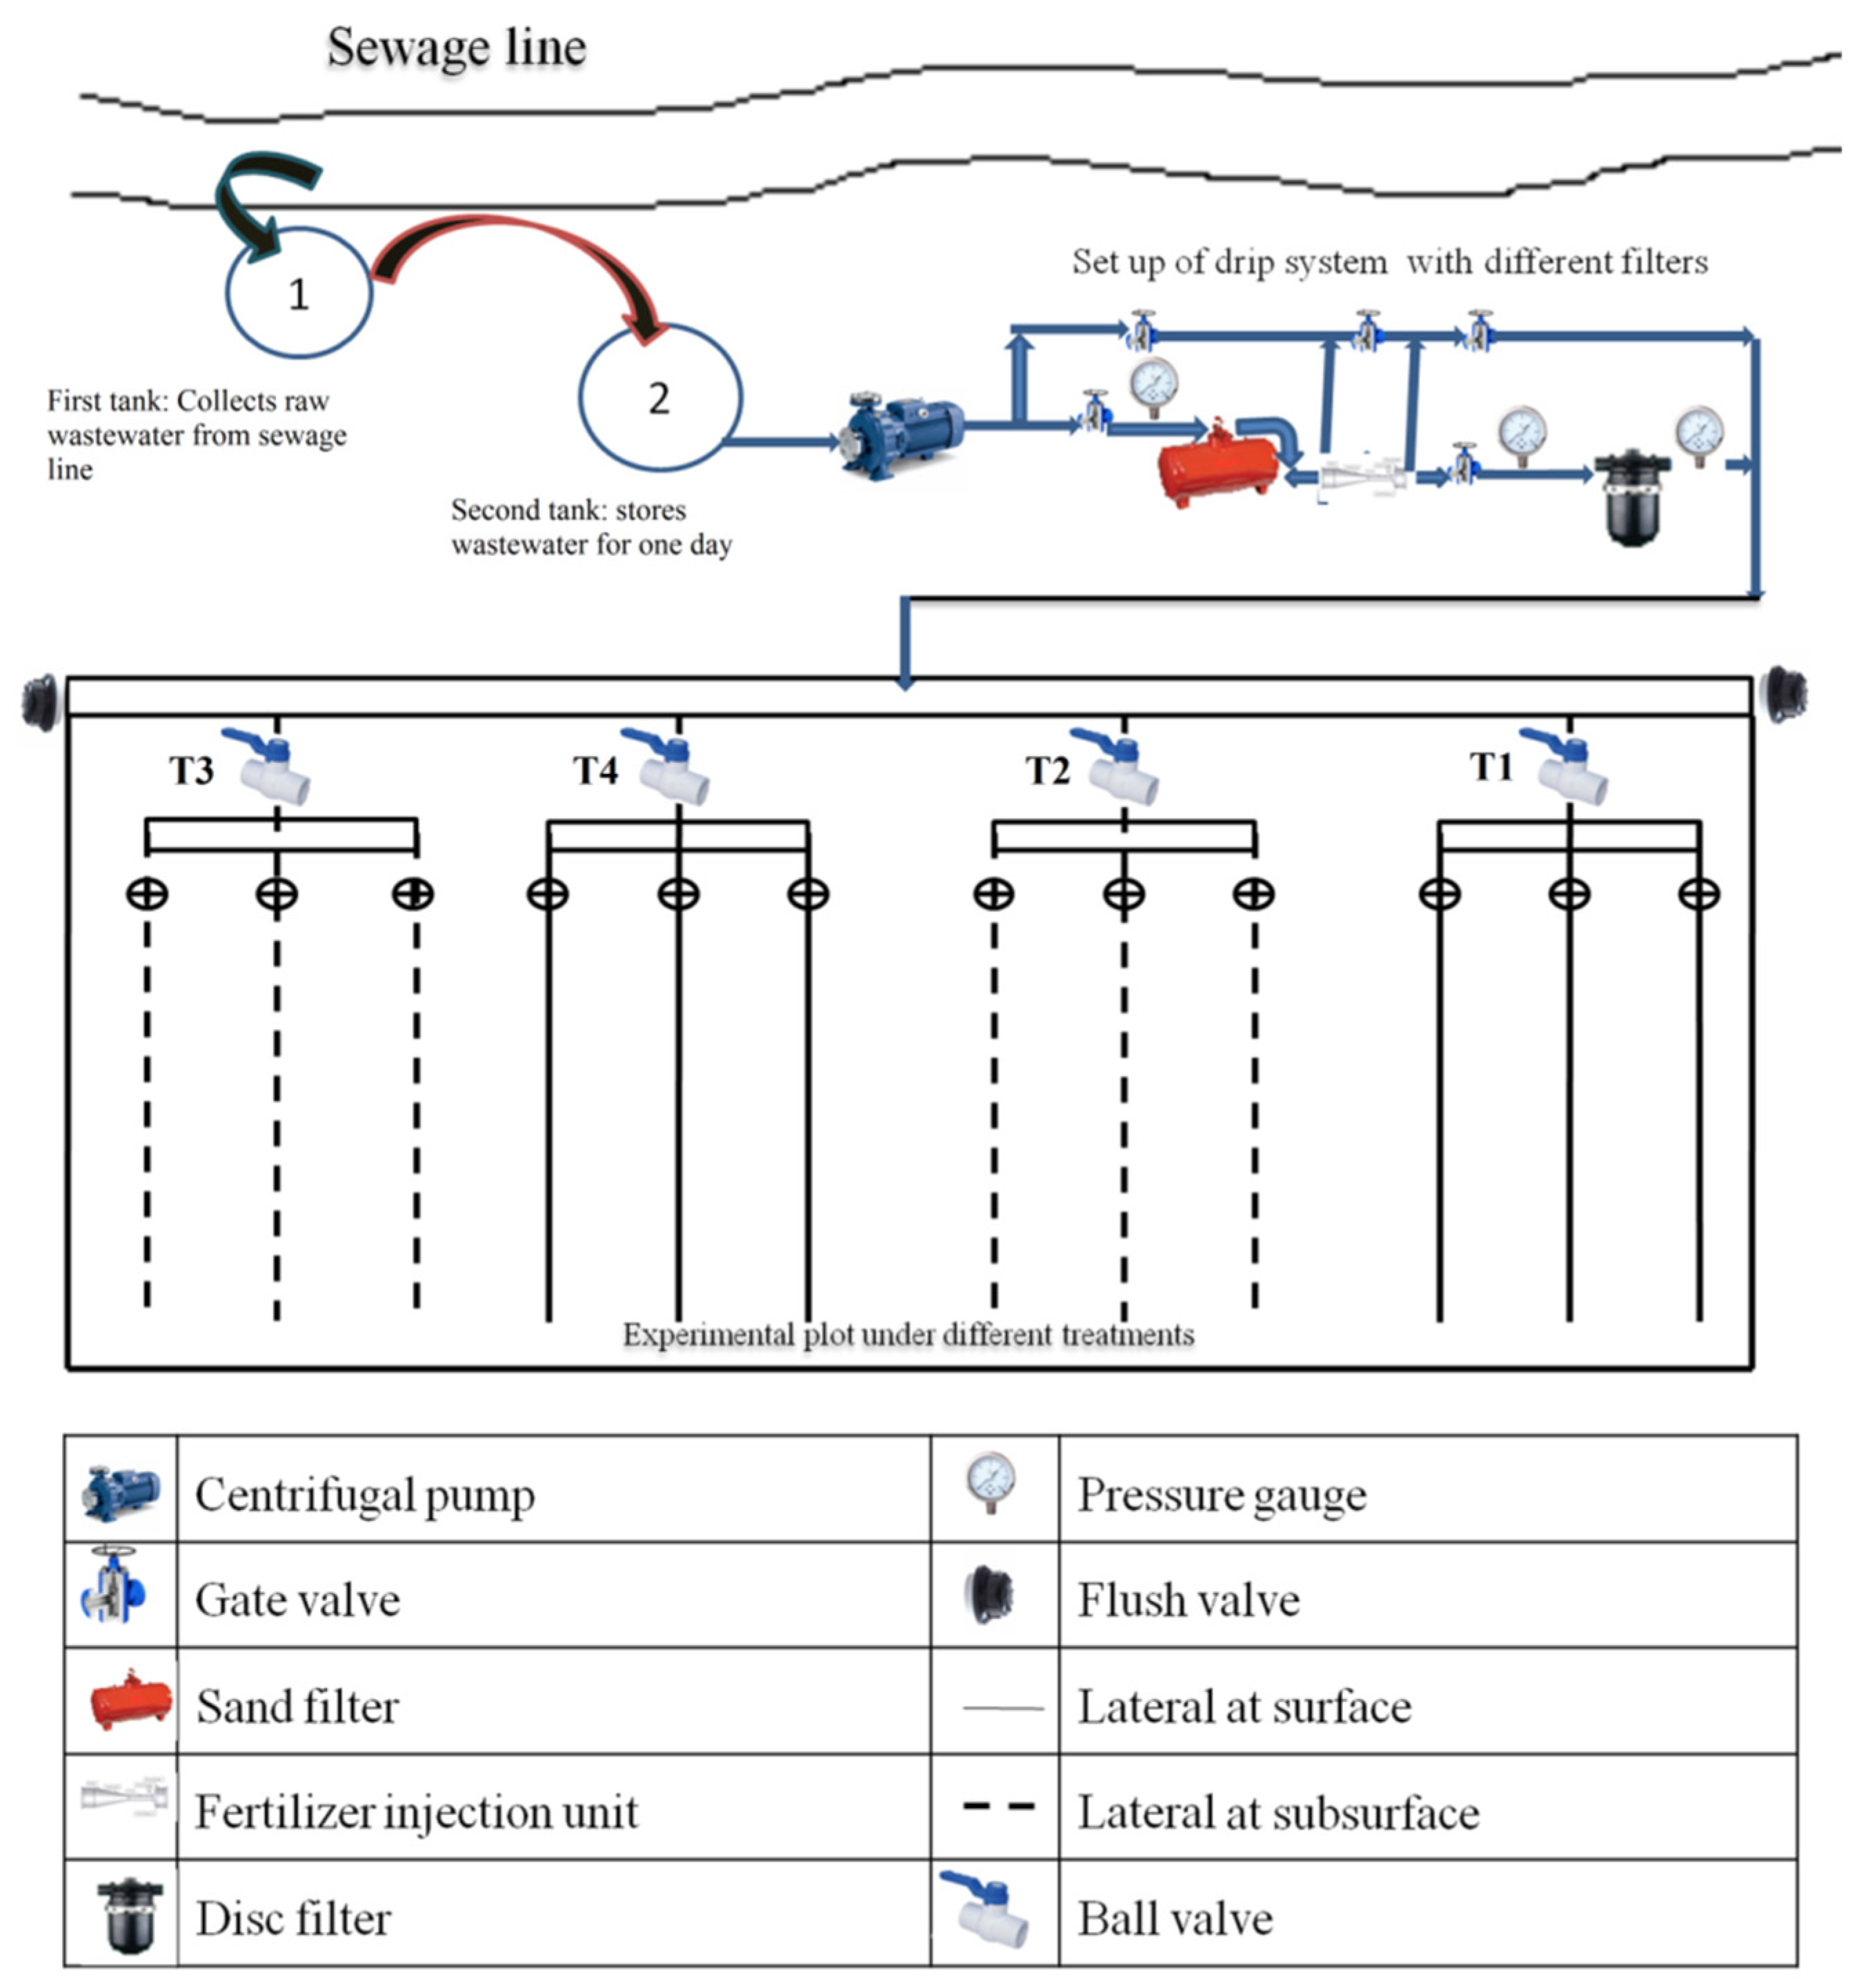
2.6. Experimental Treatment and Setup

An experimental field plot of 25 × 30 m was utilized to test the following four treatments: PMW application using inline surface drip (T1), inline subsurface drip (T2), bioline (pressure compensating) subsurface drip (T3) and bioline surface drip (T4). The experiment followed a randomized block design (RBD). A drip irrigation system was designed for cauliflower and bitter guard crops, and consisted of a filtration system, a fertigation system, a flow control valve, pressure gauges and a flush valve. The filtration system consisted of a media filter (manufactured by Jain Irrigation Systems Ltd., Maharashtra, India) and a disc filter (Netafim Arkal Disc Filter that was manufactured by Netafim Irrigation India Pvt. Ltd., Ahmedabad, India) with a flow capacity of 30 m3 h˗1. Municipal wastewater was passed through both the filtration system before application to the experimental crop field. Lateral lines (16 mm diameter) of linear low-density polyethylene (LLDPE) were taken off from a PVC sub main line (0.06 m diameter). Lateral lines were placed at 0.6 m. Bioline and inline laterals (both the laterals were manufactured by Netafim Irrigation India Pvt. Ltd., Ahmedabad, India) with the drip emitter spacing of 0.3 m and discharges of 2 L h−1 were used. Each lateral line was provided with a control valve to control the duration of irrigation. The experimental setup is shown in Figure 3. The bioline (Netafim Irrigation India Pvt. Ltd., Ahmedabad, India) emitter laterals provide design flexibility and superior uniformity for wastewater disposal and soil loading. It is a low volume dripper line designed for on-site wastewater use. Inside the tubing, it has integral and evenly spaced pressure compensating drippers with the diaphragm, which allow water to flow at a constant rate and thus prevent emitter clogging [38].

2.7. Operational Procedure

Wastewater was collected from the sewage line passing nearby (approximately 500 m) the experimental field, as shown in Figure 3. The wastewater in the sewage line consisted of urban runoff, domestic wastewater and small institutional effluents. Two tanks were constructed for collecting the sewage effluent. The tank (capacity: 10 m3) near the sewage line stored the sewage water for 24 h to settle the suspended particles. The second tank (capacity: 4 m3) was installed near the experimental site for collecting the settled wastewater from the first tank to improve the wastewater quality by further reducing the suspended particles. Wastewater from the second tank was applied to the experimental plots through different filtration systems (sand media filter and disc filter) to prevent the chocking of the drip system. For this, a sand filter with a flow rate of 30 m3 h−1 along with backflow mechanism and a disc filter of the same size were used. A sand filter can remove solid particles smaller than pores available in the filter by capturing the particle through both the physical and chemical mechanisms. In a disc filter, the first filtration process is done at the outer surface, which acts as a screen and collects the particles not removed by sand media filter. The second filtration process occurs inside the grooves of the disc to remove the organic materials by creating adhesion between the disc and organic materials.

2.8. Water, Vegetable and Soil sampling

2.8.1. Water sampling

Water samples were collected from the beginning of the experiment to the harvesting of the crop during each month for both the crops from the experimental field, i.e., five times during the whole crop season (120–130 days of life cycle). Each water sample was aseptically collected in triplicate in a sterilized, polyethylene, 1000 mL bottle. These bottles were brought to the laboratory for the microbial analysis, kept in a refrigerator at 4 °C and analyzed within a day.

2.8.2. Vegetable sampling

The edible parts of the vegetable samples were collected ones in the whole cropping season, i.e., during the harvesting time, in triplicates from each treatment plot. Each treatment had three replications. The freshly edible part samples were aseptically collected in sterile polyethylene bags. These polyethylene bags were brought to the laboratory for the microbial analysis and kept in a refrigerator at 4 °C.

2.8.3. Soil Sampling

Soil samples were collected in triplicate from each plot at 0–0.15, 0.15–0.3 and 0.3–0.45 m soil depths after harvest of cauliflower and bitter gourd. These samples were aseptically collected in sterile polyethylene bags. Samples were stored in a refrigerator at 4 °C for microbial and chemical analysis.

2.9. Analysis of Water, Soil and Crop Samples

2.9.1. Water Analysis

Samples of water were collected from the experimental field each month from 2010 through 2011. E. coli of water samples were analysed with the help of Tryptone Blue agar with X-glucuronide plate (TBX agar) (HiMedia Laboratories Pvt. Limited, Mumbai, India) and an incubator using the unit of colony forming unit (CFU) 100 m L˗1 according to standard methods [48]. Triplicate aliquots of 10, 1 and 0.1 mL of each water sample were filtered through 0.45 μm-pore-sized nitrocellulose membranes. For E. coli count, the membrane was placed onto Tryptone Blue agar with X-glucuronide plate (TBX agar) and incubated at 44 °C for 18–24 h while observing only blue-green colonies.

2.9.2. Soil Analysis

Escherichia coli counts were determined for soil according to standard methods [48]. One g of soil sample was aseptically added to 10 mL of sterile buffered peptone water into a sterile jar for a ten-fold dilution. The sample was mechanically shaken for 10 min and stored at room temperature for 30 min to permit bacterial cell recovery. For E. coli counts, membranes were placed onto X-glucuronide (TBX agar) plates. The plates were incubated at 44 °C for 18–24 h for E. coli count.

2.9.3. Crop Analysis

Escherichia coli counts were also determined for both the crops (cauliflower and bitter gourd) according to standard methods [48]. One gram of edible parts was aseptically added to 10 mL of sterile buffered peptone water into a sterile jar for a ten-fold dilution. The sample was mechanically shaken for 3 minutes and stored at room temperature for 30 min to permit bacterial cell recovery. For E. coli counts, membranes were placed onto TBX agar plates. The plates were incubated under different incubation temperatures and times at 44 °C for 18–24 h for E. coli count. To prepare the reagents, analytical grade chemicals and double glass distilled water were used.

2.10. Statistical Analysis

The data were analyzed by one-way analysis of variance (ANOVA) using pair-wise multiple comparison procedures of Tukey test by SPSS-16 software (Informer Technologies, Inc., Los Angeles, CA, USA). A p-value less than the critical level indicates there is a significant difference between the corresponding two groups. Data were represented as mean ± standard deviation.

3. Results and Discussion

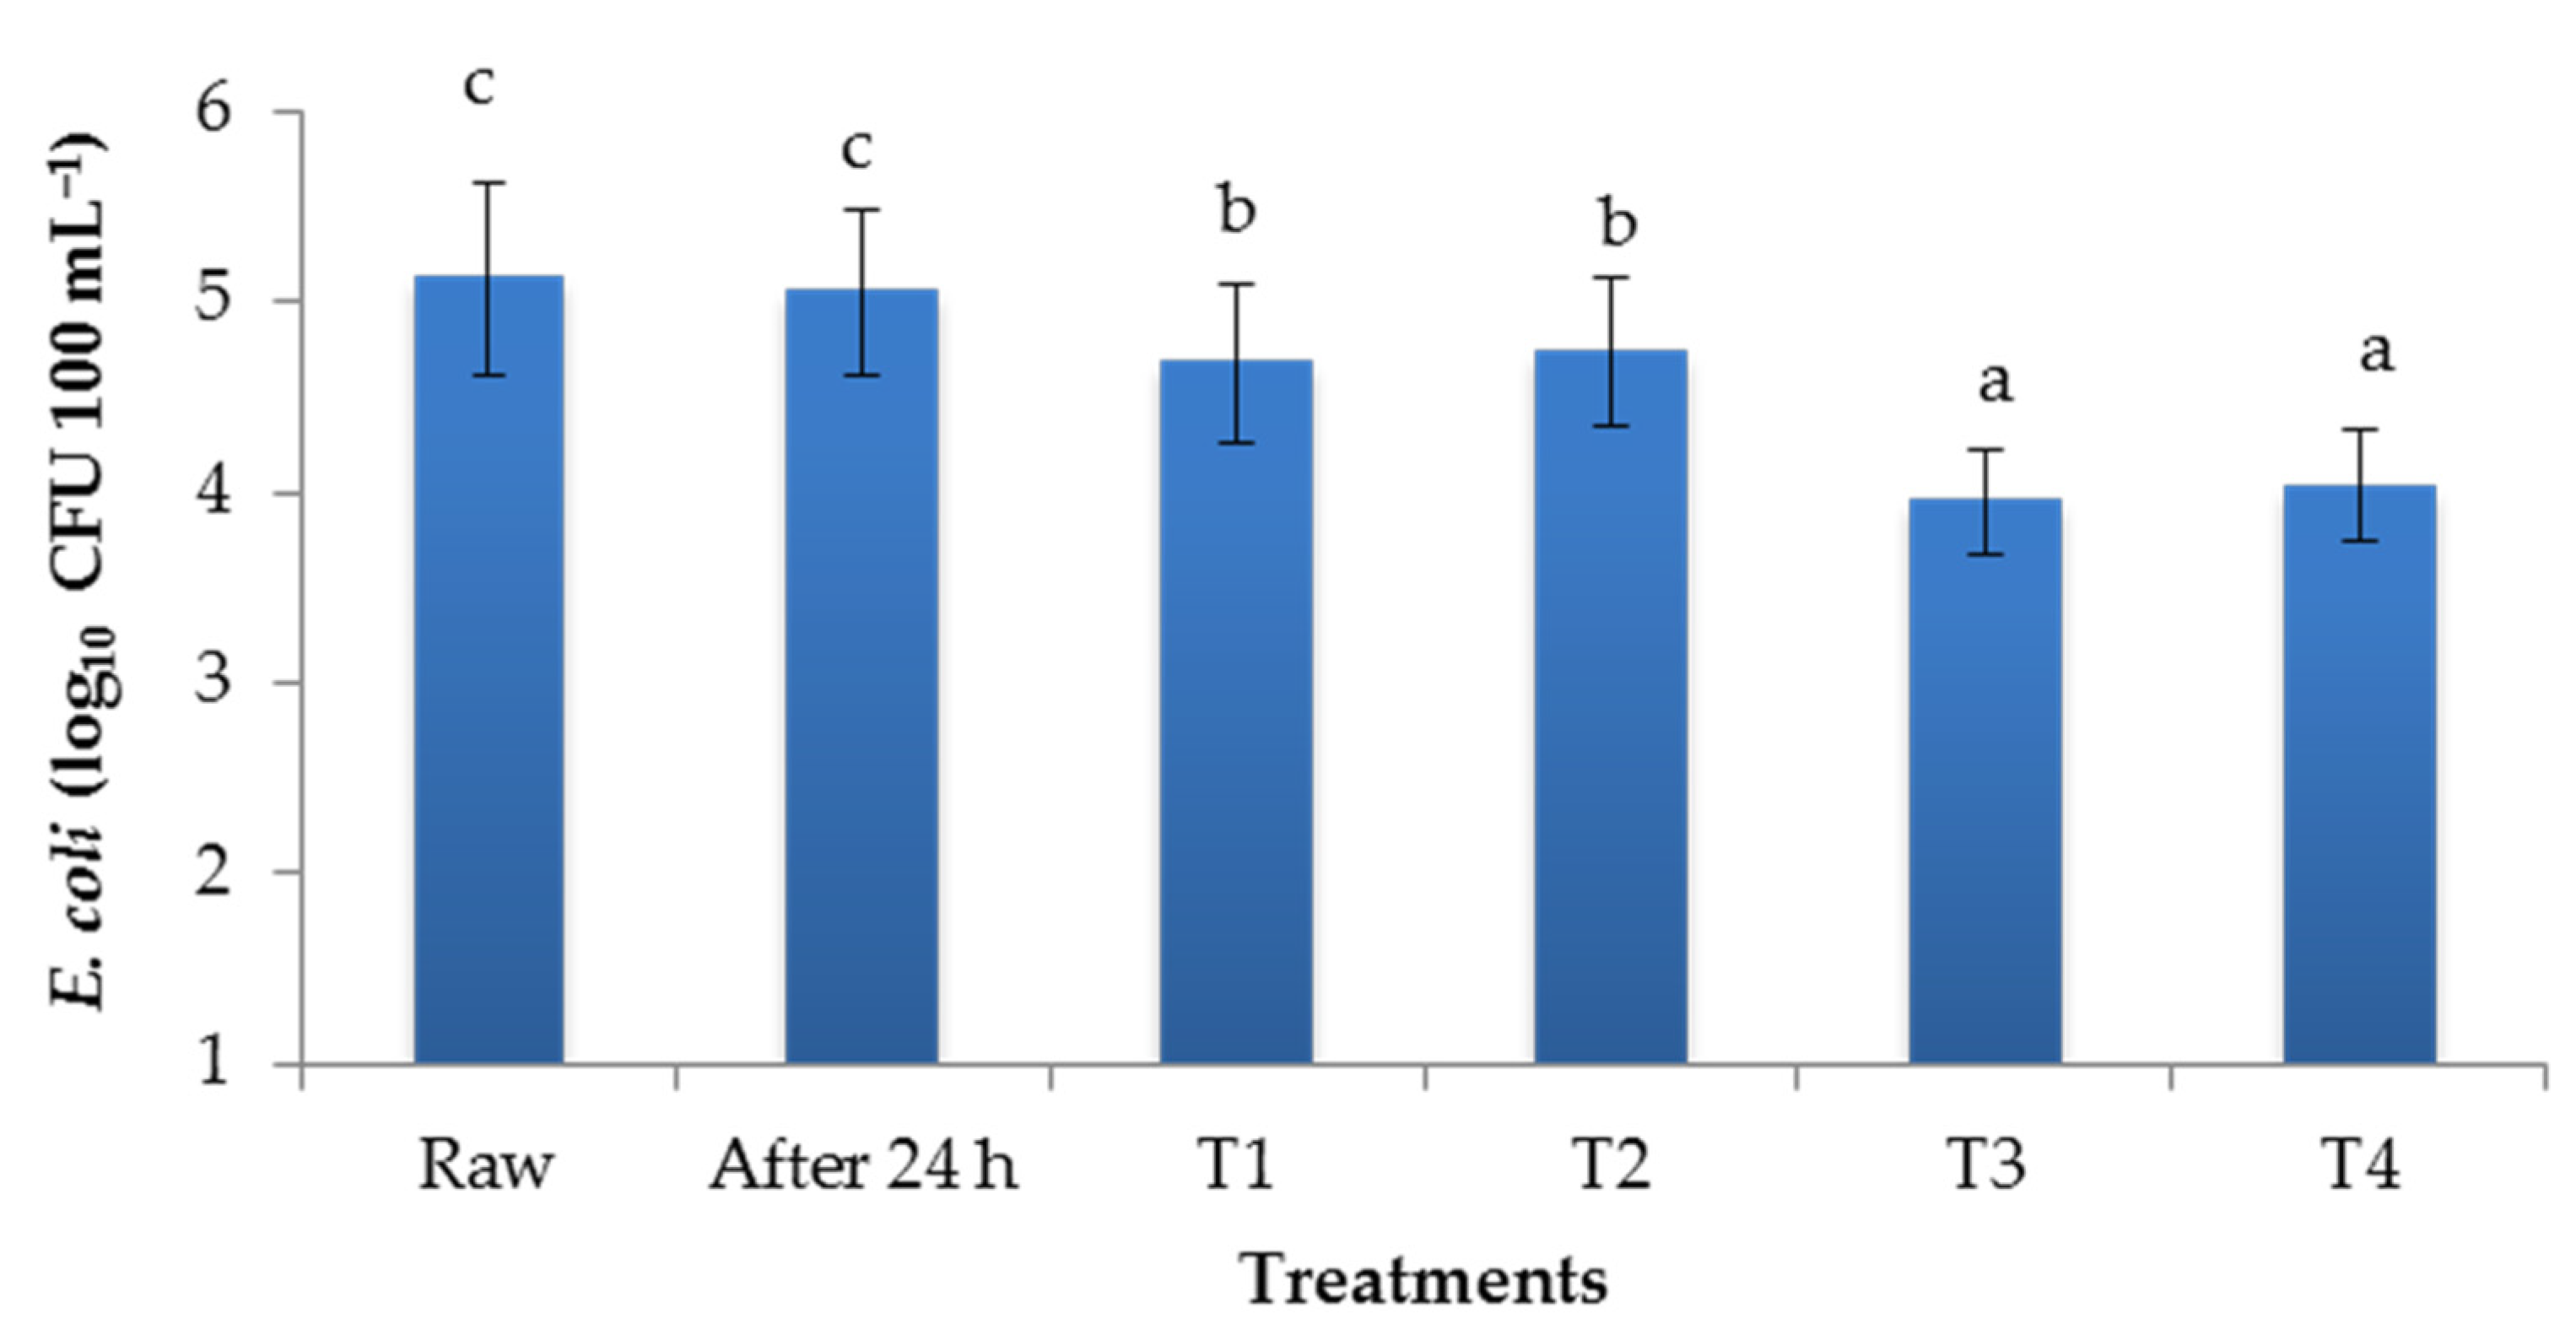
3.1. Performance of Laterals in Reducing E.coli in Irrigation Water

PMW was collected from different drip laterals to estimate the presence of E. coli for comparative performance evaluation of both inline and bioline laterals. The E. coli population in raw municipal wastewater was found to be 5.12 ± 50 log10 CFU 100 mL˗1 and 5.05 ± 0.43 log10 CFU 100 mL˗1 after settlement for 24 h. After passing through the filtration system and different drip laterals, the E. coli population in PMW was found to vary from 3.95 ± 0.27 log10 to 4.73 ± 0.38 log10, respectively for T3 to T1 treatments (Figure 4). These values are lower than the recommended limit of E. coli population (CFU 100 mL˗1) in wastewater used in agriculture by drip irrigation ≤105 [49,50], as shown in Table 3. A significant decline in E. coli population was observed in all the treatments as compared to raw and 24-h-settled wastewater (Figure 4). However, E. coli concentration was observed significantly lower in treatment T3 (3.95 ± 0.27 log10) as compared to T1 and T2 (p < 0.05), while no significant difference was observed with T4.

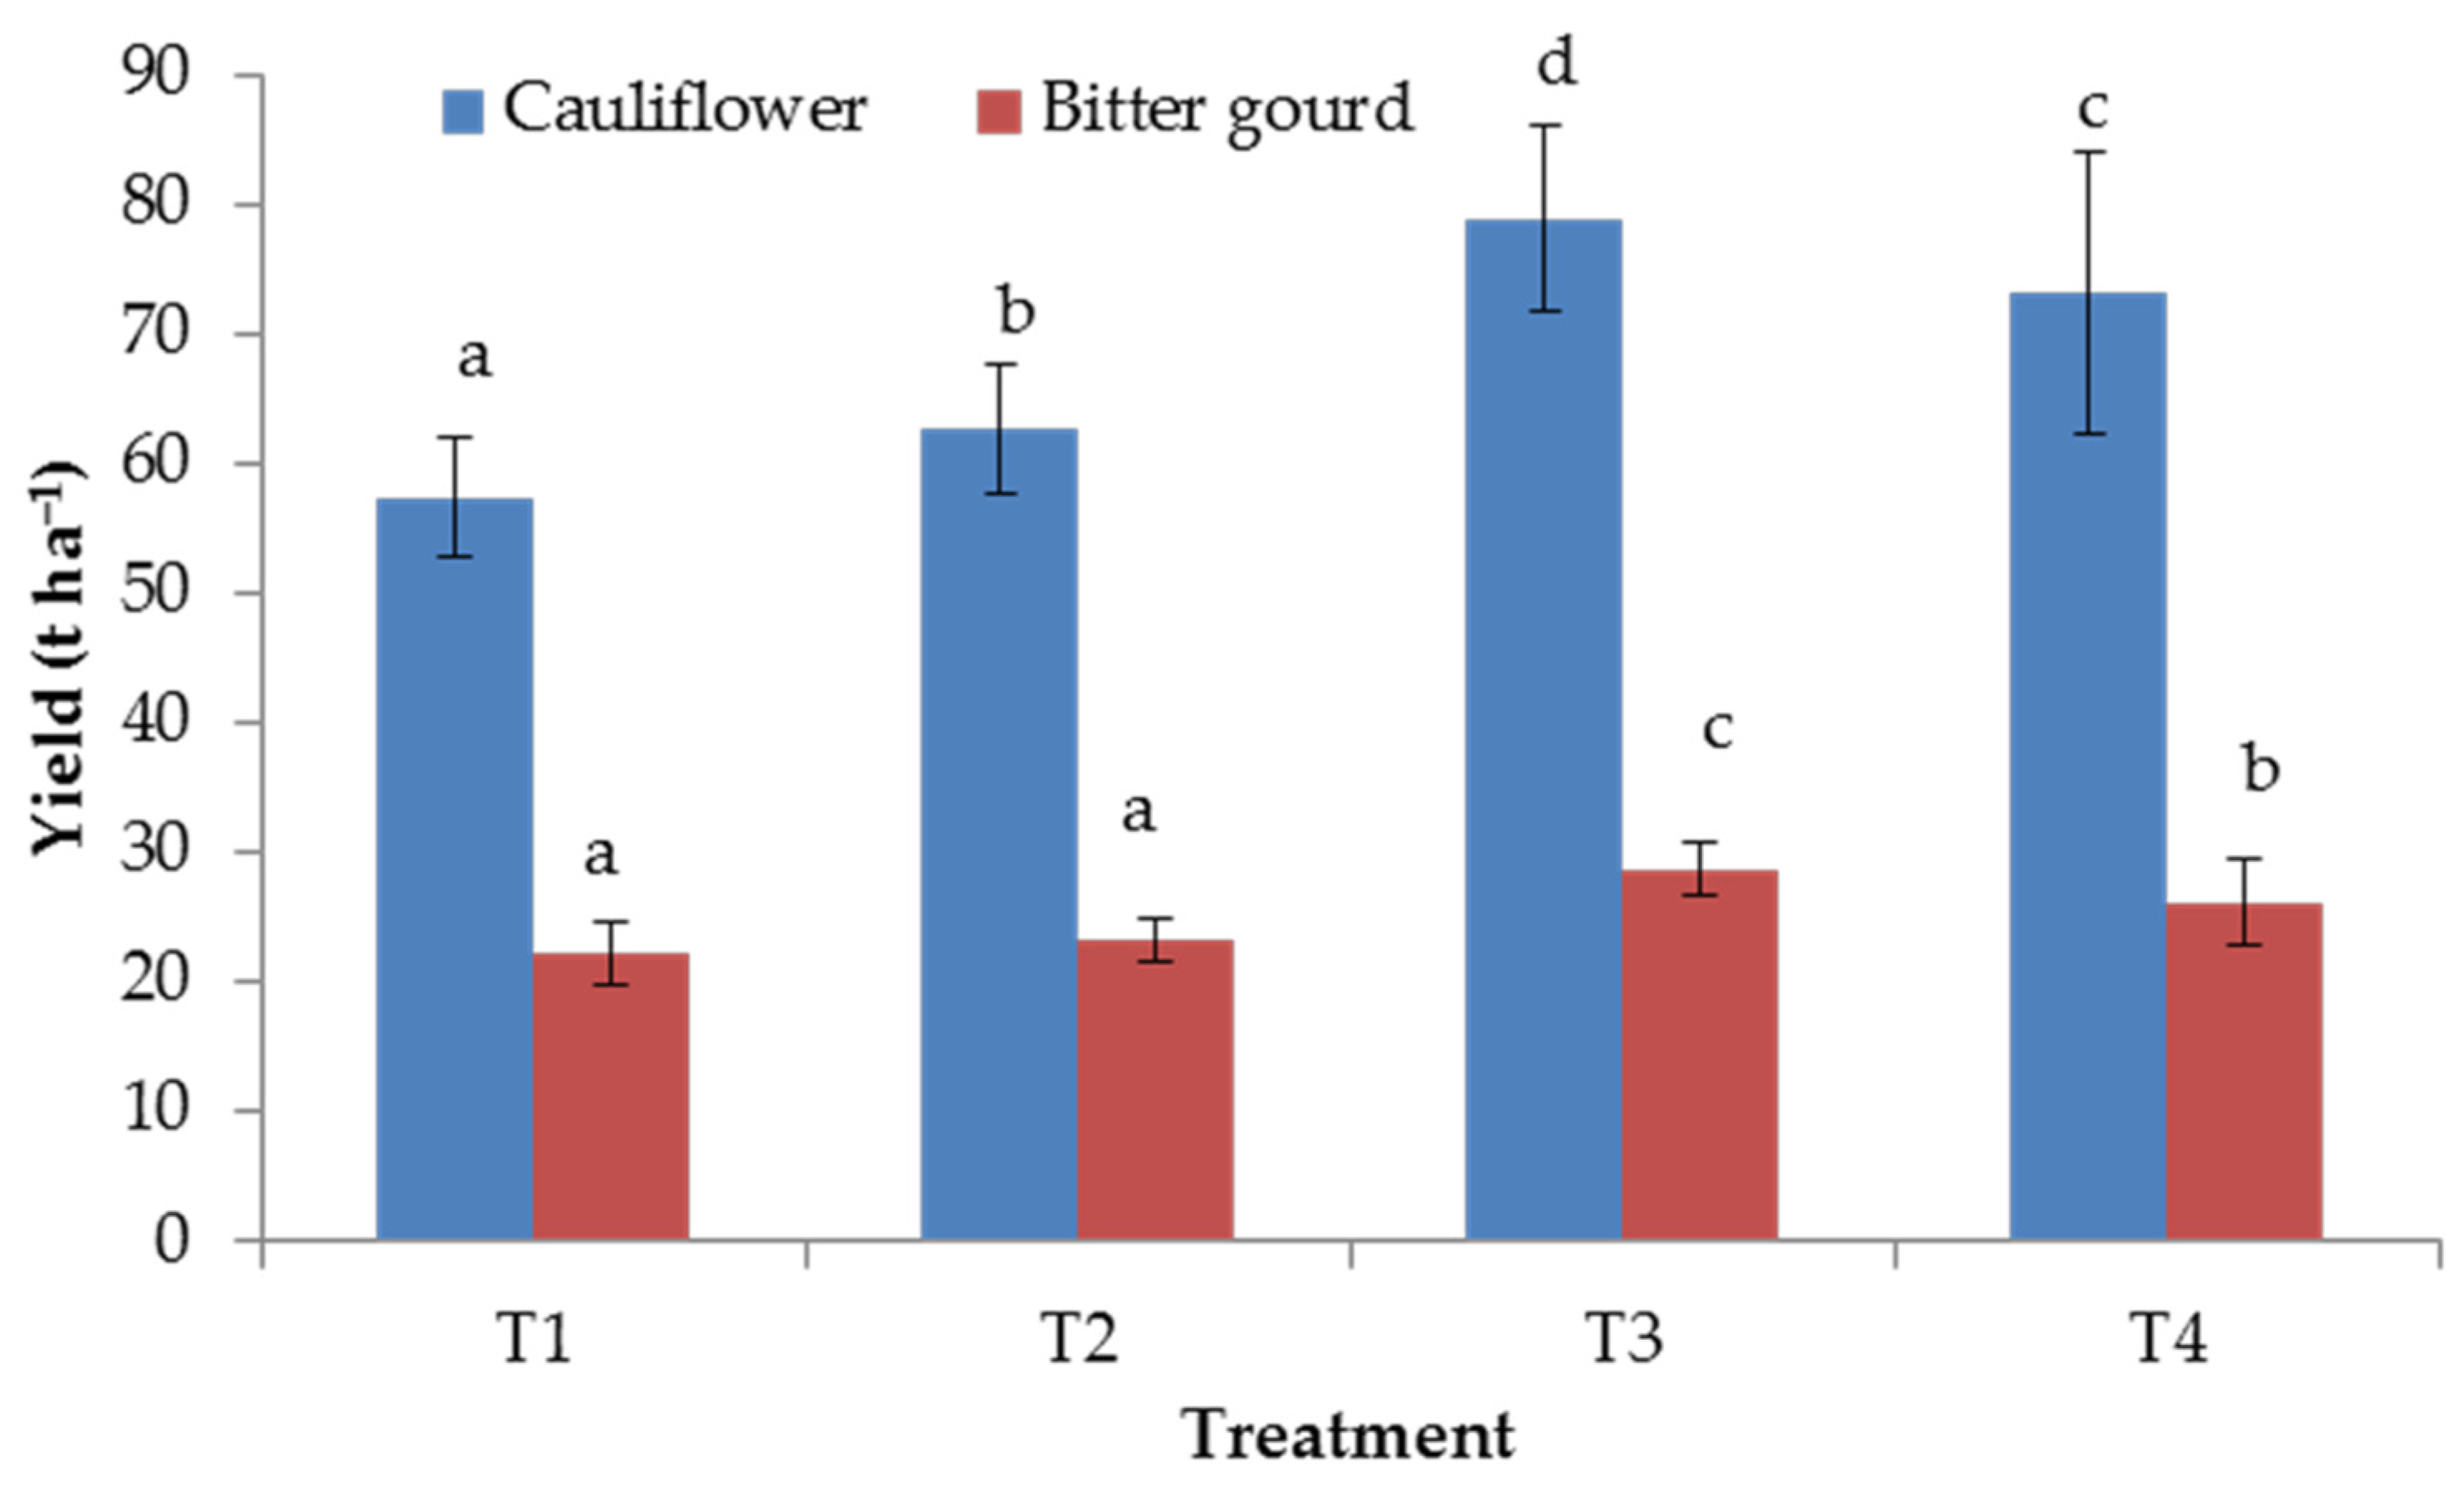
3.2. Yield of Vegetable Crops

The mean values of cauliflower and bitter gourd yield are presented in Figure 5. The maximum average cauliflower and bitter gourd yields (80.4 t ha˗1 and 28.67 t ha˗1) were found in treatment T3 (subsurface bioline drip laterals), while minimum average yield (57.32 t ha˗1 and 22.14 t ha˗1) was observed in T1 (surface inline drip laterals), respectively. Subsurface bioline drip resulted in significantly (p < 0.05) higher yields for both crops than the bioline surface drip. It was also found that the surface and subsurface placements of bioline drip laterals resulted in 27.66% and 25.8% higher cauliflower yields compared to surface and subsurface placement sof inline drip laterals, respectively. In the case of bitter gourd, surface and subsurface placements of bioline drip laterals resulted in 18.24% and 23.1% higher yields compared to surface and subsurface placements of inline drip laterals, respectively. Moreover, the effects of surface and subsurface inline drip lateral were not significantly different (p < 0.05) for bitter gourd yield. Similar results were also reported by Yao et al. [51], Scarpare et al. [52] and Goncalves et al. [53]. The higher yield in subsurface drip irrigation may be attributed to the better soil moisture and nutrient regime in the crop root zone due to reduced evaporation of irrigation water and minimal losses of nutrients as compared to surface drip irrigation systems.

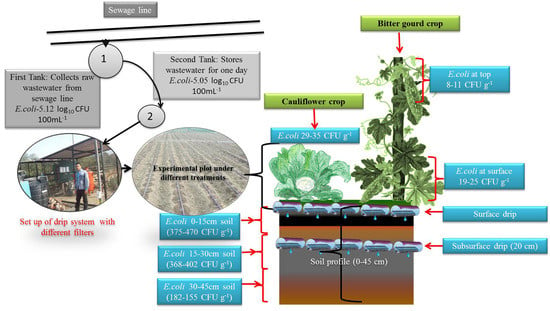
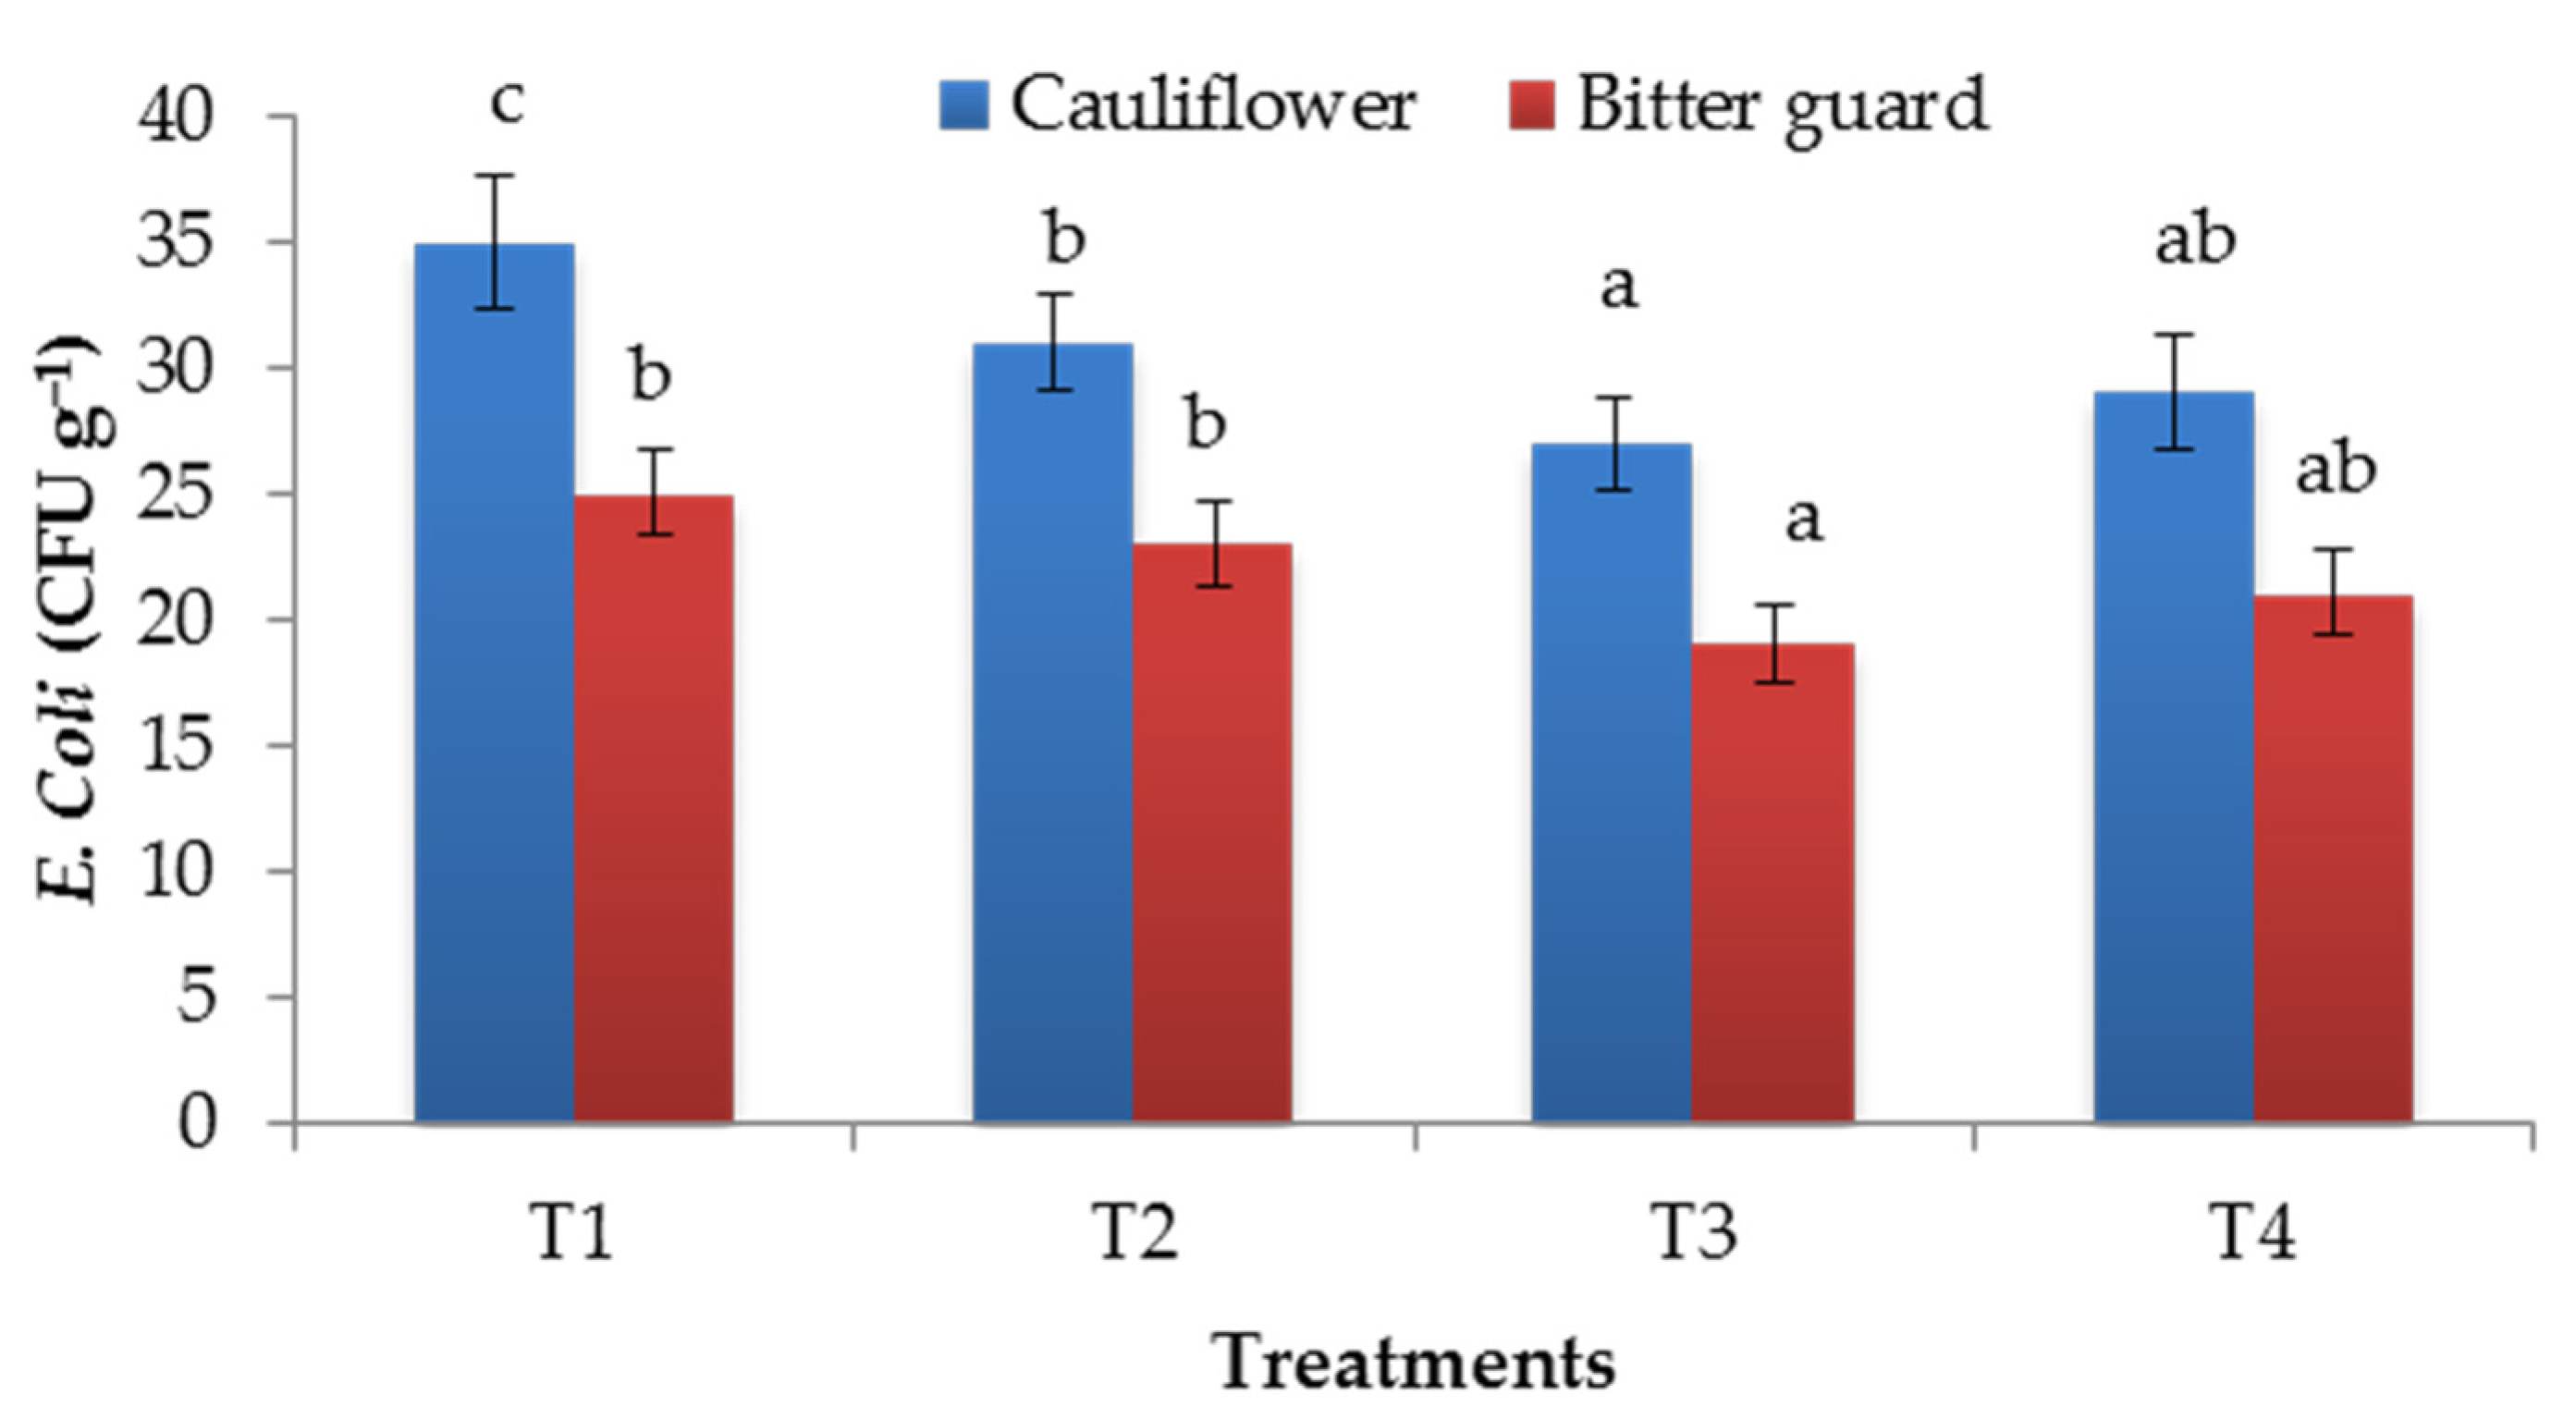
3.3. E. coli Incident in Cauliflower Curd and Bitter Gourd Fruit

The E. coli concentrations in both the vegetable crops, i.e., cauliflower curd and bitter gourd, irrigated with PMW using bioline and inline emitters, were also examined in this study (Figure 6). The results showed that the higher concentration of E. coli was found in T1 (surface placement inline drip lateral) treatment for both the crops than the subsurface placement drip laterals. Similar findings were reported by Sacks and Bernstein [54], who studied the effects of surface and subsurface drip irrigation with reclaimed wastewater on E.coli contamination in melon crop and found a significantly lower count of the bacteria in melon irrigated with the subsurface placement of lateral as compared to surface laterals. In cauliflower curd, the E. coli concentration was found to be 35 ± 2.66 CFU g−1, whereas a lower count was observed in the bitter gourd fruit (25 ± 1.72 CFU g−1) (Figure 6). Further, in bitter gourd fruit, E. coli population was significantly (p < 0.05) lower as compared to cauliflower curd for both inline and bioline laterals. Among all the treatments, E. coli concentration was significantly lower in treatment T3 (subsurface placement drip laterals) for both crops. Lonigro et al. [11] found similar results of E. coli concentration in different crops, such as tomato (35 CFU g−1) and lettuce (45 CFU g−1). Shock et al [55] also found a significant reduction in microbial contamination of onion crop irrigated with wastewater by subsurface drip irrigation. Song et al. [56] and Allende and Monaghan [57] also found a reduction in microbial contamination in lettuce crop using subsurface drip irrigation. The results of the present study also revealed that there were reductions of 7.59% and 8.13% in E. coli counts in the bioline drip lateral as compared to the inline drip lateral for cauliflower and bitter gourd crops, respectively. This shows that the bioline drippers with sand and disc filters can reduce microorganism concentrations in wastewater significantly.

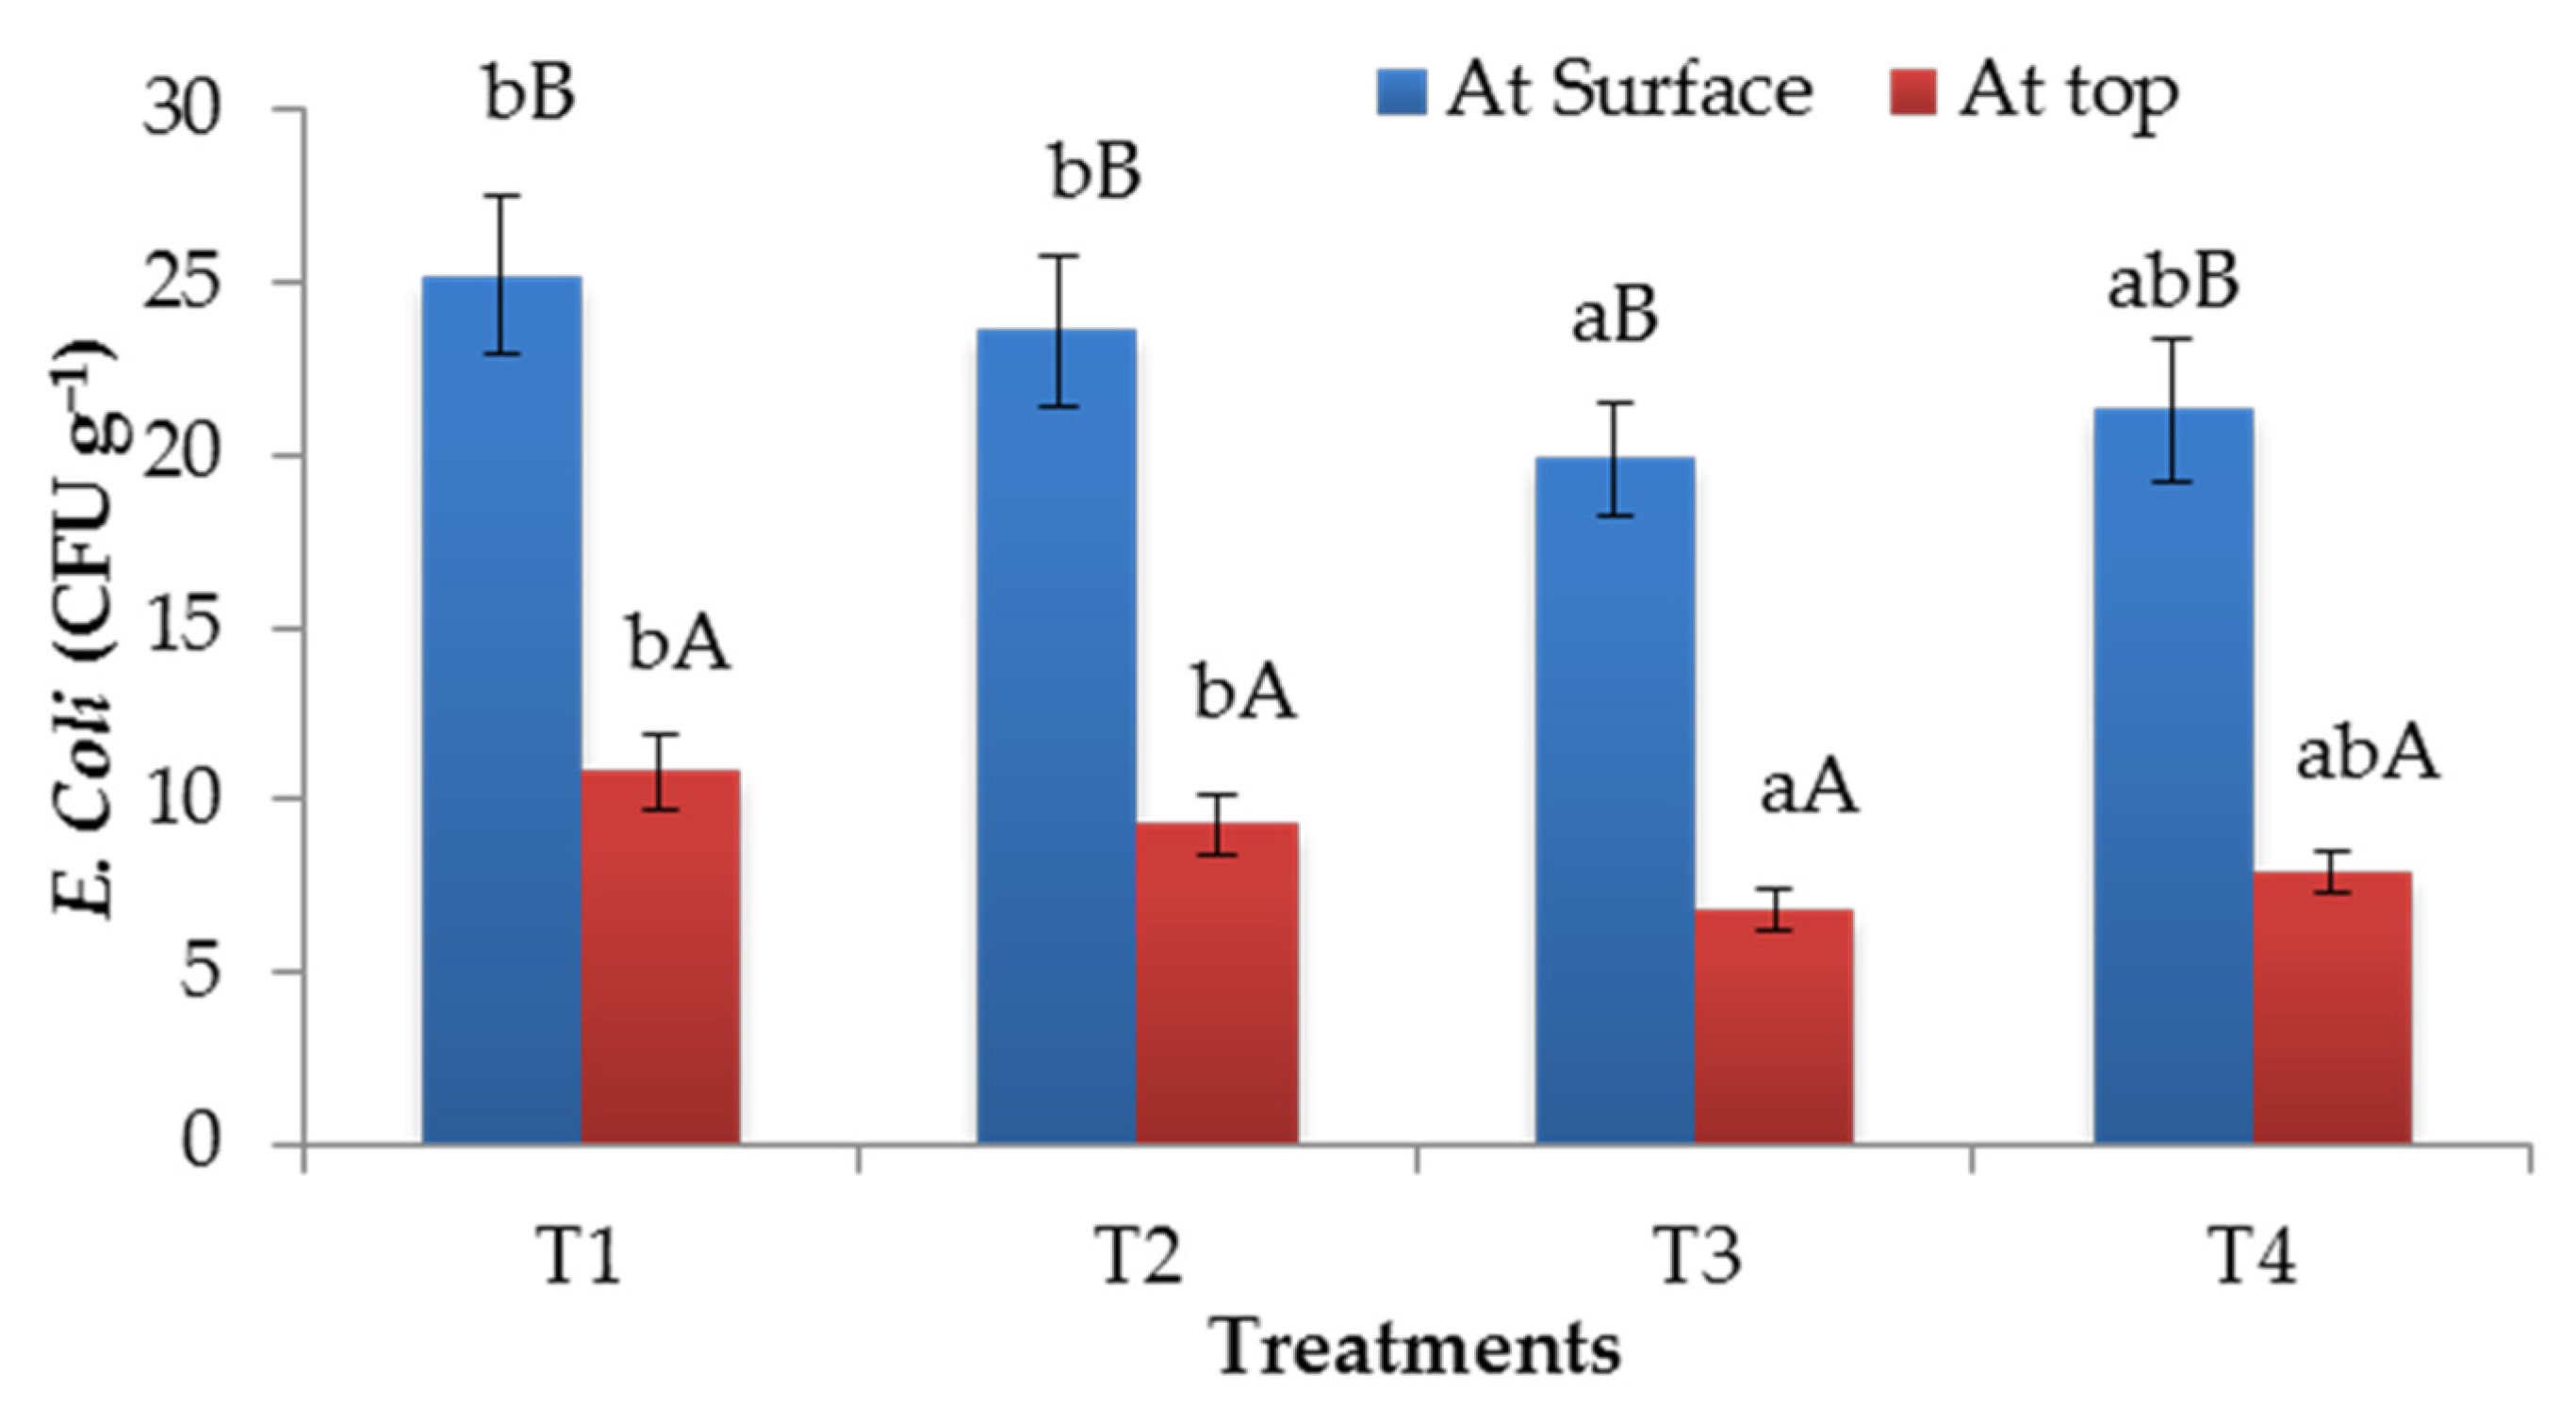
3.4. Variation of E. coli Incident with Respect to Plant Height in Bitter Gourd Fruit

The variation of E. coli counts with the location of fruits for bitter gourd was also assessed in this study. Notably, no study has been reported in the literature dealing with bitter gourd irrigated with municipal wastewater using a drip irrigation system in combination with bioline drippers. The results show that within the same plant of bitter gourd, a significant reduction in E.coli concentration was observed between the top fruit (1m above the ground level, 10.8 ± 1.06 CFU g−1) and fruit near the surface (near the ground level 25.2 ± 2.26 CFU g−1), as shown in Figure 7. According to EFSA [58], direct contact of vegetable crops to microbial contaminated irrigation water should be avoided. The average E. coli concentrations in the fruits of bitter gourd at the top and bottom of all the treatments were found to be 7.8 ± 0.58 CFU g−1 and 22.5 ± 2.05 CFU g−1, respectively. The lowest concentration of E. coli was found in T3 treatment at the top and bottom both with values varying from 6.8 ± 0.53 CFU g−1 to 18.9 ± 2.04 CFU g−1, respectively.

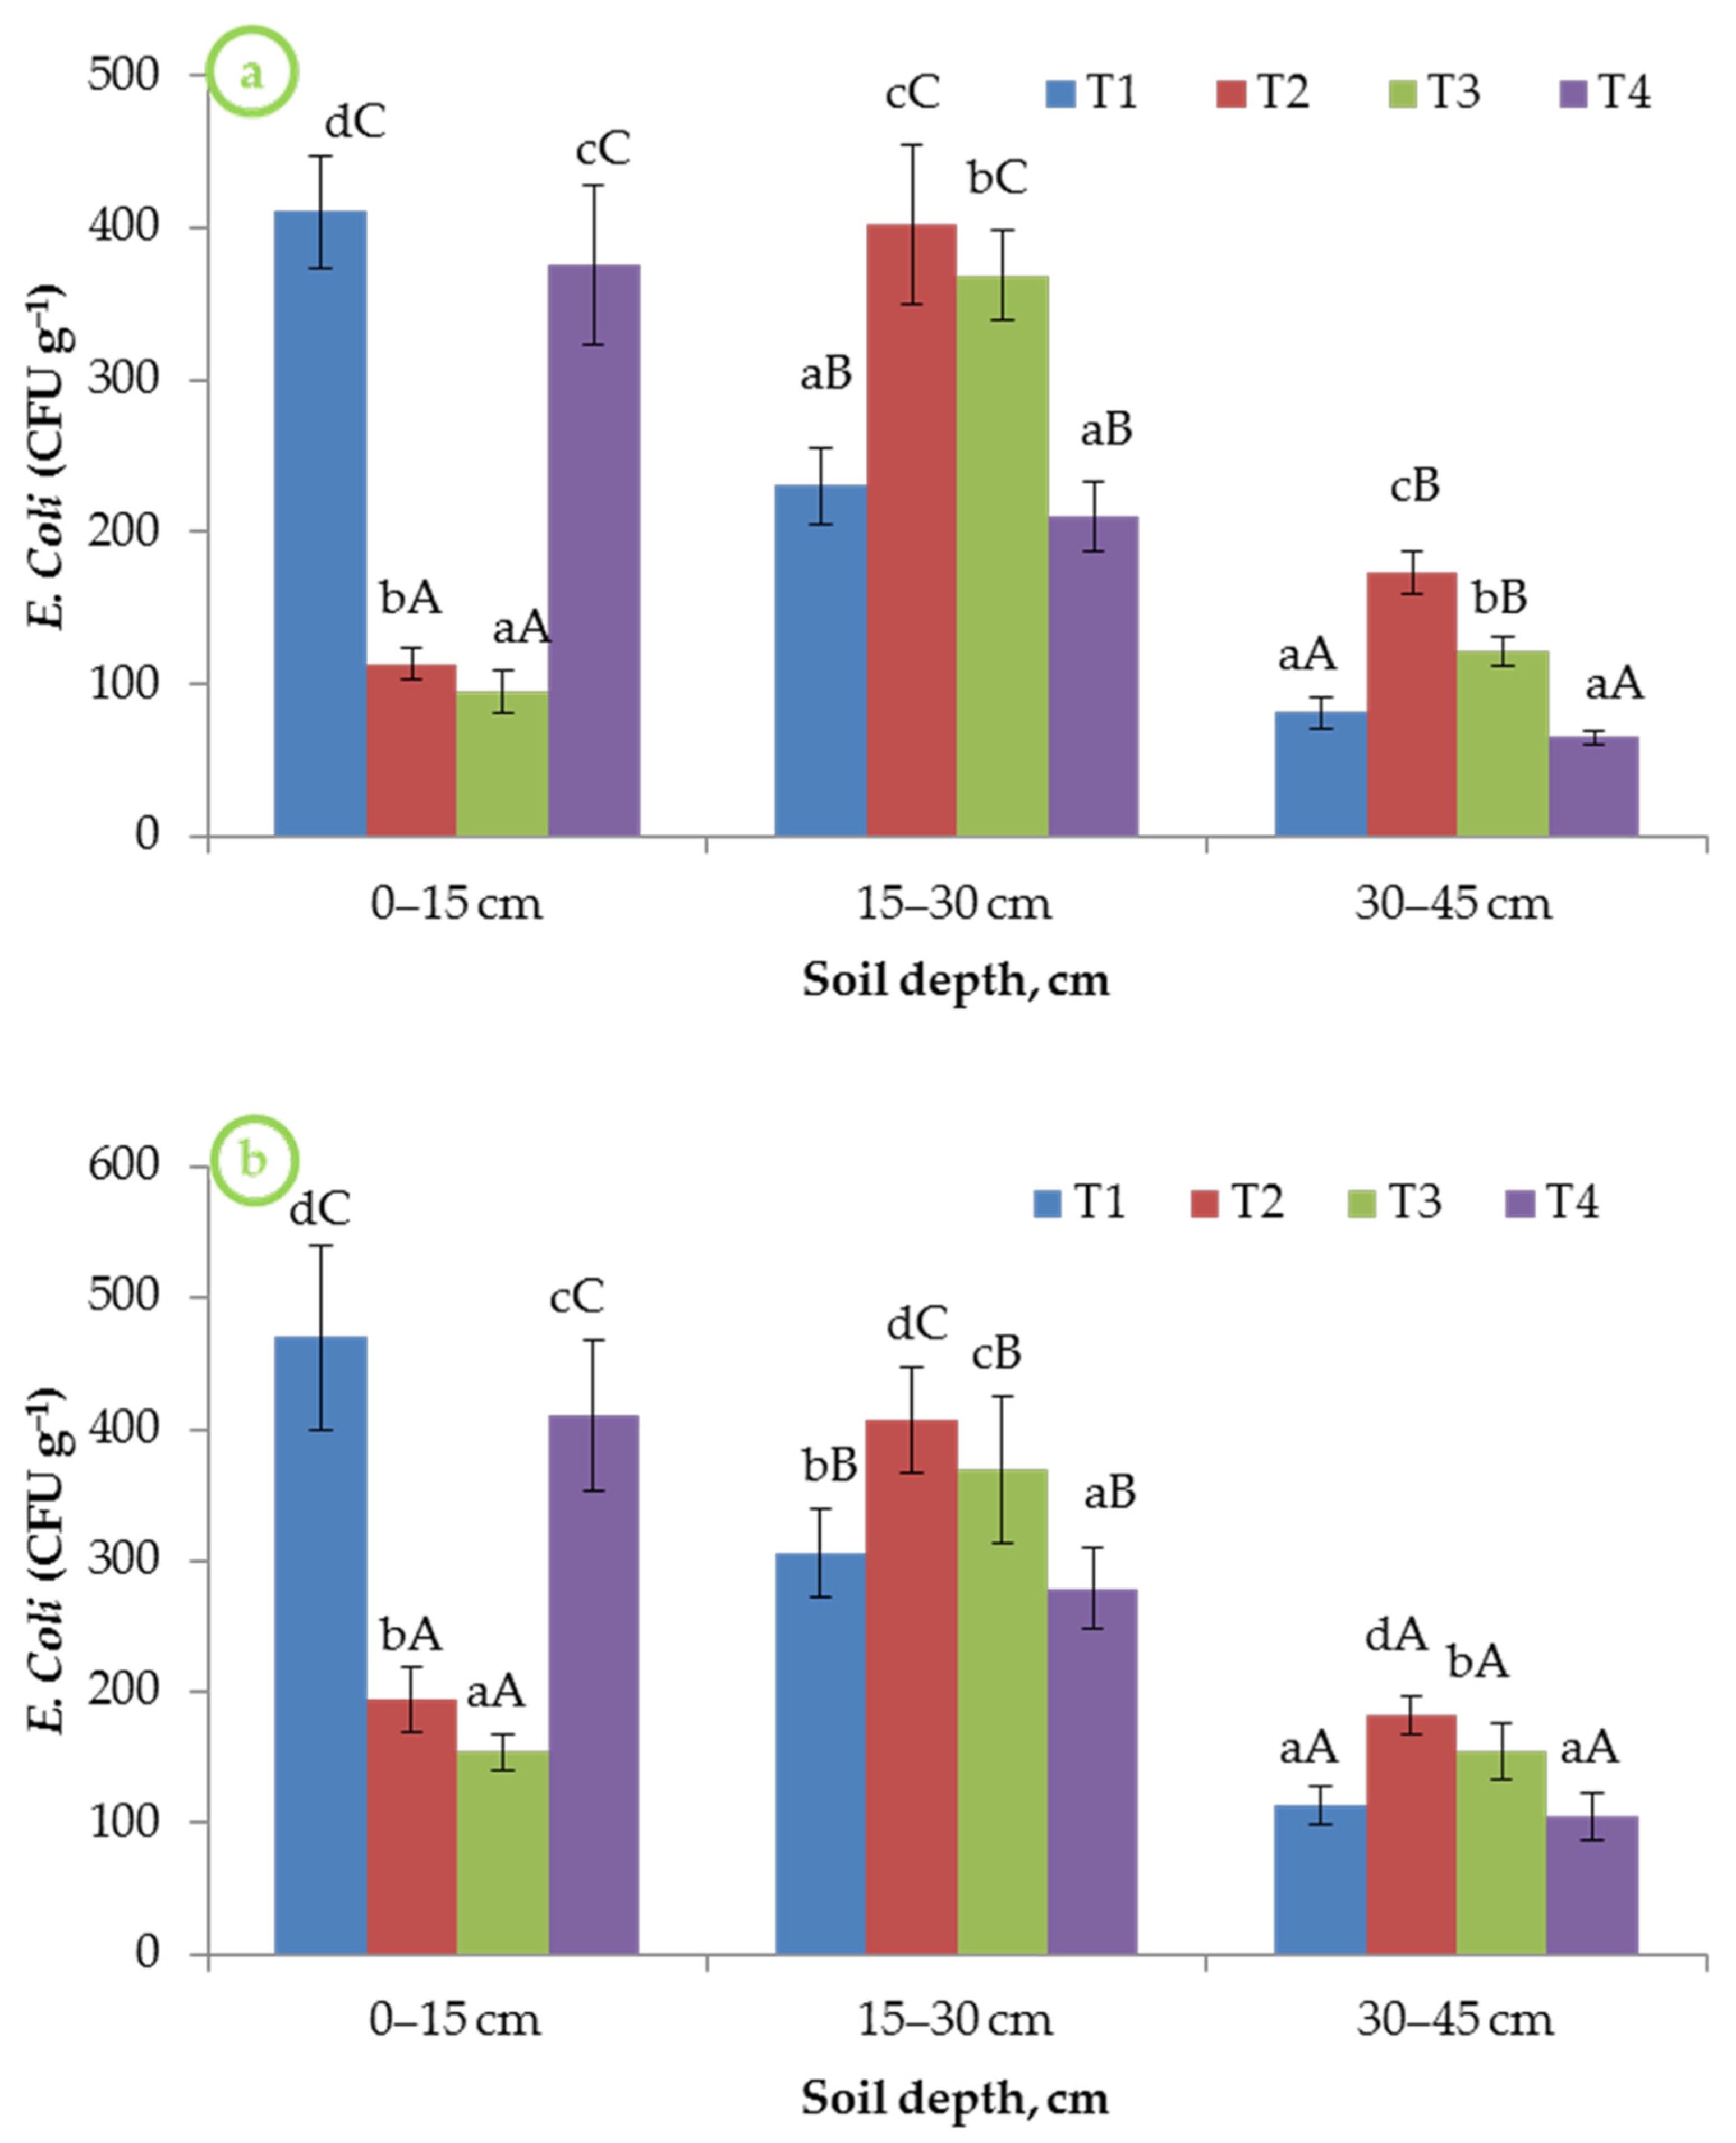
3.5. E. coli Incident in Soil Profile

The results of E.coli concentration in the soil after harvesting of crops under different treatments are presented in Figure 8a,b. Results revealed that the highest concentration of E. coli (470 ± 70.5 and 410 ± 36.9 CFU g−1) was found in T1 treatment in 0–0.15 m soil depth after harvesting of crops, while the minimum was observed in T3 (154 ± 13.86 and 95 ± 14.25 CFU g−1) treatment. At 0.15–0.3 m, the highest concentration of E. coli was observed in T2 (407 ± 40.7 and 402 ± 52.26 CFU g−1) followed by T3 (369 ± 55.35 and 368 ± 29.44 CFU g−1). The reason for this pattern of distribution of E. coli population is attributed to the greater incidence of the bacteria in proximity to the drip lateral position (at surface and 0.2 m). It was also observed that, in cauliflower harvested soil, the E. coli concentration was higher than in the bitter gourd harvested soil, as shown in Figure 8a,b. That may have been due to a lower temperature and higher moisture content in the soil because the cauliflower was grown in the winter season, whereas bitter gourd was grown in summer. This result is also supported by the findings that the survival rate of E. coli is higher in the winter season than in summer [59,60,61].
Among all the treatments, E. coli concentration in soil was significantly lower in T3 (subsurface bioline drip laterals) after harvesting of both crops. Sacks and Bernstein [54] also studied the effect of surface and subsurface drip irrigation in the melon crop on the incidence of E. coli in the soil profile and found significant differences in E. coli concentrations in soil between the surface (higher) and subsurface drip placements of laterals. The concentration of E. coli in T3 was also significantly different than in treatment T2 and T4 in cauliflower (p < 0.05) and bitter gourd (p < 0.05) harvested soil, respectively.
The placement of laterals significantly influenced the population of E. coli, increasing the number of E. coli at the respective depths. The increased population of E. coli in wastewater was mainly due to the domestic sewage discharges which mix up with the wastewater sources at several points. Additionally, the soil reaction being alkaline in nature, the E. coli survived with much ease compared to soil with acidic reaction [62]. Wastewater derived from domestic sources is laden with E. coli contamination and the intensity of contamination increases with the increase in the percentage of wastewater used for irrigation [63]. Since the majority of the wastewater is used for irrigation of vegetable crops in the peri-urban localities which have a chance to be consumed raw, wastewater irrigation increases the chance of contamination and diseases unless proper measures are taken. In the present study, the placement of laterals played a significant role in the reduction of coliform contamination with a lower population at the soil surface due to subsurface placement of laterals. Our results are similar to those of Li and Wen [64] and Wen et al [65], who reported that E. coli concentration was observed in the proximity of emitters and that subsurface placement of drip laterals can avoid the contamination of the soil surface layer. Hence, subsurface drip irrigation could help to reduce E. coli contamination in crops and use the wastewater more efficiently. Similar observations have also been made by Balkhair [63]. This shows that the bioline subsurface drippers with sand and disc filters are efficient in reducing the microorganism concentrations of wastewater used with drip irrigation systems.

4. Conclusions

The treated or partially treated wastewater is now becoming an important source of irrigation for the sustainable use of limited freshwater resources, owing to its potential economic and environmental benefits. Though wastewater has already been used in agriculture for decades, still, it is challenging to follow the guidelines worldwide along with old irrigation practices, particularly in developing countries like India, where the adoption of these guidelines and new techniques to increase the benefits of wastewater reuse along with a reduction in human health risks has not yet reached a larger scale.
The results of this study show that the E. coli concentration in irrigation water and in vegetable fruits can be reduced significantly by using inline and bioline drip laterals. As far as the microbial quality of irrigation water is concerned, a combination of the subsurface drip having a bioline lateral was found to yield lower concentrations of E. coli as compared to the combination of the surface drip having an inline drip lateral. Similarly, among all the treatments, the E. coli concentration was significantly lower in the case of subsurface drip irrigation with bioline laterals (T3) for both crops, i.e., cauliflower curd and bitter gourd. Bitter gourd crop was less contaminated with E. coli as compared to cauliflower. It was also observed that within the same plant of bitter gourd, top fruits were much safer for use as compared to surface fruits because of the low population of E. coli. Results also revealed that E. coli variation in the soil profile was in the proximity of the emitter. Overall, it is concluded that the wastewater applied through the drip irrigation system with pressure compensating drip laterals coupled with sand and disc filters would be a better option for reducing the microbial population in irrigation water, which leads to lowering the E.coli concentration in the soil profile and in vegetable crops. Further, the bitter gourd crop is a better option for irrigating with wastewater as compared to cauliflower.

Author Contributions

Experiments were conducted by D.S. and N.P. The manuscript was written by D.S., N.S., S.P., A.G.-T. and P.K.S. Statistical analysis was performed by N.S. and S.P. All authors have read and agreed to the published version of the manuscript.

Funding

This research received no external funding.

Acknowledgments

The authors wish to thank the National Committee on the Plasticulture Applications in Horticulture (NCOAH), Department of Agriculture and Corporation, Ministry of Agriculture, (GoI) for providing the necessary support to conduct this research.

Conflicts of Interest

The authors declare no conflict of interest.

References

  1. Sheltona, D.R.; Kiefer, L.A.; Pachepsky, Y.A.; Martineza, G.; McCarty, G.W.; Dao, T.H. Comparison of microbial quality of irrigation water delivered in aluminum and PVC pipes. Agric. Water Manag. 2013, 129, 145–151. [Google Scholar] [CrossRef]
  2. Davis, J.M.; Mazumder, A. Health and environmental policy issues in Canada: The role of watershed management in sustaining clean drinking water quality at surface sources. J. Environ. Manag. 2003, 68, 273–286. [Google Scholar] [CrossRef]
  3. Edge, T.A.; El-Shaarawi, A.; Gannon, V.; Jokinen, C.; Kent, R.; Khan, I.U.; Koning, W.; Lapen, D.; Miller, J.; Neumann, N.; et al. Investigation of an Escherichia coli environmental benchmark for waterborne pathogens in agricultural watersheds in Canada. J. Environ. Qual. 2012, 41, 21–30. [Google Scholar] [CrossRef] [PubMed]
  4. Hong, E.-M.; Shelton, D.; Pachepsky, Y.A.; Nam, W.-H.; Coppock, C.; Muirhead, R. Modeling the inter-annual variability of microbial quality metrics of irrigation water in a Pennsylvania stream. J. Environ. Manag. 2017, 187, 253–264. [Google Scholar] [CrossRef] [Green Version]
  5. Pachepsky, Y.; Shelton, D.R.; McLain, J.E.T.; Patel, J.; Mandrell, R.E. Irrigation waters as a source of pathogenic microorganisms in produce. A Rev. Adv. Agron. 2011, 113, 73–138. [Google Scholar]
  6. WHO. Health Guidelines for the Use of Wastewater in Agriculture and Aquaculture. Report of a WHO Scientific Group; Technical Report Series No. 778; World Health Organization: Geneva, Switzerland, 1989. [Google Scholar]
  7. Wood, J.D.; Bezanson, G.S.; Gordon, R.J.; Jamieson, R. Population dynamics of Escherichia coli inoculated by irrigation into the phyllosphere of spinach grown under commercial production conditions. Int. J. Food Microbiol. 2010, 143, 198–204. [Google Scholar] [CrossRef]
  8. Qadir, M.; Wichelns, D.; Raschid-Sally, L.; McCornick, P.G.; Drechsel, P.; Bahri, A.; Minhas, P.S. The challenges of wastewater irrigation in developing countries. Agric. Water Manag. 2010, 97, 561–568. [Google Scholar] [CrossRef] [Green Version]
  9. Toze, S. Reuse of effluent water-benefits and risks. Agric. Water Manag. 2006, 80, 147–159. [Google Scholar] [CrossRef] [Green Version]
  10. Mohammed, M.R.; Abdullahi, U.S. Reuse of wastewater in urban farming and urban planning implications in Katsina metropolis, Nigeria. Afr. J. Environ. Sci. Technol. 2010, 4, 28–33. [Google Scholar]
  11. Lonigro, A.; Rubino, P.; Lacasella, V.; Montemurro, N. Faecal pollution on vegetables and soil drip irrigated with treated municipal wastewaters. Agric. Water Manag. 2016, 174, 66–73. [Google Scholar] [CrossRef]
  12. Ceuppens, S.; Hessel, C.T.; de Quadros, R.R.; Bartz, S.; Tondo, E.C.; Uyttendaele, M. Microbiological quality and safety assessment of lettuce production in Brazil. Int. J. Food Microb. 2014, 181, 67–76. [Google Scholar] [CrossRef] [PubMed]
  13. Gelting, R.J.; Baloch, M.A.; Zarate-Bermudez, M.A.; Selman, C. Irrigation water issues potentially related to the 2006 multistate E. coli O157:H7 outbreak associated with spinach. Agric. Water Manag. 2011, 98, 1395–1402. [Google Scholar] [CrossRef]
  14. Pachepsky, Y.; Morrow, J.; Guber, A.; Shelton, D.; Rowland, R.; Davies, G. Effect of biofilm in irrigation pipes on microbial quality of irrigation water. Appl. Microb. 2012, 54, 217–224. [Google Scholar] [CrossRef]
  15. Park, S.; Navratil, S.; Gregory, A.; Bauer, A.; Srinath, I.; Jun, M.; Szonyi, B.; Nightingale, K.; Anciso, J.; Ivanek, R. Generic Escherichia coli contamination of spinach at the preharvest level: The role of farm management and environmental factors. Appl. Environ. Microb. 2013, 79, 4347–4358. [Google Scholar] [CrossRef] [Green Version]
  16. CPCB. Status of Water Supply, Wastewater Generation and Treatment in Class-I Cities & Class-II Towns of India; Control of urban pollution series, CUPS/70/2009-10; Central Pollution Control Board, Ministry of Environment and Forest, Government of India: New Delhi, India, 2016.
  17. Hussain, I.; Raschid, M.A.; Hanjra, F.; Marikar, W.; Hoek, V. Wastewater Use in Agriculture: Review of Impacts and Methodological Issues in Valuing Impacts. (With an Extended List of Bibliographical References); Working Paper 37; International Water Management Institute: Colombo, Sri Lanka, 2002. [Google Scholar]
  18. Papadopoulos, I. Wastewater Management for Agriculture Protection in the Near East Region; FAO Regional Office for the Near East: Cairo, Egypt, 1995. [Google Scholar]
  19. Mohammad, M.J.; Mazahreh, N. Changes in soil fertility parameter in response to irrigation of forage crops with secondary treated wastewater. Comm. Soil Sci. Plant. Anal. 2003, 34, 1281–1294. [Google Scholar] [CrossRef]
  20. Bahri, A.; Brissaud, F. Wastewater reuse in Tunisia: Assessing a national policy. Water Sci. Technol. 1996, 33, 87–94. [Google Scholar] [CrossRef]
  21. Weber, B.; Avnimelech, Y.; Juanico, M. Salt enrichment of municipal sewage: New prevention approaches in Israel. Environ. Manage. 1996, 20, 487–495. [Google Scholar] [CrossRef] [PubMed]
  22. The World Bank. World Development Report 2008: Agriculture for Development; The World Bank: Washington, DC, USA, 2007; p. 365. [Google Scholar]
  23. Al-Jamal, M.S.; Sammis, T.W.; Mexal, J.G.; Picchioni, G.A.; Zachritz, W.H. A growth-irrigation scheduling model for wastewater use in forest production. Agric. Water Manag. 2002, 56, 57–79. [Google Scholar] [CrossRef]
  24. Al-Shreideh, B. Reuse of treated wastewater in irrigation and agriculture as a non-conventional resource. In Advanced Short Course on Water Saving and Increasing Water Productivity: Challenges and Options; Faculty of Agriculture, University of Jordan: Amman, Jordan, 2001; pp. 18.1–18.30. [Google Scholar]
  25. Angelakis, A.N.; Marecos, D.; Monte, M.H.F.; Bontoux, L.; Asano, T. The status of wastewater reuse practice in the Mediterranean basin: Need for guidelines. Water Res. 1999, 10, 2201–2217. [Google Scholar] [CrossRef]
  26. Capra, A.; Scicolone, B. Emitter and filter test for wastewater reuse by drip irrigation. Agric. Water Manag. 2004, 68, 135–149. [Google Scholar] [CrossRef]
  27. Steward, H.T.L.; Allender, E.; Sandell, P.; Kube, P. Irrigation of tree plantations with recycled water in Australia: Research developments and care studies. In The Forest Alternative for Treatment and Utilization of Municipal and Industrial Wastes; Cole, D.H., Henry, C.L., Nutter, W.L., Eds.; University of Washington Press: Seattle, WA, USA, 1986; pp. 431–441. [Google Scholar]
  28. Ayers, R.S.; Westcot, D.W. Water Quality for Agriculture; FAO Irrigation and Drainage paper 29; FAO: Rome, Italy, 1991. [Google Scholar]
  29. Sarker, K.K.; Hossain, A.; Murad, K.F.I.; Biswas, S.K.; Akter, F.; Rannu, R.P.; Moniruzzaman, M.; Karim, N.N.; Timsina, J. Development and Evaluation of an Emitter with a Low-Pressure Drip-Irrigation System for Sustainable Eggplant Production. AgriEngineering 2019, 1, 376–390. [Google Scholar] [CrossRef] [Green Version]
  30. Capra, A.; Scicolone, B. Recycling of poor quality urban wastewater by drip irrigation systems. J. Clean Prod. 2007, 15, 1529–1534. [Google Scholar] [CrossRef]
  31. Cararo, D.C.; Botrel, T.A.; Hills, D.J.; Leverenz, H.L. Analysis of clogging in drip emitters during wastewater irrigation. Appl Eng. Agric. 2006, 22, 251–257. [Google Scholar] [CrossRef]
  32. Liu, H.; Huang, G. Laboratory experiment on drip emitter clogging with fresh water and treated sewage effluent. Agric. Water Manag. 2009, 96, 745–756. [Google Scholar] [CrossRef]
  33. McDonald, D.R.; Lau, L.S.; Wu, I.P.; Gee, H.K.; Young, S.C.H. Improved Emitter and Network System Design for Reuse of Wastewater in Drip Irrigation; Technical Report No. 163; Water Resources Research Centre, University of Hawaii at Manoa: Honolulu, HI, USA, 1984. [Google Scholar]
  34. Oron, G.; Shelef, G.; Turzynski, B. Trickle irrigation using treated wastewaters. J. Irrig Drain. Div. 1979, 105, 175–186. [Google Scholar]
  35. Rowan, M.; Mancl, K.; Tuovinen, O.H. Clogging incidence of drip irrigation emitters distributing effluents of different levels of treatments. In On-Site Wastewater Treatment X : Proceedings of the Tenth National Symposium on Individual and Small Community Sewage Systems, Sacramento, CA, USA, 21–24 March 2004; Mankin, K.R., Ed.; American Society of Agricultural Engineers: St. Joseph, MI, USA, 2004; pp. 84–91. [Google Scholar]
  36. Tajrishy, M.A.; Hills, D.J.; Tchobanoglous, G. Pretreatment of secondary effluent for drip irrigation. J. Irrig Drain. Eng. 1994, 120, 716–731. [Google Scholar] [CrossRef]
  37. Tripathi, V.K.; Rajput, T.B.S.; Patel, N. Performance of different filter combinations with surface and subsurface drip irrigation systems for utilizing municipal wastewater. Irrig. Sci. 2014, 32, 379–391. [Google Scholar] [CrossRef]
  38. Singh, D.; Patel, N.; Rajput, T.B.S.; Lata Varghese, C. Study of soil water dynamics under bioline and inline drip laterals using groundwater and wastewater. J. Soil Water Conserv. 2013, 12, 55–58. [Google Scholar]
  39. Chandrasekaran, R.; Hamilton, M.J.; Ping, W.; Staley, C.; Matteson, S.; Birr, A.; Michael, J.S. Geographic isolation of Escherichia coli genotypes in sediments and water of the Seven Mile Creek—A constructed riverine watershed. Sci. Total Environ. 2015, 538, 78–85. [Google Scholar] [CrossRef]
  40. Castro-Ibanez, I.; Gil, M.I.; Tudela, J.A.; Ivanek, R.; Allende, A. Assessment of microbial risk factors and impact of meteorological conditions during production of baby spinach in the Southeast of Spain. Food Microbiol. 2015, 49, 173–181. [Google Scholar] [CrossRef]
  41. Wang, Q.; Ling, C.; Lin-Yan, H.; Xia-Fang, S. Increased biomass and reduced heavy metal accumulation of edible tissues of vegetable crops in the presence of plant growth-promoting Neorhizobium huautlense T1-17 and biochar. Agric. Ecosyst. Environ. 2016, 228, 9–18. [Google Scholar] [CrossRef]
  42. Tandon, H.L.S. Methods of Analysis of Soils, Plants, Waters, Fertilizers and Organic Manures; Fertilizer Development and Consultation Organization: New Delhi, India, 2005; p. 204. [Google Scholar]
  43. Brandy, N.C. The Nature and Properties of Soil, 8th ed.; MacMillan Publishing Co., Inc.: New York, NY, USA, 1985. [Google Scholar]
  44. Muhr, G.R.; Datta, P.; Sankarasubramoney, H.; Dever, F.; Laley, V.K.; Donahue, L. Critical test values for available N, P and K in different soil. In Soil Testing in India, 2nd ed.; U.S. Agency for International Development: New Delhi, India, 1965; p. 120. [Google Scholar]
  45. Subbiah, B.V.; Asija, G.L. A rapid procedure for the determination of available nitrogen in soil. Curr. Sci. 1956, 25, 259–260. [Google Scholar]
  46. Smith, R.E.; Smettem, K.R.J.; Broadbridge, P.; Woolhiser, D.A. Infiltration Theory for Hydrologic Applications; Water Resources Monograph–15; American Geophysical Union: Washington, DC, USA, 2002. [Google Scholar]
  47. Allen, R.G.; Pereira, L.S.; Raes, D.; Smith, M. Crop Evapotranspiration: Guidelines for Computing Crop Water Requirements; FAO Irrigation and Drainage Paper 56; FAO: Rome, Italy, 1998; p. 300. [Google Scholar]
  48. American Public Health Association (APHA). Standard Methods for the Examination of Water and Wastewater, 21st ed.; American Public Health Association: Washington, DC, USA, 2005. [Google Scholar]
  49. Food and Agriculture Organization of the United Nations (FAO), Water NEWS: Climate Change & Water. 2016. Available online: http://www.fao.org/nr/water/news/climchange.html (accessed on 29 March 2018).
  50. Jeong, H.; Kim, H.; Jang, T. Irrigation Water Quality Standards for Indirect Wastewater Reuse in Agriculture: A Contribution toward Sustainable Wastewater Reuse in South Korea. Water 2016, 8, 169. [Google Scholar] [CrossRef] [Green Version]
  51. Yao, W.W.; Ma, X.Y.; Li, J.; Parkes, M. Simulation of point source wetting pattern of subsurface drip irrigation. Irrig. Sci. 2011, 29, 331–339. [Google Scholar]
  52. Scarpare, F.V.; Hernandes, T.A.D.; Ruiz-Correa, S.T.; Kolln, O.T.; Gava, G.J.C.; Silva dosSantos, L.N.; Victoria, R.L. Sugarcane water footprint under different management practices in Brazil: Tietê/Jacaré watershed assessment. J. Clean. Prod. 2016, 112, 4576–4581. [Google Scholar] [CrossRef]
  53. Goncalves, I.Z.; Barbosa, E.A.A.; Santos, L.N.S.; Nazário, A.A.; Feitosa, D.R.C.; Tuta, N.F.; Matsura, E.E. Water relations and productivity of sugarcane irrigated with domestic wastewater by subsurface drip. Agric. Water Manag. 2017, 185, 105–115. [Google Scholar] [CrossRef]
  54. Sacks, M.; Bernstein, N. Utilization of reclaimed wastewater for irrigation off-field-grown melons by surface and subsurface drip irrigation. Isr. J. Plant. Sci. 2011, 59, 159–169. [Google Scholar] [CrossRef]
  55. Shock, C.C.; Reitz, S.R.; Roncarati, R.A.; Kreeft, H.; Shock, B.M.; Klauzer, J. Drip vs. furrow irrigation in the delivery of Escherichia coli to onions. Appl. Eng.Agric. 2016, 32, 235–244. [Google Scholar]
  56. Song, I.; Stine, S.; Choi, C.; Gerba, C. Comparison of crop contamination by microorganisms during subsurface drip and furrow irrigation. J. Environ. Eng. 2006, 132, 1243–1248. [Google Scholar] [CrossRef]
  57. Allende, A.; Monaghan, J. Irrigation Water Quality for Leafy Crops: A Perspective of Risks and Potential Solutions. Int. J. Environ. Res. Public Health 2015, 12, 7457–7477. [Google Scholar] [CrossRef] [Green Version]
  58. EFSA., Panel on Biological Hazards (BIOHAZ). Scientific opinion on the risk posed by pathogens in food of non-animal origin. Part 2 (Salmonella and Norovirus in leafy greens eaten raw as salads). EFSA J. 2014, 12, 3600. [Google Scholar]
  59. Cools, D.; Merckx, R.; Vlassak, K.; Verhaegen, J. Survival of E. coli and Enterococcus spp. derived from pig slurry in soils of different texture. Appl. Soil Ecol. 2001, 17, 53–62. [Google Scholar] [CrossRef]
  60. Sorber, C.A.; Moore, B.E. Survival and transport of pathogens in sludge amended soil: A critical literature review; Report no. EPA/600/2-97/028; U.S. Environmental Protection Agency: Washington, DC, USA, 1987.
  61. Semenov, A.V.; van Bruggen, A.H.C.; van Overbeek, L.; Termorshuizen, A.J.; Semenov, A.M. Influence of temperature fluctuations on Escherichia coli O157:H7 and Salmonella enterica serovar Typhimurium in cow manure. FEMS Microbiol. Ecol. 2007, 60, 419–428. [Google Scholar] [CrossRef] [Green Version]
  62. Jamieson, R.C.; Gordon, R.J.; Sharples, K.E.; Stratton, G.W.; Madani, A. Movement and persistence of fecal bacteria in agricultural soils and subsurface drainage water: A review. Can. Biosyst. Eng. 2002, 44, 1–9. [Google Scholar]
  63. Balkhair, K.S. Microbial contamination of vegetable crop and soil profile in arid regions under controlled application of domestic wastewater. Saudi J. Biol. Sci. 2016, 23, S83–S92. [Google Scholar] [CrossRef] [Green Version]
  64. Li, J.; Wen, J. Effects of water managements on transport of E. coli in soil-plant system for drip irrigation applying secondary sewage effluent. Agric. Water Manag. 2016, 178, 12–20. [Google Scholar] [CrossRef]
  65. Wen, J.; Li, J.; Li, Y. Wetting patterns and bacterial distributions in different soils from a surface point source applying effluents with varying Escherichia coli concentrations. J. Integr. Agric. 2016, 15, 1625–1637. [Google Scholar] [CrossRef] [Green Version]
Figure 1. Location map of the experimental site in semi-arid peri urban area, Delhi, India.
Agriculture 10 00291 g001
Figure 2. Crop water requirements (mm per day) of the cauliflower crop and bitter gourd crop.
Agriculture 10 00291 g002
Figure 3. Setup of a drip irrigation system and layout of experimental plot under different Table T1 and T2 are the inline laterals under surface and subsurface placement, whereas T3 and T4 are the bioline laterals under subsurface and surface placement, respectively.
Agriculture 10 00291 g003
Figure 4. Variation in the population of E. coli in wastewater after passing through drip laterals under different treatments. Vertical bars for each column represent standard deviations (n = 3) of the means. Means of different treatments followed by the different lowercase letter (a–c) are significantly different (p < 0.05).
Agriculture 10 00291 g004
Figure 5. Impacts of different treatments on the yields of cauliflower and bitter gourd. Vertical bars for each column represent the standard deviation of the mean (n = 3). Means of different treatments followed by the different lowercase letters (a–d) are significantly different (p < 0.05) for the same crop.
Agriculture 10 00291 g005
Figure 6. Incidence of E. coli in cauliflower curd and bitter gourd fruit under different treatments. Vertical bars for each column represent standard deviation (n = 3) of the mean. Means of different treatments followed by the different lowercase letter (a,b) are significantly different (p < 0.05) within the same crop.
Agriculture 10 00291 g006
Figure 7. Incidence of E. coli in bitter gourd fruit located at different heights. “At surface” means the bitter gourd fruit was near the soil surface (at a height of 0.2 to 0.3 m) while “at top” means the fruit was 1 m vertically from the soil surface. Vertical bars for each column represent standard deviation (n = 3) of the mean. Means of different treatments followed by the different lowercase letters (a,b) are significantly different (p < 0.05) for the same location vertically, whereas the different uppercase letters (A,B) are significantly different (p < 0.05) between the different location heights.
Agriculture 10 00291 g007
Figure 8. Presence of E. coli in soil under different treatments. (a) and (b) show depth-wise variations of E. coli in cauliflower and bitter gourd harvested soil, respectively. Vertical bars for each column represent standard deviations (n = 3) of the means. Means of different treatments followed by different lowercase letters (a–d) are significantly different (p < 0.05) at the same depth, whereas different uppercase letters (A–C) denote significant differences (p < 0.05) among the depths.
Agriculture 10 00291 g008
Table 1. Physical properties of soil.
Soil Depth (m)Sand (%)Silt (%)Clay (%)Soil Texture*Ks (cm h˗1)Bulk Density (g cm˗3)
0–0.1570.3 ± 5.12a12.5 ± 1.04a17.2 ± 2.01aSandy loam1.23 ± 0.14a1.53 ± 0.2a
0.15–0.368.1 ± 7.02a11.7 ± 1.12a20.2 ± 2.14aSandy loam1.19 ± 0.13a1.57 ± 0.21b
0.30–0.4555.2 ± 8.51b21.2 ± 2.2b23.7 ± 3.15aLoam0.75 ± 0.18b1.59 ± 0.18b
* Saturated hydraulic conductivity. Statistical comparison indicates if changes among the depths are significantly different at p ≤ 0.05 that is shown by different letters. Same letters are not significantly different. Values in parenthesis (±) denote the standard deviation of three replications.
Table 2. Initial soil fertility.
Soil Depth (m)pHEC (dS m˗1)Available Nutrients (kg ha˗1)
NPK
0–0.158.24 ± 0.69a0.19 ± 0.02a286.0 ± 15.17a36.4 ± 3.1a281.1 ± 23.41a
0.15–0.38.37 ± 0.87a0.21 ± 0.02ab275.9 ± 09.14a34.2 ± 2.91a275.2 ± 29.18a
0.30–0.458.46 ± 0.97a0.24 ± 0.02b194.4 ± 16.53b30.6 ± 1.48b260.2 ± 18.79a
Statistical comparison indicates if changes among the depths are significantly different at p ≤ 0.05 that is shown by different letters. Same letters are not significantly different. Values in parenthesis (±) denote the standard deviation of three replications.
Table 3. Recommended minimum verification monitoring of E. coli performance targets for wastewater use in agriculture (modified from WHO, 2006), [50].
Type of irrigationE. coli (CFU 100 mL˗1) (Mean)
Unrestricted 1
Root crops (a)≤103
Leaf crops (b)≤104
Drip irrigation, low-growing crops≤103
Drip irrigation, high-growing crops (c)≤105
Restricted 2
Labor-intensive, high-contact agriculture≤104
Highly mechanized agriculture≤105
Pathogen removal in a septic tank≤106
1 Use of wastewater to grow crops that are normally eaten raw. 2 Use of wastewater to grow crops that are not eaten raw by humans. (a) Crops that may be eaten uncooked. (b) Vegetables eaten uncooked, such as lettuce and cabbage. (c) Crops such as fruit trees and olives.

