Article

Systemic Uptake of Fluorescent Tracers by Soybean (Glycine max (L.) Merr.) Seed and Seedlings

1
Horticulture Section, School of Integrative plant Science, Cornell AgriTech, Cornell University, Geneva, New York, NY 14456, USA
2
Inner Mongolia Agricultural University, College of Horticulture and Plant Protection, Hohhot 010018, China
3
Seed Analysis Laboratory of APROSMAT–Mato Grosso Seed Grower Association–APROSMAT Rua dos Andradas, Rua dos Andradas, Rondonópolis 688, Brazil
4
Institute of Plant Protection, Chinese Academy of Agricultural Science, Beijing 100193, China
*
Authors to whom correspondence should be addressed.
These authors contributed equally to this work.
Agriculture 2020, 10(6), 248; https://doi.org/10.3390/agriculture10060248
Submission received: 3 June 2020 / Revised: 22 June 2020 / Accepted: 23 June 2020 / Published: 26 June 2020
(This article belongs to the Special Issue Modern Seed Technology)

Abstract

:
Systemic seed treatment uptake was investigated in seeds and seedlings using fluorescent tracers to mimic systemic agrochemicals. Soybean was used as the model as soybean has the permeable seed coat characteristic to both charged and noncharged molecules. The purpose of the paper is to (1) screen 32 fluorescent tracers and then use optimal tracers for seed and seedling uptake, (2) investigate varietal differences in seed uptake, (3) examine the distribution of tracer uptake into 14-day-old seedlings, and (4) study the relationship between seed treatment lipophilicity, measured as log P on seed and root uptake. The major chemical families that displayed both seed and seedling uptake were coumarins and xanthenes. Seed uptake of coumarin 120 ranged from 1.1% to 4.8% of the applied seed treatment tracer from 15 yellow-seeded varieties. Rhodamine B, a xanthene compound uptake in seedlings, showed translocation from the applied seed treatment to all seedling tissues. Most of the tracer was measured in the hypocotyl and root, with lesser amounts in the epicotyl and true leaves. Log P is well documented in the literature to model systemic uptake by roots, but log P of the tracers were not related to seed uptake.

1. Introduction

Crop seeds are treated commercially by the seed industry or on the farm to protect seeds and seedlings from attack by insect pests and pathogens that cause plant diseases [1]. Active seed treatment ingredients may have contact activity or be systemic in nature. Compounds with contact activity are restricted to control of pests in the immediate vicinity of the sown treated seed. In contrast, a compound with systemic activity protects in the immediate vicinity and is also translocated within the plant [2]. Thus, systemic movement allows the protection of plants during the early stages of seedling growth after emergence. The agronomic benefit of using systemic seed treatments is to reduce the need for foliar applications for early season pest management, thus avoiding a field operation that may not be possible or be delayed due to weather-related events and/or wet soils. Therefore, seed treatments are used globally for early season pest management and have less potential environmental impact than foliar applications due to lower pesticide usage per hectare [3].
The physiochemical properties required for a systemic seed treatment to permeate through the seed coat to the embryo and ultimately be taken up into the seedling and transpiring leaves are still not well understood. One pathway for systemic uptake in seeds is for a compound to diffuse through the seed coat to the embryo during imbibition. For this to occur, the seed coat must be permeable to the specific compound. Seed coat permeability has been previously investigated on several crops using fluorescent tracers [4,5,6]. Taylor et al. [5] reported that the passage of organic compounds applied as seed treatments to the embryo during imbibition is dependent on the chemical properties of the treatment and crop species. As a result of this research, crop species were grouped into three categories based on seed coat permeability, those with permeable, selectively permeable and nonpermeable seed coats [4,5]. Crops with a permeable seed-coats, including soybean (Glycine max (L.) Merr.), snap bean (Phaseolus vulgaris L.), and pea (Pisum sativum L.), were reported to be permeable to both nonionic and ionic compounds, while selectively permeable crop seeds, including corn (Zea mays L.), onion (Allium cepa L.), tomato (Solanum lycopersicum L.), and pepper (Capsicum annuum L.) were only permeable to nonionic compounds. Cucumber (Cucumis sativus L.) and lettuce (Lactuca sativa L.) seeds were categorized as having nonpermeable seed coats as they were not permeable to either nonionic or ionic charged compounds. In these experiments, systemic tracer translocation was observed under long-UV light, eliminating the use of pesticides and radioactively labeled compounds. The nine fluorescent tracers used in these experiments varied by ionic charge (nonionic, cationic, or anionic) [4,6]. Investigation of seed uptake and systemic activity using fluorescent tracers with a range of physio/chemical properties will help to expand our knowledge and utility of these tracers in seed technology research. Moreover, an expanded set of tracers could aid in understanding the relationship between seed uptake and root uptake.
Both nonionic (coumarin 151) and ionic (rhodamine B) tracers diffused from treated soybean seed, with a permeable seed coat, to the embryo after sowing in a moist medium [6]. In a separate experiment with a nonionic fluorescent tracer, coumarin 120, the maximum or saturated seed uptake of two yellow-seeded varieties was more than 50% greater than a black-seeded variety, illustrating varietal differences between genotypes [5]. Due to these varietal differences, additional research is needed to understand agrochemical uptake in seeds more fully.
The fluorescent tracer coumarin 151, used to investigate uptake into seedlings in snap bean and cucumber, was found in the xylem vessels of all seedling structures, including the roots, hypocotyl, cotyledons, petiole, and true leaves [7]. These observations indicate that systemic uptake of coumarin 151 is by apoplastic or acropetal movement. A more recent report showed uptake of rhodamine B uptake in snap bean seedlings [8]. Collectively, fluorescent tracers have great utility to assess seed coat permeability and systemic uptake into plants.
As previous research has demonstrated, fluorescent tracers are convenient tools to visualize the movement of compounds in animals, plants, and seeds for qualitative and quantitative measurements. Fluorescence imaging systems are also useful tools that can quantify excitation and emission signals over a wide range of wavelengths. The in vivo imaging system (IVIS) was developed for in vivo fluorescence and bioluminescence imaging. IVIS consists of a stationary charge-coupled device (CCD) imaging camera with illumination and a set of excitation filters from 415–760 nm in 30 nm bandwidths and a set of emission filters from 490–850 nm in 20 nm bandwidths [9]. IVIS is used in small animal imaging for nondestructive, noninvasive, internal imaging of fluorophores [10]. In addition, the IVIS spectrum system is also used in plant science research [11,12,13], and has potential for fluorescence imaging of seeds of large-seeded crops.
Several physical/chemical properties of an organic compound contribute to systemic activity and plant root uptake. Much of our understanding and rules that govern the ability for uptake was first illustrated for oral pharmaceuticals and described as Lipinski’s rule of five, or simply, the rule of five (RO5) [14]. A compound having chemical properties satisfying the RO5 has potential pharmacological or biological activity as an orally active drug in humans [14]. The RO5 approach used in pharmacology was quickly adopted with some modifications to profile agrochemical uptake, and several new “rules” were established by Briggs, Carr, Tice, and Hao, cited by Jampilek (2016) [15]. Of particular interest to seed science were the properties described by Clarke, known to influence the absorption and distribution of agrochemicals in crop plants, termed the rule of two. The parameters or criteria important for the rule of two are molecular mass from 200–400, log P ≤ 4, and hydrogen-bond donors ≤2 [15,16].
The purpose of this study is to advance the understanding of systemic seed uptake through the evaluation of fluorescent tracers representing a range of log P and electrical charge and the use of fluorescence imaging of seeds and seedlings, using soybean as the model. The specific objectives of the paper are to (1) screen a wide range of fluorescent tracers and then use optimal tracers for seed and seedling uptake, (2) investigate varietal differences in seed uptake, (3) examine the distribution of tracer uptake into 14-day-old seedlings, and (4) contrast the effect of log P on seed and root uptake.

2. Materials and Methods

2.1. Fluorescent Tracers, Seed Varieties, and Qualitative Evaluation of Fluorescent Tracer Uptake by Soybean Seed and Seedlings

Thirty-two fluorescent tracers belonging to 10 chemical families or classes were used to investigate soybean seed and seedling uptake (Table 1). Some of these tracers were both fluorescent and colored chemicals and were either purchased from Sigma-Aldrich, St. Louis, MO, and Exciton Dye Technologies, Lockbourne, OH or provided by Day-Glo Color Corp, Cleveland, OH, AaKash Chemicals, Glendale, IL, and Milliken Chemical (formerly Keystone), Spartanburg, SC. The Chemical Abstracts Service Registry Number (CAS number), log P and log D at pH 6.5, molecular weight, and the electrical charge was obtained from Chemicalize, ChemAxon’s cheminformatic tool, ([17]; Table 1). Log P and log D are the partition coefficient and distribution coefficient, respectively, and are the ratio of a compound in a mixture of water and 1-octanol at equilibrium [18]. The partition coefficient is the concentration ratio of un-ionized species of a compound, whereas the distribution coefficient refers to the concentration ratio of all species of the compound (ionized plus un-ionized). Collectively, log P and log D values are a measure of a compound’s lipophilic characteristic. Clarke’s rule of two was assessed as “yes” if in agreement with or “no” if in violation of the following criteria: molecular mass from 200–400, log P ≤ 4, and hydrogen-bond donors ≤2 [16]. Fifteen yellow seed coat soybean varieties and two black seed coat varieties were obtained from multiple sources listed in Table 2. Seeds were stored at 5 °C until used for experiments.
Seed and seedling uptake of the 32 fluorescent tracers (Table 1) were investigated with the yellow-seeded soybean variety AG1901. Each tracer was applied at a dosage of 5 mg of tracer/g seed, and 10 g seeds were treated in a 250-mL glass Erlenmeyer flask; 4 drops of water were added and mixed in the flask for 30 seconds, resulting in uniform coverage. Treated seeds were sown in silica sand (#2 Q-ROK, 0.3–1.19 mm, U.S. Silica Company, New Philadelphia, OH, USA), and water added at 20% of dry weight and maintained in a germinator at 25 °C for 12 hours in the dark. Imbibed seeds were removed, washed with deionized water, hand-dissected, and observed under long-UV (365 nm). A subset of 9 treated seeds was kept in the germinator in the dark for 4 days to evaluate fluorescence in seedlings. Nontreated seeds were sown as controls.

2.2. Fluorescence Microscopy and Quantification of Coumarin 120 Uptake by Soybean Seeds

Fluorescence microscopy was accomplished with seeds of yellow seed coat genotypes TMG 4185 and M7739 IPRO. Seeds were treated with 0.5% coumarin 120, 0.1% L650 seed treatment binder (Incotec, the seed enhancement arm of Croda, Salinas, CA), 63 mg ai/100 g seed of Thiram 42S fungicide (Bayer, RTP, NC, USA), and 4.75% deionized water (on a weight basis) and mixed in a 50-mL centrifuge tube. Six treated soybean seeds were sown in silica sand maintained at 20% moisture content and placed in a growth chamber at 20 °C for 6 hours in the dark. Imbibed seeds were then removed and washed with deionized water. Seed coats were removed by hand, and then the seeds were dissected and imaged under an Olympus microscope (SZX12, Tokyo, Japan; imaging camera Infinity3-3URC, Lumenera Corp., Ottawa, ON, Canada) and Infinity Analyze (Revision 6.5.2, Teledyne Lumenera, Ottawa, ON, Canada). Seed tissue was illuminated with a long-UV light UV lamp (Model 9-circular illuminator, Stocker & Yale, Salem, NH, USA). Seeds treated with the same formulation without coumarin 120 were used as the control.
Six soybean seeds of each variety were selected and treated with a suspension of coumarin 120 (0.065%) in a solution 4% PVA (polyvinyl alcohol) and 0.1% Triton X-100, as described by Yang et al. (2018), to quantify coumarin uptake [19]. Seeds were dried overnight, and then sown in 20% moisture content silica sand (#1 Q-ROK, 0.15–0.84 mm, New England Silica, Inc., South Windsor, CT, USA) and maintained in a germinator at 20 °C for 14 hours in the dark. Then, seeds were removed from the media, washed with deionized water, and the seed coat was removed. There were four replicates per treatment, and one seed from each replicate was ground into a fine powder with liquid nitrogen. The extraction of coumarin 120 was performed according to a procedure developed by Yang et al. (2018) [19]. Solutions of 100, 250, and 500 µg/L of coumarin 120 were prepared in acetonitrile solvent and used to make a standard curve. Fluorescence of coumarin 120 was quantified at 342 nm excitation and 409 nm emission using a luminescence spectrophotometer (LS-50B, Perkin Elmer, Shelton, CT). The extract from the nontreated seeds was used as the zero point.

2.3. Rhodamine B and Rhodamine 800 Uptake in Soybean Seed and Seedlings

Seeds of TMG 4185 (yellow seed coat) were treated with Rhodamine B (RB) and Rhodamine 800 (R800) at 0.05%, 0.1%, or 0.5% by weight, 0.1% L650 seed treatment binder, 63 mg ai/100 g seed of Thiram 42S fungicide and 4.75% deionized water (on a weight basis) and mixed in a 50-mL centrifuge tube. Treated seeds were air-dried under ambient conditions in the laboratory overnight. Seeds treated with the same seed treatment formulation, but no rhodamine compound, were planted as the control. Six treated seeds were sown in silica sand with 20% moisture content and maintained in a growth chamber at 20 ℃ for 6 hours in the dark. Imbibed seeds were removed and washed with deionized water. Seed coats were removed by hand; then, the seeds were dissected and imaged using IVIS, as described in Section 2.4.
For growth chamber studies, seeds treated with 0.05% RB by weight and nontreated seeds were sown in silica sand (#3 Q-ROK, 0.3–1.68 mm, U.S. Silica Company, Berkeley Springs, WV, USA) in 473 mL plastic cups to prevent leaching of RB from the soil medium. Plants were maintained in a growth chamber at 25/20 ℃ (14 h/10 h, day/night), with a relative humidity of 60%. A complete nutrient solution was prepared with 2.0 g Peters 5-11-26 Hydroponic Special Fertilizer (Everris NA, Dublin, OH) and 0.65 g calcium nitrate (Sigma-Aldrich chemical company, St. Louis, MO), dissolved in 1 liter of deionized water. The media was maintained at 20% moisture content throughout the growth period and checked daily. Water was initially used to moisten the silica sand to 20%, and Peters fertilizer solution was used after seedling emergence to achieve the desired nutrient level. Fourteen days after sowing, the first true leaves were fully expanded, and the seedlings were used for imaging. There were three replicates of three soybean seeds per treatment, and the experiment was conducted twice.

2.4. IVIS Imaging Rhodamine B (RB) and Rhodamine 800 (R800) Uptake in Soybean Seeds and Seedlings

Dissected control (nontreated) and RB-treated seeds were imaged with the IVIS spectrum image system (PerkinElmer, Waltham, MA, USA) using a 535 nm/620 nm excitation/emission filter and control and R800 treated seeds were imaged with a 640 nm/840 nm excitation/emission filter, with the auto exposure time mode.
The IVIS spectrum image system was also used to image fluorescent tracer uptake in 14-day-old seedlings. Nontreated and RB-treated seedlings were imaged with a 535 nm/620 nm for excitation/emission filter and 0.1 s exposure time. Seedlings were dissected to observe tracer uptake in the adaxial (upper surface of leaf) and abaxial (lower surface of leaf) sides of leaf tissue, along with the epicotyl, hypocotyl, and root tissues. Images of these plant tissues from nontreated and RB-treated seedlings were imaged under the same conditions as that of the whole seedlings. Image analysis: Living Image version 4.7.3 software was used to quantify the intensity of RB and R800 in soybean seeds and different tissues of soybean seedlings. Image adjust in Tool Palette was used to remove noise if needed; subsequently, the region of interest (ROI) in Tool Palette was used to calculate the intensity of the tracer in plant tissue. The fluorescent intensity was quantified as “total radiant efficiency”, and the intensity of the controls was subtracted from the intensity of treated samples. The ROI processing tasks in this study were accomplished in accordance with the manual (Living Image software, Caliper Life Sciences, Hopkinton, MA, USA).

2.5. Statistical Analysis

The data obtained from the coumarin 120 content in the soybean seeds study was calculated as the percent of material applied. Prior to the application of ANOVA, data were tested for normality using the goodness-of-fit test and also examined for homogeneity of variance using the Levene test. Data sets were found to normally distributed and passed the variance homogeneity test. Statistical differences were determined using one-way analysis of variance (ANOVA), followed by Tukey HSD test at the 5% level. All statistical analyses were conducted using JMP Pro 14 (SAS Institute, Cary, NC, USA).

3. Results and Discussion

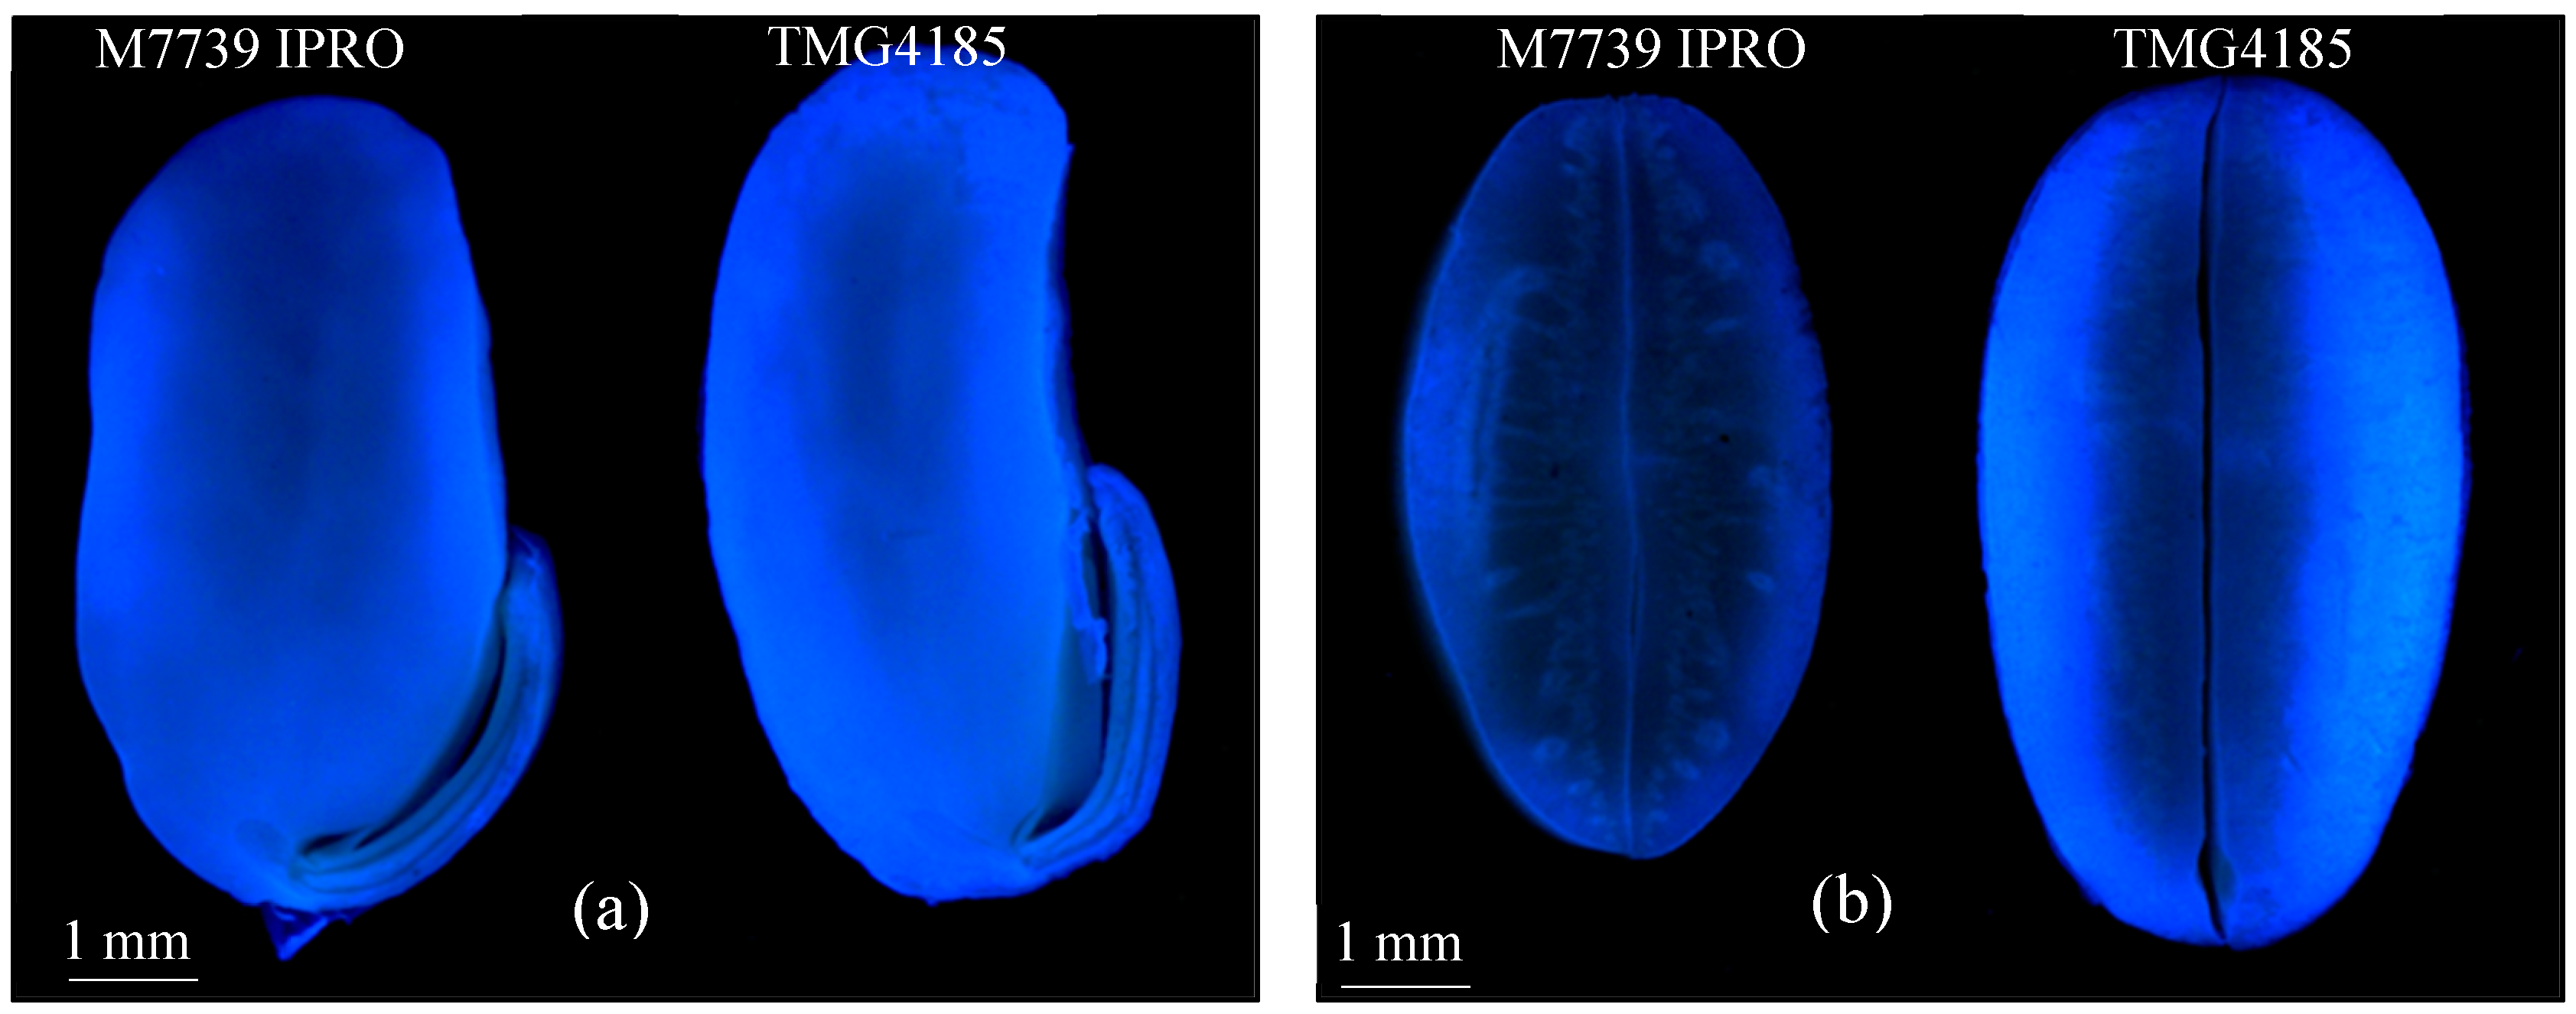
3.1. Qualitative Evaluation of Fluorescent Tracer Uptake by Soybean Seed and Seedlings

Fluorescent tracer uptake by the yellow-seeded soybean variety AG1901 seed and translocation into 4-day-old dark-grown seedlings were investigated by qualitative fluorescence observation in seed and seedling tissue (Table 3). Thirty-two tracers were grouped into 10 chemical families or classes and are listed in Table 1. This list comprises a range of fluorescent tracers of log P from –0.62 to 6.03, molecular mass from 119 to 496 (g/mol), and electrical charge characterized as anionic, cationic, nonionic, or zwitterion. When assessed by the rule of two from Clark et al. (2003) [15,16], 18 of 32 the tracers tested were in violation, and therefore half were not predicted to have systemic activity in plants.
Results from our study showed that seed uptake was observed from 18 of the 32 tracers, while 16 were taken up in both seed and seedlings (Table 3). Coumarin derivatives were one of the major chemical families, and 7 of the 16 tracers that displayed both seed and seedling uptake were coumarin compounds, and all were nonionic in nature (Table 1). Most of the coumarin compounds (i.e., coumarin 120, coumarin 151), auramine O, and 9-aminoacridine were observed in the embryonic axis. Xanthene was the other major chemical family, and three rhodamine compounds were taken up in cotyledons, each with unique properties (Table 1): RB is a zwitterion (has both positive and negative charge at pH 6.5), the RB base is nonionic with a high log P (6.13) value, and R800 is cationic and has fluorescence in near-infrared (NIR). RB, RB base, and five fluorescein derivatives were observed in the cotyledons, and most showed some degree of phytotoxicity to seedling growth. Consistent with results in this study, fluorescent seed uptake was previously observed from soybean seeds treated with coumarin 1, coumarin 151, AMCA, fluorescein, carboxyfluorescein, uranine, as well as 9-aminoacridine [6].

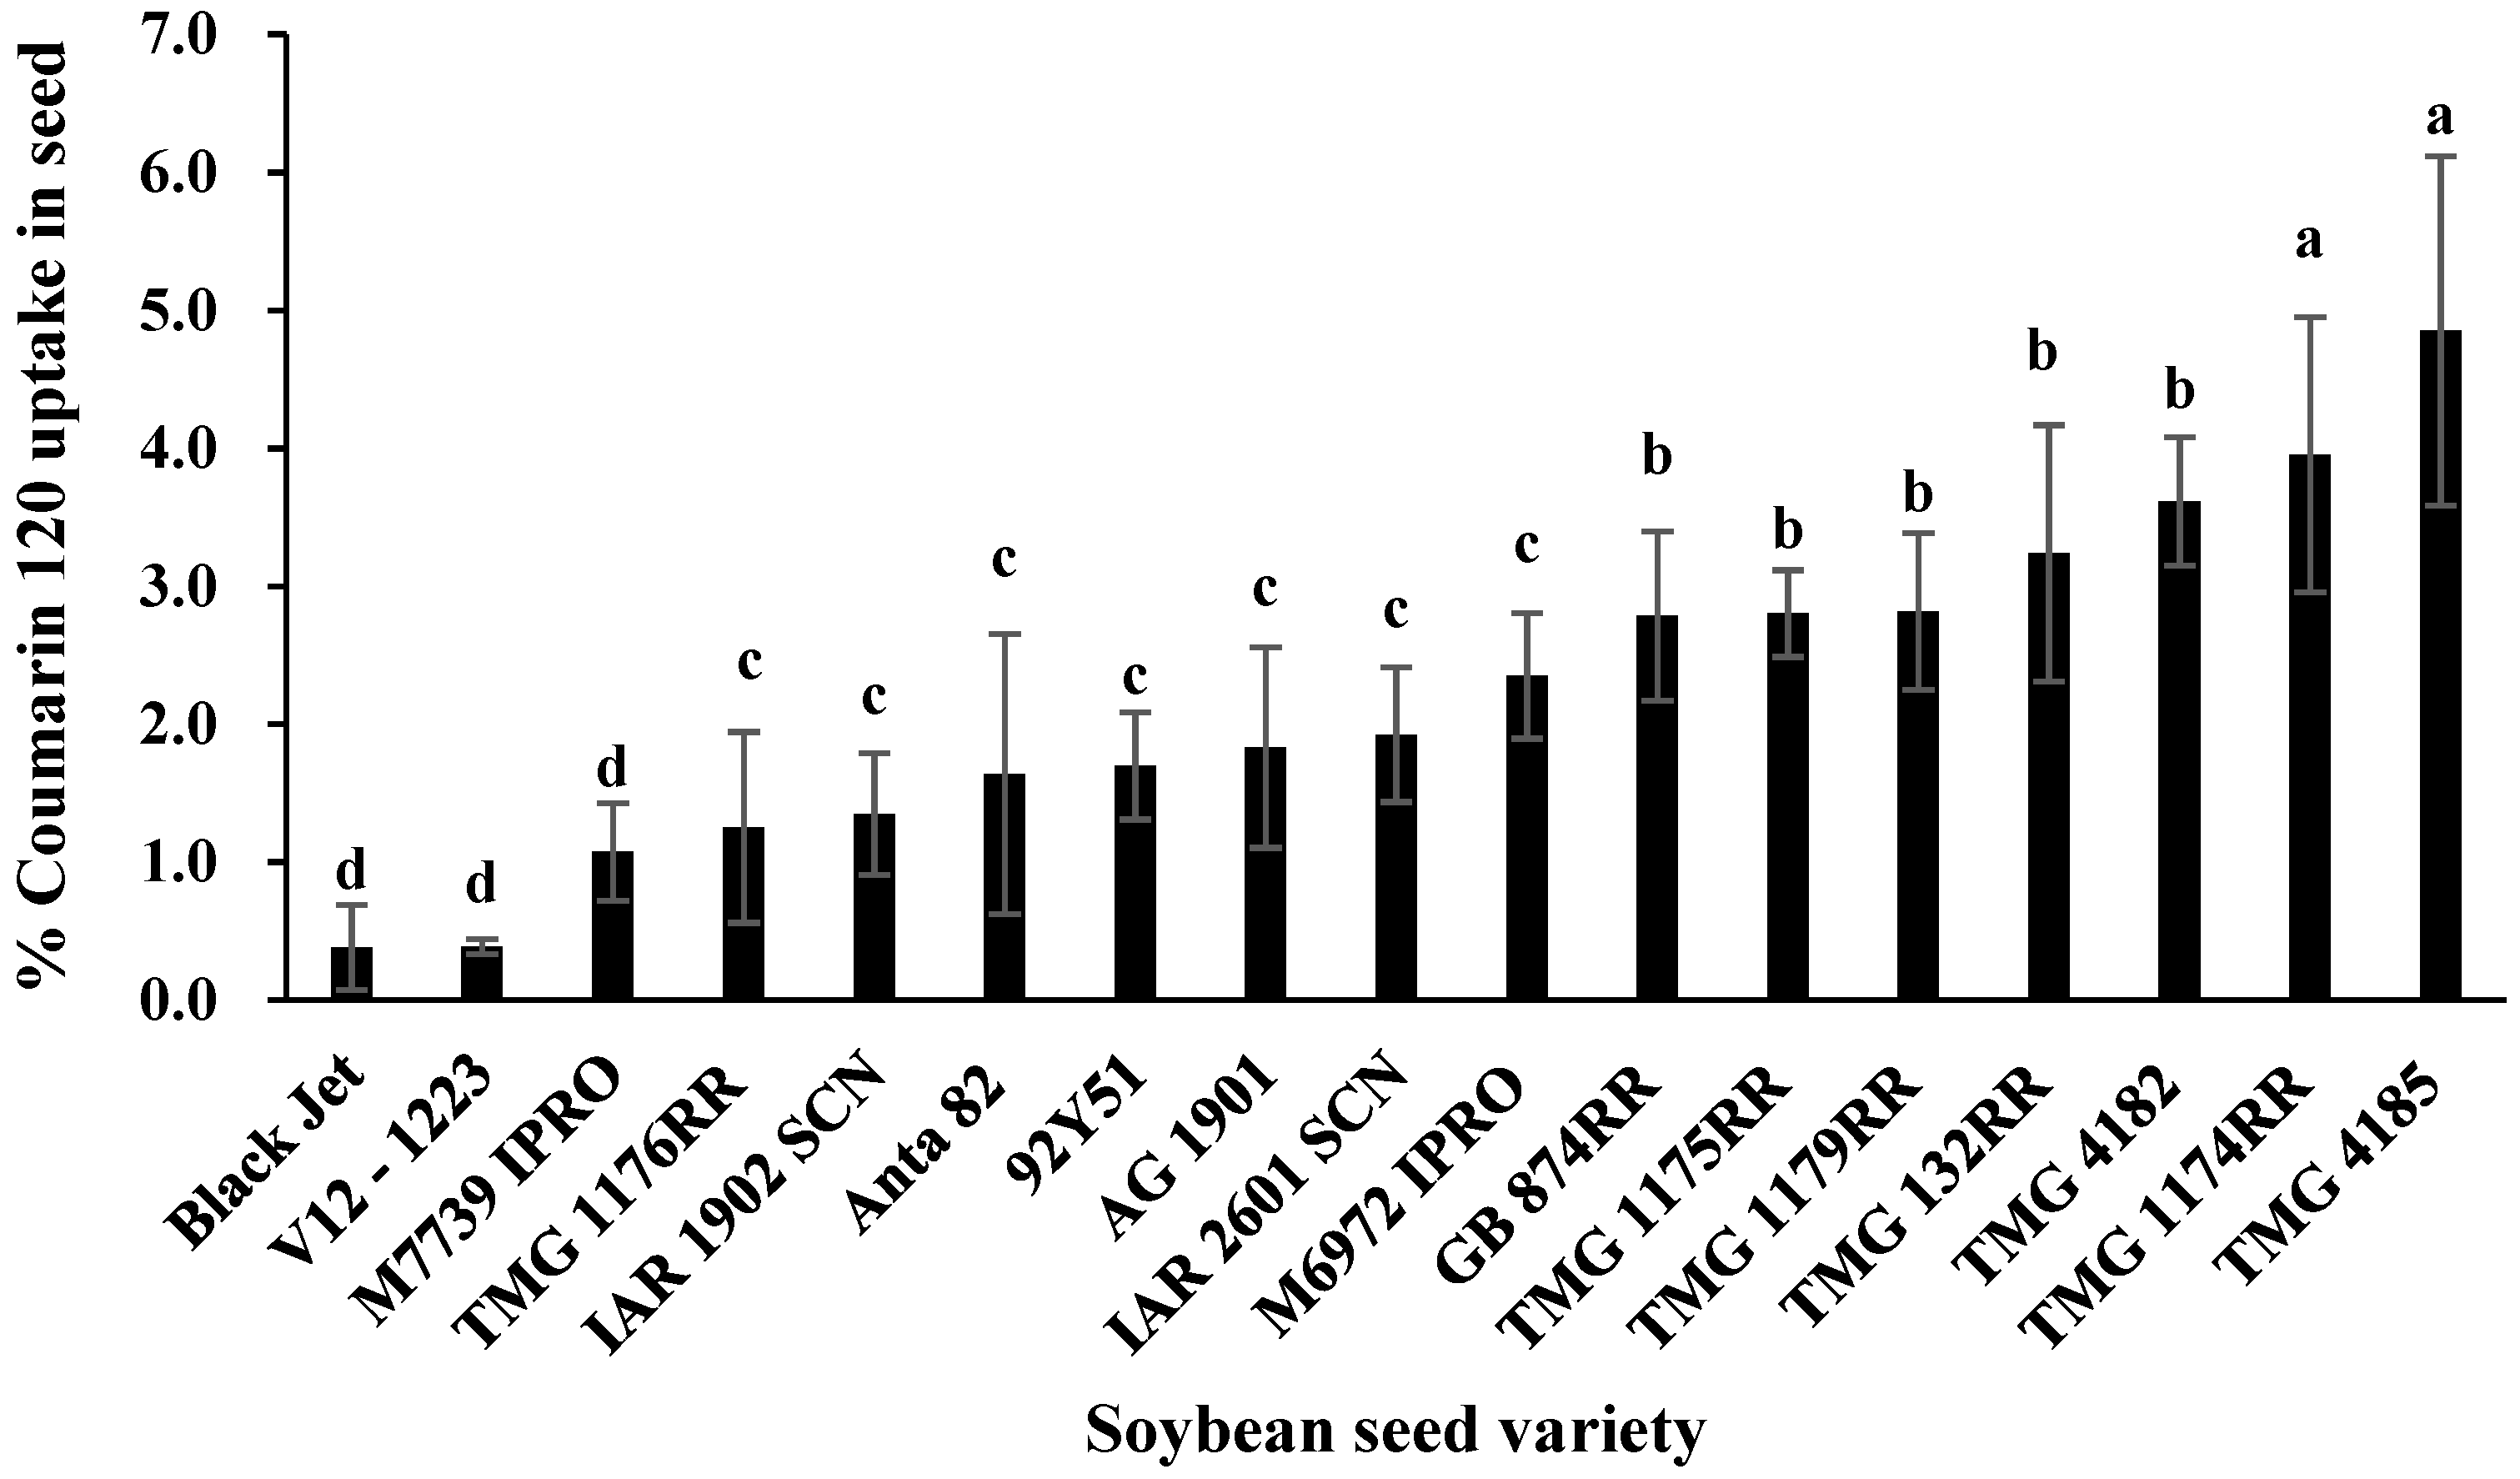
3.2. Fluorescence Microscopy and Quantification of Coumarin 120 Uptake by Soybean Seeds

Two soybean varieties, TMG 4185 and M 7739 IPRO (both yellow-seeded), were selected for observations of coumarin 120 seed uptake by fluorescence microscopy. Fluorescence intensity of coumarin 120 taken up by TMG 4185 was much greater than the fluorescence in M 7739 PRO (Figure 1), thus corroborating our previous investigations that varietal differences exist with respect to uptake in soybean [19] and corn [20].
Due to the varietal differences in seed uptake to coumarin 120, an additional 15 soybean varieties were evaluated by fluorescence microscopy and chemical extractions to quantify uptake. Coumarin translocation efficiency was calculated based on the percent of applied material as a seed treatment extracted and recovered from the embryo. The uptake efficiency of yellow-seeded varieties ranged from 1.1% to 4.8%, while the two dark-seeded varieties, Black Jet and V12-1223, had uptake <0.5% (Figure 2). Data from the yellow-seeded varieties showed that TMG 4185 and TMG 1174RR had the highest uptake efficiency, while M 7739 IPRO had the lowest uptake efficiency. The uptake efficiency of coumarin 120 in TMG 4185 was 4.5 times greater than M 7739 IPRO.

3.3. Rhodamine B (RB) and Rhodamine 800 (R800) Uptake in Soybean Seeds

Both RB and R800 were detected and imaged from soybean seeds treated with each tracer (Figure 3). Soybean seeds took up the charged molecules of RB and R800 during imbibition, which is consistent with the classification of large-seeded legumes with the permeable seed coat characteristic [5]. The IVIS images used a false color to quantify fluorescence intensity, and both rhodamine tracers showed increased seed uptake as the applied dosage increased from 0.05% to 0.5% (Figure 3). The fluorescence intensity was quantified with IVIS and expressed as “total radiant efficiency”. The total radiant efficiency was consistently greater in RB than in R800-treated seeds by 17 and 40 times at 0.05 and 0.5%, respectively. This is the first reported use of a near-infrared (NIR) fluorescent tracer in seed and seedling uptake studies, which opens the possibility for many other applications of NIR tracers in plant science research.

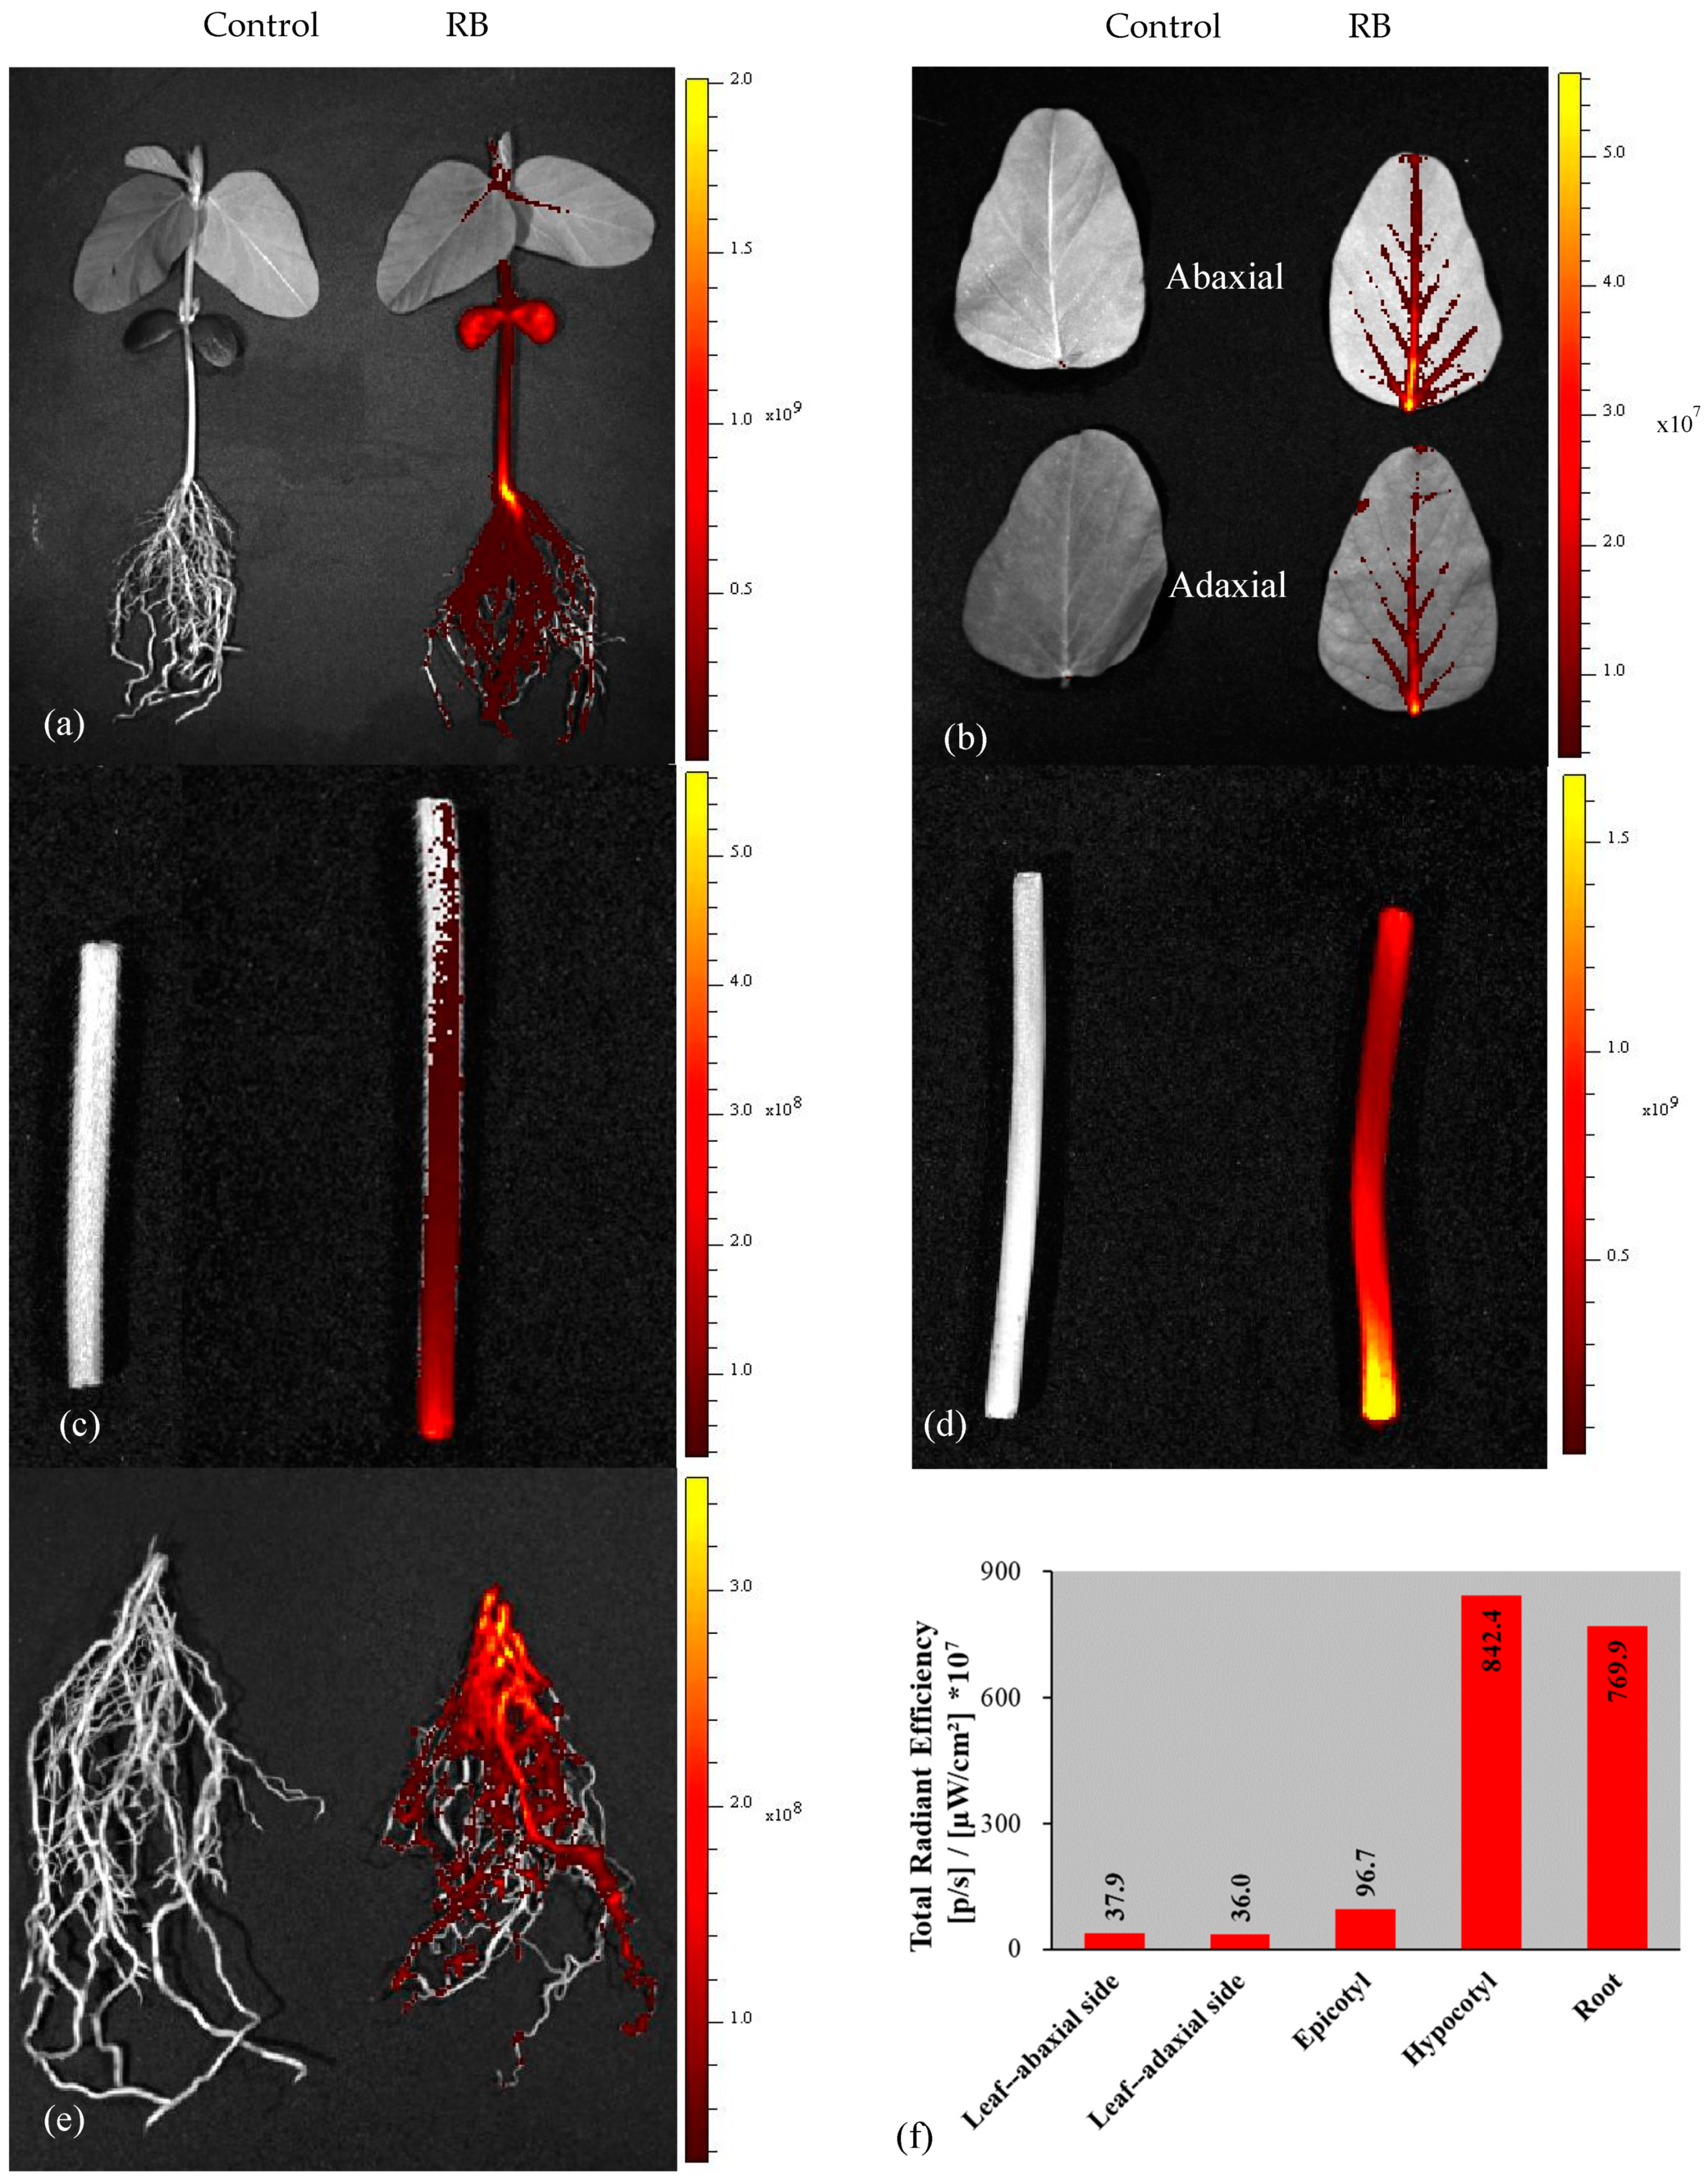
3.4. Rhodamine B Uptake and Transmission in Soybean Seedling

In previous studies, RB was found to be well suited for fluorescence imaging in seedlings. The emission and excitation wavelengths had little interference with the fluorescence spectra of chlorophyll and chlorophyll fluorescence [8]. However, RB applied to seeds at 0.1% and 0.5% by weight resulted in phytotoxicity (data not shown); therefore, the 0.05% dosage was used for all seedling-imaging studies.
RB fluorescence was observed in all seedling tissues: root, hypocotyl, cotyledon, epicotyl, and leaf (Figure 4a). The abaxial side of the leaf had greater RB fluorescence than the adaxial side, and the fluorescence was concentrated in the mid-veins (Figure 4b). RB fluorescence was greater in the lower section of the epicotyl (Figure 4c) that is adjacent to the cotyledons, as the cotyledons from the treated seed were the primary source of RB (Figure 3b). RB fluorescence was greater in the lower section of the hypocotyl (Figure 4d) near the roots and was also closer to the soil media surface. RB was observed to diffuse into the silica sand from the treated seed after sowing, and fluorescence was most concentrated in close proximity to the sown seed (not shown).
The intensity of total radiant efficiency in seedling tissues of RB was highest in the hypocotyl and root, 842.4 × 10⁷ and 769.9 × 10⁷ (p/s)/(µW/cm2), respectively (Figure 4f). The intensity of RB in the abaxial side of the leaf was slightly higher than the adaxial side of the leaf, but the intensity of RB in the leaves was about 4% compared to the hypocotyl, while the intensity of RB in epicotyl tissue was about 11% compared to the hypocotyl. Similar observations of RB fluorescence distribution were reported on snap bean seedlings [21].

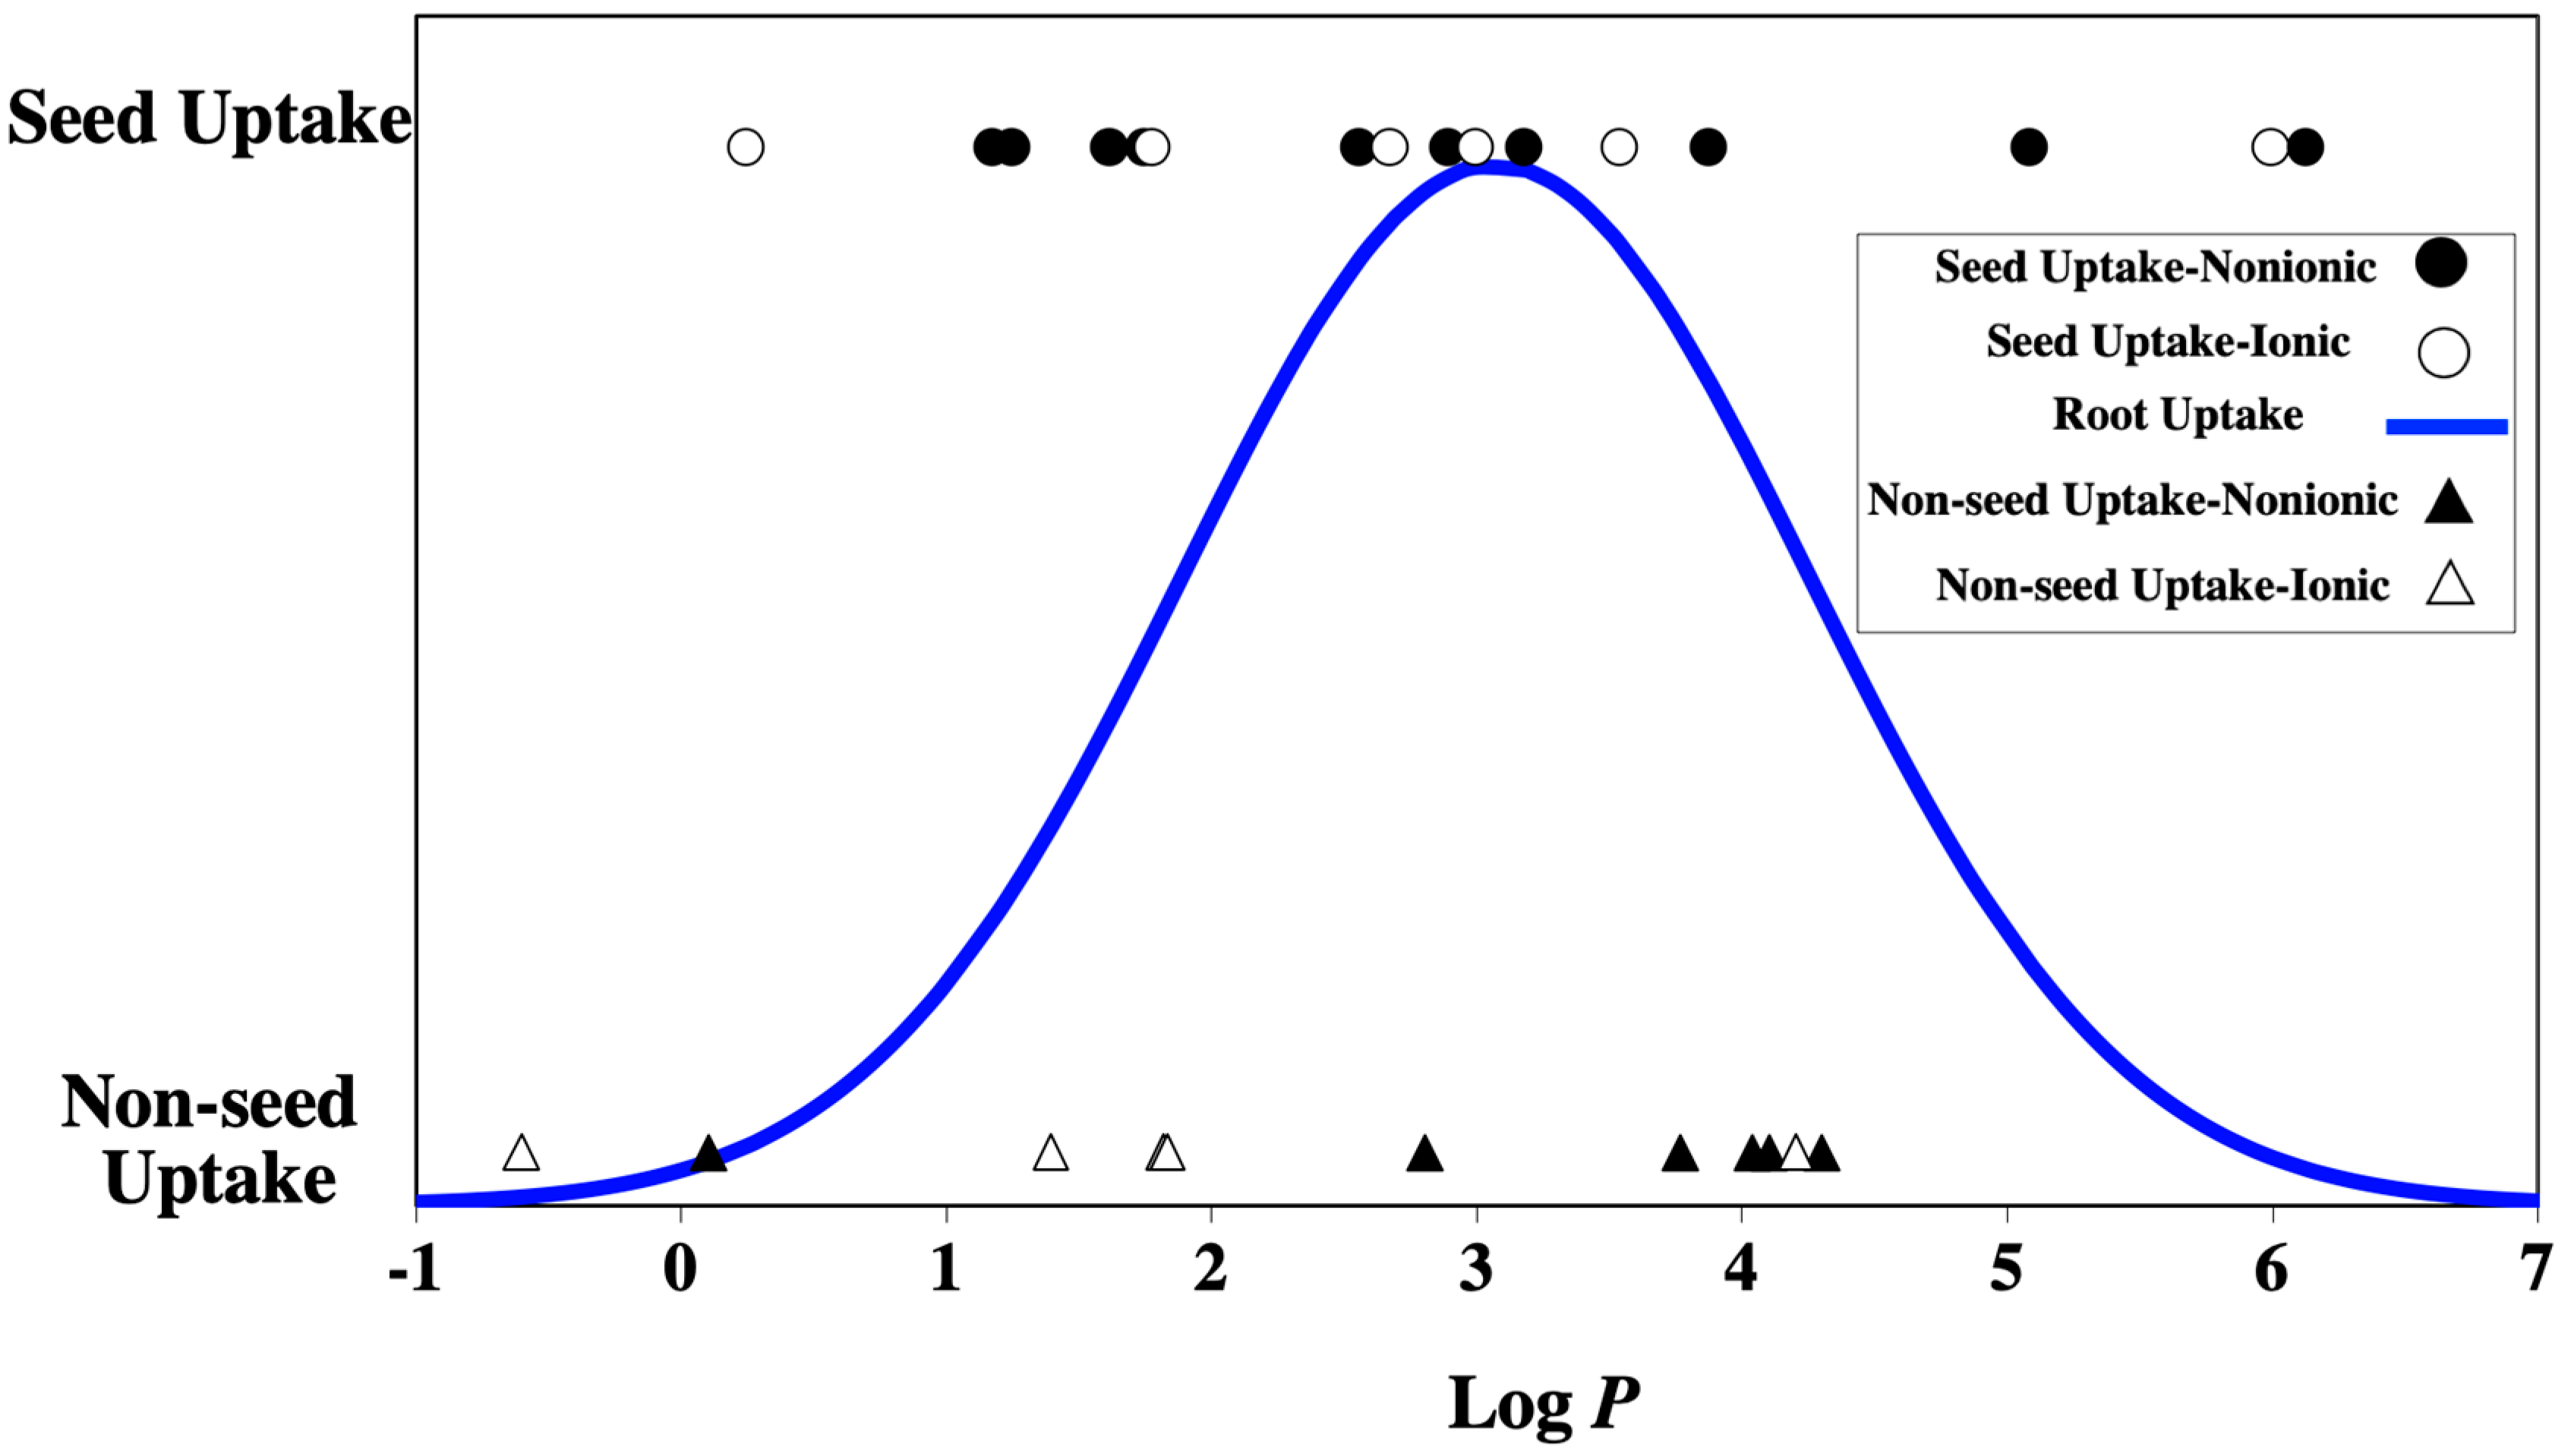
3.5. Relationship of Seed Uptake of Tracers with Systemic Agrochemicals by Roots

An understanding of the uptake of systemic seed treatments is based on the classical work conducted on barley (Hordeum vulgare L.) in the 1980s by Briggs and others [22]. The uptake, termed the transpiration stream concentration factor (TSCF), revealed a Gaussian distribution in relation to the log P of agrochemicals. This same Gaussian distribution was also documented for other crops, and the Gaussian curve for soybean [23] is shown in Figure 5. Therefore, root uptake by agrochemicals would conservatively be predicted for systemic compounds with log P >1 and log P <5. However, in the range of log P 1–5, 14 tracers revealed seed uptake, while 12 tracers were non-seed uptake, and this differential uptake of tracers was not related to electrical charge (Figure 5). The rule of two that included log P, molecular mass, and hydrogen donors only predicted with 55% accuracy those tracers that showed seed uptake (Table 1 and Table 3). However, investigating the same fluorochrome, a number of piperonyl amides applied as seed treatments were taken up by soybean seeds in the range of 0 to 4.2 log P [24]. Therefore, log P is one factor, but not the sole property responsible for seed uptake by chemically diverse tracers used in these experiments. Again, this supported that other physical/chemical properties were responsible for seed uptake and some tracers in this study acted as dyes or stains [25]. Collectively, soybean seed uptake was not related to root uptake with respect to log P of the compound.

4. Conclusions

Fluorescent tracers are powerful tools to study seed and seedling uptake but can have much broader applications in agriculture and biological science research beyond seed science. The list (Table 1) of 32 fluorescent tracers with identifying CAS number and physical/chemical properties provides a large number of tracers that can be used in future research for both fundamental and applied applications. With respect to uptake of agrochemicals by crop plants, the lipophilicity of a compound, measured as the log P, is well documented in the literature to model systemic uptake by roots [22]. Our study reveals that the log P is not the only property that can be used to predict tracer seed uptake, thus indicating that other physical/chemical properties are involved in seed uptake. RB has utility as a fluorescent tracer applied as a seed treatment that can be translocated to transpiring leaves, and it has been proposed as a systemic crop signaling system for real-time detection of crop seedlings in the field [21]. Therefore, selected fluorescent tracers have the potential for crop plant detection for enhanced pest management systems for field application. Although RB has many desirable characteristics as a tracer, the problems with phytotoxicity need to be addressed before the technology can be used in agriculture.

Author Contributions

A.G.T. conceived and supervised the project. Z.W., S.A.G.A., D.Y., and M.A. performed the research and analyzed data. Z.W. wrote the article; A.G.T. and M.A. revised the article for all authors. All authors have read and approved the final version of the manuscript.

Funding

This material is based upon work that is supported by the National Institute of Food and Agriculture, US Department of Agriculture, Multi-state Project W-3168, under accession #1007938. Funding for the senior and fourth authors was provided by the China Scholarship Council (grant no. 201808845004 and 201503250009, respectively). The IVIS spectrum optical imager was funded by Cornell University Biotechnology Resource Center (BRC) and BRC Imaging instrument grant NIH S10OD025049.

Acknowledgments

The authors thank Stephen Donovan, Michael Loos, Catharine Catranis, and Yi Qiu for helpful suggestions and for their technical assistance. We further thank Johanna M. Dela Cruz at BRC at Cornell University for her help on the use of the IVIS, and Hilary Mayton for critically reviewing the manuscript. We greatly appreciate recommendations on seed treatment binders from Incotec, and technical information on fluorescent tracers provided by Day-Glo Color Corp., AaKash Chemicals, Milliken Chemical, and Exciton Dye Technologies.

Conflicts of Interest

The authors declare no conflict of interest.

References

  1. Taylor, A.G. Seed treatments. In Encyclopedia of Applied Plant Sciences, 1st ed.; Thomas, B., Murphy, D.J., Murray, B.G., Eds.; Elsevier Academic Press: Amsterdam, The Netherlands, 2003; pp. 1291–1298. ISBN 9780122270505. [Google Scholar]
  2. Taylor, A.G. Seed Storage, Germination, Quality, and Enhancements. In Physiology of Vegetable Crops, 2nd ed.; Wien, H.C., Stuetzel, H., Eds.; CAB International: Wallingford UK, 2020; p. 496. ISBN 978-1786393777. [Google Scholar]
  3. Taylor, A.G.; Eckenrode, C.J.; Straub, R.W. Seed treatments for onions: Challenges and progress. HortScience 2001, 36, 199–205. [Google Scholar] [CrossRef] [Green Version]
  4. Salanenka, Y.A.; Taylor, A.G. Seed coat permeability: Uptake and post-germination transport of applied model tracer compounds. HortScience 2011, 46, 622–626. [Google Scholar] [CrossRef]
  5. Taylor, A.; Salanenka, Y. Seed treatments: Phytotoxicity amelioration and tracer uptake. Seed Sci. Res. 2012, 22, S86–S90. [Google Scholar] [CrossRef] [Green Version]
  6. Salanenka, Y.A.; Taylor, A.G. Uptake of model compounds by soybean, switchgrass and castor seeds applied as seed treatments. In Symposium Proceeding of Seed Production and Treatment in a Changing Environment, 2 April 2009; Alton: Hants, UK, 2009; pp. 76–81. [Google Scholar]
  7. Salanenka, Y.; Taylor, A. Seed coat permeability and uptake of applied systemic compounds. Acta Hortic. 2008, 782, 151–154. [Google Scholar] [CrossRef]
  8. Su, W.H.; Fennimore, S.A.; Slaughter, D.C. Fluorescence imaging for rapid monitoring of translocation behaviour of systemic markers in snap beans for automated crop/weed discrimination. Biosyst. Eng. 2019, 186, 156–167. [Google Scholar] [CrossRef]
  9. Living Image Software User’s Manual (Version 4.0). Available online: https://research.cchmc.org/cic/training/spectrumct_manual.pdf (accessed on 10 May 2020).
  10. Collins, J.W.; Meganck, J.A.; Kuo, C.; Francis, K.P.; Frankel, G. 4D Multimodality Imaging of Citrobacter rodentium Infections in Mice. J. Vis. Exp. 2013, 78, e50450. [Google Scholar] [CrossRef] [PubMed] [Green Version]
  11. Lin, L.C.; Hsu, J.H.; Wang, L.C. Identification of Novel Inhibitors of 1-Aminocyclopropane-1-carboxylic Acid Synthase by Chemical Screening in Arabidopsis thaliana. J. Boil. Chem. 2010, 285, 33445–33456. [Google Scholar] [CrossRef] [PubMed] [Green Version]
  12. Chen, I.-J.; Lo, W.S.; Chuang, J.Y.; Cheuh, C.M.; Fan, Y.S.; Lin, L.C.; Wu, S.J.; Wang, L.C. A chemical genetics approach reveals a role of brassinolide and cellulose synthase in hypocotyl elongation of etiolated Arabidopsis seedlings. Plant. Sci. 2013, 209, 46–57. [Google Scholar] [CrossRef] [PubMed] [Green Version]
  13. Xu, X.; Miller, S.A.; Baysal-Gurel, F.; Gartemann, K.H.; Eichenlaub, R.; Rajashekara, G. Bioluminescence Imaging of Clavibacter michiganensis subsp. michiganensis Infection of Tomato Seeds and Plants. Appl. Env. Microbiol. 2010, 76, 3978–3988. [Google Scholar] [CrossRef] [PubMed] [Green Version]
  14. Lipinski, C.; Lombardo, F.; Dominy, B.W.; Feeney, P.J. Experimental and computational approaches to estimate solubility and permeability in drug discovery and development settings. Adv. Drug Deliv. Rev. 2001, 46, 3–26. [Google Scholar] [CrossRef]
  15. Jampílek, J. Potential of agricultural fungicides for antifungal drug discovery. Expert Opin. Drug Discov. 2015, 11, 1–9. [Google Scholar] [CrossRef] [PubMed] [Green Version]
  16. Clarke, E.D.; Delaney, J. Physical and Molecular Properties of Agrochemicals: An Analysis of Screen Inputs, Hits, Leads, and Products. Chim. Int. J. Chem. 2003, 57, 731–734. [Google Scholar] [CrossRef]
  17. ChemAxon. Available online: https://chemicalize.com (accessed on 9 May 2020).
  18. Kwon, Y. Partition and Distribution Coefficients. In Handbook of Essential Pharmacokinetics, Pharmacodynamics and Drug Metabolism for Industrial Scientists; Kluwer Academic/Plenum Publishers: New York, NY, USA, 2001; p. 44. ISBN 978-1-4757-8693-4. [Google Scholar]
  19. Yang, D.; Avelar, S.A.G.; Taylor, A.G. Systemic Seed Treatment Uptake during Imbibition by Corn and Soybean. Crop. Sci. 2018, 58, 2063–2070. [Google Scholar] [CrossRef]
  20. Diaz, M.; Taylor, A.; Cicero, S.M. Uptake of systemic seed treatments by maize evaluated with fluorescent tracers. Seed Sci. Technol. 2014, 42, 101–107. [Google Scholar] [CrossRef]
  21. Su, W.H.; Fennimore, S.A.; Slaughter, D.C. Development of a systemic crop signalling system for automated real-time plant care in vegetable crops. Biosyst. Eng. 2020, 193, 62–74. [Google Scholar] [CrossRef]
  22. Briggs, G.G.; Bromilow, R.H.; Evans, A.A. Relationships between lipophilicity and root uptake and translocation of non-ionized chemicals by barley. Pestic, Sci. 1982, 13, 495–504. [Google Scholar] [CrossRef]
  23. Hsu, F.C.; Marxmiller, R.L.; Yang, A.Y.S. Study of Root Uptake and Xylem Translocation of Cinmethylin and Related Compounds in Detopped Soybean Roots Using a Pressure Chamber Technique. Plant. Physiol. 1990, 93, 1573–1578. [Google Scholar] [CrossRef] [PubMed] [Green Version]
  24. Yang, D.; Donovan, S.; Black, B.C.; Cheng, L.; Taylor, A.G. Relationships between compound lipophilicity on seed coat permeability and embryo uptake by soybean and corn. Seed Sci. Res. 2018, 28, 229–235. [Google Scholar] [CrossRef]
  25. Green, F.J. The Sigma-Aldrich Handbook of Stains, Dyes and Indicators; Alderich Chemical company, Inc.: Milwaukee, WI, USA, 1990; ISBN 0-941633-22-5. [Google Scholar]
Figure 1. Fluorescence microscopy image of coumarin 120 uptake in low (M7739 IPRO) and high (TMG4185) soybean seed coat permeability varieties: respectively, (a) longitudinal section; (b) cross-section.
Agriculture 10 00248 g001
Figure 2. Seed uptake efficiency (percent uptake based on the total amount of coumarin 120 (C120) applied as a seed treatment) in 17 soybean varieties. Means for soybean seed varieties with the same letter are not significantly different from each other (Tukey HSD test, P < 0.05). Bars represent standard error of the mean.
Agriculture 10 00248 g002
Figure 3. Rhodamine B and rhodamine 800 uptake in yellow soybean seed variety TMG 4185 applied at different concentrations of (a) rhodamine 800, (b) rhodamine B. Imaging was done under the in vivo imaging system (IVIS).
Agriculture 10 00248 g003
Figure 4. Imaging of rhodamine B (RB) uptake in soybean seedlings under the in vivo imaging system (IVIS): (a) whole plant, (b) leaf, (c) epicotyl, (d) hypocotyl, (e) root, and (f) fluorescence intensity in different parts of soybean seedling.
Agriculture 10 00248 g004
Figure 5. The log P and electrical charge of 32 tracers in relation to qualitative seed uptake or nonseed uptake. The blue line represents Gaussian distribution for systemic root uptake adapted from Hsu et al., 1990 [23].
Agriculture 10 00248 g005
Table 1. List of 32 fluorescent and/or colored tracers grouped by chemical family/class, chemical name, Chemical Abstracts Service Registry Number (CAS number), log P or log D at pH 6.5, molecular weight (MW), compliance with the rule of two, and electrical charge at pH 6.5. Values obtained from the Chemicalize database [17], in compliance with the rule of two with the following parameters or criteria: molecular mass from 200–400, log P ≤ 4, and hydrogen-bond donors ≤2 [15].
Chemical Family/ClassChemical NameCAS NumberLog P/Log DMW (g/mol)Rule of TwoElectrical Charge
Acridine9-Aminoacridine hydrochloride hydrate52417-22-82.68/1.01248.7YesCationic
Arylmethane DyeAuramine O2465-27-23.66/0.34303.8YesCationic
Crystal Violet548-62-91.39408.0NoCationic
Azine DyeNeutral Red553-24-22.85288.8YesNonionic
Benzotriazole1,2,3-Benzotriazole95-14-71.30119.1NoNonionic
BenzoxathiolePhenol Red143-74-84.11354.4NoNonionic
Coumarin7-Amino-4-Methyl-3-coumarinylacetic Acid (AMCA)106562-32-70.25/–1.76233.2YesAnionic
3-(Benzoxazolyl-2’)-7-diethylaminocoumarin 35773-42-34.00334.4YesNonionic
Coumarin 91-64-51.78146.1NoNonionic
Coumarin 191-44-12.90231.3YesNonionic
Coumarin 12026093-31-21.25175.2NoNonionic
Coumarin 15153518-15-31.62229.2YesNonionic
Coumarin 15253518-14-22.56257.2YesNonionic
Coumarin 31455804-66-53.18313.3YesNonionic
o-Coumaric Acid614-60-81.83/–0.77164.2NoAnionic
m-Coumaric Acid588-30-71.83/–0.79164.2NoAnionic
6,7-Dihydroxy coumarin305-01-11.18/1.16178.1NoNonionic
NaphtalimideFluorescent Brightener 1623271-05-41.75241.2YesNonionic
Solvent Yellow 13152821-24-60.12328.4NoNonionic
Solvent Yellow 4319125-99-64.03324.4NoNonionic
Solvent Yellow 442478-20-83.76316.4YesNonionic
Pyrimidine AnthroneSolvent Red 14921295-57-84.30358.4NoNonionic
ThiazineMethylene Blue122965-43-9–0.62337.9YesCationic
Xanthene5(6)-Carboxy-fluorescein72088-94-93.54/0.92376.3NoAnionic
2′.7′-Dichloro-fluorescein76-54-05.09/4.99401.2NoNonionic
Fluorescein2321-07-53.88332.3YesNonionic
Fluorescein sodium salt518-47-83.01/–0.11376.3YesAnionic
Pyronin Y92-32-04.23302.8NoCationic
Rhodamine 800101027-54-76.03496.0NoCationic
Rhodamine B81-88-91.78/2.34479.0NoZwitterion
Rhodamine B base509-34-26.13442.6NoNonionic
Uranine K6417-85-23.01/–0.11408.5NoNonionic
Table 2. Soybean genotypes, the origin of production and seed source maturity group (MG), thousand-seed weight in grams (TSW) used to evaluate seed coat permeability to fluorescent tracers, and seed coat color (SCC).
GenotypeOriginBreeder/SourceMGTSWSCC
92Y51United StatesPioneer Hi-Bred International,2.5174.5Yellow
AG1901United StatesAsGrow Seed Company1.9165.2
Anta 82 BrazilTMG, Fundação MT, UNISOJA7.4109.7
GB 874RRBrazilMONSOY LTDA8.7143.3
IAR 1902 SCNUnited StatesIowa State University Research Foundation1.9146.7
IAR 2601 SCNUnited StatesIowa State University Research Foundation2.6168.0
M6972 IPROBrazilMONSOY LTDA6.9158.9
M7739 IPROBrazilMONSOY LTDA7.7150.0
TMG 1174RRBrazilTMG, Fundação MT, UNISOJA8.2118.2
TMG 1175RRBrazilTMG, Fundação MT, UNISOJA7.4128.8
TMG 1176RR BrazilUNISOJA S/A7.5111.1
TMG 1179RRBrazilTMG, Fundação MT, UNISOJA7.6129.3
TMG 132RRBrazilTMG, Fundação MT, UNISOJA7.9144.4
TMG 4182BrazilTMG, Fundação MT, UNISOJA8.5148.9
TMG 4185BrazilTMG, Fundação MT, UNISOJA8.5150.4
Black JetUnited StatesJohnny’s Selected SeedN/A356.0Black
V12-1223United StatesVirginia TechN/A169.5
Table 3. Fluorescent chemical family/class, chemical name, and seed and seedling response from the application of tracers taken up by seeds and seedlings.
Chemical Family/ClassChemical NameSeedSeedlingsNote
Acridine9-Aminoacridine Hydrochloride Hydrateblue-embryo axisblue
Arylmethane DyeAuramine Oyellow-embryo axis-High phytotoxicity to seeds and seedlings: Delayed germination, shortening and thickening of hypocotyls
Coumarin7-Amino-4-Methyl-3-Coumarinylacetic Acid (AMCA)blue-embryo axisblue
Coumarin 1blue-embryo axisblueSeedlings roots showing negative geotropism; hypocotyl and epicotyl shortening
Coumarin 120blue-embryo axis blue
Coumarin 151yellow green-embryo axisyellow green
Coumarin 152 light green-embryo axisgreen
Coumarin 314green-cotyledonsgreen
6,7-Dihydroxy coumaringreen-cotyledonswhite
Naphtali-mideFluorescent Brightener 162light green-cotyledons-
Xanthene5(6)-Carboxy-Fluoresceinyellow-cotyledonsyellow
2′,7′-Dichloro-Fluoresceinyellow-cotyledonsyellowNegative geotropism in seedlings
Fluoresceinyellow-cotyledonsyellowSeedlings non-uniform height
Fluorescein sodium saltyellow-cotyledonsyellowSeedlings roots showed negative geotropism; seedlings non-uniform height
Rhodamine 800NIRNIR
Rhodamine Bred-cotyledonsredSeedlings roots showed negative geotropism
Rhodamine B basered-cotyledonsredSeedlings roots showed negative geotropism
Uranine Kyellow-cotyledonsyellowSeedling non-uniform height

