Article

Glyphosate and Saflufenacil: Elucidating Their Combined Action on the Control of Glyphosate-Resistant Conyza bonariensis

1
Department of Crop Protection, Federal University of Pelotas, Pelotas, RS 96160-000, Brazil
2
Department of Plant Sciences, University of Tennessee, Knoxville, TN 37996, USA
3
Department of Plant Breeding, Federal University of Pelotas (UFPel), Pelotas, RS 96010-610, Brazil
4
Department of Weed Science, Brazilian Agricultural Research Corporation (EMBRAPA), Passo Fundo, RS 99050-970, Brazil
*
Author to whom correspondence should be addressed.
Agriculture 2020, 10(6), 236; https://doi.org/10.3390/agriculture10060236
Submission received: 4 June 2020 / Revised: 14 June 2020 / Accepted: 15 June 2020 / Published: 18 June 2020
(This article belongs to the Section Crop Protection, Diseases, Pests and Weeds)

Abstract

:
Synergic effects of glyphosate and saflufenacil have been reported to control Conyza spp. However, the mechanism of this synergic combination is unknown. The objectives of this study were to investigate the effects of the combination of glyphosate and saflufenacil on the control and resistance status of glyphosate-resistant (GR) C. bonariensis, as well as on oxidative stress and lipidic peroxidation. Glyphosate-resistant and glyphosate-sensitive (GS) biotypes were treated with different rates of saflufenacil, glyphosate, and glyphosate combined with saflufenacil. The combination of glyphosate (1480 g ae ha−1) and saflufenacil (≥15 g ha−1) presented the best control of GR plants compared with their individual effects. It also reduced the resistance factor from 19.6 to 4.6 (4.3-fold) and represents a good alternative for resistance management. The combination of glyphosate and saflufenacil resulted in higher oxidative stress and lipidic peroxidation compared with the effects of either herbicide alone. The oxidative stress and lipid peroxidation promoted by the combination of the herbicides occurred earlier after treatment and remained at higher levels over a longer period (12–192 h) compared with their individual results. The combined oxidative stress and lipid peroxidation at high levels over a long time is likely to be one reason that the combination of glyphosate and saflufenacil effectively controls GR C. bonariensis.

1. Introduction

Weeds are historically one of the main factors that negatively affect crop yield worldwide [1]. The interference of weeds with crops reduces the yield quantity and quality and, consequently, food availability, which causes an unparalleled economic impact downstream in the productive agricultural chain. In general, it is estimated that non-controlled weeds reduce about 50% of major crop yields (soybean, rice, corn, etc.) [2].
Weed control has been performed over the past two decades by mainly using herbicides [3]. The repetitive application of herbicides—in general, with the same mechanism of action—has led to the selection of naturally resistant variants of several weed species [4,5]. The evolution of weeds to acquire herbicide resistance has hindered weed control, increased crop yield losses, and increased the expenditure of money on alternative herbicides for their control [6,7,8]. It is estimated that the additional costs of herbicide-resistant weeds in soybean are as high as US$210 per hectare in the United States [7].
Glyphosate-resistant (GR) weeds are the fourth most reported herbicide-resistant (HR) weeds by site of action in the world, with 48 listed species [9]. This is due to glyphosate’s wide utilization since 1974, which intensified after 1996 with the introduction of GR crops [3]. Weeds from the Conyza genus are among the most widespread economically significant GR weeds in the world [10]. Horseweed (C. canadensis) was the first dicot GR weed reported in a GR crop (soybean) and was first found in the USA [11].
In Brazil, horseweed and hairy-fleabane (C. bonariensis) were first reported as GR weeds in 2005 [12], followed by Sumatran fleabane (C. sumatrensis) in 2010 [9]. Despite the importance of all Conyza species in Brazilian agricultural fields, molecular analyses demonstrated that GR C. bonariensis predominates in Southern Brazil [13]. Currently, the estimated area of GR Conyza spp. in Brazil is approximately 8 million hectares, and the additional costs of its control are about US$200–340 million (R$1–1.7 billion) yearly [8,14]. Non-target site resistance (NTSR) mechanisms are responsible for conferring glyphosate resistance in C. bonariensis. The NTSR mechanisms involve metabolic processes such as oxidation, conjugation, transport, degradation, and protection against oxidative stress by the antioxidant system [15,16].
The evolution of GR weeds has made the control of C. bonariensis using glyphosate alone less efficient. Additionally, GR weeds have increased the costs of control since they require multiple applications of different herbicides. The combination of synergic herbicides with glyphosate is a good strategy to control GR Conyza. One option for combination with glyphosate is saflufenacil, which has been reported to provide synergic effects to control C. bonariensis [17,18,19]. The application of saflufenacil (50 g ha−1) combined with glyphosate, 2,4-D, and chlorimuron has presented the best results in terms of technical effectiveness and economic returns among 18 other herbicide combinations for GR C. bonariensis management in soybean in Brazil [20].
Saflufenacil—a pyrimidinedione chemical-class herbicide—inhibits the enzyme protoporphyrinogen IX oxidase (PPO) [21]. The inhibition of PPO prevents the biosynthesis of pigments such as chlorophylls, hemes, and cytochromes [22]. The enzyme PPO catalyzes the conversion of protoporphyrinogen IX (Protogen IX) to protoporphyrin IX (Proto IX) in chloroplasts and mitochondria [22]. As a result of PPO inhibition, Protogen IX accumulates and diffuses from plastids and mitochondria to the cytosol. In the cytosol, Protogen IX is oxidated to Proto IX. After light exposure, cytosolic Proto IX interacts with oxygen and produces reactive oxygen species (ROS), which causes the peroxidation of the cell membranes and, ultimately, cell death [21,23,24].
Glyphosate’s action is well known to directly inhibit the enzyme 5-enolpyruvylshikimate-3-phosphate synthase (EPSPS), blocking the shikimic acid pathway and the biosynthesis of aromatic amino acids (tryptophan, phenylalanine, and tyrosine) [23,25]. The obstruction of the shikimic acid pathway leads to the accumulation of shikimic acid and reducing power (NADPH+H) [26]. The accumulation of shikimic acid and energy in the chloroplasts leads to ROS overproduction, oxidative stress, lipidic peroxidation, and cell death [23,27]. Additionally, glyphosate indirectly disrupts the electron flow in photosystem II (PSII). Plastoquinone—an electron acceptor in the PSII—requires tyrosine for its regeneration. Since tyrosine is not produced after the interruption of the shikimic acid pathway, there is no regeneration of plastoquinone, resulting in energy accumulation and, consequently, ROS overproduction and lipid peroxidation [23].
The isolated effects of saflufenacil and glyphosate lead to ROS overproduction. The action of saflufenacil starts in the cytosol, whereas that of glyphosate starts in the chloroplasts of sensitive plants [21,23]. Thus, the present study hypothesized that combining glyphosate and saflufenacil would increase ROS production as well as oxidative stress and improve the control of GR C. bonariensis. Therefore, the objectives of the current work were to investigate the effects of the combination of glyphosate and saflufenacil on the control, glyphosate-resistance status, ROS production, and oxidative stress in GR and GS biotypes of C. bonariensis.

2. Material and Methods

2.1. Biotype Selection, Plant Growth, and Herbicide Treatments

Two biotypes of C. bonariensis were used: B11R glyphosate-resistant (GR) and B17S glyphosate-sensitive (GS). These biotypes came from the same geographical region of Pelotas, RS, Brazil, and their resistance to glyphosate has been previously characterized [16]. Seeds of each biotype were germinated in trays containing a 3:1 mix of sterilized soil and commercial substrate (Mac plant, Mec Prec, Telêmaco Borba, PR, Brazil). Thirty days after emergence (30 DAE), three seedlings were transplanted in 2 L pots containing the same soil/substrate mix described above. Plants were kept in a greenhouse at 30 °C/20 °C day/night (±4 °C) with a 12-h photoperiod and were watered daily. Thirty days after transplant (60 DAE; rosette stage—plants of 6–8 cm in diameter), plants were treated with herbicides using a CO2-pressurized backpack sprayer to deliver 150 L ha−1. Two sets of the same experiments were performed at the same time and under the same conditions: one for dose–response evaluations and another for time-course plant metabolism assessment.
The herbicide dose–response experiments were performed with a completely randomized design with four replicates (three plants formed each replicate). The herbicide treatments consisted of saflufenacil, glyphosate, and the combination of glyphosate and saflufenacil:
(1)
Saflufenacil (Heat® 700 g active ingredient (a.i.) kg−1; BASF, São Paulo, SP, Brazil): 0; 3.75; 7.5; 15; 30; 60; 120 g ha−1;
(2)
Glyphosate (Roundup Original® DI 370 g acid equivalent (ae) L−1; Monsanto, São Paulo, SP, Brazil): 0; 185; 370; 740; 1480; 2960; 5920; 11,840; and 23,680 g ae ha−1;
(3)
Glyphosate and saflufenacil: glyphosate 1480 g ae ha−1 plus one of the following saflufenacil rates: 3.75, 7.5, 15, 30, 60, or 120 g ha−1 per treatment. A treatment control without herbicide was added.
Adjuvants were added according to the manufacturers’ recommendations on the product labels.
The control of treated plants was visually evaluated at 7, 14, 21, and 28 days after treatment (DAT) and compared with untreated plants. For the assessment, 0% indicated no herbicide effects, while 100% indicated plant death. The harvest of the total plant biomass (shoot and roots) was performed at 28 DAT. It is common to observe the regrowth of plants after the application of saflufenacil alone, indicating its reduced effects on the plant’s root system; therefore, we considered both roots and shoots in biomass assessments. The biomass was dried at 60 °C for 5 days and then weighed, and then we determined the dry weight reduction compared with a non-treated control treatment. The non-linear regression log-logistic model was implemented to obtain the dose–response curves for the total dry biomass experiments:
y = C + (D − C)/[1 + (x/GR50) b]
where C is the lower limit, D is the upper limit, GR50 is the herbicide dose necessary to reduce the dry weight by 50%, and b is the slope at the GR50.
The software Sigma Plot® (version 12.5, SPSS Inc., Chicago, IL, USA) was used to calculate the regression parameters, which were used to calculate the GR50. The resistance factor (RF) was obtained by dividing the GR50 of GR biotypes by GS (GR GR50/GS GR50). Using the regression models for biomass reduction and control, we estimated the results of applying saflufenacil, glyphosate only at 1480 g ae ha−1, and the combination of glyphosate at 1480 g ae ha−1 and different rates of saflufenacil. These results reveal the effects of the combination of glyphosate and saflufenacil compared with their individual effects.

2.2. Time-Course Plant Metabolism Bioassays

Time-course experiments were performed to evaluate alterations in plant metabolism after the herbicide treatments by measuring shikimic acid content, oxidative stress (hydrogen peroxide, H2O2, which is a type of reactive oxygen species, ROS), and lipid peroxidation (cell tissue damage) [24]. Metabolism bioassays were performed in a completely randomized design arranged in a three-factorial scheme with five technical replicates (each technical replicate comprised five plants):
(1)
Saflufenacil: 2 × 7 × 9;
(2)
Glyphosate: 2 × 9 × 9;
(3)
Glyphosate + saflufenacil: 2 × 7 × 9.
The first factor comprised two C. bonariensis biotypes (GR and GS), the second factor was formed by the herbicide dosages studied (please see Section 2.1), and the third factor was nine time-points measured in hours after herbicide treatment (HAT). The tissue collection was performed at 0, 12, 24, 48, 96, 192, 288, 504, and 672 HAT (28 DAT). The shikimic acid content, H2O2, and thiobarbituric acid-reactive species (TBARS) analyses were performed with five technical replicates per treatment; each technical replicate came from a pool of five plants. At each time, tissue samples were randomly collected from the half-superior part of GR and GS plants in each respective treatment, and samples were immediately frozen in liquid nitrogen and then stored at −80 °C. The tissue collected was used for the following analyses.

2.3. Whole-Plant Shikimic Acid Bioassay

The shikimic acid content (SAC) bioassay was performed following the Singh and Shaner [28] and Perez-Jones [29] methods with modifications published previously for C. bonariensis [16]. A total of 0.25 g of fresh weight samples harvested from leaves was chopped and homogenized in 5 mL of 1.25 N HCl solution and frozen at −80 °C. Samples were kept at room temperature (22 °C) for approximately 15 min and then incubated at 37 °C for 45 min in a water bath. A volume of 125 µL per technical sample (total of five technical samples) was collected and mixed with the reaction buffer [0.25% (w/v) periodic acid and sodium(meta)periodate solution] and incubated at 37 °C for 30 min. This reaction leads to the oxidation of shikimic acid. An aliquot of 1000 µL of 0.6 N NaOH/0.22 M Na2SO3 was added to the sample after incubation. After that, the shikimic acid was measured spectrophotometrically at 380 nm using a cuvette, and the SAC was determined using a standard curve in µg.g−1 fresh weight (µg g−1 FW).

2.4. Oxidative Stress and Lipid Peroxidation

The oxidative stress was determined according to the levels of hydrogen peroxide (H2O2) [30]. The lipid peroxidation assay was performed through the analysis of thiobarbituric acid-reactive species (TBARS). This method measures the accumulation of malondialdehyde (MDA), which is a product of lipid peroxidation [31]. Tissue samples from five plants were pooled, processed in a mortar with liquid nitrogen, and homogenized. Ten milliliters of 0.1% trichloroacetic acid (TCA) solution was added to 1 g of processed tissue, vortexed for 30 s, and then centrifuged at 14,000 rpm for 25 min at 4 °C. The supernatant was collected, and 0.2 mL per technical replicate was retained for H2O2 determination, while 0.5 mL per technical replicate was used for TBARS. For H2O2 determination, 0.2 mL of supernatant was mixed with 0.8 mL of phosphate buffer (10 mM, pH 7.0) and 1.0 mL of potassium iodide (1 M) and kept at room temperature for 10 min. The absorbance was recorded at 390 nm, and the H2O2 concentration was determined according to a standard curve and expressed in millimoles per gram of fresh weight (mM g−1 FW). For TBARS determination, 0.5 mL of supernatant was mixed with 1.5 mL 0.5% TBARS and 10% TCA solutions, warmed at 90 °C in a water bath for 20 min, and cooled in ice for 10 min. Absorbance was recorded at 600 nm and 532 nm, and the non-specific absorption of the first read was subtracted from that of the second read (600 nm–532 nm). An extinction coefficient of 155 mM−1 cm−1 was used for the calculations of MDA concentration. The results were expressed as nanomolar (nM) MDA g-1 of fresh weight (nM MDA g−1 FW).

2.5. Statistical Analysis of the Metabolism Experiment

General linear models (GLM) from SAS (version 9.0, SAS Institute Inc., Cary, NC, USA) were used to run statistical analyses. Data normality and homogeneity were tested by the Shapiro–Wilk and Hartley’s tests, respectively, using the SAS Proc Univariate function. The analyses of variance (ANOVA) were performed at an F-test of p ≤ 0.05 using the Proc GLM function. T-testing was applied in regressions at p ≤ 0.05. The occurrence of interactions among factors was tested, and significant results were split into simple effects corresponding to qualitative factors (biotypes). Linear regressions at the highest significant polynomial degree were used to verify the impact of quantitative factors (herbicide doses and times after treatment), and equations from each level of factors in the interaction were split (p ≤ 0.05). The estimated results of biomass reduction and control of the GR biotype were subjected to ANOVA, and the means of the factors were compared by Tukey’s test at p ≤ 0.05.

3. Results and Discussion

For the biomass reduction, the ANOVA revealed significance (p ≤ 0.05) of only the main effects. However, in the biochemical experiments, a significant interaction was observed among biotypes, herbicide rates, and time after treatment (p ≤ 0.05). The analysis evidenced specific responses for the studied sources of variation in SAC, H2O2, and TBARS. In the charts, the difference between qualitative (biotypes) and quantitative variables (herbicide, doses, and time after evaluation) can be assessed by the confidence intervals (CI). Overlapping CIs mean that there is no significant difference, whereas non-overlapping CIs indicate a significant difference. The detailed numerical results and statistical comparisons for separating the interactions among factors can be assessed from the Supplementary Material for each specific treatment.

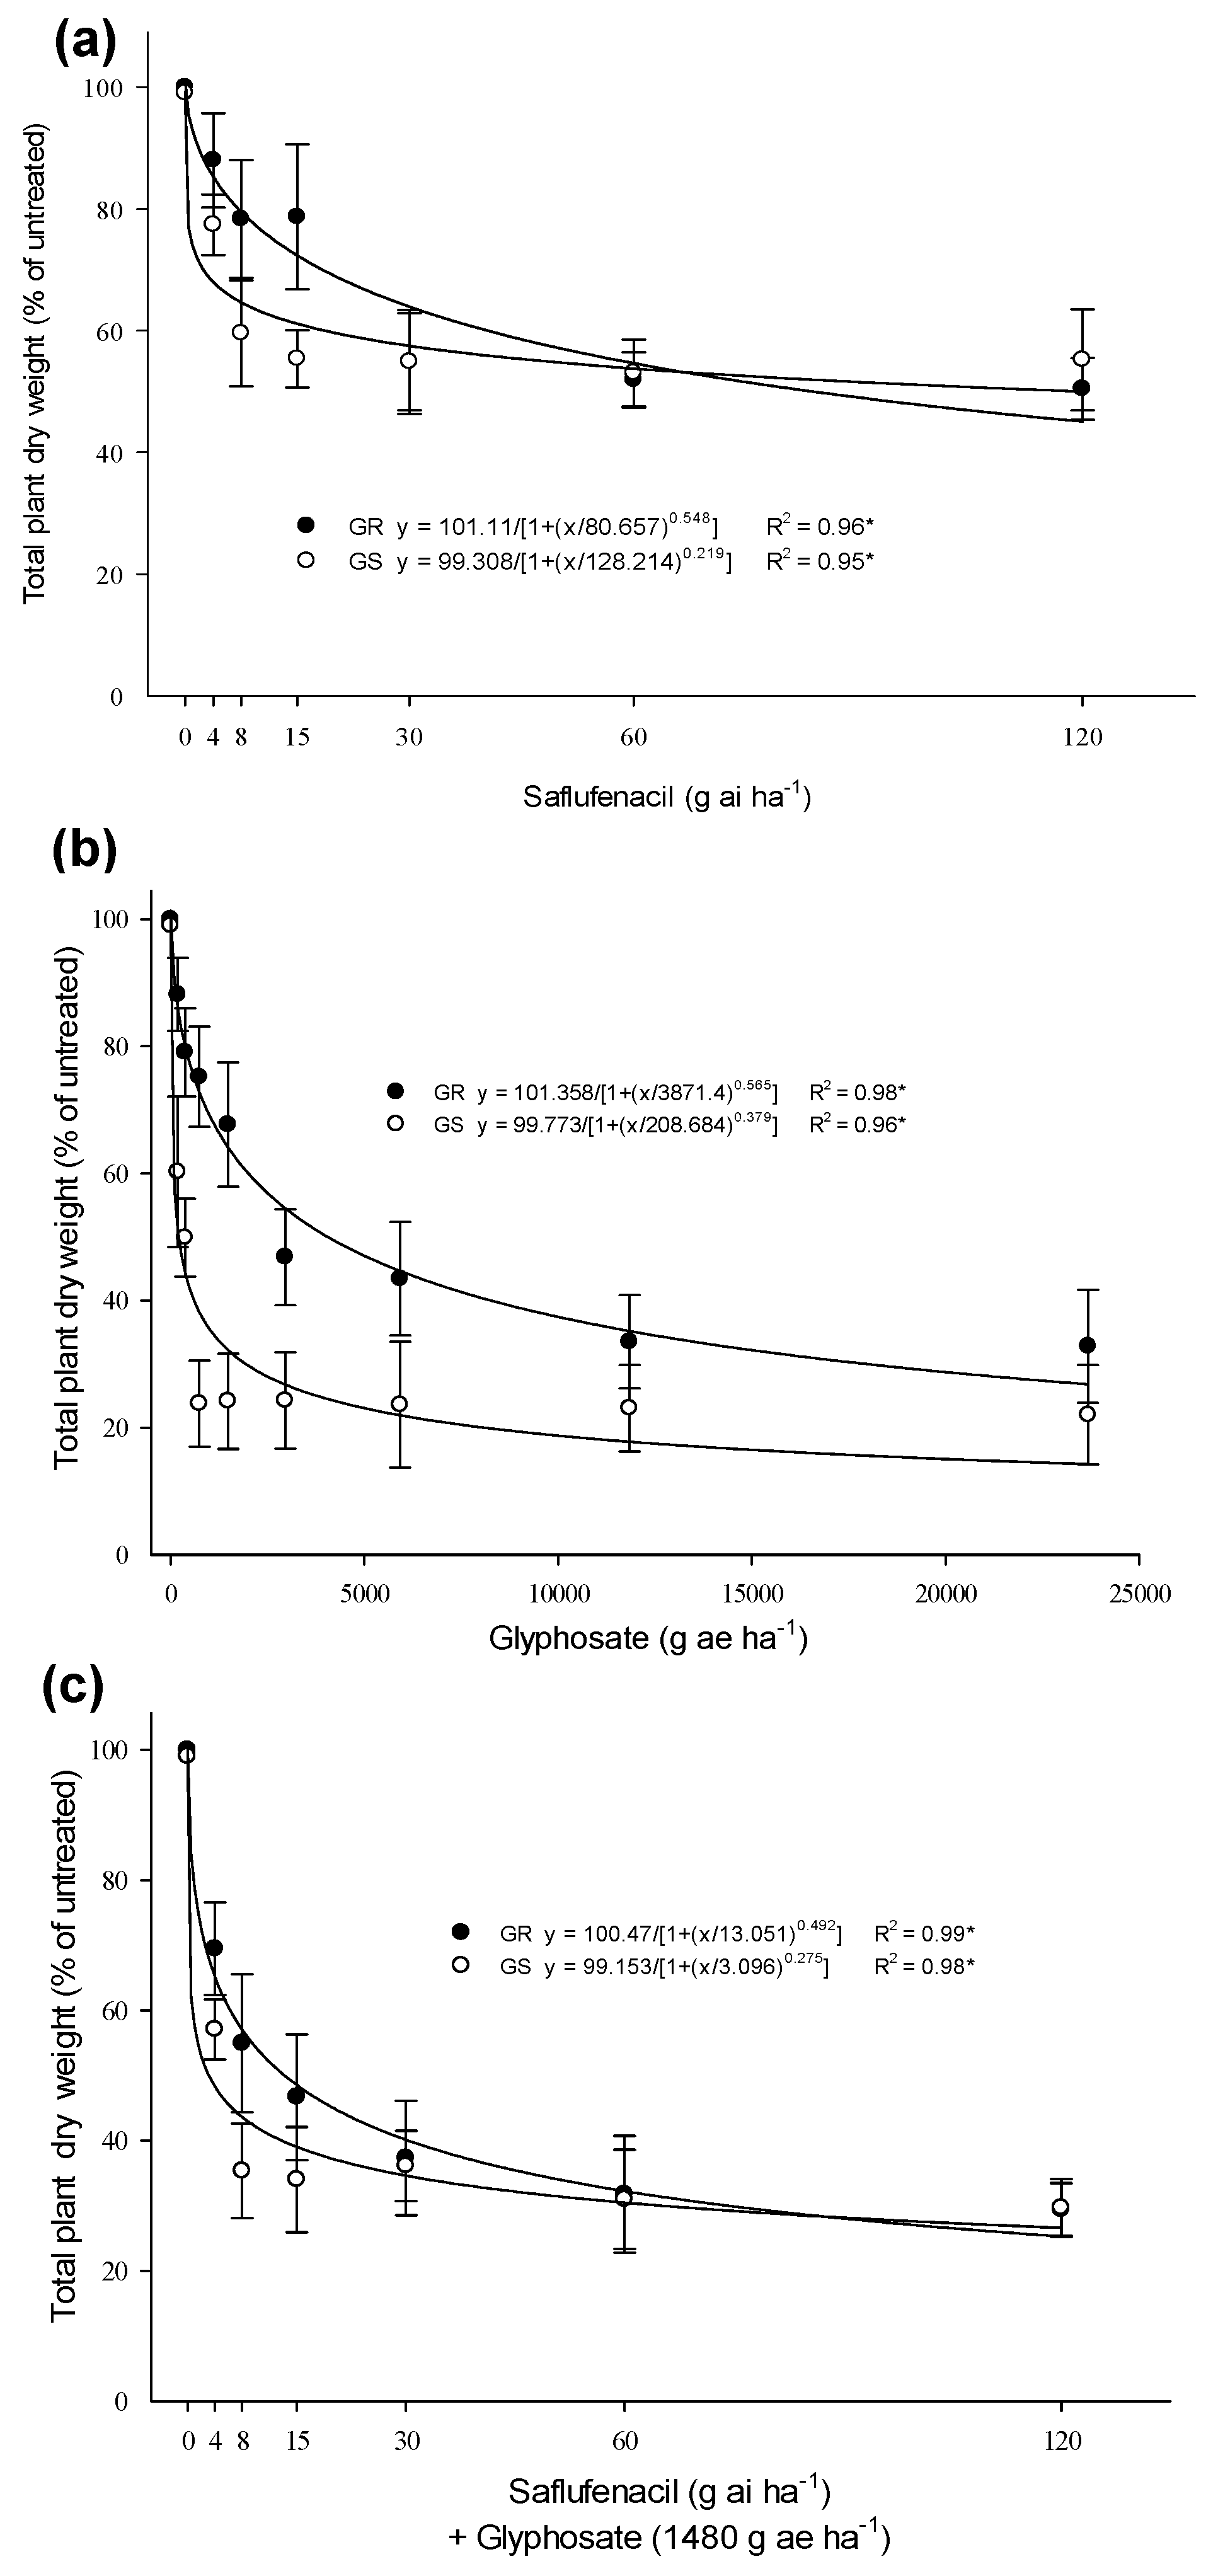
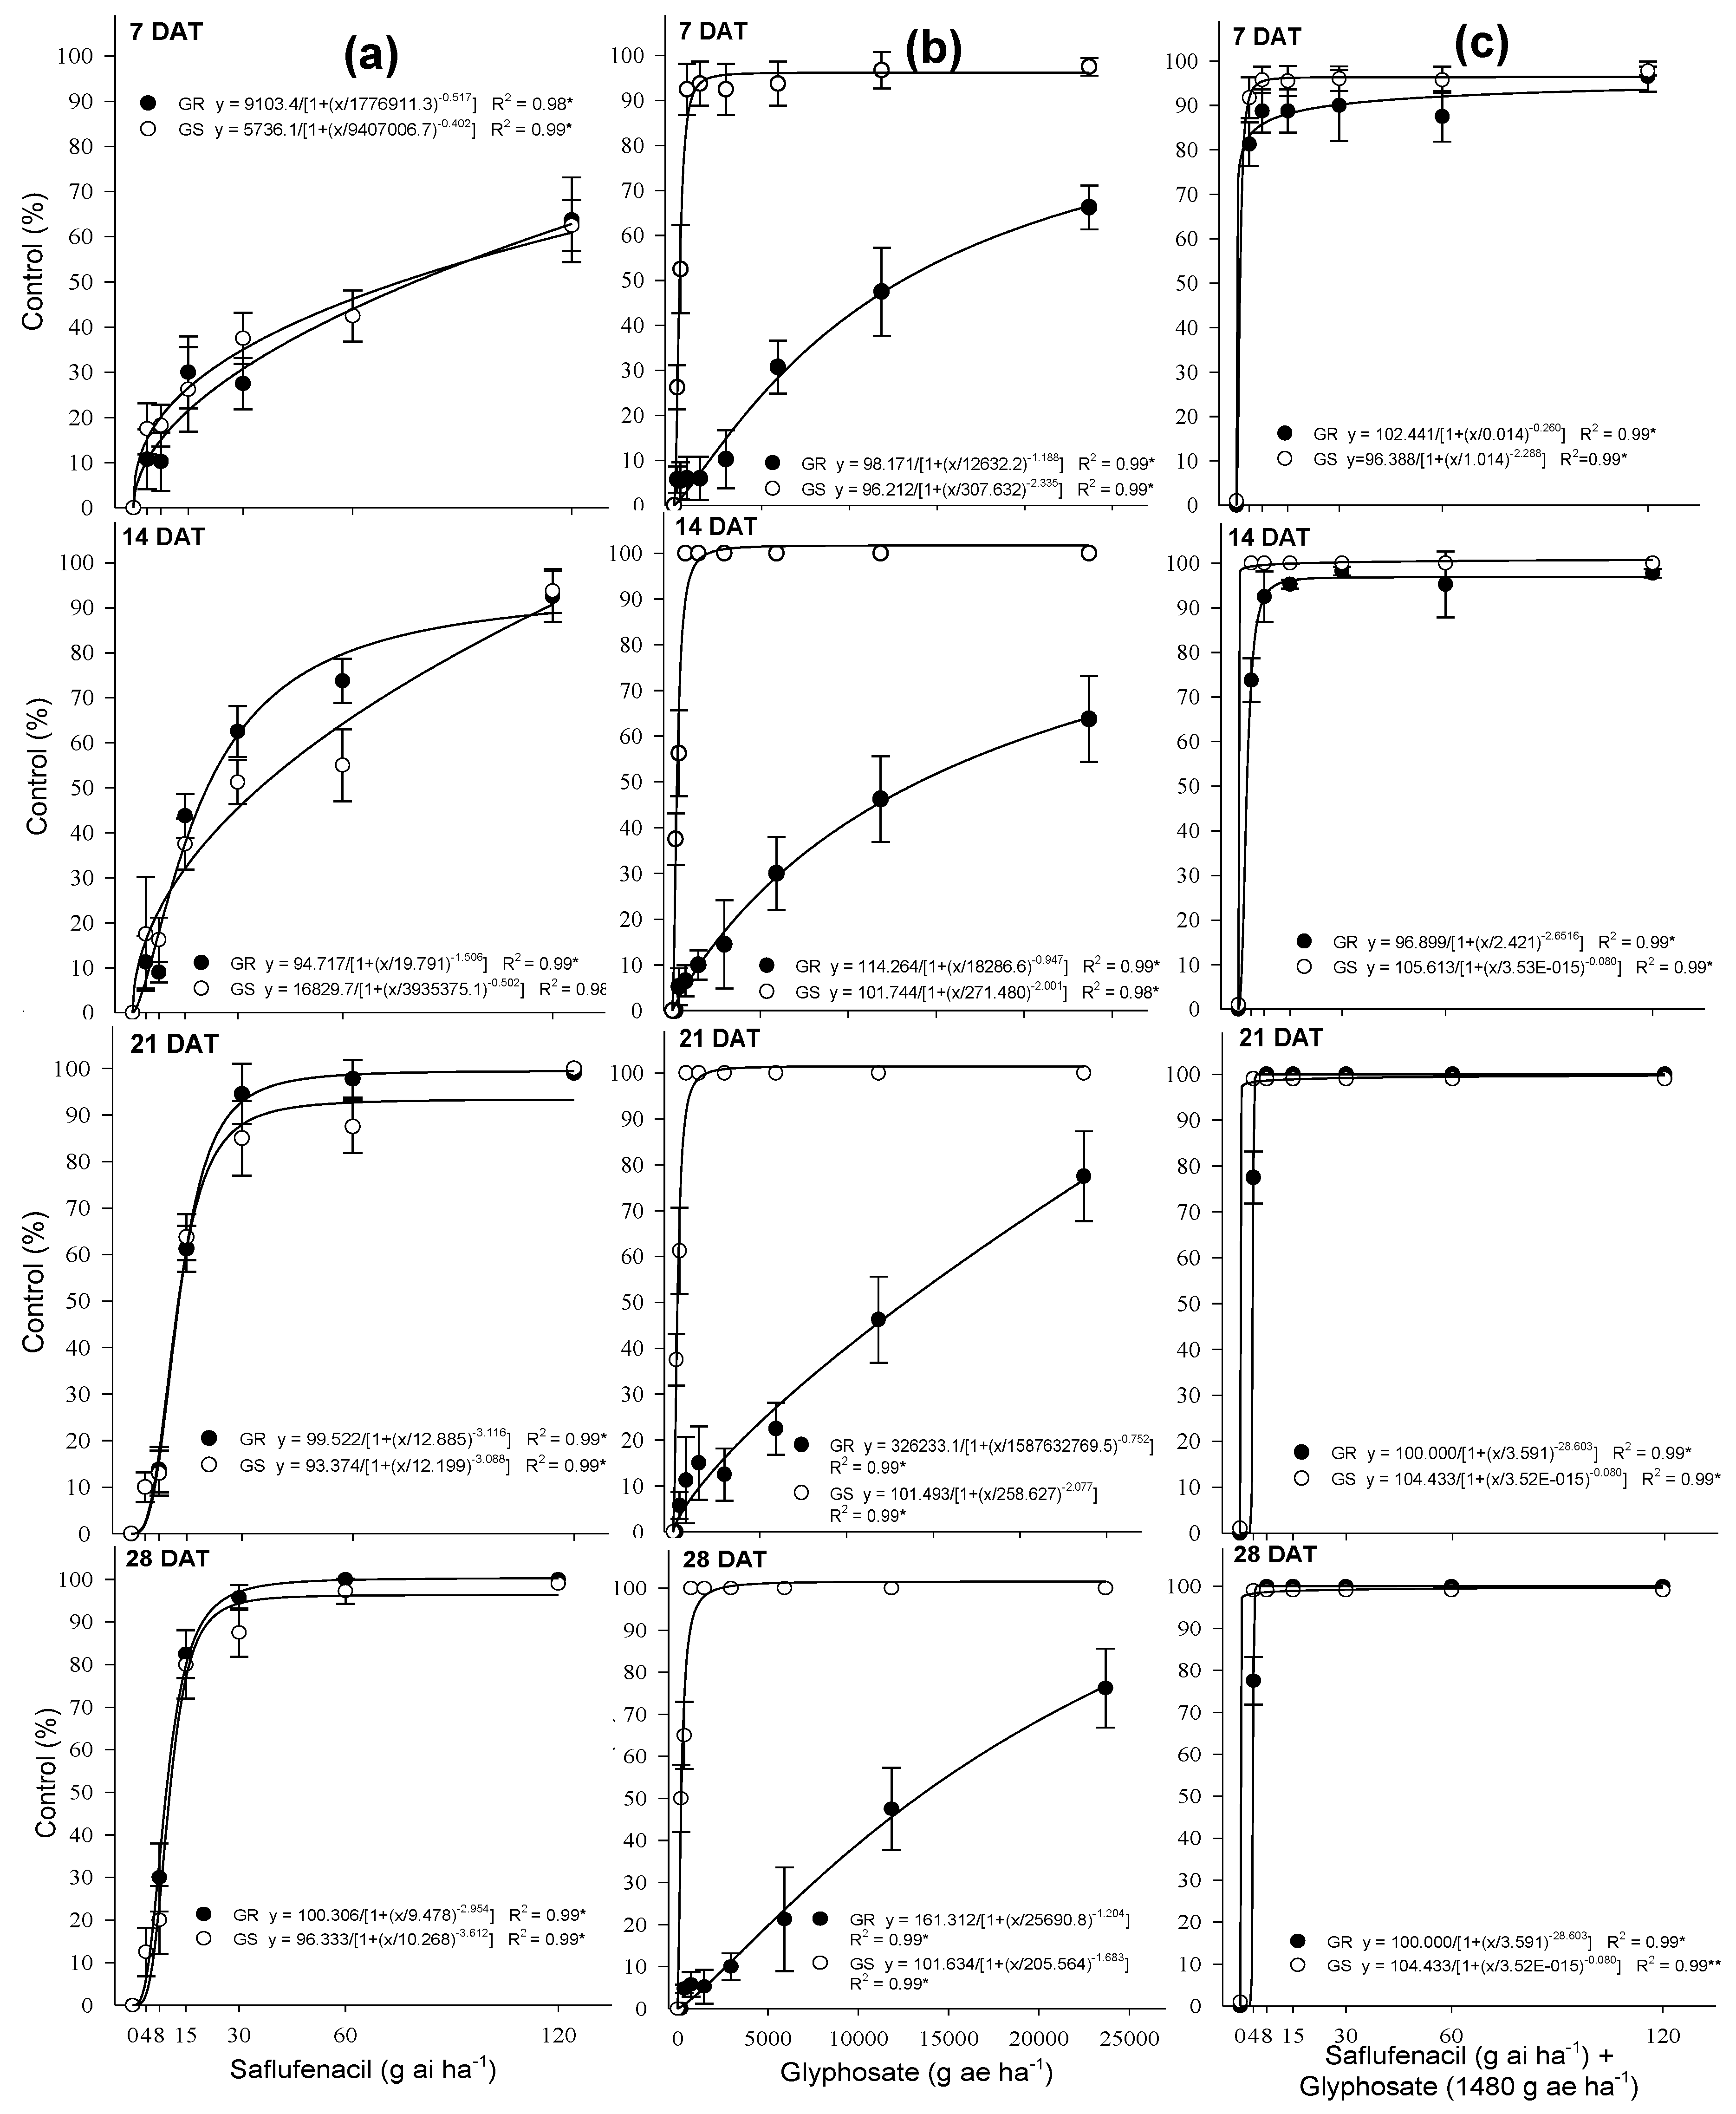
3.1. Herbicides Dose—Response and Control

The application of different doses of saflufenacil, glyphosate, and glyphosate (1480 g ae ha−1) combined with saflufenacil reduced the total plant dry weight in both GR and GS biotypes compared with untreated plants (Figure 1). As expected, the dose–response for glyphosate presented a significant difference between GR and GS biotypes, which did not occur for saflufenacil and saflufenacil + glyphosate (Figure 1; Table 1). These results can be visualized by the confidence intervals in the charts and the statistics presented in Table 1. The non-linear log-logistic model fit the data, and the GR50 and resistance factor (RF) were calculated (Figure 1; Table 1). The results for the resistance factor (RF) were 0.7, 19.6, and 4.6 for saflufenacil, glyphosate, and saflufenacil combined with glyphosate, respectively (Table 1).
Considering that the recommendation on the product’s label to control Conyza spp. is 24.5–35 g ha−1 in soybean pre-sowing, the results show that saflufenacil required a relatively high dose to reach the GR50 (an average of 102 g ha−1) without a difference between GR and GS biotypes (Table 1). A study demonstrated that 217 g ha−1 of saflufenacil (±57 g ha−1) was required to control C. canadensis at 90% (ED90) [18]. The required rate of glyphosate to reach GR50 in the GR biotype was about 20 times higher than that for GS (Table 1). Thus, the difference between biotypes is because of the glyphosate action on the GS biotype, which was highly impacted even after the application of low doses, thus confirming the resistance status (Table 1). However, when doses of saflufenacil were combined with glyphosate, the GR50 and RF decreased substantially, with a significant difference between biotypes (Table 1). The same study mentioned above showed that the ED90 of C. canadensis was reached after the combination of saflufenacil at 35 g ha−1 (±10 g ha−1) with glyphosate (1100 g ae ha−1) [18]. Considering only the GR biotype, which is the leading agricultural issue and the focus of the present study, the improvement of control after combining glyphosate and saflufenacil is evident. Compared with the results of individual treatments, the combination of herbicides lowered the dose of saflufenacil required to reach the GR50 by 6.3 times (from 83.8 to 13.2) while using about a third of the glyphosate amount (1480 compared with 4050 g ae ha−1) (Table 1). Therefore, these results prove that the combination of glyphosate and saflufenacil reduces the RF of the GR biotype. Hence, the combination of these herbicides allows for the reduction of dosages while resulting in high levels of control of the GR biotype (Figure 2, Table 2).
The results indicate that increasing the rates of saflufenacil and glyphosate (alone) resulted in increased control during the evaluated period. Rates of saflufenacil of ≥30 g ha−1 demonstrated control exceeding 90% from 21 DAT onward (Figure 2a, Table 2). However, plants treated with ≤30 g ha−1 presented regrowth (data not shown). The regrowth of Conyza is commonly observed after treatment with saflufenacil alone, especially in low doses [19]. Additionally, we can see that to reach the GR50 (shoots + roots), about 100 g ha−1 of saflufenacil was required, whereas ≥30 g ha−1 controlled over 90% of shoots at 21 and 28 DAT (Figure 1; Table 1 and Table 2). This indicates that the saflufenacil activity does not entirely compromise the root system and is likely due to the low translocation of the herbicide from the leaves to the roots.
For several years of evaluating ecophysiological parameters in Conyza, we have observed substantial growth in root volume during the initial development stages compared with the aboveground part (i.e., vigorous growth of the roots and slow-growing rates for the leaves and stems). Furthermore, the root volume is even higher in the GR biotype compared with that in GS (unpublished data) [32]. The roots contain stored carbohydrate that provides energy for plant regrowth, even after significant injury of the aerial part of the plant caused by the herbicide’s action. This phenomenon has been reported as rapid cell death response [33] and rapid necrosis [34] in GR Ambrosida trifida and C. sumatrensis after treatment with glyphosate and 2,4-D, respectively. Therefore, this phenomenon might also be happening in Conyza in response to saflufenacil; there is one report of Conyza resistance to saflufenacil in Brazil [35]. However, further studies are needed to prove this hypothesis. Hence, the combined action of glyphosate and saflufenacil causes injury in the aerial part and roots because of glyphosate’s mobility, thus resulting in synergic effects on the control of Conyza.
Glyphosate controlled the GS biotype, whereas the maximum control level observed for GR was about 80% at 28 DAT at the highest dose studied (23,680 g ae ha−1) (Figure 2b). This demonstrates that the GR biotype has a high capacity to deal with glyphosate-induced stress, even after rates 16-times higher (23,680 g ae ha−1) than the recommended dose on the product’s label (1480 g ae ha−1).
The combination of saflufenacil and glyphosate increased the efficiency and velocity of control. At 7 DAT, control exceeded 80% for all rates, without differences between biotypes (Figure 2c, Table 2). The control levels reached 100% at 21 DAT for saflufenacil rates of ≥7.5 g ha−1 in combination with glyphosate (Figure 2c, Table 2). Although control was high at 28 DAT, regrowth of the plants was observed for saflufenacil rates of 3.5 and 7.5 g ha−1 combined with glyphosate (data not shown). On the other hand, the combination of saflufenacil rates of ≥15 g ha−1 with glyphosate controlled GR C. bonariensis without regrowth. In another study evaluating saflufenacil mixtures with glyphosate, the authors concluded that a saflufenacil rate of 25 g ha−1 was optimal for combining with glyphosate to control C. canadenssis [36].
Other factors beyond the herbicide dose, such as plant stage and environmental conditions, also affect the efficacy of the herbicide and must be considered during herbicide application. The plant stage must be considered when determining the doses of saflufenacil and glyphosate. The plants in the present study were treated with herbicides during their initial development (rosette stage < 15 cm height), meaning that the control of plants in later stages might differ [19,37]. Additionally, environmental conditions such as light incidence and temperature directly influence the efficiency of PPO inhibitor herbicides [38]. For example, higher temperatures and light favor saflufenacil efficacy [38].
The results of control and biomass reduction for the GR biotype after the treatment with different saflufenacil rates combined with glyphosate at 1480 g ae ha−1 demonstrate the improved effectiveness of this mixture compared with the individual effectiveness of saflufenacil rates and glyphosate alone at 1480 g ae ha−1 (Table 2). Therefore, these results show that the combination of glyphosate (1480 g ae ha−1) and saflufenacil at rates of ≥15 g ha−1 are efficient in controlling GR C. bonariensis.

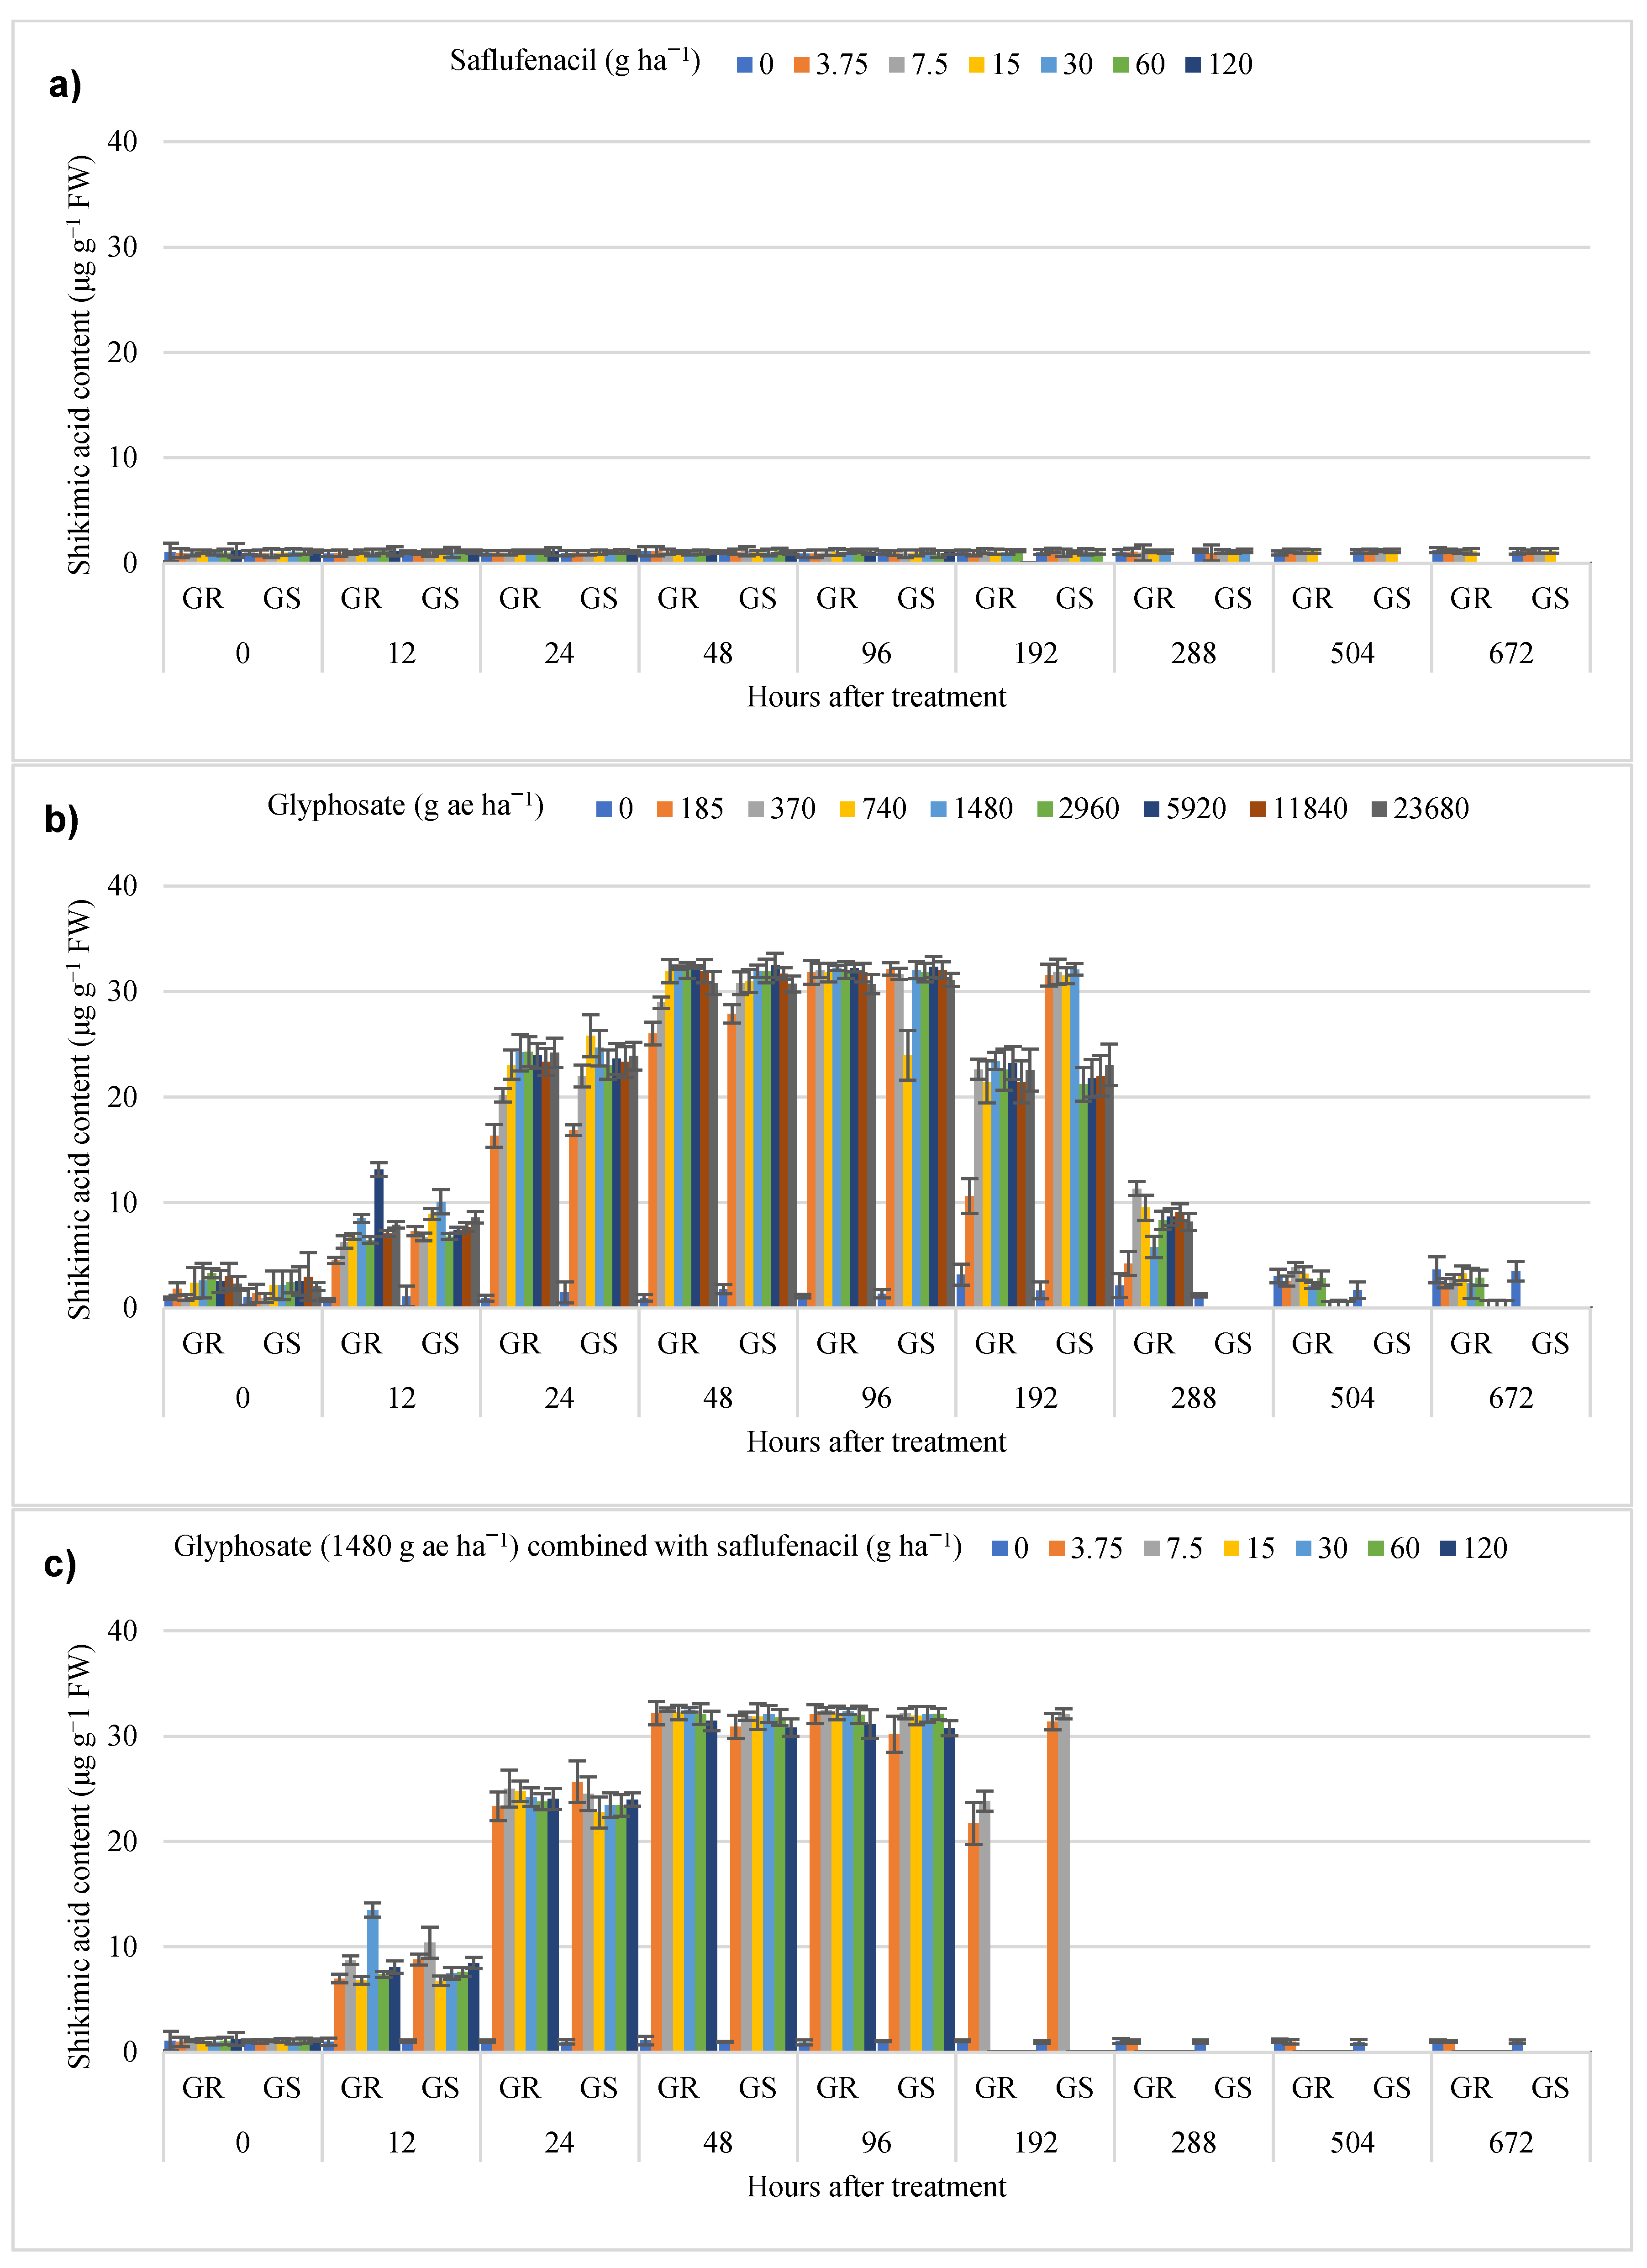
3.2. Whole-Plant Shikimic Acid Bioassay

Plants treated with glyphosate accumulated shikimic acid (SAC), whereas those treated only with saflufenacil did not (Figure 3, Tables S1–S3). The SAC peaked at 48 and 96 HAT in GR and GS biotypes after applying glyphosate rates, with differences between biotypes, rates, and time after treatment (Table S1). In the GR biotype, the SAC started declining after 96 HAT and reached the same levels as those in the untreated plants at 504 HAT. In GS, the SAC remained high after 48 HAT and then decreased abruptly after 192 HAT as a result of the plant’s death (Figure 3b, Tables S1 and S2). Another study performed with the same biotypes showed similar SAC results to those presented in the current study [16]. When glyphosate was combined with saflufenacil, the SAC presented similar results to those of applying glyphosate alone, suggesting that the mixture did not compromise the glyphosate action. However, plants treated with glyphosate and saflufenacil showed greater injury and died after 192 HAT (Figure 3c).
After glyphosate treatment, the SAC in the GR biotype was transient, indicating the metabolization of glyphosate and its sub-products, such as shikimic acid. After the inhibition of EPSPS by glyphosate, the primary consequence is the accumulation of shikimic acid [23]. However, it can decrease over time in GR plants, allowing the EPSPS to process the available shikimate-3-phosphate (S3P) and lessen SAC accumulation [39,40]. Hence, SAC was linearly correlated with the amount of glyphosate in horseweed cells [41]. Thus, the accumulation of shikimic acid observed in the present study indicates that glyphosate alone or combined with saflufenacil is entering the cell of GR and GS biotypes and reaching and inhibiting the enzyme EPSPS, particularly during the first 192 HAT (Figure 3). From these results, we assume that saflufenacil did not reduce glyphosate absorption and translocation since the SAC was similar after treatment with glyphosate alone or glyphosate combined with saflufenacil. The accumulation of shikimic acid after glyphosate treatment triggers ROS overproduction, oxidative stress, and tissue damage [23].

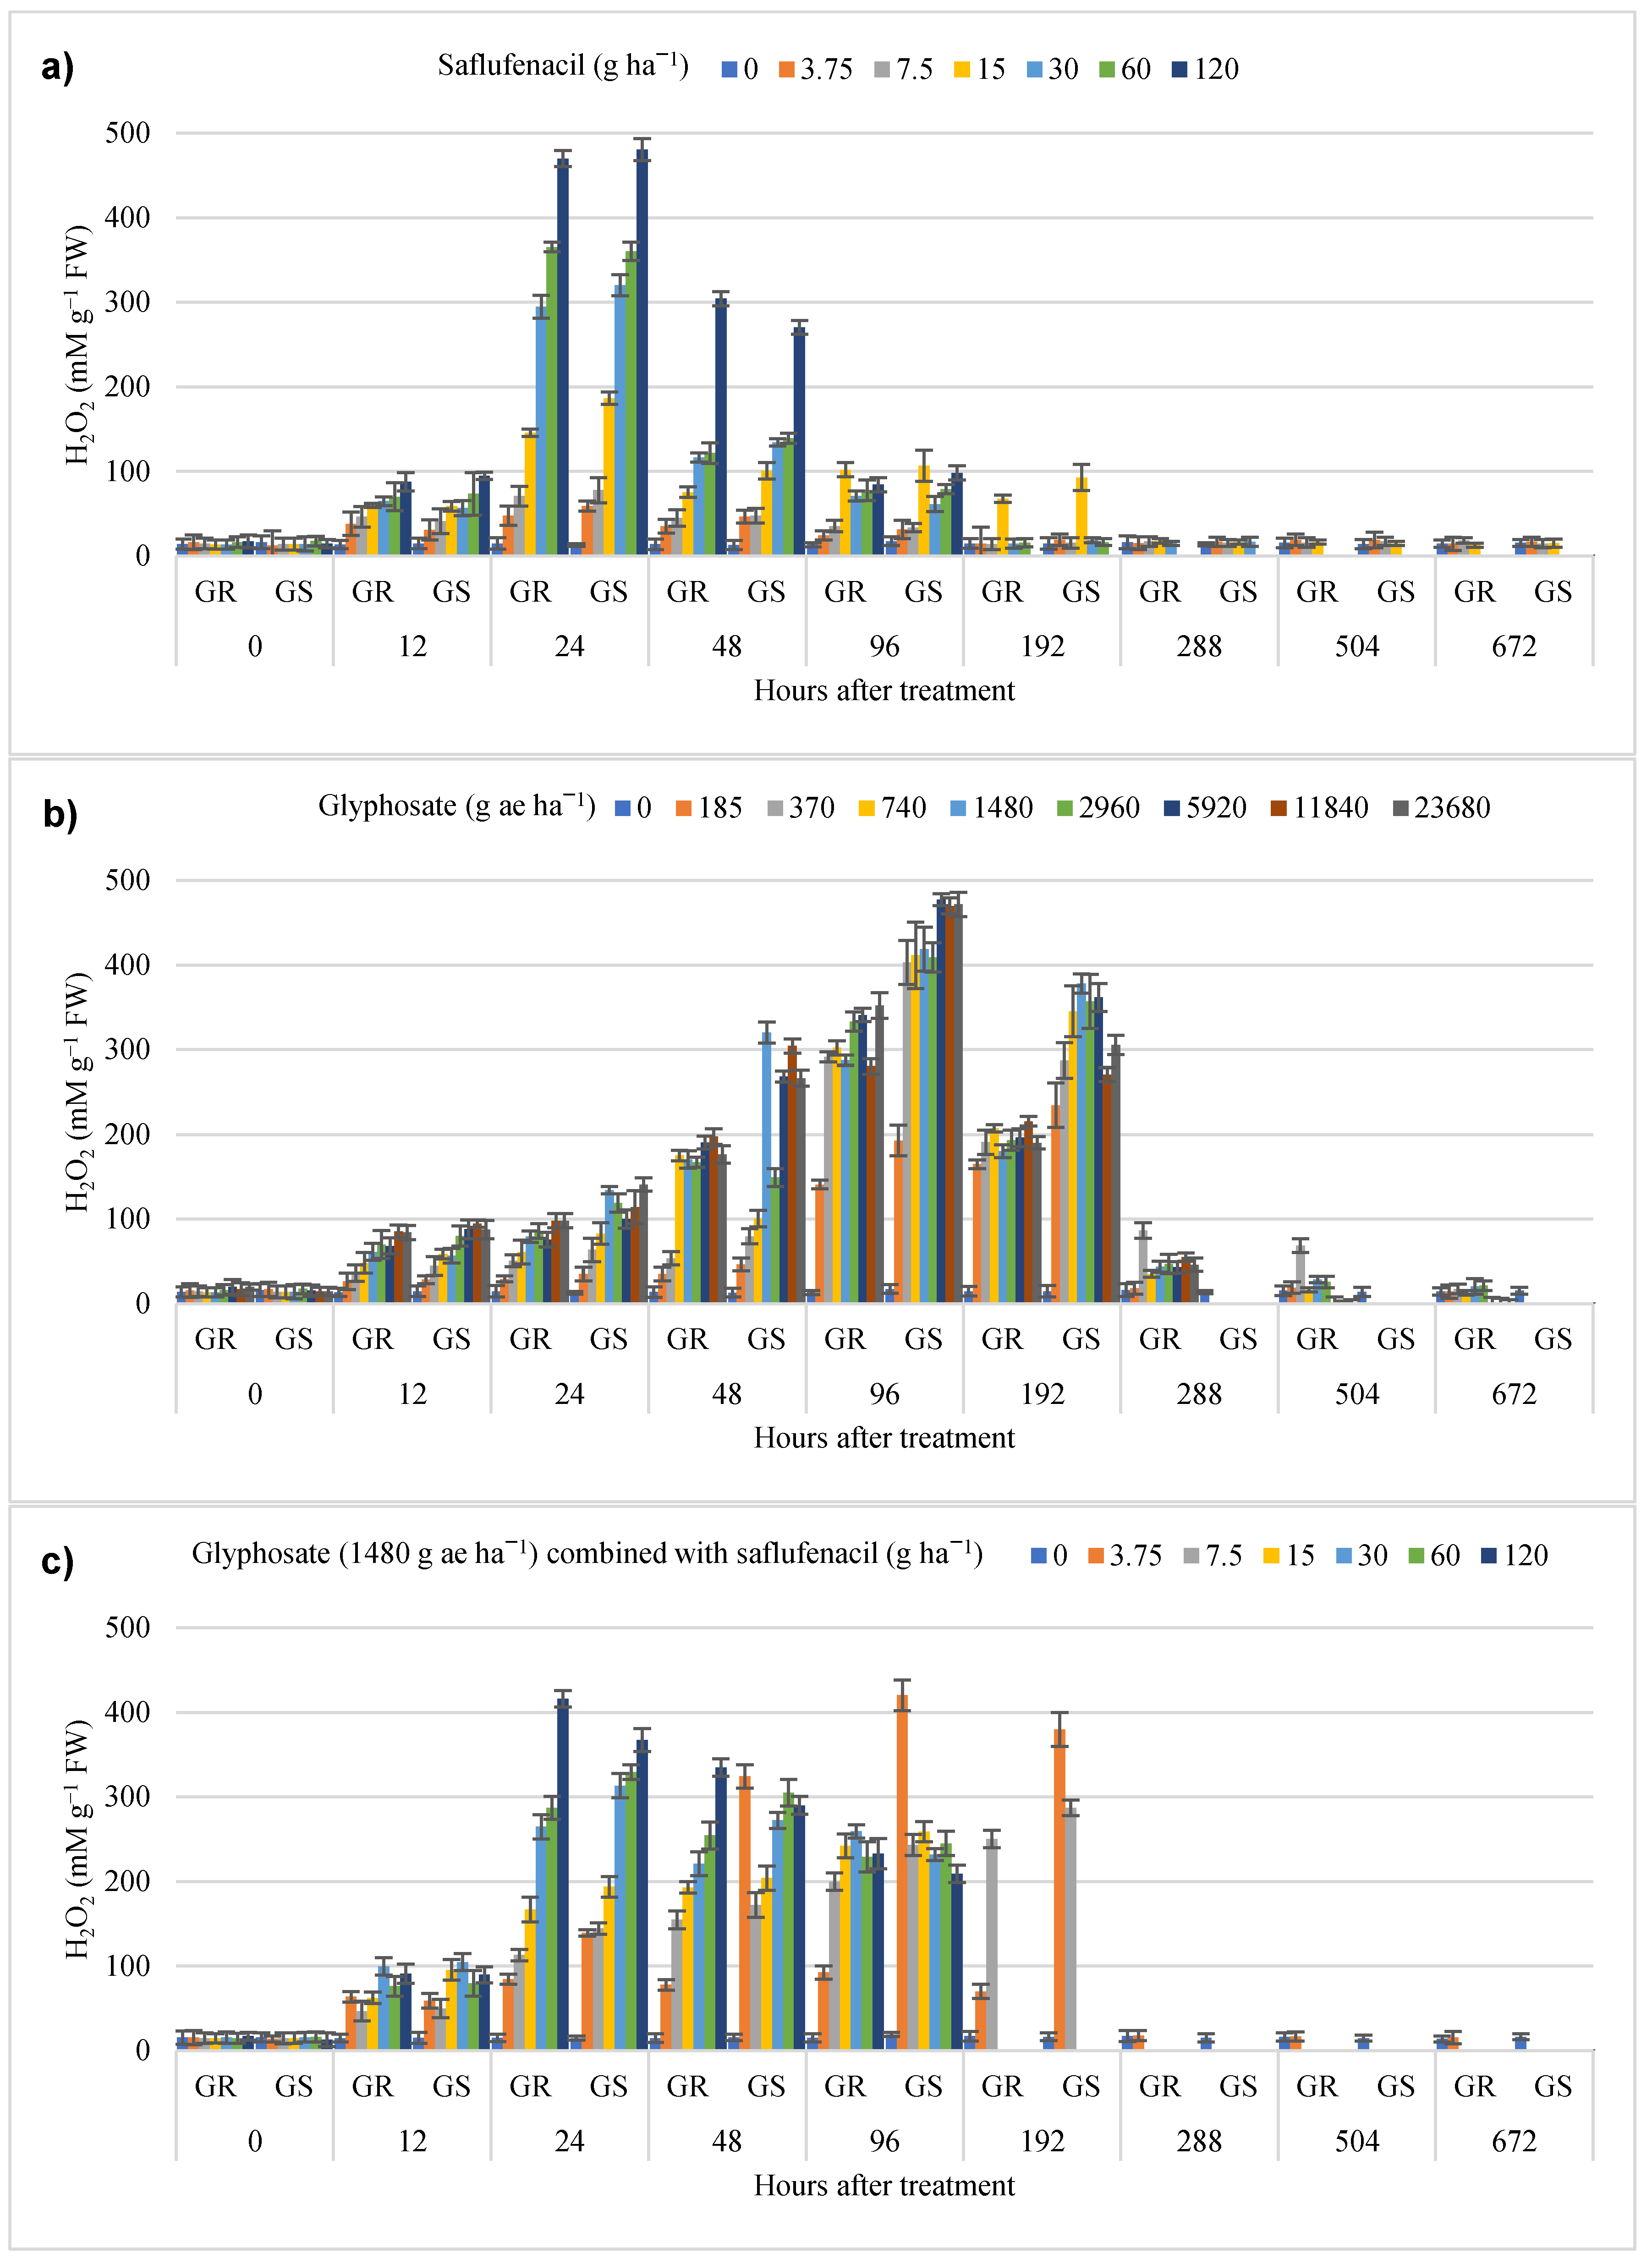
3.3. Oxidative Stress and Lipid Peroxidation

Treatment with saflufenacil and glyphosate alone or combined resulted in oxidative stress and lipidic peroxidation in both GR and GS biotypes (Figure 4 and Figure 5, Tables S1–S3). For the application of saflufenacil alone, there were differences between biotypes, doses, and time after treatment, but with unclear patterns (Figure 4a, Table S1). In this case, the H2O2 levels were higher than those in untreated plants at 12 HAT and peaked at 24 HAT, followed by an abrupt decrease after that. In general, the results show that the oxidative stress after saflufenacil application started at 12 HAT and ceased after 96 HAT (Figure 4a, Table S1). Another study also showed marked accumulation of H2O2 in dicot plants submitted to saflufenacil application, demonstrating its peroxidative effects [21].
The concentration of H2O2 after glyphosate treatment presented significant differences between biotypes, time, and rates of the herbicides, with an unclear pattern among rates (Figure 4b, Table S2). In this experiment, GS presented higher oxidative stress than GR from 48 HAT onward. In the GR biotype, the H2O2 levels were transient following the SAC trend and did not differ from the untreated plants at about 504 HAT, while GS plants died after 192 HAT (Figure 4b, Table S2). The combination of glyphosate with saflufenacil resulted in the highest levels of H2O2 in both biotypes. In this case, the oxidative stress started early, at 12 HAT, and remained elevated until 192 HAT compared with those obtained for the herbicides alone (Figure 4c, Table S3). There were differences among doses, with the higher ones resulting in more significant increases in H2O2 levels (Figure 4c, Table S3).
The lipid peroxidation followed the same tendency as that of the H2O2 levels, where higher doses of the herbicide alone or combined with glyphosate resulted in the most cell damage (Figure 5, Tables S1–S3). The lipidic peroxidation after saflufenacil application started at 12 HAT, with the highest levels for 60 and 120 g ha−1, and declined after 48 HAT (Figure 5, Table S1). The lipidic peroxidation after glyphosate treatment presented differences between biotypes, and the levels were, in general, lower than those observed when saflufenacil was applied (Figure 5b, Table S2). The combination of glyphosate with saflufenacil resulted in a similar lipidic peroxidation level to those found for saflufenacil alone (Figure 5c, Tables S1–S3).
Studies performed in C. bonariensis, Ambrosia trifida, and Amaranthus palmeri have demonstrated their antioxidant systems responding to ROS and reducing the cellular damage in resistant biotypes after glyphosate application or paraquat [16,27,42,43]. Similarly, the reduced oxidative stress and lipid peroxidation in the GR biotype after glyphosate treatment can be attributed to the antioxidant system. However, this did not happen for saflufenacil alone or saflufenacil combined with glyphosate. The reason may be that the initial point of ROS production after glyphosate action is in the chloroplasts, while for saflufenacil, it is in the cytosol [21,22,23]. ROS overproduction in different cellular organelles likely exceeds the antioxidant capacity to scavenge these toxic molecules, which results in severe cellular damage. Another observation is that the results indicate faster ROS production and cellular damage after saflufenacil application compared with glyphosate application, which took at least double the time of saflufenacil to cause similar effects.
It has been reported that the GR mechanisms in Conyza involve the transport of glyphosate into vacuoles [44]. However, after the treatment with the combination of glyphosate and saflufenacil, the ROS overproduction in the cytoplasm caused by the action of saflufenacil might damage the vacuoles’ membranes. This damage can cause the leakage of vacuoles and compromise cell activity or even affect the signaling among the affected organelles in response to glyphosate action. However, this hypothesis needs further validation.
The results for oxidative stress and lipid peroxidation agree with those observed for control, meaning that high stress for a longer period led to greater control. In this context, the isolated application of saflufenacil or glyphosate was not highly effective in controlling GR C. bonariensis. However, when glyphosate was combined with doses of saflufenacil of ≥15 g ha−1, the maximum levels of control were reached, and the plants did not survive. The herbicide combination resulted in the rapid occurrence of oxidative stress and lipid peroxidation, and they were maintained at high levels for a longer duration. The cell defense system was not able to scavenge the ROS produced from that amount of stress, culminating in cellular loss of function and plant wilting, followed by necrosis and death.
The combination of glyphosate with PPO inhibitor herbicides, such as sulfentrazone and fomesafen, resulted in antagonism due to the fast tissue destruction and reduction in herbicide absorption and translocation [45,46]. However, saflufenacil has physical/chemical properties that allow its translocation [47]. This is a convergent point that enables both saflufenacil and glyphosate to act simultaneously, causing damage to two different cellular organelles at the same time, resulting in synergic effects on the control of GR C. bonariensis [17]. As the results of the present study show, the combination of glyphosate and saflufenacil is effective in controlling GR C. bonariensis.

4. Conclusions

The present study hypothesized that the combination of glyphosate and saflufenacil would increase the control of GR C. bonariensis by causing high ROS production and oxidative stress. The results indicated that combining glyphosate (1480 g ae ha−1) with saflufenacil (≥15 g ha−1) did increase the control and is efficient in controlling GR C. bonariensis. Furthermore, this combination is effective for GR management since we observed a reduction in the resistance factor. On the other hand, this herbicide combination resulted in shikimic acid accumulation, oxidative stress, and lipidic peroxidation. The combined effects of herbicides on plant metabolism resulted in phytotoxic effects early after treatment and remained at high levels for a longer duration compared with their individual effects. Thus, our initial hypothesis is null since higher ROS levels were not observed, but the ROS level was high for more time. Therefore, the combination of oxidative stress and lipid peroxidation at high levels for more time is likely the reason that the combination of glyphosate and saflufenacil effectively controls GR C. bonariensis.

Supplementary Materials

The following are available online at https://www.mdpi.com/2077-0472/10/6/236/s1, Table S1: The simple qualitative effect of separating the cellular damage as a response to saflufenacil treatment in glyphosate-resistant (GR) and -sensitive (GS) biotypes of Conyza bonariensis as a function of time after treatment and rate; Table S2: The simple qualitative effect of separating the cellular damage as a response to glyphosate treatment in glyphosate-resistant (GR) and -sensitive (GS) biotypes of Conyza bonariensis as a function of time after treatment and rate; Table S3: The simple qualitative effect of separating the cellular damage as a response to glyphosate (1480 g ae ha-1) combined with saflufenacil treatment in glyphosate-resistant (GR) and -sensitive (GS) biotypes of Conyza bonariensis as a function of time after treatment and rate; Table S4: Regression, root mean square error (RMSE), and determination coefficient (R2) for the polynomial model from evaluated variables (shikimic acid, H2O2, and TBARS) extracted from Conyza bonariensis as a function of biotype (GR and GS), rate of saflufenacil, and time after treatment; Table S5: Regression, root mean square error (RMSE), and determination coefficient (R2) for the polynomial model from evaluated variables (shikimic acid, H2O2, and TBARS) extracted from Conyza bonariensis as a function of biotype (GR and GS), rate of glyphosate, and time after treatment; Table S6: Regression, root mean square error (RMSE), and determination coefficient (R2) for the polynomial model from evaluated variables (shikimic acid, H2O2, and TBARS) extracted from Conyza bonariensis as a function of biotype (GR and GS), rate of saflufenacil combined with glyphosate (1480 g ae ha-1), and time after treatment.

Author Contributions

Conceptualization, C.P. and L.V.; Data curation, C.P. and I.R.C.; Formal analysis, C.P. and I.R.C.; Funding acquisition, D.A. and L.V.; Investigation, C.P. and L.A.A.; Methodology, C.P.; Project administration, D.A. and L.V.; Resources, D.A. and L.V.; Software, C.P. and I.R.C.; Supervision, C.P., D.A. and L.V.; Writing—original draft, C.P.; Writing—review and editing, C.P., L.A.A., I.R.C., L.V. and D.A. All authors have read and agreed to the published version of the manuscript.

Funding

This research was funded by “Conselho Nacional de Desenvolvimento Científico e Tecnológico (CNPq)” and “Coordenação de Aperfeiçoamento de Pessoal de Nível Superior (CAPES)”.

Acknowledgments

C.P. acknowledges funding through a “Conselho Nacional de Desenvolvimento Científico e Tecnológico (CNPq)” and “Coordenação de Aperfeiçoamento de Pessoal de Nível Superior (CAPES)” for the scholarship. L.V. and D.A. thank the EMBRAPA/Bayer project for the funding. The authors are grateful to CNPq and CAPES for financial support. C.P., D.A., L.A.A. and L.V. thank CNPq for grants.

Conflicts of Interest

The authors declare no conflict of interest.

References

  1. Oerk, E.-C. Crop losses to pests. J. Agric. Sci. 2006, 144, 31–43. [Google Scholar] [CrossRef]
  2. Jeschke, P. Progress of modern agricultural chemistry and future prospects. Pest. Manag. Sci. 2016, 72, 433–455. [Google Scholar] [CrossRef] [PubMed] [Green Version]
  3. Heap, I.; Duke, S.O. Overview of glyphosate-resistant weeds worldwide. Pest. Manag. Sci. 2018, 74, 1040–1049. [Google Scholar] [CrossRef] [PubMed]
  4. Powles, S.B.; Yu, Q. Evolution in Action: Plants Resistant to Herbicides. Annu. Rev. Plant Biol. 2010, 61, 317–347. [Google Scholar] [CrossRef] [Green Version]
  5. Stewart, C.N.; Tranel, P.J.; Horvath, D.P.; Anderson, J.V.; Rieseberg, L.H.; Westwood, J.H.; Mallory-Smith, C.A.; Zapiola, M.L.; Dlugosch, K.M. Evolution of Weediness and Invasiveness: Charting the Course for Weed Genomics. Weed Sci. 2009, 57, 451–462. [Google Scholar] [CrossRef] [Green Version]
  6. Busi, R.; Goggin, D.E.; Heap, I.M.; Horak, M.J.; Jugulam, M.; Masters, R.A.; Napier, R.M.; Riar, D.S.; Satchivi, N.M.; Torra, J.; et al. Weed resistance to synthetic auxin herbicides. Pest. Manag. Sci. 2018, 74, 2265–2276. [Google Scholar] [CrossRef] [PubMed]
  7. Carpenter, J.; Gianessi, L. Economic impacts of glyphosate-resistant weeds. In Glyphosate Resistance in Crops and Weeds: History, Development, and Management; Nandula, V.K., Ed.; Wiley: Hoboken, NJ, USA, 2010; p. 344. ISBN 978-0-470-41031-8. [Google Scholar]
  8. Adegas, F.; Vargas, L.; Gazziero, D.; Karam, D.; Silva, A.; Agostinetto, D. Impacto econômico da resistência de plantas daninhas a herbicidas no Brasil. Circ. Técnica 2017, 132, 1–12. [Google Scholar]
  9. Heap, I. The International Survey of Herbicide Resistant Weeds. Available online: www.weedscience.com (accessed on 1 May 2019).
  10. Bajwa, A.A.; Sadia, S.; Ali, H.H.; Jabran, K.; Peerzada, A.M.; Chauhan, B.S. Biology and management of two important Conyza weeds: A global review. Environ. Sci. Pollut. Res. 2016, 23, 24694–24710. [Google Scholar] [CrossRef] [PubMed]
  11. Van Gessel, M. Glyphosate-resistant horseweed from Delaware. Weed Sci. 2001, 49, 703–705. [Google Scholar] [CrossRef]
  12. Vargas, L.; Bianchi, M.; Rizzardi, M.; Agostinetto, D.; Dal Magro, T. Conyza bonariensis Biotypes Resistant to the Glyphosate in Southern Brazil. Planta Daninha 2007, 25, 573–578. [Google Scholar] [CrossRef]
  13. Silva, D.R.O.; Agostinetto, D.; Vargas, L. Molecular characterization of hairy fleabane using RAPD. Planta Daninha 2016, 34, 433–442. [Google Scholar] [CrossRef] [Green Version]
  14. Vargas, L.; Adegas, F.; Gazziero, D.; Karam, D.; Agostinetto, D.; da Silva, W.T. Resistência de plantas daninhas a herbicidas no Brasil: Histórico, distribuição, impacto econômico, manejo e prevenção. In A era Glyphosate: Agricultura, Meio Ambiente e Homem; Midiograf: Londrina, Brazil, 2016; pp. 219–239. [Google Scholar]
  15. Piasecki, C.; Yang, Y.; Benemann, D.P.; Kremer, F.S.; Galli, V.; Millwood, R.J.; Cechin, J.; Agostinetto, D.; Maia, L.C.; Vargas, L.; et al. Transcriptomic Analysis Identifies New Non-Target Site Glyphosate-Resistance Genes in Conyza bonariensis. Plants 2019, 8, 157. [Google Scholar] [CrossRef] [PubMed] [Green Version]
  16. Piasecki, C.; Carvalho, I.R.; Cechin, J.; Goulart, F.A.P.; da Maia, L.C.; Agostinetto, D.; Caverzan, A.; Stewart, C.N., Jr.; Vargas, L. Oxidative stress and differential antioxidant enzyme activity in glyphosate-resistant and -sensitive hairy fleabane in response to glyphosate treatment. Bragantia 2019, 78, 379–396. [Google Scholar] [CrossRef] [Green Version]
  17. Dalazen, G.; Kruse, N.D.; de Oliveira Machado, S.L.; Balbinot, A. Sinergismo na combinação de glifosato e saflufenacil para o controle de buva. Pesq. Agropec. Trop. 2015, 45, 249–256. [Google Scholar] [CrossRef] [Green Version]
  18. Knezevic, S.Z.; Datta, A.; Scott, J.; Charvat, L.D. Interactions Between Saflufenacil and Glyphosate on Selected Broadleaf Weeds. Crop. Manag. 2009, 8, 1–15. [Google Scholar] [CrossRef]
  19. Mellendorf, T.G.; Young, J.M.; Matthews, J.L.; Young, B.G. Influence of Plant Height and Glyphosate on Saflufenacil Efficacy on Glyphosate-Resistant Horseweed (Conyza canadensis). Weed Technol. 2013, 27, 463–467. [Google Scholar] [CrossRef]
  20. Piasecki, C.; Bilibio, M.I.; Cechin, J.; Schmitz, M.F.; Henckes, J.R.; Costa, L.O. da Technical effectiveness and economic return of the glyphosate-resistant hairy fleabane management in soybean pre-emergence. Rev. Bras. Herbic. 2017, 16, 20. [Google Scholar]
  21. Grossmann, K.; Niggeweg, R.; Christiansen, N.; Looser, R.; Ehrhardt, T. The Herbicide Saflufenacil (KixorTM) is a New Inhibitor of Protoporphyrinogen IX Oxidase Activity. Weed Sci. 2010, 58, 1–9. [Google Scholar] [CrossRef]
  22. Beale, S.I.; Weinstein, J.D. Tetrapyrrole metabolism in photosynthetic organisms. In Biosynthesis of Heme and Chlorophylls; Dailey, H.A., Ed.; McGraw-Hill: New York, NY, USA, 1990; pp. 287–391. [Google Scholar]
  23. Cobb, A.; Reade, P. Herbicides and Plant Physiology, 2nd ed.; Wiley-Blackwell: Hoboken, NJ, USA, 2010; ISBN 9781405129350. [Google Scholar]
  24. Caverzan, A.; Piasecki, C.; Chavarria, G.; Stewart, C.; Vargas, L. Defenses Against ROS in Crops and Weeds: The Effects of Interference and Herbicides. Int. J. Mol. Sci. 2019, 20, 1086. [Google Scholar] [CrossRef] [Green Version]
  25. Tzin, V.; Galili, G. New Insights into the Shikimate and Aromatic Amino Acids Biosynthesis Pathways in Plants. Mol. Plant. 2010, 3, 956–972. [Google Scholar] [CrossRef]
  26. Schönbrunn, E.; Eschenburg, S.; Shuttleworth, W.A.; Schloss, J.V.; Amrhein, N.; Evans, J.N.; Kabsch, W. Interaction of the herbicide glyphosate with its target enzyme 5-enolpyruvylshikimate 3-phosphate synthase in atomic detail. Proc. Natl. Acad. Sci. USA 2001, 98, 1376–1380. [Google Scholar] [CrossRef] [PubMed] [Green Version]
  27. Maroli, A.S.; Nandula, V.K.; Dayan, F.E.; Duke, S.O.; Gerard, P.; Tharayil, N. Metabolic Profiling and Enzyme Analyses Indicate a Potential Role of Antioxidant Systems in Complementing Glyphosate Resistance in an Amaranthus palmeri Biotype. J. Agric. Food Chem. 2015, 63, 9199–9209. [Google Scholar] [CrossRef] [PubMed]
  28. Singh, B.K.; Shaner, D.L. Rapid Determination of Glyphosate Injury to Plants and Identification of Glyphosate resistant plants. Weed Sci. Soc. Am. 1998, 12, 527–530. [Google Scholar] [CrossRef]
  29. Perez-Jones, A.; Park, K.-W.; Polge, N.; Colquhoun, J.; Malory-Smith, C.A. Investigating the mechanisms of glyphosate resistance in Lolium multiflorum. Planta 2007, 226, 395–404. [Google Scholar] [CrossRef]
  30. Sergiev, I.; Alexieva, V.; Karanov, E. Effect of spermine, atrazine and combination between them on some endogenous protective systems and stress markers in plants. C. R. Acad. Bulg. Sci. 1997, 51, 121–124. [Google Scholar]
  31. Heath, R.L.; Packer, L. Photoperoxidation in isolated chloroplasts: I. kinetics and stoichiometry of fatty acid peroxidation. Arch. Biochem. Biophys. 1968, 125, 189–198. [Google Scholar] [CrossRef]
  32. Piasecki, C.; (Federal University of Pelotas-UFPel, Pelotas, RS, Brazil). Unpublished work. 2020.
  33. Van Horn, C.R.; Moretti, M.L.; Robertson, R.R.; Segobye, K.; Weller, S.C.; Young, B.G.; Johnson, W.G.; Schulz, B.; Green, A.C.; Jeffery, T.; et al. Glyphosate resistance in Ambrosia trifida: Part 1. Novel rapid cell death response to glyphosate. Pest. Manag. Sci. 2018, 74, 1071–1078. [Google Scholar] [CrossRef] [PubMed]
  34. De Queiroz, A.R.S.; Delatorre, C.A.; Lucio, F.R.; Rossi, C.V.S.; Zobiole, L.H.S.; Merotto, A. Rapid necrosis: A novel plant resistance mechanism to 2,4-D. Weed Sci. 2019, 68, 6–18. [Google Scholar] [CrossRef]
  35. de Pinho, C.F.; Lourenço Leal, J.F.; dos Santos Souza, A.; de Oliveira, G.F.P.B.; de Oliveira, C.; Langaro, A.C.; Lopes Machado, A.F.; Christoffoleti, P.J.; Saes Zobiole, L.H. First evidence of multiple resistance of Sumatran Fleabane (Conyza sumatrensis (Retz.) E.Walker) to five- mode-of-action herbicides. Aust. J. Crop. Sci. 2019, 13, 1688–1697. [Google Scholar] [CrossRef]
  36. Waggoner, B.S.; Mueller, T.C.; Bond, J.A.; Steckel, L.E. Control of Glyphosate-Resistant Horseweed (Conyza canadensis) with Saflufenacil Tank Mixtures in No-Till Cotton. Weed Technol. 2011, 25, 310–315. [Google Scholar] [CrossRef]
  37. VanGessel, M.J.; Scott, B.A.; Johnson, Q.R.; White-Hansen, S.E. Influence of Glyphosate-Resistant Horseweed (Conyza canadensis) Growth Stage on Response to Glyphosate Applications. Weed Technol. 2009, 23, 49–53. [Google Scholar] [CrossRef]
  38. Matzenbacher, F.O.; Vidal, R.A.; Merotto Jr., A.; Trezzi, M.M. Environmental and physiological factors that affect the efficacy of herbicides that inhibit the enzyme protoporphyrinogen oxidase: A literature review. Planta Daninha 2014, 32, 457–463. [Google Scholar] [CrossRef] [Green Version]
  39. Mueller, T.C.; Massey, J.H.; Hayes, R.M.; Main, C.L.; Stewart, C.N. Shikimate accumulates in both glyphosate-sensitive and glyphosate-resistant horseweed (Conyza canadensis L. Cronq.). J. Agric. Food Chem. 2003, 51, 680–684. [Google Scholar] [CrossRef]
  40. Ahsan, N.; Lee, D.G.; Lee, K.W.; Alam, I.; Lee, S.H.; Bahk, J.D.; Lee, B.H. Glyphosate-induced oxidative stress in rice leaves revealed by proteomic approach. Plant. Physiol. Biochem. 2008, 46, 1062–1070. [Google Scholar] [CrossRef] [PubMed]
  41. Nol, N.; Tsikou, D.; Eid, M.; Livieratos, I.C.; Giannopolitis, C.N. Shikimate leaf disc assay for early detection of glyphosate resistance in Conyza canadensis and relative transcript levels of EPSPS and ABC transporter genes. Weed Res. 2012, 52, 233–241. [Google Scholar] [CrossRef]
  42. Ye, B.; Muller, H.H.; Zhang, J.; Gressel, J. Constitutively Elevated Levels of Putrescine and Putrescine-Generating Enzymes Correlated with Oxidant Stress Resistance in Conyza bonariensis and Wheat. Plant. Physiol. 1997, 115, 1443–1451. [Google Scholar] [CrossRef] [Green Version]
  43. Harre, N.T.; Nie, H.; Jiang, Y.; Young, B.G. Differential antioxidant enzyme activity in rapid-response glyphosate-resistant Ambrosia trifida. Pest. Manag. Sci. 2018, 74, 2125–2132. [Google Scholar] [CrossRef]
  44. Ge, X.; D’Avignon, D.A.; Ackerman, J.J.H.; Sammons, R.D. Rapid vacuolar sequestration: The horseweed glyphosate resistance mechanism. Pest. Manag. Sci. 2010, 66, 345–348. [Google Scholar] [CrossRef] [Green Version]
  45. Starke, R.J.; Oliver, L.R. Interaction of glyphosate with chlorimuron, fomesafen, imazetaphyr, and sulfentrazone. Weed Sci. 1998, 46, 652–660. [Google Scholar] [CrossRef]
  46. Shaw, D.R.; Arnold, J.C. Weed control from herbicide combinations with glyphosate. Weed Technol. 2002, 16, 1–6. [Google Scholar] [CrossRef]
  47. Ashigh, J.; Hall, J.C. Bases for interactions between saflufenacil and glyphosate in plants. J. Agric. Food Chem. 2010, 58, 7335–7343. [Google Scholar] [CrossRef] [PubMed]
Figure 1. Plant total dry weight reduction of glyphosate-resistant (GR) and -sensitive (GS) Conyza bonariensis biotypes at 28 days after transplant (DAT) with (a) saflufenacil (0, 3.75, 7.5, 15, 30, 60, and 120 g ha−1), (b) glyphosate (0, 185, 370, 740, 1480, 2960, 5920, 11,840, and 23,680 g ae ha−1), and (c) glyphosate (1480 g ae ha−1) combined with saflufenacil rates of 0, 3.75, 7.5, 15, 30, 60, and 120 g ha−1. Lines are the response curves predicted from non-linear regression; symbols represent mean dry weight (% reduction compared with untreated) of three replicates, and vertical bars show the 95% confidence intervals (CI).
Agriculture 10 00236 g001
Figure 2. Control of glyphosate-resistant (GR) and -sensitive (GS) Conyza bonariensis biotypes at 7, 14, 21, and 28 days after treatment (DAT) with (a) saflufenacil at 0, 3.75, 7.5, 15, 30, 60, and 120 g ha−1, (b) glyphosate at 0, 185, 370, 740, 1480, 2960, 5920, 11,840, and 23,680 g ae ha−1, and (c) glyphosate at 1480 g ae ha−1 combined with saflufenacil rates of 0, 3.75, 7.5, 15, 30, 60, and 120 g ha−1. Lines are the response curves predicted from non-linear regression, symbols represent means of three replicates, and bars show the 95% confidence intervals (CI).
Agriculture 10 00236 g002
Figure 3. Time-course results of shikimic acid content in glyphosate-resistant (GR) and -sensitive (GS) Conyza bonariensis biotypes in response to treatment with (a) saflufenacil (0, 3.75, 7.5, 15, 30, 60, and 120 g ha−1), (b) glyphosate (0, 185, 370, 740, 1480, 2960, 5920, 11,840, and 23,680 g ae ha−1), and (c) glyphosate (1480 g ae ha−1) combined with saflufenacil rates (0, 3.75, 7.5, 15, 30, 60, and 120 g ha−1). The interval bars represent 95% confidence intervals (CI). Individual comparisons between biotypes for each respective herbicide rate and time after treatments are presented in Tables S1–S3. Regressions are presented in Tables S4–S6.
Agriculture 10 00236 g003
Figure 4. Time-course results of oxidative stress (H2O2) in glyphosate-resistant (GR) and -sensitive (GS) biotypes of Conyza bonariensis in response to treatment with (a) saflufenacil (untreated, 3.75, 7.5, 15, 30, 60, and 120 g ha−1), (b) glyphosate (0, 185, 370, 740, 1480, 2960, 5920, 11,840, and 23,680 g ae ha−1), and (c) glyphosate (1480 g ae ha−1) combined with saflufenacil rates (untreated, 3.75, 7.5, 15, 30, 60, and 120 g ha−1). The interval bars represent 95% confidence intervals (CI). Individual comparisons between biotypes for each respective herbicide rate and time after treatments are presented in Tables S1–S3. Regressions are presented in Tables S4–S6.
Agriculture 10 00236 g004
Figure 5. Time-course results of tissue damage (thiobarbituric acid reactive species, TBARS) in glyphosate-resistant (GR) and -sensitive (GS) Conyza bonariensis biotypes in response to treatment with (a) saflufenacil (untreated, 3.75, 7.5, 15, 30, 60, and 120 g ha−1), (b) glyphosate (0, 185, 370, 740, 1480, 2960, 5920, 11,840, and 23,680 g ae ha−1), and (c) glyphosate (1480 g ae ha−1) combined with saflufenacil rates (untreated; 3.75, 7.5, 15, 30, 60, and 120 g ha−1). The interval bars represent 95% confidence intervals (CI). Individual comparisons between biotypes in each respective herbicide rate and time after treatments are presented in Tables S1–S3. Regressions are presented in Tables S4–S6.
Agriculture 10 00236 g005
Table 1. Parameter estimates of herbicide dose resulting in 50% reduction of total dry weight (GR50) in glyphosate-resistant (GR) and -sensitive (GS) biotypes of Conyza bonariensis at 28 days after treatment (DAT).
HerbicideGR50 aRF b
GRGS
Saflufenacil83.8 ns120.2 ns0.7 c
Glyphosate4050 a206.2 b19.6 a
Saflufenacil + Glyphosate *13.2 a2.9 b4.6 b
a GR50 means the herbicide rate required to reduce the total plant biomass by 50%; b RF (resistance factor) = GR50 (GR)/GR50 (GS); in GR50 results, different letters indicate significant differences between the GR and GS biotypes in the F-test at p ≤ 0.05 for each treatment comparison, whereas ns means non-significant; RF values with different letters are statistically different in the F-test at p ≤ 0.05 through the treatments; * glyphosate 1480 g ae ha−1 combined with saflufenacil rates.
Table 2. Estimated biomass reduction (% compared with untreated plants) and control (%) of glyphosate-resistant Conyza bonariensis in response to herbicide treatment using the regression models.
TreatmentRate
(ai ha−1)
Biomass Reduction at
28 DAT (%) a
Control (%) b
7 DAT c14 DAT21 DAT28 DAT
Saflufenacil3.7515 b11 Ad7 Af2 Bd3 Bd
7.521 b15 Bd18 Be16 Bc30 Ac
1528 b22 Bc38 Bd61 Ab84 Ab
3036 a31 Cc62 Bc93 Aa99 Aa
6045 a44 Cb80 Bb99 Aa100 Aa
12055 a63 Ba89 Aa99 Aa100 Aa
Glyphosate 1480 g ae ha11480367 AB10 A10 A5 B
Glyphosate 1480 g ae ha1 + Saflufenacil rates3.7535 c83 Aa74 Ab78 Ab78 Ab
7.543 bc86 Ba92 Aa100 Aa100 Aa
1551 ab88 Ba96 Aa100 Aa100 Aa
3060 a90 Aa97 Aa100 Aa100 Aa
6068 a92 Aa97 Aa100 Aa100 Aa
12075 a94 Aa97 Aa100 Aa100 Aa
a Biomass reduction (%) regarding untreated control at 28 days after treatment (DAT); b visual assessment of control (%); c DAT: days after treatment. Different uppercase letters in a line indicate a significant difference among the time of evaluation by Tukey’s test at p ≤ 0.05. In contrast, different lowercase letters in a column indicate a significant difference among doses of each herbicide by Tukey’s test at p ≤ 0.05.

