1. Introduction
Globally, livestock production systems are broadly classified into three categories: grazing-based system where livestock is dependent on natural forage and pasture lands; mixed farming system where crop production and livestock are closely integrated; and landless production system, which are industrial and intensive in nature and mostly found near peri-urban, urban centers [
1]. Dairying in the mixed farming systems is globally the most extensive and accounts for 70% of the bovine, contributing to around 90% of the total milk production [
2]. Indian dairying is characterized by mixed farming system, where bovines are fed crop by-products and cultivated fodder by the smallholders to produce milk, farmyard manure, draught power, and fuel as joint products [
3]. However, in the last few decades, milk has taken precedence over other joint products of bovine function because of a complex mix of factors like increase in demand of milk due to a growing population, chemical fertilizers replacing manures, and tractors replacing bullocks for farm power.
India’s mixed farming system can be further divided into rainfed and irrigated mixed farming systems as half of the country’s net sown area remain dependent on rainfall for cultivation. In the Indian context, irrigated mixed systems have shown the greater increase in dairy productivity over the years [
4]. Irrigated areas have witnessed intensive crop production resulting in high availability of residues and cereals, which have a significant impact on the feeding, breeding, management, and productivity of bovines [
5]. Phansalkar [
6] and Upali et al. [
7] have highlighted the crucial role of water in India’s milk production. So far, most studies have explored the relationship between water and milk production by estimating the consumptive water use and further calculating water productivity in kg/m
3 [
7,
8,
9,
10]. However, these estimates do not distinguish between irrigation water from rainfall, wells, and canals, and give no assessment of the impact of different modes of water application on milk production. Investigating the impact of different irrigation modes on milk output is important because of the greater difference in the crop yields, crop intensification, and diffusion of farm mechanization under different irrigation regimes. Several studies have shown that groundwater irrigation provides easy access and greater water-control to the farmers, which leads to higher crop productivity and when compared to surface irrigation like canals, tanks, etc. [
10,
11,
12,
13,
14].
In this paper, we analyze the impact of water under different irrigation regimes (groundwater, surface water, and rainfall) on the bovine demography and the gross value of milk output at the district-level using a four-equation regression model. Specifying a set of recursive relationships, we eliminate the simultaneity bias by using instrumental variables in two-stage least square method. The model estimates the marginal value product of water delivered through groundwater, surface water, and rainfall on gross value of milk output, and also calculates the size of their contribution to India’s gross value of milk output.
2. Data and Method
District-level data has been compiled from various sources in this study. Sources of data are mentioned in
Table 1.
The model is estimated for the year 2010–2011. Regression analyses were performed using Analysis Toolpak in Microsoft Excel. We have considered the geographical boundaries of 590 districts of India covered by the 4th Minor irrigation census as the base and converged data from 9th Agricultural Census [
17] and 19th Livestock Census [
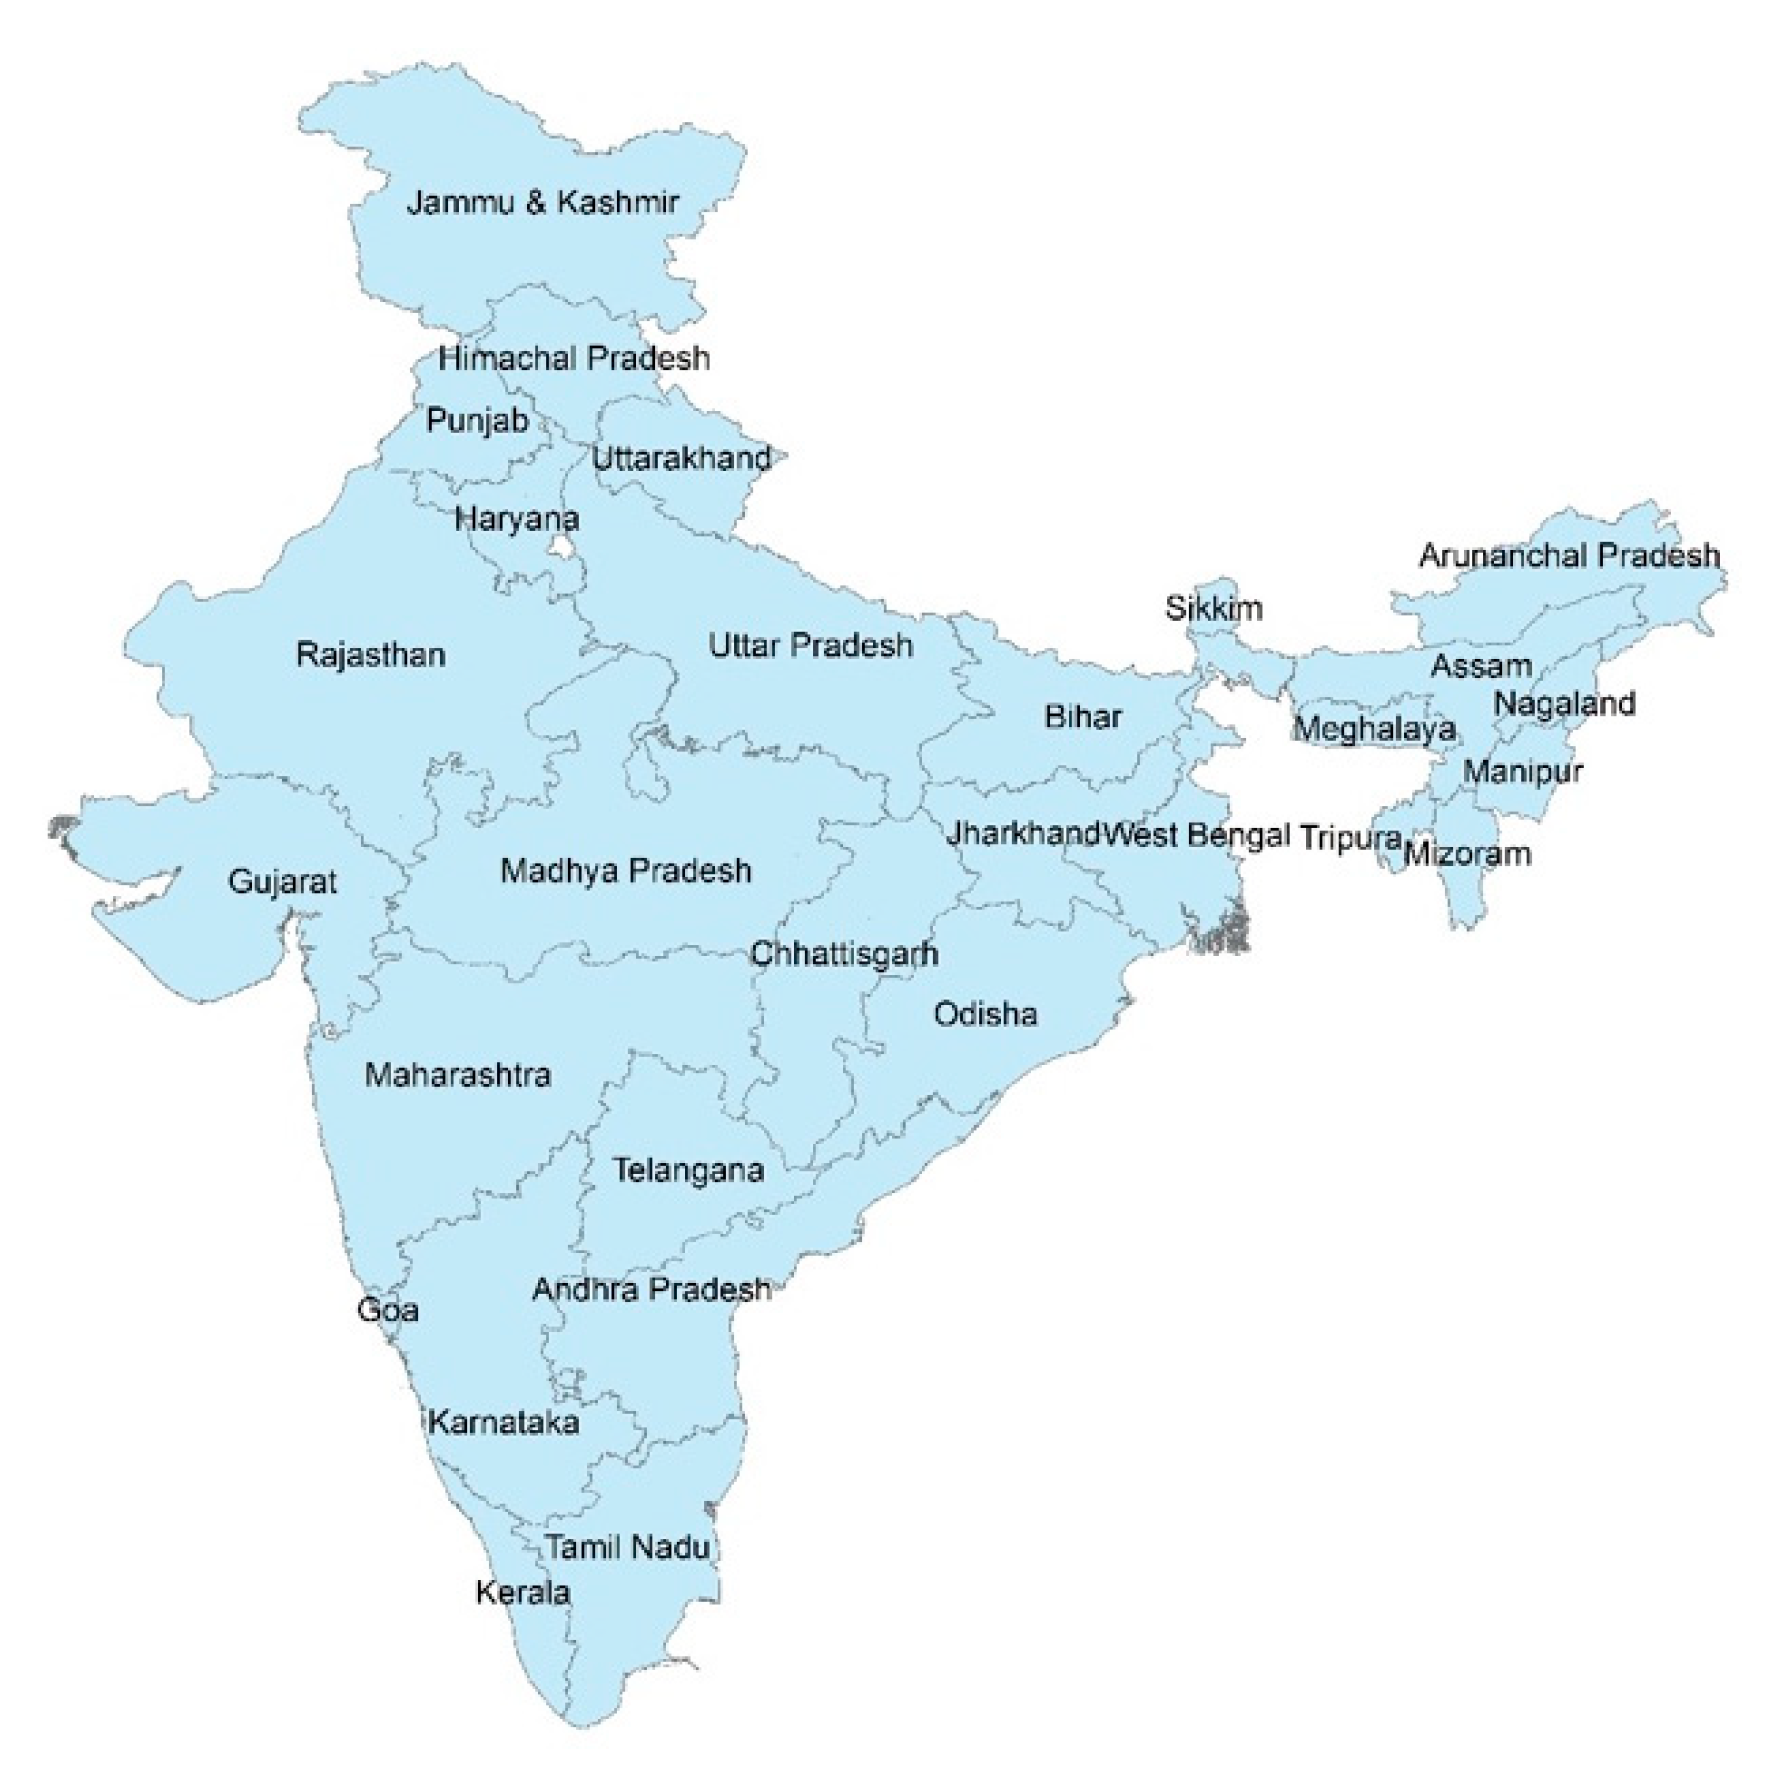
18] for these 590 instead of the present 648 districts. (A district in India is equivalent to a county in USA in size.) Of the 590 districts, our analysis encompasses 534 districts for our regressions due to non-availability of data on different variables in 56 districts. Even so, our analysis covers 96% of India’s net sown area and 97% of the total bovine population, and is fairly representative of the national picture. One limitation of the study is that datasets used are not strictly contemporaneous. However, the observation suggests that variables we have chosen tend to slowly vary over the years. Since the study involves a lot of spatial analysis, a state-wise map has been included (see
Figure A1) for a better understanding of India’s geography. This study assumes the percentage of in-milk bovines in the herd as the key indicator of dairy intensification. Ratio of in-milk bovine heads to bovine stock has been termed as herd efficiency ratio (HER).
We follow two-pronged methods in this study: (i) First, we classify districts on the basis of access to irrigation and examine the trends and patterns in bovine demography in different classes; and (ii) second, we use a four-equation recursive regression model to estimate impact of different irrigation regimes on bovine demography and dairy production.
2.1. Role of Irrigation in Dairy Intensification of India
During the 1950 and 1960s, the primary function of bovine was to provide draught power for agricultural operations; milk production was a secondary activity. Till the ’60s, the country was dependent on the imports to fulfil its milk demand [
21]. As the Green Revolution and White Revolution ushered in the later decades, dairying became more pronounced of all the bovine functions. The Green Revolution led to runaway mechanization in Indian agriculture, replacing bullocks with tractors. During 1961–2012, India’s five-year Livestock Censuses recorded 40% decline, from 74 million in 1962 to 45 million in 2012 of working bovines. The number of tractors increased from 30,000 in 1961 to more than four million in 2011. Moreover, rapid adoption of irrigation, high-yielding seed varieties, and fertilizers expanded the availability of cereals and pulses [
22]. Along with these, the crop residues to maintain bovines. According to a study by Food and Agriculture Organization of the United Nations, the Green Revolution intensified dairying in irrigated areas like Punjab in a two-pronged manner: first, irrigated areas witnessed a dramatic increase in crop intensification, which increased the supply of cereals for intensive production; second, the green revolution led to increase in incomes, which increased the demand for milk [
4].
Compared to the rainfed districts, irrigated districts experience stronger stimuli for dairy production from three sources: first, they have better feed and fodder availability [
3]; second, higher levels of farm mechanization enables them to concentrate feed and fodder for dairy bovines [
23]; and lastly, higher consumer incomes in irrigated villages strengthen local demand for milk, making milk production ever more attractive livelihood option for the small-holders [
24]. Rao and Birthal [
3] did a detailed study of different typologies of mixed crop-livestock systems in India. Their study showed that high irrigated mixed crop systems—prevalent in the districts of Punjab, Haryana, Uttar Pradesh (UP), and pockets of Karnataka and Maharashtra—have a strong presence of high milk-producing breeds like crossbreed cattle and
Murrah breed buffaloes, better availability of feed, dominance of female bovines, and better access to market in the form of strong network of milk cooperatives. Similar results were reported by another study in western Indo-Gangetic Basin—states of Punjab, Haryana, and Western UP—which highlighted irrigation as one of the main drivers for high intensification of dairying in the region [
25].
Table 2 simultaneously looks at the district-level data of irrigated area and bovine demography from the 9th Agriculture Census [
17] and the 19th Livestock Census data [
18]. As one moves from less irrigated districts to more, bovine population density and herd efficiency ratio witness a gradual increase whereas population density of draught bovines gradually decrease. It shows a positive association between a district’s access to irrigation and its orientation towards dairying.
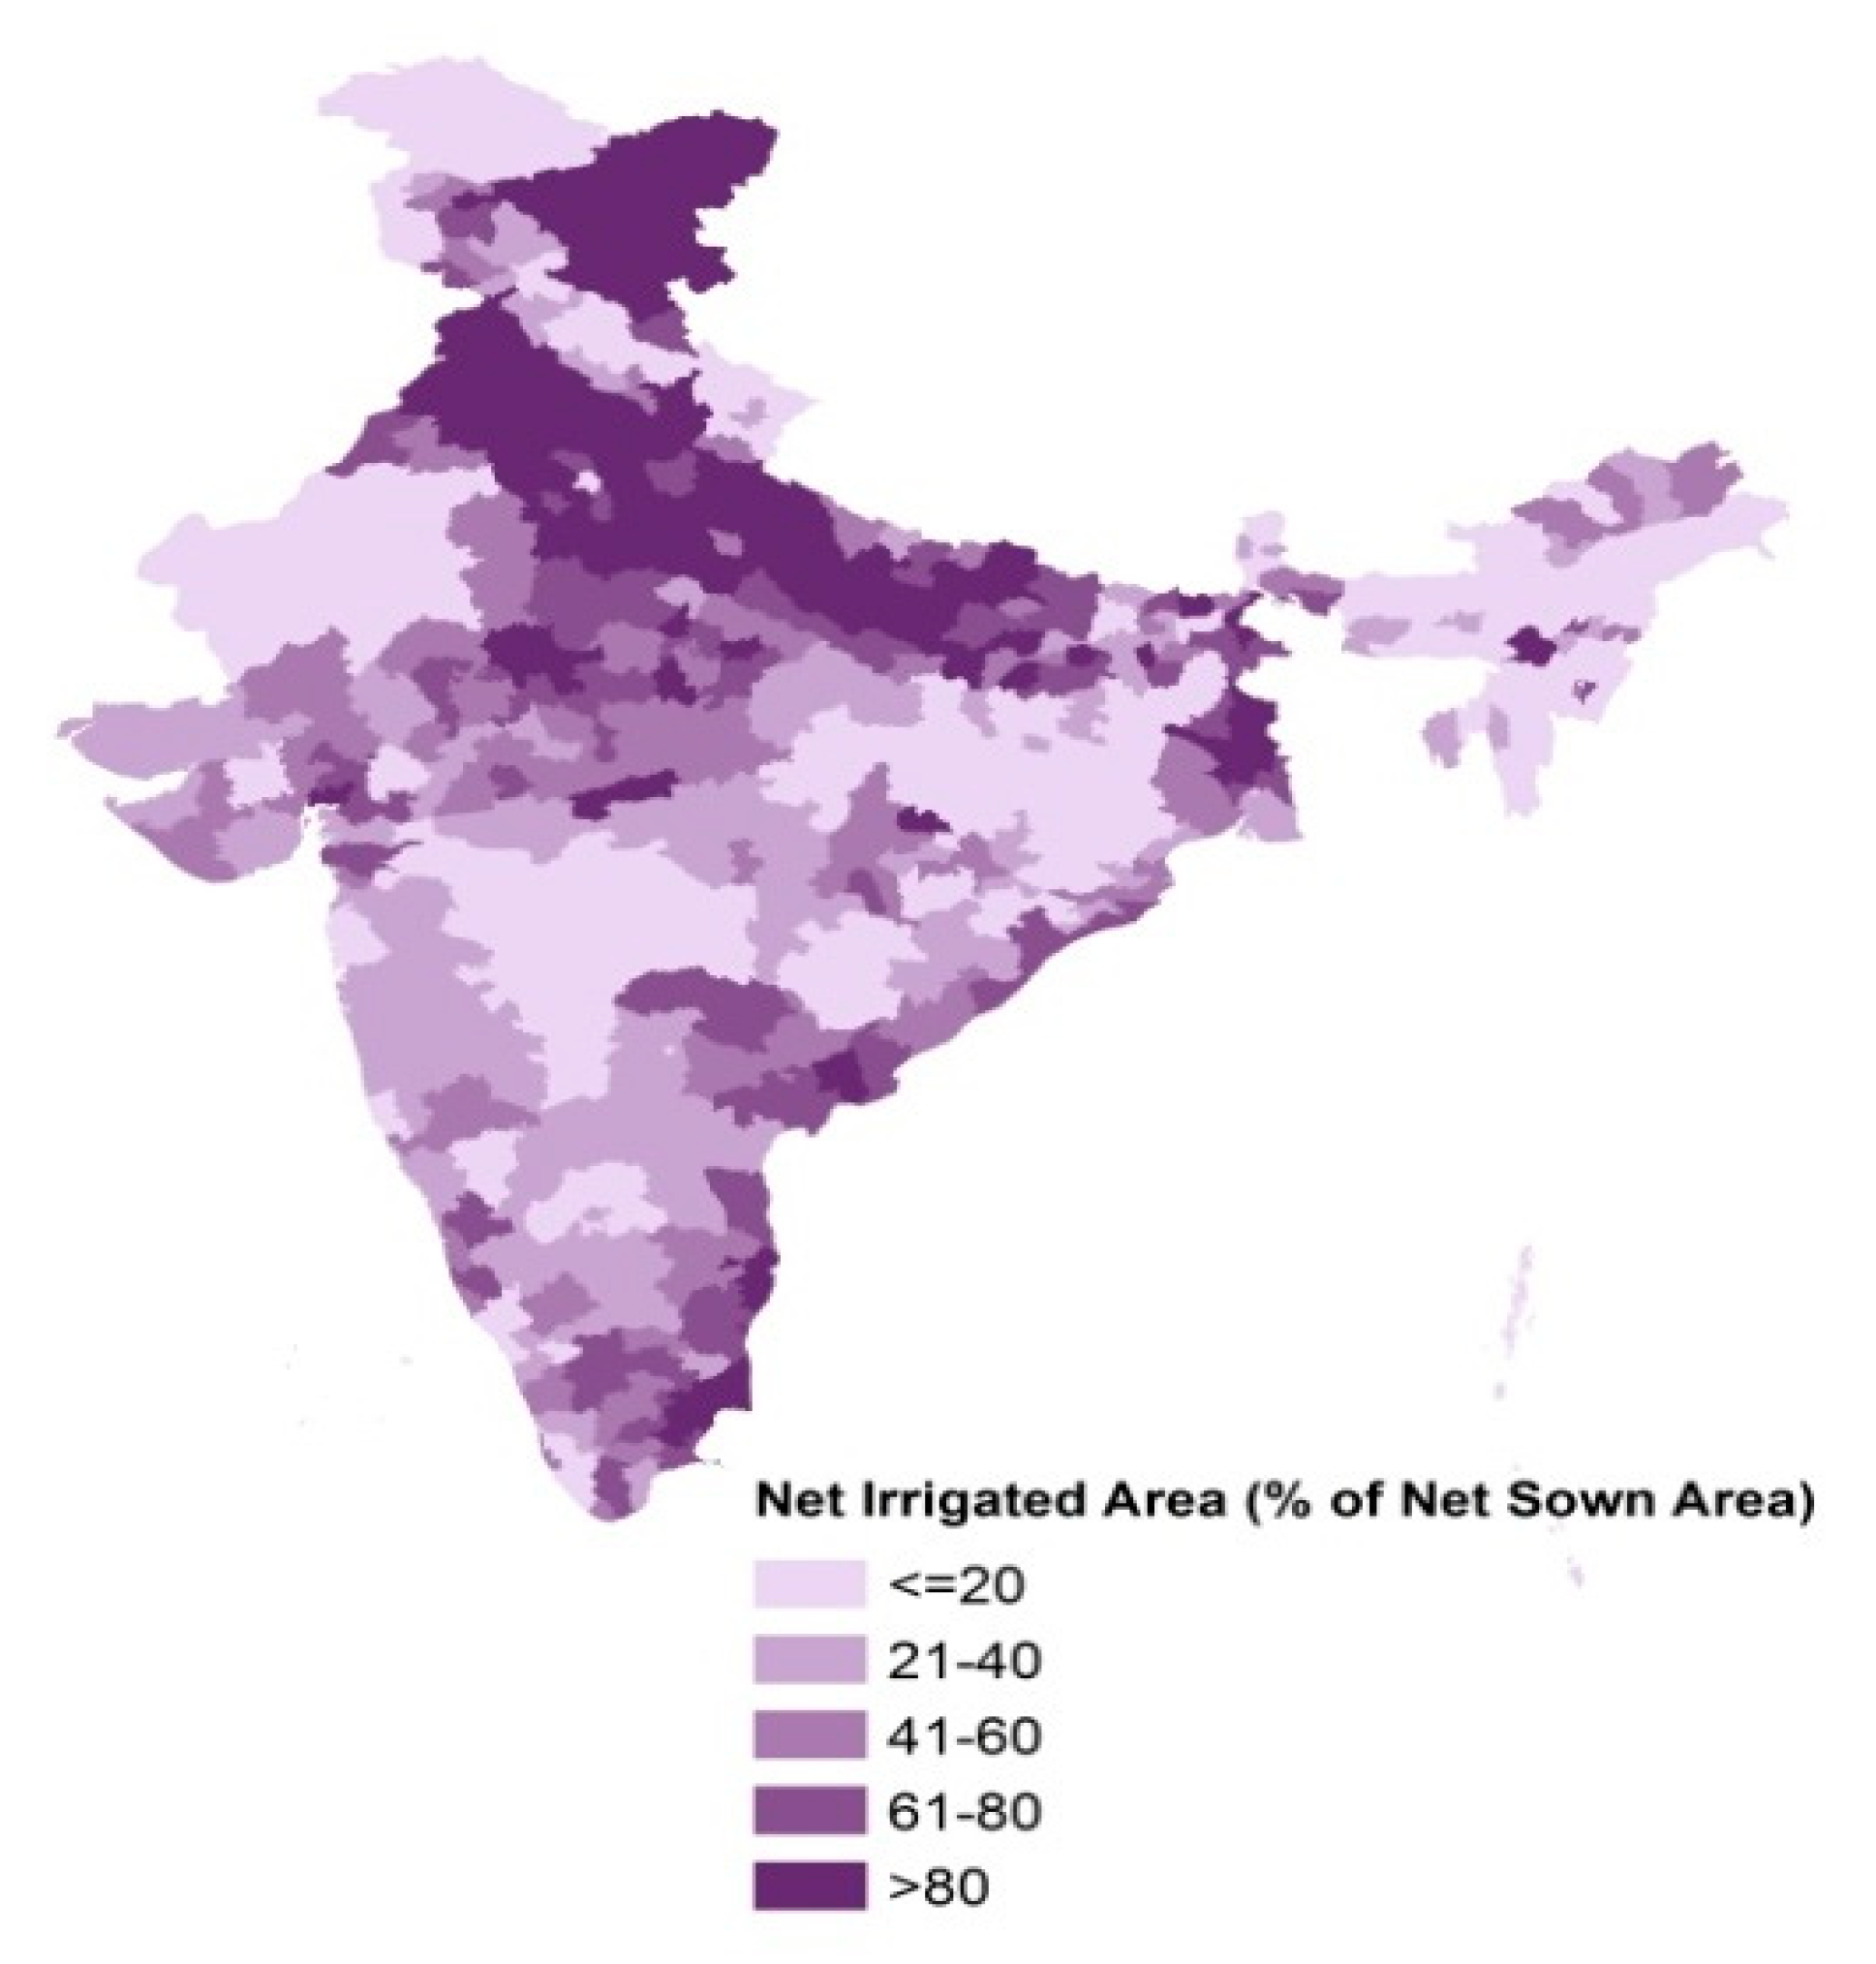
Figure 1 and
Figure 2 show the concurrence of high proportion of in-milk bovines in the bovine stock in highly irrigated regions of the Indo-Gangetic basin and western-peninsular India whereas low irrigated regions of central tribal regions—i.e., Jharkhand, Odisha, and Chhattisgarh—and pockets of Maharashtra (
Vidarbha region) and Madhya Pradesh exhibit poor herd efficiency ratio. In the irrigation-deprived districts, there is a need for the nuanced reading of the evidence. In the eastern tribal highlands characterized by subsistence agriculture and low irrigation, the relation proposed holds: Draught bovines dominate the bovine population and herd efficiency ratio is low. However, in similarly irrigation-deprived western Rajasthan, draught bovines have lost out to milk bovines and mixed farming system here has experienced heightened dairying-orientation (
Table 3). A growing market for milk and uses of groundwater irrigation for cultivating green fodder are the two major factors that have driven dairy development in sparsely irrigated pockets of western and peninsular India [
26].
2.2. Dairying in Groundwater Irrigated Regions
Decades after the Green Revolution, Indian irrigated agriculture now thrives on privately-owned well irrigation. Area under groundwater irrigation expanded from 12 million ha in 1970 to 40 million ha—around three-fifths of the total irrigated area—in 2010 [
27]. Expansion of groundwater irrigation has not only stabilized the agriculture but also supported in diversification of farm activities with other high-value complementary activities like animal husbandry, fisheries, and horticulture [
28]. Shah [
26] reported that dairy production, supported by groundwater-irrigated green fodder cultivation, emerged as a major farm diversification activity in the dry-land regions of Gujarat, Rajasthan, Karnataka, and Andhra Pradesh. Small-scale farmers of the dryland areas adopted bovines of enhanced breeds and cultivated year-round green fodder in their plots using groundwater irrigation to intensify dairy production. Based on a study conducted in four villages of Banaskantha district in Northern Gujarat, Kumar [
29] reported that dairy contributed to 45–75% of the farm economy generated from well irrigation in these villages. Kumar [
29] highlighted that “Dairying, which is the mainstay of the household economy, is influenced by well irrigation, too. The higher the amount of water available, the more livestock they keep and the more the go for cultivation of green fodder, which is the major source of fodder”. Kishore et al. [
23] conducted a regression analysis to assess the impact of different factors like human population, farm mechanization, irrigation, and other land-use variables on the emerging patterns of bovine demography in 460 districts of the country. This study showed a positive and statistically significant relationship between HER and groundwater irrigation. It estimated that for every percentage point increase in groundwater irrigated area tends to increase the HER by 0.05 percentage points in a district whereas surface water irrigation was statistically insignificant in the model.
A large 2011 national survey called the Indian Human Development Survey (IHDS II) [
30] also shows that households with wells have a heightened orientation towards dairying than households depending on surface water and rainfall.
Table 4 compares responses from 12,526 dairying households spread across the country, which were classified into three categories: households irrigating from groundwater, households irrigating from surface water, and rainfall dependent households.
Table 4 shows that average households with groundwater irrigation have more milch bovines and produce higher milk output than households served by canals and tanks and rainfed farmers.
Even recent censuses—19th livestock census and 9th agriculture census—support this proposition: as groundwater’s role in irrigation expands, so does the density of in-milk bovines, as the proportion of draught bovines drops (
Table 5). Districts of categories A and B, where surface-water irrigation is dominant, show an opposite trend.
2.3. Recursive Regression Model
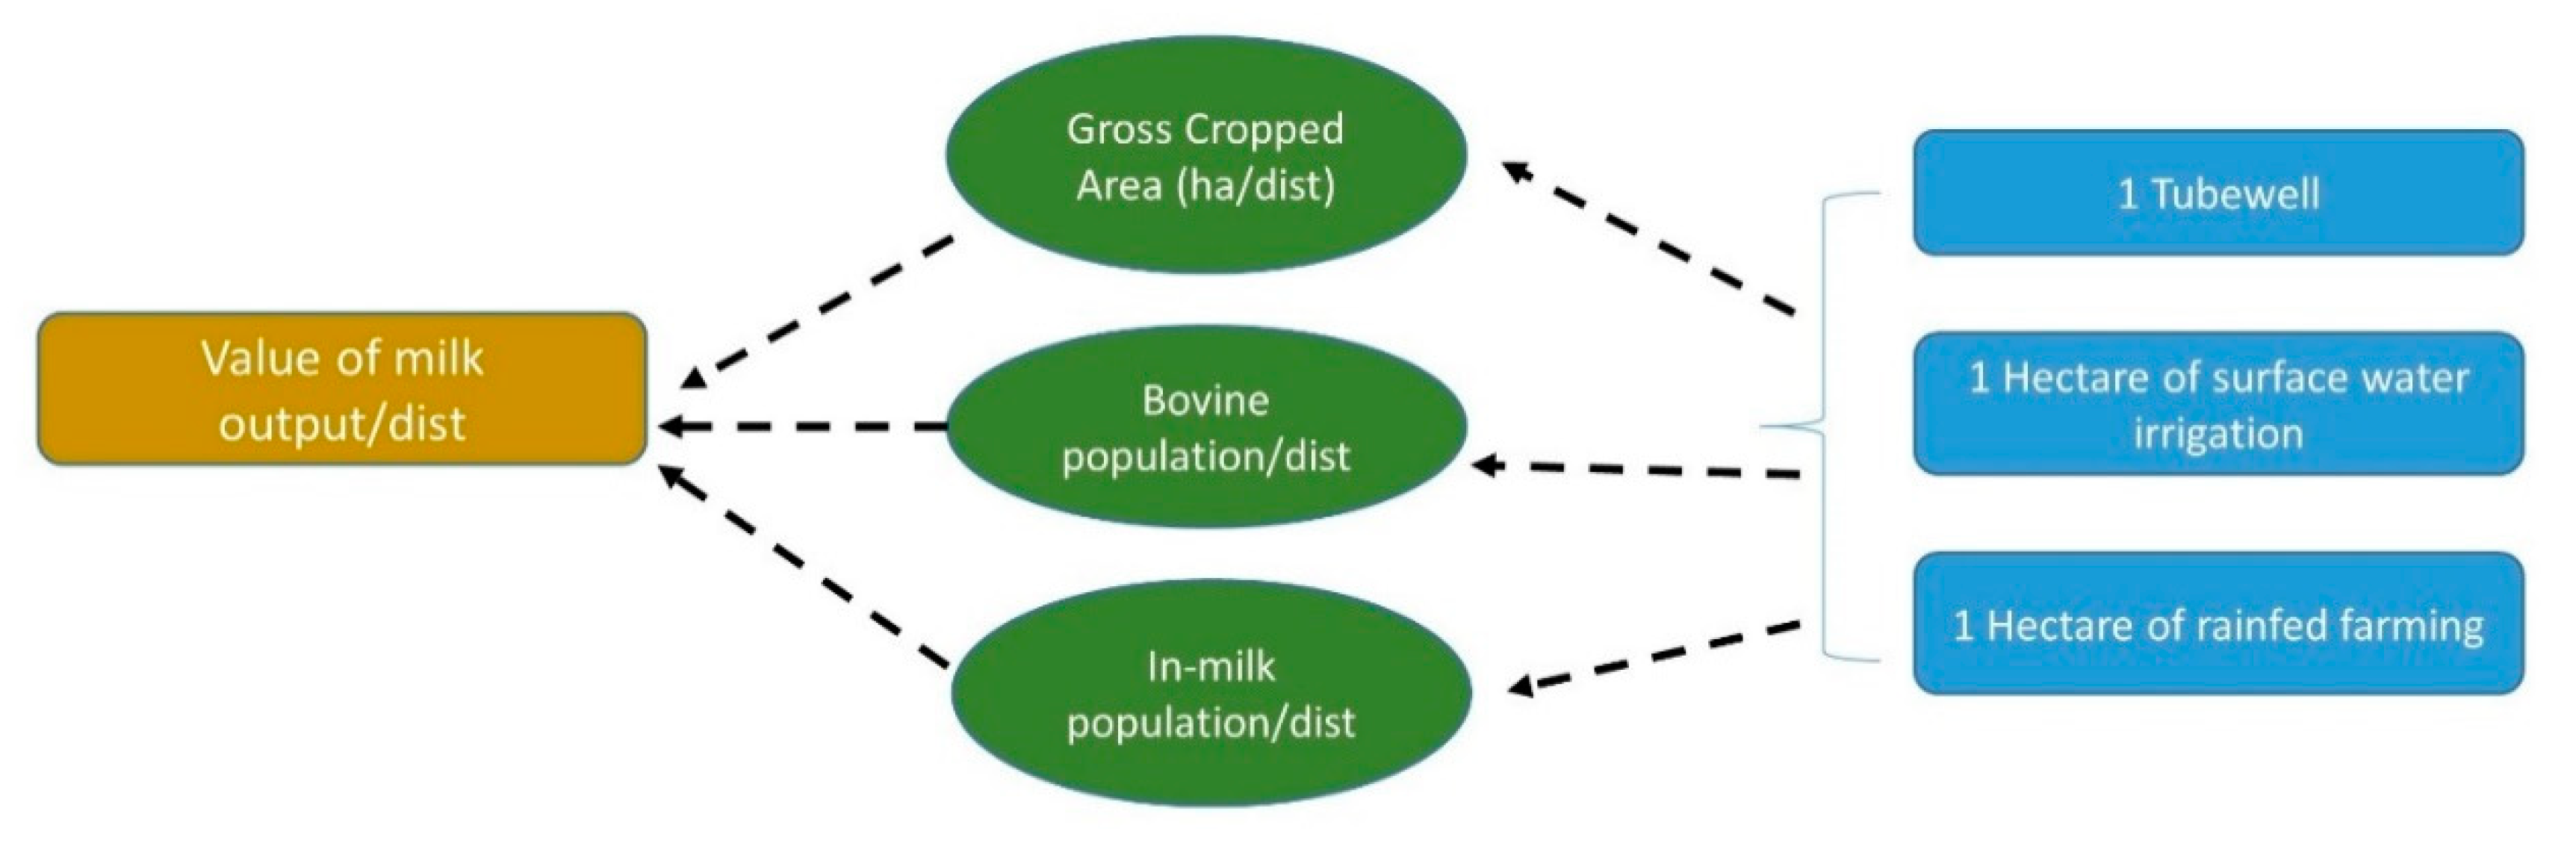
To further explore the relationship between irrigation and dairy development, we propose a hypothesis: different irrigation sources vary significantly in on-farm accessibility and water control offered to the small-holder farming households in a district; as a result, they have varied influence on the bovine demography and milk output. To test this hypothesis, we report a simple four-equation architecture that avoids simultaneity through a recursive model specification.
Figure 3 shows the design of the empirical model,
Table 6 represents the four equations, and
Table 7 explains the different variables used in the model. In the model, the value of milk output is the target variable that is explained by irrigation variables through a set of intermediate variables such as gross cropped area, total bovine population and in-milk bovine population. Regional dummies (D1, D2, D3, and D4;
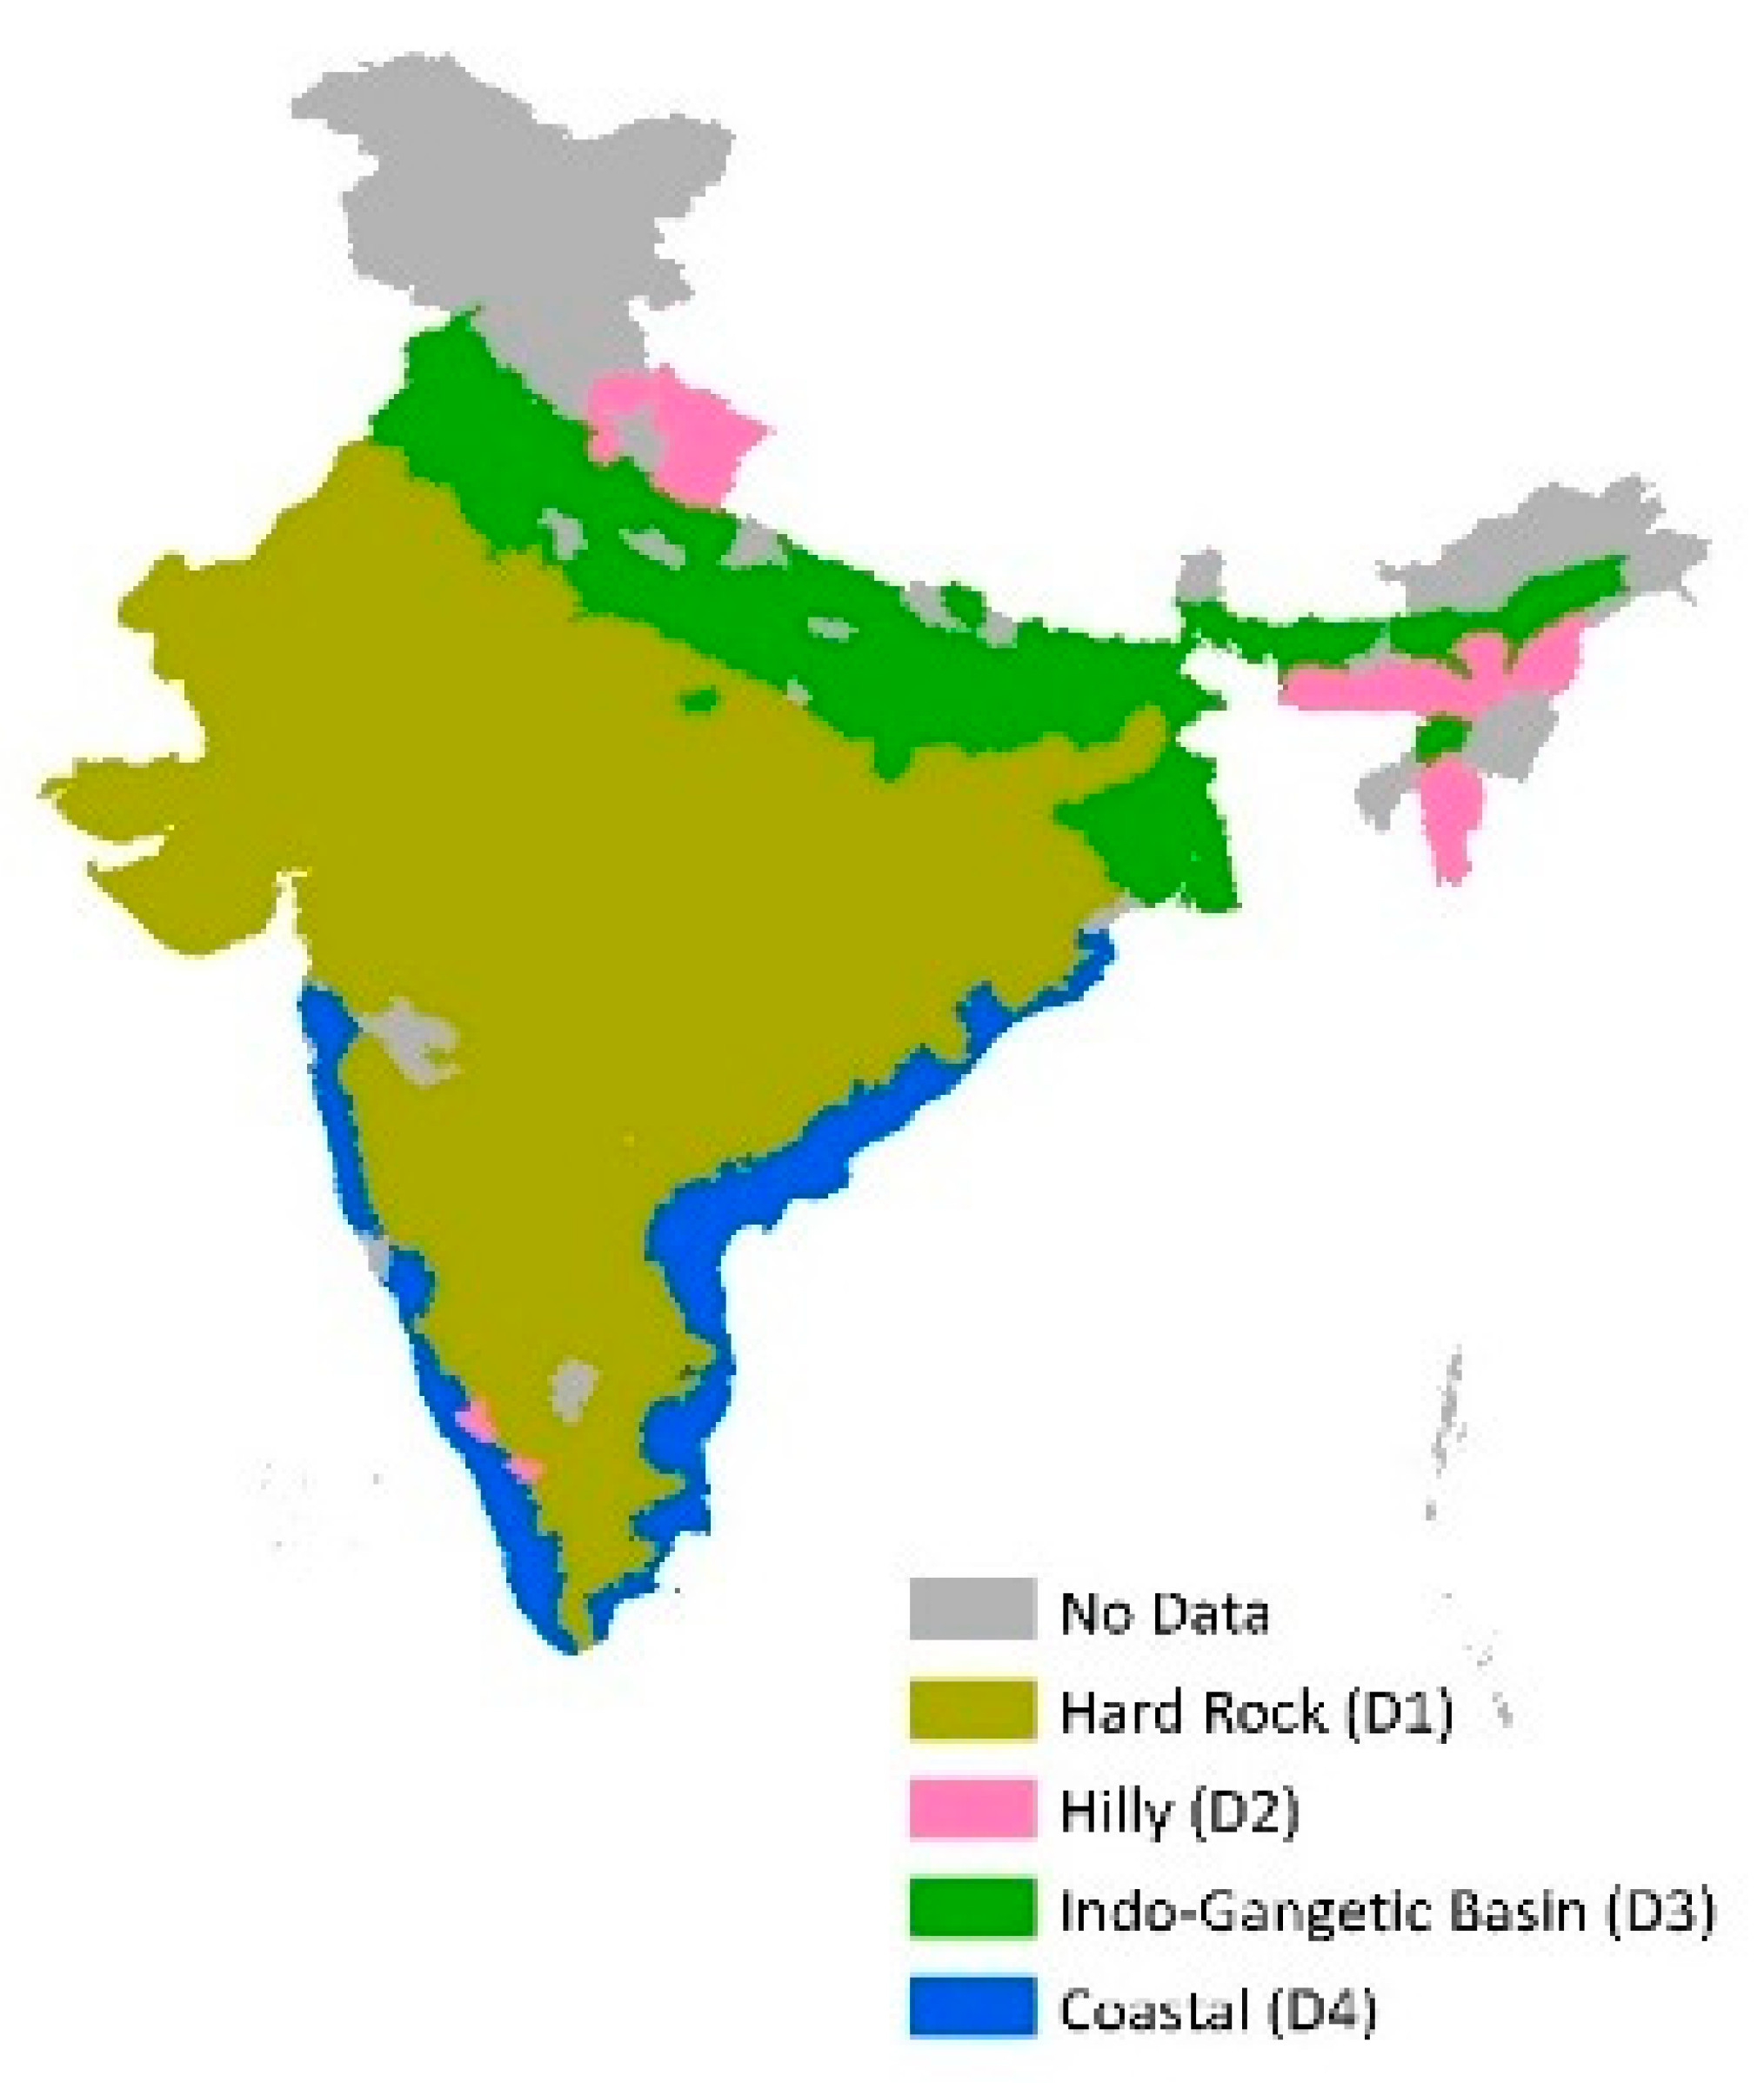
Figure 4) are used to control the variability in the agro-climatic conditions across the districts of the country. The model estimates the impact of adding one well, one hectare of surface water, and one hectare of rainfed farming on the gross value of milk output of a district.
3. Results and Discussion
Table 8 summarizes the results of our recursive regression model. The key points emerging from the model are:
3.1. In-Milk Bovines
Irrigation variables, groundwater irrigation, surface water irrigation, and a variable representing rainfall dependent area had positive coefficients and were statistically significant (column 2 of
Table 8). We found that adding area under groundwater irrigation had the maximum impact on the in-milk bovine stock of the district. According to the model,
ceteris paribus, the addition of 100 groundwater wells (GWS) increased the in-milk bovine population by 143 heads (InMBov = 0.89*100 + 0.19*2.93). Assuming one well irrigates approximately 2 hectares of cultivated area, it comes around to be addition of 72 in-milk bovine heads per 100 hectares of groundwater irrigated area in a district. Moreover, increasing surface water irrigated area in the district by 100 hectares increased in-milk bovine stock by 41 heads and adding 100 hectares of rainfed area added only 12 heads of in-milk bovines.
3.2. Total Bovine Population
Irrigation variables, groundwater irrigation, surface water irrigation, and the variable representing rainfall dependent area were positively and significantly related with the total bovine population (column 3 of
Table 8). We found that adding area under groundwater irrigation in a district had the maximum impact on the bovine stock. According to the model,
ceteris paribus, adding 100 groundwater wells (GWS) increased bovine stock by 293 heads (i.e., 146 bovine heads per 100 hectares of groundwater irrigated area). Moreover, adding 100 hectares of surface water irrigated areas increased bovine stock by 129 heads and adding 100 hectares of rainfed area adds only 49 heads in the bovine stock. These findings were significant because they had a wide varying impact on incremental bovine herd efficiency. Adding 100 hectares of groundwater irrigated area increased bovine numbers by 146 but 48% of these were in-milk bovines. In contrast, adding 100 ha of surface water irrigated area added results in addition of 129 bovines where 31% of them were in-milk; adding 100 ha of rainfed areas results in addition of 49 bovines with only 25% of them as in-milk. This supports our hypothesis that groundwater irrigation enhances milk production by increasing bovine herd efficiency and strengthening dairy orientation.
3.3. Gross Cropped Area
We found a positive and statistically significant relationship between GCA and irrigation variables, groundwater irrigation, surface water irrigation, and a variable representing rainfall dependent area (column 4 of
Table 8). The equation indicated that groundwater irrigated areas, which provide year-round access to on-farm water with greater water control than the rainfed and surface-water irrigated conditions, had maximum cropping intensity. This result implied that groundwater irrigated areas with intense cropping ensure regular supply of feed and fodder for the maintenance of bovines.
3.4. Value of Milk Output (GVA-M)
The milk output equation suggested that in-milk bovines and gross cropped area had a positive and significant impact on the value of milk output of a district (column 5 of
Table 8). Adding one in-milk bovine added INR 33,617 (equivalent to US
$747) to the district’s gross value of milk output. However, the number of total bovines had a mildly negative impact on the district’s value of milk output, highlighting the importance of herd efficiency ratio. This is not surprising; large bovine herd dip into the feed and fodder resources but most heads do not contribute to dairy production and make ‘selective feeding’ to in-milk animals difficult. The model also suggested a strong and positive correlation between milk output and GCA, highlighting the importance of the regular supply of crop-residues and green fodder.
Using the four-equation recursive model, we estimated that the incremental impact of adding 100 groundwater wells, 100 hectares of surface irrigated area, and 100 hectares of rainfed area on the gross value of milk output of a district.
Table 9 encapsulates the incremental change in bovine stock, in-milk bovine population, and value of milk output in given conditions. Adding a well added nearly 3.5 times more value of milk output to a district compared to a hectare of land brought under the surface water irrigation. Assuming that one groundwater well on an average irrigates 2 hectares of land, adding a hectare of groundwater irrigated area adds nearly two times more value of milk output to the addition of one hectare of surface water irrigated area, and five times more value of milk output to the addition of one hectare of rainfed area.
We further used the recursive model to predict the contribution of different irrigation regimes in India’s milk economy (
Table 10).
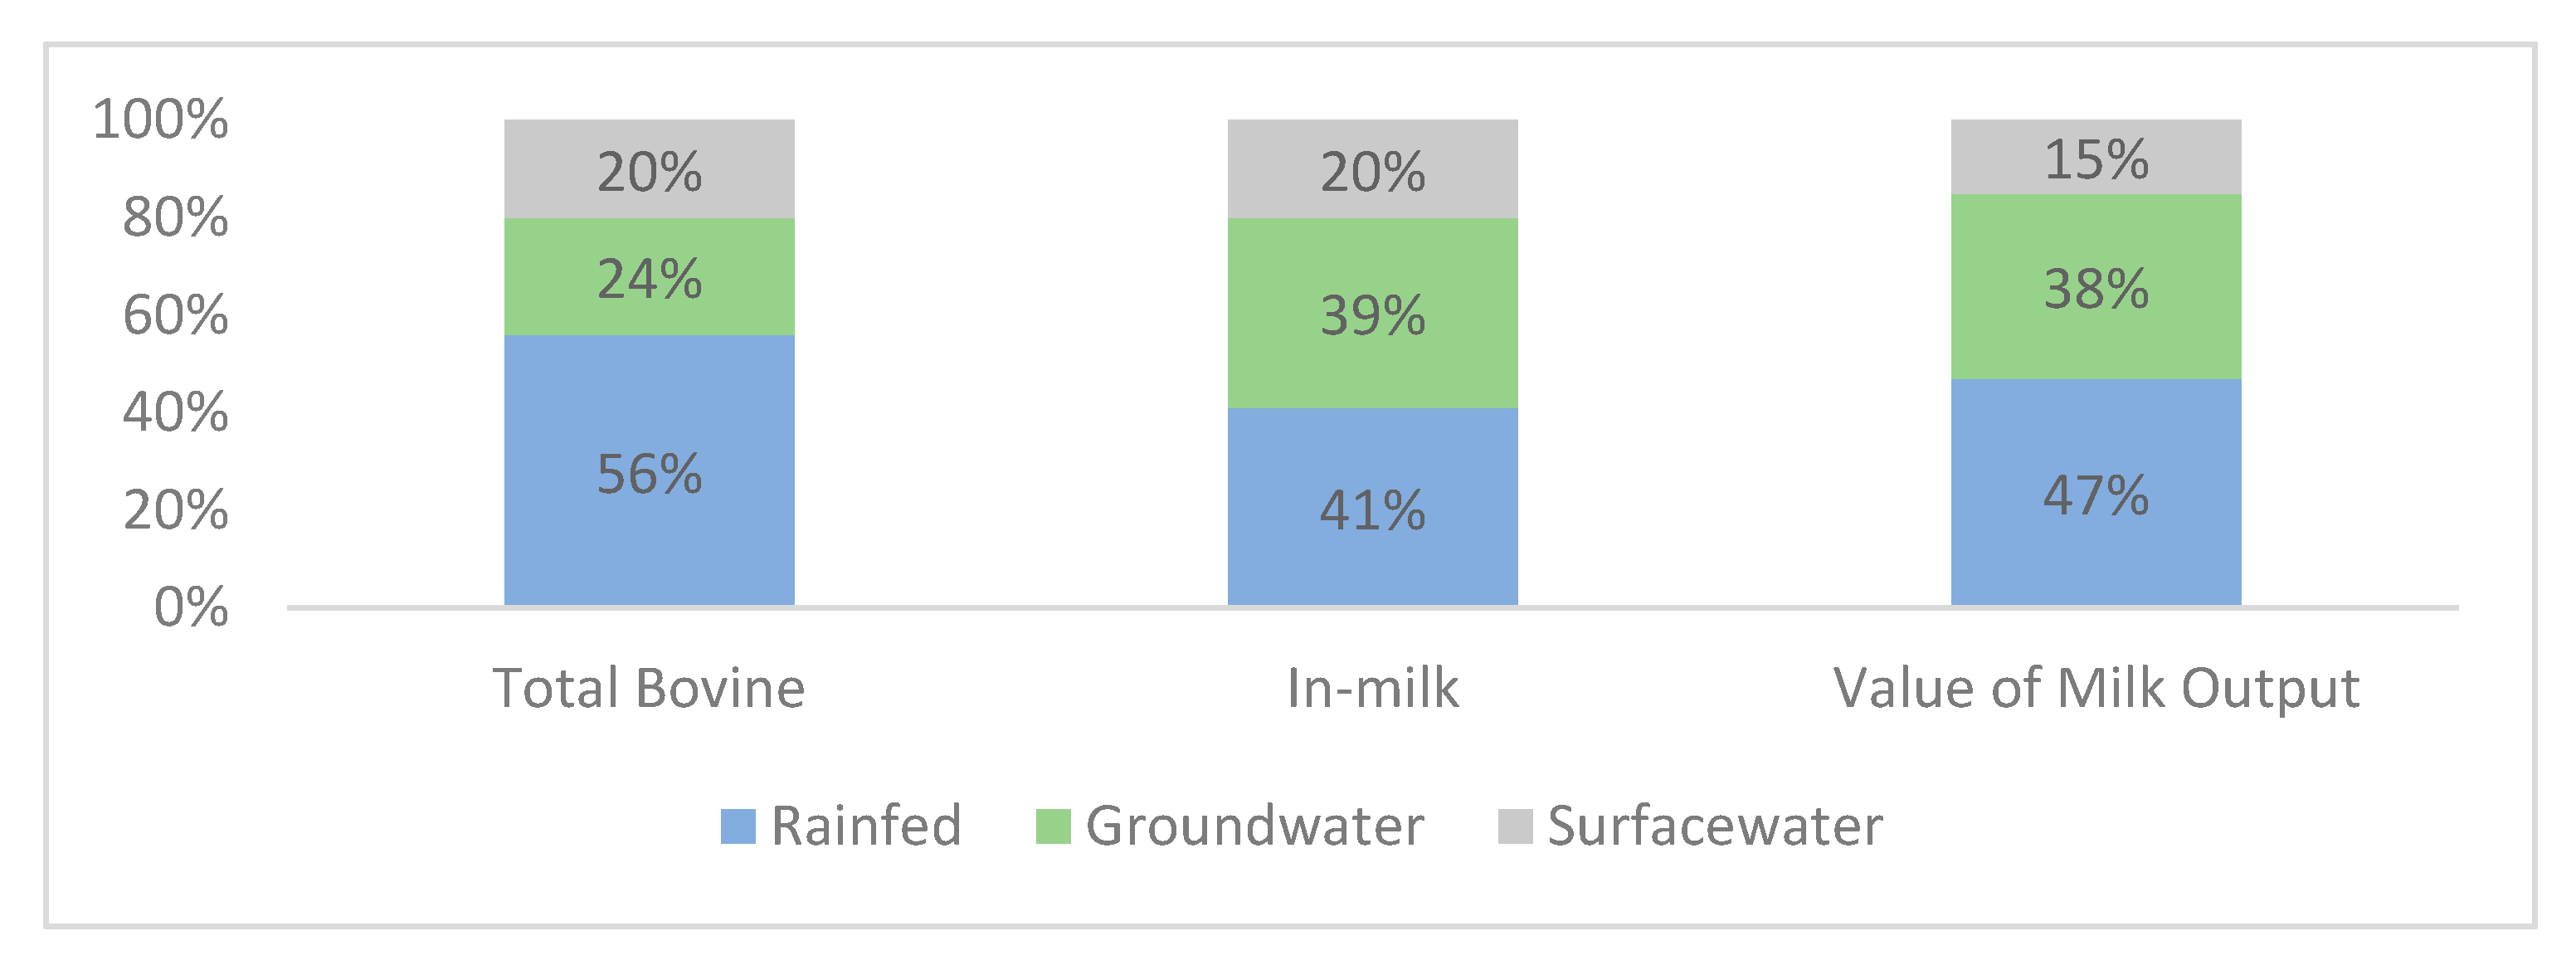
Figure 5 shows that rainfed conditions (47%) have the largest contribution to the country’s gross value of milk output, followed by groundwater-dependent area (38%), and surface-water dependent area (15%). However, of all the irrigation regimes, areas dependent on groundwater irrigation maintains the most efficient bovine herd for milk production, as they account for only 24% of country’s bovine stock but contribute to 38% of total gross value of milk output; in comparison, surface water contributes just 15% when their share in total bovine stock is 20%.
4. Conclusions and Policy Implications
This study captures the close association between dairy intensification and access to irrigation in the context of a mixed farming system in 590 districts of country. Trends from several datasets and surveys show the gradual increase in dairy intensification activities as one move from districts with low irrigated areas to highly irrigated ones. Of all the different irrigation modes, groundwater irrigation has the most pronounced impact on improved bovine management and dairy production. Our recursive model suggests that expanding groundwater irrigation has the maximum impact on the efficiency of bovine herd management and milk output when compared to surface water irrigation and rainfed farming. Since there has been little literature comparing the contribution of different irrigation modes to the gross value of milk output, this paper attempted to quantify the relative shares of groundwater, surface water, and rainfed conditions to the gross value of milk output. The results showed that rainfed mixed farming system account for the lion’s share―47% of the total value of milk, as they have the biggest share in total bovine stock (56%). However, groundwater irrigated mixed farming emerges as the most efficient production system as they contribute to 38% of total value of milk output while they own only 24% of the total bovine stock.
Dairying is central to India’s rural economy. It is a supplementary source of cash incomes to around two-thirds of India’s farming community (around 70 million households), which contributes around one-third to their gross incomes and is a major source of nutritional security to millions. With an increasing population, rising incomes, and greater interest in nutrition, Indian dairying have to grow rapidly to outpace the demand. In this demand-led growth scenario, a rapid increase in milk supply can only be realized by enhancing milk productivity, increasing herd efficiency ratio, and having plentiful supply of feed and fodder for the maintenance of bovines. Supply-side factor like improved access to groundwater irrigation can help farmers in intensifying their land use for improved availability of crop residues, diversifying their cropping activity for green fodder production, and achieving higher levels of farm mechanization which will positively influence the herd efficiency ratio.
Our analysis shows the dominance of rainfed mixed farming in the pockets of eastern and tribal India and was concentrated in states of Assam, Chhattisgarh, Jharkhand, Odisha, Maharashtra, and Madhya Pradesh. All of these states have a low proportion of in-milk bovines in the herd and dairying lags in the region when compared to rest of India (see
Figure 1;
Table 1). Together, this region accounts for around 28–30% of the total bovine stock, while their contribution to total milk output is only 14–15%. Not only that, these districts are home to the largest concentrations of poverty in the country. Studies have highlighted the high correlation between rain-fed farming and high-incidence of agrarian poverty in these regions [
31,
32]. Shah et al. [
33] have highlighted the abundant replenishable groundwater available for future irrigation development in this region. Investing public resources to increase access to groundwater irrigation, shifting from rainfed mixed farming to groundwater based irrigated mixed farming, will galvanize dairy intensification activities which will boost supplemental incomes and improve nutritional security of millions of households of this region.
Author Contributions
Conceptualization, T.S. and A.R.; Methodology, T.S. and A.R.; Software, A.R.; Validation, T.S. and A.R.; Formal Analysis, A.R. and T.S.; Investigation, A.R.; Resources, A.R.; Data Curation, A.R.; Writing—Original Draft Preparation, A.R.; Writing—Review and Editing, T.S.; Visualization, A.R.; Supervision, T.S. All authors have read and agreed to the published version of the manuscript.
Funding
This research received no external funding.
Acknowledgments
The research presented in this paper was undertaken as part of the IWMI-Tata Water Policy Program―a co-equal partnership between International Water Management and Tata Trusts, Mumbai. This work was supported by CGIAR’s Water, Land and Ecosystems (WLE) research program.
Conflicts of Interest
The authors declare no conflict of interest.
Appendix A
Figure A1.
State-wise Map of India.
Figure A1.
State-wise Map of India.
References
- Seré, C.; Steinfeld, H. World Livestock Production Systems; FAO Animal Production and Health Paper 127; Food and Agriculture Organization of the United Nations: Rome, Italy, 1996; pp. 1–51. [Google Scholar]
- Robinson, T.; Thornton, P.; Franceschini, G.; Kruska, R.; Chiozza, F.; Notenbaert, A.; Cecchi, G.; Herrero, M.; Epprecht, M.; Fritz, S.; et al. Global Livestock Production Systems; Food and Agriculture Organizations of the United Nations: Rome, Italy, 2011; pp. 1–152. [Google Scholar]
- Rao, P.P.; Birthal, P. Livestock in Mixed Farming Systems in South Asia; International Crops Research Institute for the Semi-Arid Tropics: Patancheru, India, 2008; pp. 1–156. [Google Scholar]
- Hann, C.D.; Steinfeld, H. Livestock & the Environment: Finding a Balance; European Commission Directorate-General for Development, Development Policy Sustainable Development and Natural Resources: Brussels, Belgium, 1997; pp. 1–115. [Google Scholar]
- Kumar, A.; Singh, D. Livestock Production System in India: An Appraisal across Agro-Ecological Regions. Indian J. Agric. Econ. 2008, 63, 577–597. [Google Scholar]
- Phansalkar, S.J. Livestock-Water Interaction: Status and Issues; International Water Management Institute: Colombo, Sri Lanka, 2006; pp. 1–15.
- Amarsinghe, U.A.; Shah, T.; Smakhtin, V. Water-milk nexus in India: A path to a sustainable water future? Int. J. Agric. Sustain. 2011, 10, 93–108. [Google Scholar] [CrossRef]
- Singh, O.P.; Sharma, A.; Singh, R.; Shah, T. Virtual Water Trade in Dairy Economy Irrigation in Water Productivity. Econ. Pol. Wkly. 2004, 39, 3492–3497. [Google Scholar]
- Mekonnen, M.M.; Hoekstra, A.Y. A Global Assessment of the Water Footprint of Farm Animal Products. Ecosystems 2012, 15, 401–415. [Google Scholar] [CrossRef]
- Cosentino, C.; Adduci, F.; Musto, M.; Paolino, R.; Freschi, P.; Pecora, G.; D’adamo, C.; Valentini, V. Low vs High “water footprint assessment” diet in milk production. A comparison between triticale and corn silage-based diets. Emir. J. Food Agric. 2015, 27, 312–317. [Google Scholar] [CrossRef]
- Dhawan, B.D. Irrigation in India’s Agricultural Development; SAGE: New Delhi, India, 1988; pp. 1–271. [Google Scholar]
- Sinha, A.K. Impact of Lift Irrigation on Cropping Pattern and Crop Yields Based on a Five Village Survey in Bhiwani, Haryana. Indian J. Agric. Econ. 1978, 33, 77–92. [Google Scholar]
- Freschi, P.; Musto, M.; Paolino, R.; Cosentino, C. Grazing and biodiversity conservation: Highlights on a natura 2000 network site. In The Sustainability of Agro-Food and Natural Resource Systems in the Mediterranean Basin; Vastola, A., Ed.; Springer: Cham, Switzerland, 2015; pp. 271–288. [Google Scholar]
- Meinzen-Dick, R. Groundwater Markets in Pakistan: Participation and Productivity; Research Report No. 105; International Food Policy Research Institute (IFPRI): Washington, DC, USA, 1997; pp. 1–76.
- Government of India. 4th Census of Minor Irrigation Schemes Report; Ministry of Water Resources, River Development and Ganga Rejuvenation, Minor Irrigation (Statistics) Wing; Government of India: New Delhi, India, 2014.
- District-wise Land Use Statistics. Available online: https://aps.dac.gov.in/LUS/Index.htm (accessed on 18 April 2019).
- 9th Agricultural Census 2010–11. Available online: https://agcensus.nic.in (accessed on 23 April 2018).
- 19th Livestock Census. Available online: http://dahd.nic.in/documents/statistics/livestock-census (accessed on 23 April 2019).
- National Dairy Development Board. Available online: http://nddb.coop/information/pubs (accessed on 1 May 2019).
- Rajeshwaran, S.; Naik, G.; Dhas, A.C. Rising Milk Price–A Cause for Concern on Food Security; Working Paper 472; Indian Institute of Management: Bangalore, India, 2014; pp. 1–39. [Google Scholar]
- Kurien, V. India’s Milk Revolution. Bull. Nutr. Found. India 2000, 21, 1–5. [Google Scholar]
- Pingali, P.L. Green Revolution: Impacts, limits, and the path ahead. Proc. Natl. Acad. Sci. USA 2012, 109, 12302–12308. [Google Scholar] [CrossRef] [PubMed]
- Kishore, A.; Birthal, P.; Joshi, P.K.; Shah, T.; Saini, A. Patterns and Drivers of Dairy Development in India: Insights from Analysis of Household and District-level Data. Agric. Econ. Res. Rev. 2016, 29, 1–14. [Google Scholar] [CrossRef]
- Bhattarai, M.; Narayanamoorthy, A. Impact of irrigation on agricultural growth and poverty alleviation: Macro level analyses in India. In Water Policy Research Highlight 12; IWMI-Tata Water Policy Program: Anand, India, 2003; pp. 1–7. [Google Scholar]
- Erenstein, O.; Thorpe, W.; Singh, J.; Varma, A. Crop-livestock interactions and livelihoods in the Indo-Gangetic Plains. In India: A Regional Synthesis; International Maize and Wheat Improvement Centre: Texcoco, Mexico, 2007; pp. 1–38. [Google Scholar]
- Shah, T. Taming the Anarchy: Groundwater Governance in South Asia; Resources for the Future: Washington, DC, USA, 2003; pp. 1–311. [Google Scholar]
- Source-wise Irrigation of India. Available online: https://www.indiastat.com/agriculture-data/2/irrigation/145/source-wise-irrigation-area-1950–2015/449345/stats.aspx (accessed on 18 April 2019).
- Joshi, P.K.; Gulati, A.; Birthal, P.S.; Tiwari, L. Agriculture Diversification in South Asia: Pattern, Determinants and Policy Implications. Econ. Pol. Wkly. 2004, 39, 2457–2467. [Google Scholar]
- Kumar, D. Groundwater Management in India: Physical, Institutional and Policy Alternatives; SAGE: New Delhi, India, 2007; pp. 1–355. [Google Scholar]
- India Human Development Survey-II. Available online: https://www.ihds.umd.edu/IHDS-II (accessed on 3 March 2017).
- Phansalkar, S.; Verma, S. Rethinking Tribal Development: Water Management Strategies for Revitalizing Tribal Agriculture in central India. In IWMI Water Policy Briefing; International Water Management Institute: Colombo, Sri Lanka, 2007; pp. 1–9. [Google Scholar]
- Murali, J.; Afifi, T. Rainfall variability, food security and human mobility in the Janjgir-Champa district of Chhattisgarh district, India. Clim. Dev. 2013, 6, 28–37. [Google Scholar] [CrossRef]
- Shah, T.; Verma, S.; Durga, N.; Rajan, A.; Goswami, A.; Palrecha, A. Har Khet ko Pani: Rethinking Pradhan Mantri Krishi Sinchai Yojana (PMKSY). In IWMI-Tata Policy Paper; International Water Management Institute: Colombo, Sri Lanka, 2016; pp. 1–42. [Google Scholar]
Figure 1.
Access to Irrigation in 590 districts of India in 2010.
Figure 1.
Access to Irrigation in 590 districts of India in 2010.
Figure 2.
Herd Efficiency Ratio in 590 districts of India in 2012.
Figure 2.
Herd Efficiency Ratio in 590 districts of India in 2012.
Figure 3.
Design of the recursive model.
Figure 3.
Design of the recursive model.
Figure 4.
Regional dummy variables.
Figure 4.
Regional dummy variables.
Figure 5.
Share of rainfed, groundwater irrigated, and surface water irrigated areas in the total bovine population, in-milk bovine population, and value of milk output, respectively.
Figure 5.
Share of rainfed, groundwater irrigated, and surface water irrigated areas in the total bovine population, in-milk bovine population, and value of milk output, respectively.
Table 1.
Sources of data.
Table 1.
Sources of data.
| Variables | Data Source |
|---|
| Number of Groundwater Structures (GWS) | 4th Minor Irrigation Census of India 2006 [15] |
| Gross Cropped Area | District-wise Land Use Statistics 2010 [16] |
| Groundwater Irrigated Area (GWIA) | 9th Agricultural Census of India 2010 [17] |
| Surface Water Irrigated Area (SWIA) |
| Canal Irrigated Area |
| Tank Irrigated Area |
| Area Irrigated by Other Sources |
| Net Sown Area (NSA) |
| Net Irrigated Area (NIA) |
| Total Bovine Population (ToBov) | 19th Livestock Census of India 2012 [18] |
| In-Milk Bovine Population (InMBov) |
| Herd Efficiency Ratio (HER) |
| Daily Milk Production | National Dairy Development Board 2010 [19] |
| Market Price of Milk | Rajeshwaran et al. (2014) † [20] |
| Gross Value of Milk Output (GVA-M) | Calculated from milk production and liquid milk price |
Table 2.
Net irrigated area, bovine density, herd efficiency ratio, and draught bovine density in 590 districts of India.
Table 2.
Net irrigated area, bovine density, herd efficiency ratio, and draught bovine density in 590 districts of India.
| Net Irrigated Area (% of NSA) | Number of Districts | Herd Efficiency Ratio (HER) (in %) | Bovine Density (Per 100 ha of NSA) (Average) | Draught Bovine Density (Per 100 ha of NSA) (Average) |
|---|
| <20% | 183 | 21 | 179 | 53 |
| 20–40% | 111 | 25 | 184 | 38 |
| 40–60% | 91 | 27 | 212 | 27 |
| 60–80% | 84 | 29 | 250 | 23 |
| >80% | 121 | 32 | 268 | 18 |
Table 3.
Comparison of Bovine Demography in two Irrigation Deprived regions.
Table 3.
Comparison of Bovine Demography in two Irrigation Deprived regions.
| | Eastern Tribal Highlands | Western Rajasthan |
|---|
| Draught Bovines (% of Bovine Stock) | 45 | 22 |
| Herd Efficiency Ratio (%) | 14 | 25 |
Table 4.
Average value of milk production per household under groundwater irrigation, surface water irrigation, and rainfed farming (Source: Indian Human Development Survey (IHDS II) Survey).
Table 4.
Average value of milk production per household under groundwater irrigation, surface water irrigation, and rainfed farming (Source: Indian Human Development Survey (IHDS II) Survey).
| | Groundwater Irrigation | Surface Water Irrigation | Rainfall Dependent |
|---|
| Number of households (hh) with milch bovines | 4838 | 1650 | 6038 |
| Milch bovines per 100 households | 192 | 170 | 157 |
| Value of milk output per Household (Rs.) | 8780 | 6975 | 6530 |
Table 5.
Impact of groundwater irrigation on parameters of bovine demography.
Table 5.
Impact of groundwater irrigation on parameters of bovine demography.
| Category: Groundwater Irrigated Area (% of Net Irrigated Area) | No. of Districts | Share in Total NSA(%) | Bovine Population (per 100 ha of NSA) | Herd Efficiency Ratio | Draught Bovine Population (per 100 ha of NSA) |
|---|
| A: <=20% | 177 | 14 | 255 | 22 | 65 |
| B: 20–40% | 64 | 12 | 204 | 23 | 48 |
| C: 40–60% | 71 | 16 | 184 | 26 | 28 |
| D: 60–80% | 120 | 25 | 215 | 27 | 32 |
| E: >80% | 158 | 32 | 210 | 31 | 21 |
Table 6.
Four-equations of recursive model.
Table 6.
Four-equations of recursive model.
| S. No | Equations |
|---|
| 1 | ToBov = a (GWS;SWAr; RaAr; D1; D2; D3; D4) |
| 2 | InMBov = b (ToBov; GWS; SWAr; RaAr; D1; D2; D3; D4) |
| 3 | GCA= c (GWS; SWAr; RaAr; D1; D2; D3; D4) |
| 4 | GVA-M = d (InMBov; ToBov; GCA; D1; D2; D3; D4) |
Table 7.
Variables used in the four-equation recursive model.
Table 7.
Variables used in the four-equation recursive model.
| Variables | Definition | Units |
|---|
| GWS | Number of Groundwater Structures in the District | Number |
| SWAr | Area irrigated by canals, tanks and other sources in the District | Hectares (Ha.) |
| RaAr | Rainfed Area in the District | Hectares (Ha.) |
| ToBov | Total Bovine Population in the District | Number |
| GCA | Gross Cropped Area area under cereals, pulses and oilseeds in the District | Hectares (Ha.) |
| InMBov | In-Milk Bovine Population in the District | Number |
| ToBov | Total Bovine Population in the District | Number |
| GVA-M | Gross Value of Milk Output | Indian Rupees (INR) |
| D1 | Dummy variable for Hard Rock districts | |
| D2 | Dummy variable for Hilly districts | |
| D3 | Dummy variable for districts in the Indo-Gangetic Plains | |
| D4 | Dummy variable for Coastal districts | |
Table 8.
Recursive model results.
Table 8.
Recursive model results.
| Dependent/Independent Variables | InMBov [1] | ToBov [2] | GCA [3] | GVA-M [4] |
|---|
| GWS | 0.89 ** | 2.93 ** | 1.89 ** | -- |
| SWAr | 0.16 ** | 1.29 ** | 1.19 ** | -- |
| RaAr | 0.03 * | 0.49 ** | 0.97 ** | -- |
| ToBov | 0.19 ** | -- | -- | −3570 ** |
| InMBov | -- | -- | -- | 33,617 ** |
| GCA | -- | -- | -- | 2089 ** |
| D2 | 22,612 ** | −219,506 ** | −54,927 * | 26,300,000 |
| D3 | 19,909 ** | 59,179 * | 35,082 * | 1,420,000,000 ** |
| D4 | 11,427 | −17,696 * | −96,469 ** | 1,930,000,000 ** |
| Constant | −9129 | 345,825 ** | 60,407 ** | 1,674,458 |
| R2 | 0.78 | 0.47 | 0.72 | 0.68 |
Table 9.
Impact of adding 100 hectares of canal irrigation, 100 well, and 100 hectares of rainfed farm to the value of total bovine population, in-milk bovine stock and milk output in a district.
Table 9.
Impact of adding 100 hectares of canal irrigation, 100 well, and 100 hectares of rainfed farm to the value of total bovine population, in-milk bovine stock and milk output in a district.
| | Increase in Total Bovine Population | Increase in In-Milk Bovine Stock | Increase in Milk Output (in INR) |
|---|
| Adding 100 groundwater wells | 293 | 143 | 4,185,690 (US $93,787) |
| Adding 100 hectares of surface water irrigated area | 129 | 41 | 1,163,859 (US $26,078) |
| Adding 100 hectares of rainfed area | 49 | 12 | 431,676 (US $9672) |
Table 10.
Total bovine population, in-milk bovine population, herd efficiency, value of milk, output in rainfed area, groundwater irrigated area, and surface water irrigated area.
Table 10.
Total bovine population, in-milk bovine population, herd efficiency, value of milk, output in rainfed area, groundwater irrigated area, and surface water irrigated area.
| | Total Bovine Population (in Million) | In-milk Bovine Population (in Million) | Herd Efficiency Ratio (%) | Value of milk output (in Billion US $) |
|---|
| Attributable to rainfed farming | 139 (56%) | 28 (41%) | 20 | 22.2 (47%) |
| Attributable to groundwater irrigation | 61 (24%) | 27 (39%) | 44 | 18 (38%) |
| Attributable to surface water irrigation | 50 (20%) | 14 (20%) | 27 | 7.1 (15%) |
© 2020 by the authors. Licensee MDPI, Basel, Switzerland. This article is an open access article distributed under the terms and conditions of the Creative Commons Attribution (CC BY) license (http://creativecommons.org/licenses/by/4.0/).


