Perspective

The Typical Farm Approach and Its Application by the Agri Benchmark Network

1
Thünen Institute of Farm Economics, Bundesallee 63, 38116 Braunschweig, Germany
2
Global Networks, Bundesallee 63, 38116 Braunschweig, Germany
3
Thünen Institute of Sea Fisheries, Herwigstraße 31, 27572 Bremerhaven, Germany
*
Author to whom correspondence should be addressed.
Agriculture 2020, 10(12), 646; https://doi.org/10.3390/agriculture10120646
Submission received: 28 October 2020 / Revised: 29 November 2020 / Accepted: 14 December 2020 / Published: 18 December 2020
(This article belongs to the Section Agricultural Systems and Management)

Abstract

:
Global agricultural production is dynamic and complex as various factors impact it. Understanding global agricultural production systems and farmers’ decisions requires an internationally standardized and scientifically sound approach. The agri benchmark Network is a global, non-profit network of producers and agricultural experts which aims to analyze and understand the key drivers of current and future trends and developments in global agriculture. The Network combines its in-depth knowledge of production systems with its expertise in analyzing international commodity markets and value chains to provide scientifically sound advice to policymakers, producers and agribusinesses. This paper details the agri benchmark Standard Operating Procedure (SOP), which is the step-by-step method of establishing typical farm information and quantifying their data. The paper also illustrates how the typical farm approach is applied by the agri benchmark Network to analyze and understand global agriculture, production systems and adaptation strategies. The paper provides examples of how the Network applies the approach in analyzing the status-quo of production systems, benchmarking, practice change analysis and policy analysis. The paper concludes that although the typical farm approach and the institutional settings (agri benchmark) present some limitations, the approach and the Network provide comprehensive, consistent and coherent data on farm economics.

1. Introduction

Global agricultural production, fisheries and aquaculture are continuously changing as they are impacted by various factors such as technological innovations, investments and trade, regulations and policy programs, climate change, transboundary pests and diseases, conflicts and natural disasters [1]. The dynamic and complex nature of global agriculture means that producers across the world have to constantly make decisions regarding what they produce and how they produce it. With our food production systems being globally connected and in the focus of international discussions, internationally comparable analysis is crucial for proper policy and program design. Understanding global agricultural production systems and producers’ decisions requires an internationally standardized and scientifically sound approach [2]. Against this backdrop, in 2006, cooperation between the Thünen Institute of Farm Economics and the German Agricultural Society (DLG) led to the establishment of the agri benchmark Network. agri benchmark is a global, non-profit network of producers and agricultural experts from more than 30 countries who work in various crop, aquaculture and livestock value chains. The network aims to analyze and understand the key drivers of current and future trends and developments in global agriculture. More specifically, the network analyzes the profitability and sustainability of farms and production systems through the application of internationally standardized methods. The main beneficiaries of the information produced by the agri benchmark Network are producers (and their organizations), research institutes, universities, agribusinesses, governments and international organizations.
As the name indicates, annual benchmarking is a major activity of the agri benchmark Network. For this purpose, it requires accurate, consistent, standardized, detailed and transparent data collection and analysis systems. The global character of the agri benchmark Network requires a system that can be applied globally and in a large variety of farming situations. Available national or regional systems for surveying, recording, typification and analysis are often inappropriate to the rest of the world. Taking the above requirements into account, the agri benchmark Network uses and further-develops the concept of typical farms.
Although the typical farm approach has a long history of being applied in economic analysis, to our best knowledge, there is still limited information on how data is collected, analyzed and validated through the approach. Therefore, to fill this knowledge gap, this paper aims to provide an in-depth explanation of the step-by-step method of establishing typical farm data and quantifying it. The paper also aims to illustrate how the typical farm approach is applied by the agri benchmark Network to analyze and understand global agriculture, production systems and adaptation strategies. The paper is structured into five sections. The first section is an introduction that presents the key aims of the paper. The second section provides a review of relevant literature on the typical farm approach, setting this approach in the context of other farm data collection approaches. The third section outlines the principle steps of identifying typical farms and quantifying their data within the Standard Operating Procedure (SOP) of the agri benchmark Network. It also provides some branch-specific particularities of the SOP. The fourth section provides several concrete examples of how the agri benchmark Network applies the typical farm approach. The last section concludes with a discussion of the findings and conclusions for further work and applications.

2. Typical Farm Theory

The typical farm approach has a long history in economic analysis. It originates from the “representative firm” concept that was conceived by Alfred Marshall [3] and further developed for microeconomic theory by Frank Taussig in the early 20th century [4,5]. Marshall and Taussig used the representative firm concept as a theoretical framework to establish the “normal cost of production” [3] and to describe the economic concepts of supply and price movements, but never applied it in empirical research [6]. In the late 1920s, Elliott was one of the first people to apply the concept in empirical agricultural research and farm extension work. He refined the theoretical concept of representative firms to the typical or representative farm approach and described his application to the economic analysis of typical farming systems in the US [7]. More recently, Lasner et al. (2017) define the typical farm approach as “a means of engineering empirically grounded ‘virtual’ farm data sets via triangulation of qualitative methods (focus groups, expert interviews, farm observations)” [3].
In the 1960s, a number of publications [6,8,9,10,11,12,13] focused mainly on the applicability of the approach or justified its application in farm economic analysis. Since the beginning, the typical farm approach has been compared to alternative farm-level research approaches, namely individual farm datasets, aggregated farm datasets and synthetic farm datasets. Individual farm datasets (e.g., European Dairy Farmers (EDF)) usually provide up-to-date, consistent data sets from more or less randomly selected farms that allow for specific farm recommendations for specific farms. But they contain a lot of individual farm particularities and the way they are usually collected runs the risk of serious sample selection biases. This reduces the possibility to generalize the findings and the degree of representativeness. Aggregated datasets, (e.g., the EU-wide Farm Accountancy Data Network (FADN), Australian Bureau of Agricultural and Resource Economics and Sciences (ABARES), USDA Economic Research Service (ERS)), are usually representative of the universe, and selected strata and sub-samples. Large numbers of farms in surveys often compromise on data depth, e.g., at enterprise or production system level. In diverse farming systems, aggregated data conceal the individual variability and raise the question, whether they actually represent any particular farm at all. The approach often requires data confidentiality and thus offers limited possibilities for direct feedback with producers. Synthetic farm datasets constructed via an engineering approach, e.g., KTBL (Germany), John Nix Pocketbook (England), SAC (Scotland), Budgets of several US universities, Margen Agropecuario (Argentina), combine individual elements of production systems, price and cost data in a tool box-like approach based on observations and measurements of real farm situations as well as expert assessments. The datasets are consistent but usually only cover single activities and enterprises and do not allow systematic feedback with producers.
The typical farm approach aims at a compromise between data depth, consistency and accuracy on the one hand, and time and resource input for collecting the data on the other. Typical farm datasets can deliver detailed, up-to-date, consistent datasets with the advantage of removing the issue of particularities and lack of generalization of individual farm data. A proper establishment is of great importance to ensure the reliability of the results [9]. Additionally, it is necessary to regularly maintain representative firms via the review and revision by regional expert groups to reflect technological advances and changes in resource allocation in a sound farm data time series [13]. They can be quite representative of farms in an actual area, being advantageous to individual farm data and aggregated data sets and providing useful information for farm-level analysis, e.g., for interregional competition and production response [10], comparison of farms’ competitiveness and sustainability across production systems and farm types [2], farm policy evaluation and projection research [13], modeling practice change [14] and education and demonstration of technological changes before stepping into individualized strategy development based on own data sets [8].
More recent discussions conclude that the limitations and advantages of the various farm-level databases need to be evaluated with regards to the objective of the specific studies [2,4,15].
Since the 2000s, there has been a resurgence in its use in farm economic analysis (e.g., Agricultural and Food Policy Centre (AFPC) at Texas A&M University (TAMU), Brazilian National Agency for Supply (CONAB), International Farm Comparison Network (IFCN) and agri benchmark at Thünen Institute. Recently published research has focused less on the applicability of the approach or the justification for its use. Rather, the published research papers have mainly focused on the results obtained when the typical farm approach is applied in understanding the status quo of production systems [16,17,18], benchmarking [19,20], practice change analysis [21] and policy analysis [22].
Compared to previous application and discussion about the typical farm approach, the agri benchmark Network expands the scope of analysis beyond farm analysis, policy advice and technological changes to the international comparison of agricultural production. Taking into consideration the necessity to properly establish and maintain typical farms, the methodology developed for the establishment and analysis of typical production systems in the agri benchmark Network has been described in various SOPs [23,24,25,26] that refer to the initial establishment of the IFCN [27,28]. The next section introduces to these principles and indicators chosen for the establishment of typical farm data sets. Then, specific applications of the agri benchmark approach are described.

3. The Typical Farm Approach

3.1. Standard Operational Procedure (SOP)

The definition of typical farms follows several steps. These steps are intended to be identical in all countries and throughout all branches. The SOP describes in detail what each step entails. All steps of the SOP are performed jointly with research partners in the participating countries. These partners are members of the agri benchmark partner institutions. The main criteria for selecting partner institutions and individuals is not a certain institutional setting but (a) the knowledge of production systems and their economics, (b) the access to producers and (c) English skills. Partner institutions are mostly universities, research institutions, producer organizations, marketing organizations and agribusinesses. The agri benchmark Network classifies its partners into research partners, supporting partners and institutional partners.
Research partners provide sector data, farm data and management information which is used to construct and update typical farms. In return, partners receive information regarding the performance (productivity, costs of production and profitability) of their farm types or production systems, amended by the sectoral information from each country as well as global information on production and trade. Furthermore, the agri benchmark Network provides students from participating institutions the opportunity to write an undergraduate, Master’s or PhD thesis at the Thünen Institute.
Supporting partners are typically agribusinesses who substitute data contributions by funding, and in some cases, provide data and information to the Network, too. In return, they receive the same outputs as the research partners and are offered preferential access to the annual agri benchmark conferences.
Finally, the agri benchmark Network also collaborates with international and multi-governmental organizations such as the Food and Agriculture Organization of the United Nations (FAO) and the International Meat Secretariat (IMS). These institutions support the idea of agri benchmark and acknowledge its benefits, but they are not making regular contributions. An example of such collaborations was the nomination of the agri benchmark Network by the FAO to chair the focus area on ‘Closing the efficiency gap’ of the Global Agenda for Sustainable Livestock. The five key steps of the SOP are described below and summarized in Figure 1.

3.1.1. Step 1: Identifying Relevant Regions

This step entails the identification of the most important regions according to the purpose of the analysis. Thus, for the analysis of cost of production and competitiveness, the focus is on regional hot spots in terms of agricultural production in each country. In the vast majority of the countries, statistics can be used to perform this step. The main criteria for the selection of regions for broad acre crops, horticulture and specialty crops are total acreage of the considered crop in the region, proportion of the considered crop in cropland area of the region, and total production of the considered crop in the region (via yield per hectare). For livestock, the main indicators are the total animal numbers per region, and animal numbers per ha agricultural land (density). In contrast to cropping activities, for meat producing animals, total regional production can be a misleading indicator as live animal production and their slaughter/processing are often dislocated from each other, especially in large countries where slaughter occurs close to consumption centers and animal rearing and feeding takes place in more remote areas. In fisheries, fish production is not as controllable as livestock production for farmers or fish farmers. The annual catch is highly dynamic, does not provide a stable indicator and nor does the fishing area. Here, the size of the vessel (and machine power) indicates the potential of maximum productivity.

3.1.2. Step 2: Identifying Typical Production Systems

While this paper refers to the term ‘typical’, other expressions for typical could be ‘prevailing’, ‘representative’, ‘most frequent’ or ‘most common’. All of these expressions point at representing a significant share of national production that the agri benchmark Network is aiming for. The identification of typical production systems is conducted in close collaboration with local experts who are usually farm advisors, producer organizations or research institutions with close contacts to producers. The main reason for this expert-based approach is the general lack of economic statistics about production systems and their prevalence in most agricultural statistics. Figure A1 (in Appendix A) provides an overview of the descriptors and indicators to characterize the typical farms and production systems on whole-farm level and enterprise level.

3.1.3. Step 3: Data Collection

After the identification of typical farms or production systems, the data collection can be done in two ways. The first and preferred way is to conduct focus groups consisting of the research partner, at least one local expert (advisor) and four to six producers. The producers’ farms should come close to the characteristics of the farm identified in Step 2. A standard questionnaire is used and filled-in jointly with the focus group members, using the farm type and production system identified in Step 2 as a basis. The research partners act as moderators and direct the discussion around the typical farming situation in a typical year. The discussion aims at achieving a consensus for each figure, taking out extreme figures or particularities of the individual producers. Instead of calculating an average of the participating producers’ farms, the most frequent or prevailing specification for each variable and indicator is recorded. The second way is to collect the data from an individual producer that comes very close to the typical farm identified in Step 2 and then ‘typify’ this data by replacing the farm particularities by more typical information and data available from expert knowledge, surveys and technical handbooks.
In both cases, consistent datasets are obtained. For the standard annual analysis of production systems, their cost of production and profitability, the second way proved to be sufficient and appropriate. Further, the organizational effort of the individual farm approach is obviously less than organizing and conducting a focus group. However, the latter provides a broader and better-grounded basis of the data. The focus group approach is essential when it comes to the analysis of adaption and adjustments of farms to changing framework conditions like price regimes, new policies and shocks like the COVID 19 pandemic.

3.1.4. Step 4: Processing and Cross-Checking

The Technology Impact Policy Impact Calculations (TIPI-CAL) model is used for data analysis. TIPI-CAL is a production and accounting model that enables the calculation of physical (cropping pattern, yields, inputs, animal performance, land use, labor, machinery, equipment, buildings) and economic parameters (prices, financing, overhead costs, variable costs). In recent years, some environmental indicators have been added, for example to calculate greenhouse gas (GHG) emission. The model produces a whole-farm profit and loss account, a balance sheet and a cash flow. At the enterprise-level, a total cost calculation is produced (including cash costs, depreciation and opportunity costs). In an ‘interplay’ procedure, results are reverted to the data providers. Changes in the data are made until an agreement is achieved that the data set is realistic, accurate and consistent.

3.1.5. Step 5: Updating

The updating of the data takes place annually for all prices and in the case of cash crop and horticulture, for yields, too. Updates are either done for each farm individually or through national or regional projection data which are applied to the farms in a country. Every three to five years and where relevant, updates of the farm sizes (hectares, animal numbers), performance indicators and their organization (labor, capital) are carried out. All these steps are performed jointly with the research partners and the local experts in the countries.

3.2. Branch-Related Specifics

The agri benchmark Network applies the typical farm approach in various branches which include beef, sheep, pig, poultry, cash crops, horticulture as well as aquaculture and fisheries. This section highlights the particularities of the application of the SOP in these branches.

3.2.1. Beef

The 
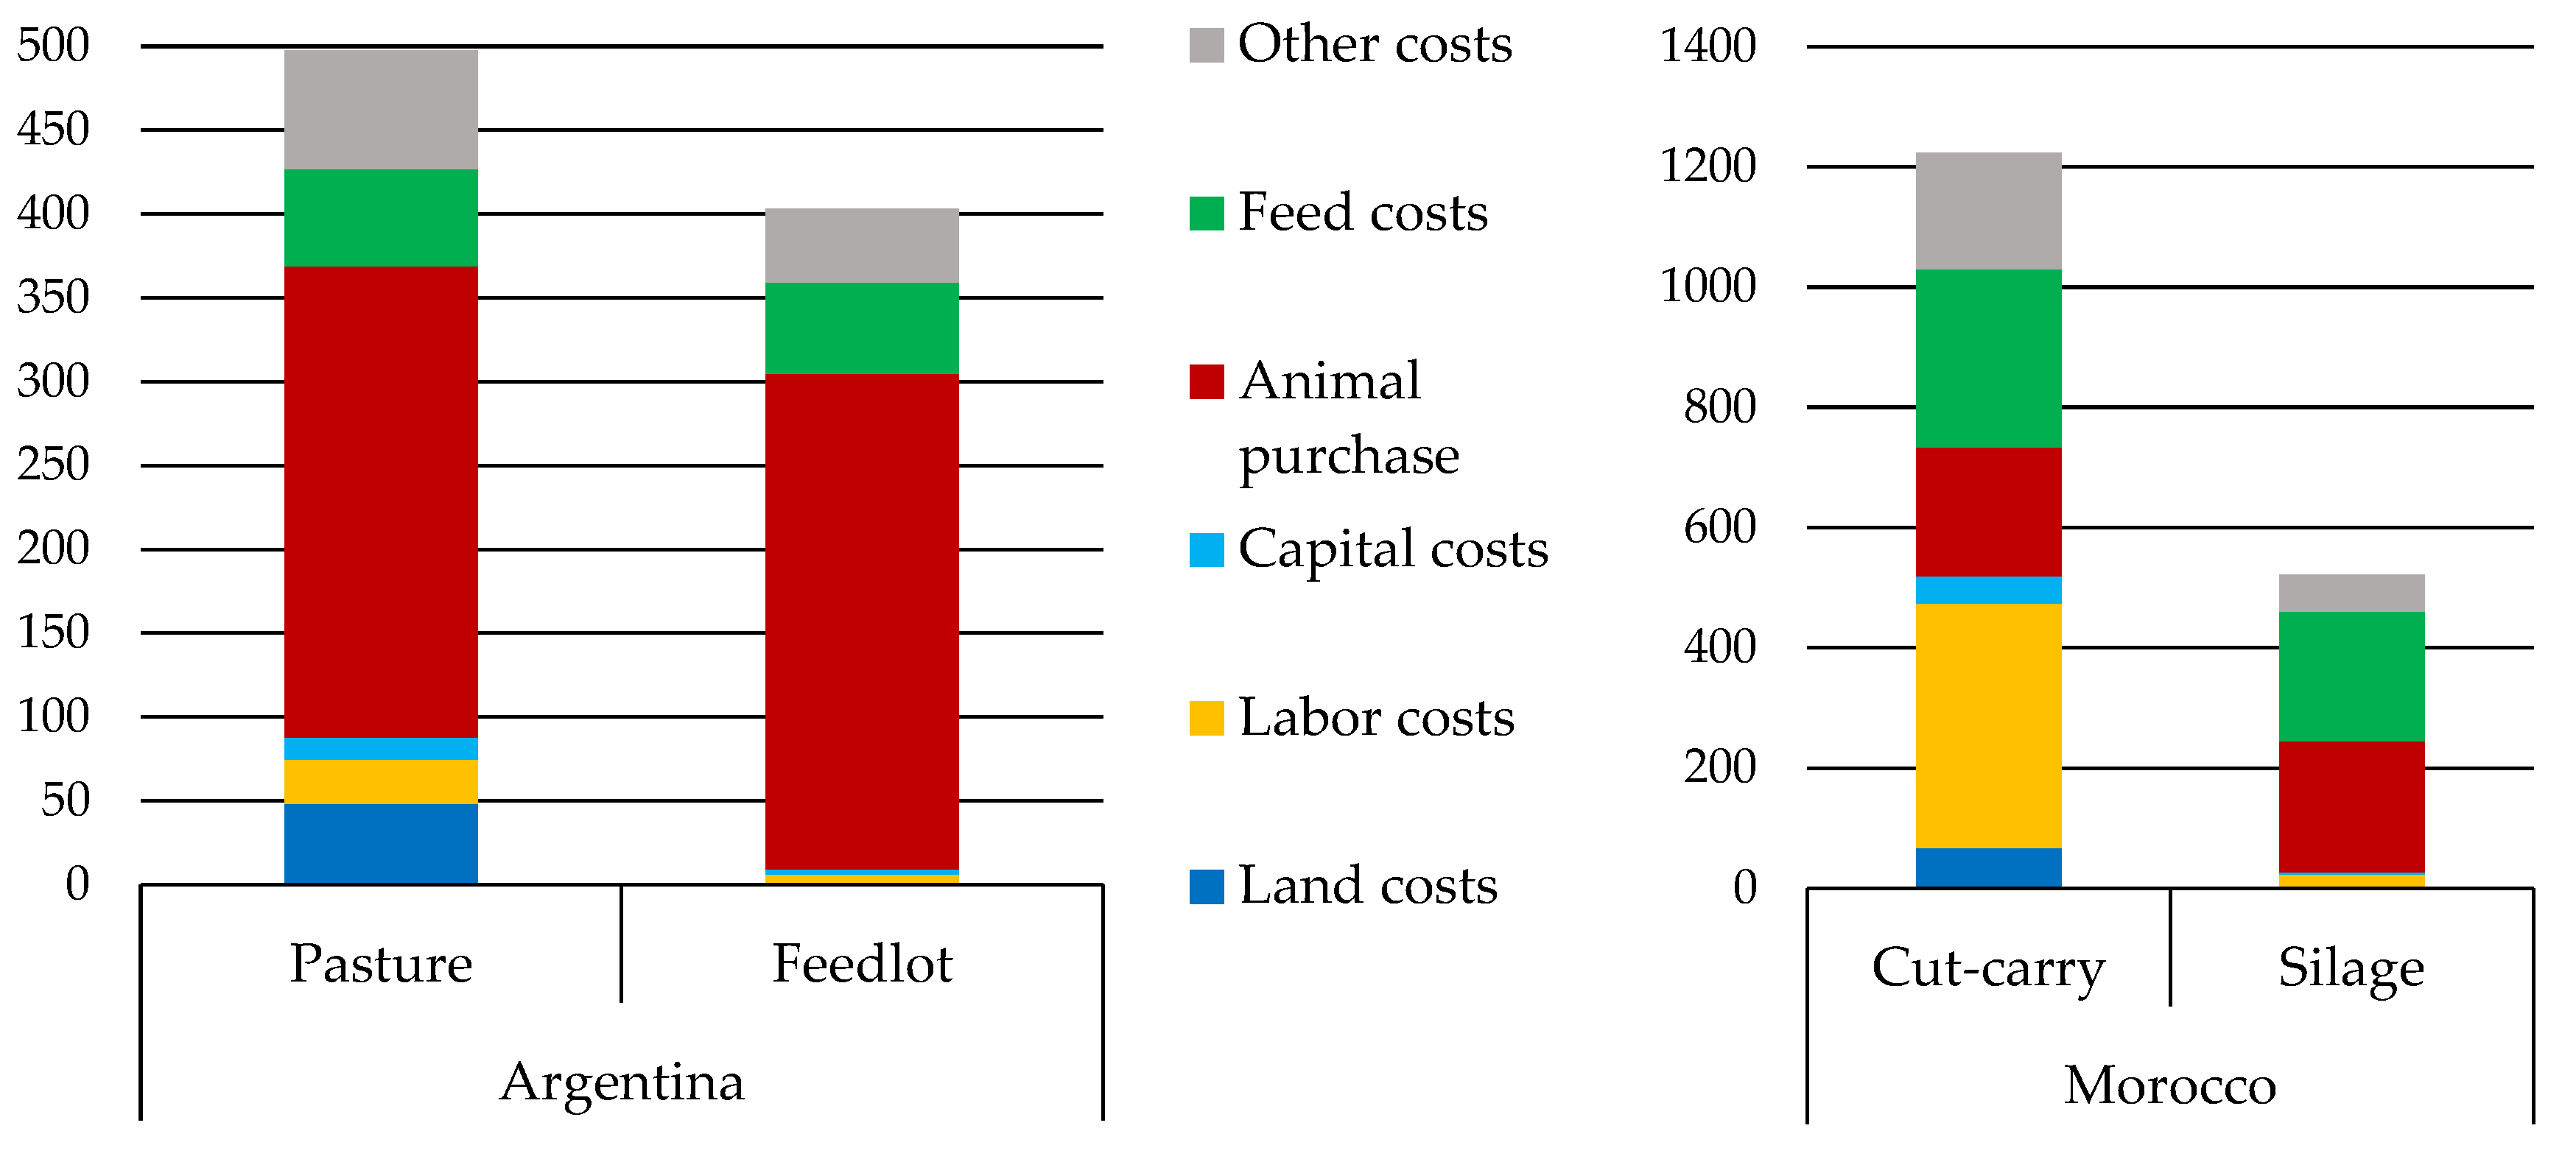
agri benchmark Beef Network was established in 2002. The network is composed of 48 institutional partners from 34 countries across Africa, Asia, Europe, North America, South America, South Pacific and the Middle East. The beef branch includes cow-calf operations and beef finishing operations. To date, the network has 139 typical beef farms that represent different production systems from across the world. Of which, 67 farms are beef-specialized, 33 farms are cow-calf, and 72 farms are operating both cow-calf and beef finishing. In the typical farm approach, the cow-calf enterprise starts with the birth of the calf and ends with the day of weaning. The beef finishing business starts when dairy or weaner calves or feeder cattle are bought from outside the farm or transferred from the dairy or cow-calf enterprise to the beef finishing enterprise in the same farm. Beef production globally deals with a considerable variability of production environments. Those define the production factors’ availability and costs. With cow-calf production predominantly based on pasture and grazing, housing systems represent a significant difference for cost comparisons across systems. Thus, in the cow-calf production stage the agri benchmark Network distinguishes between “winter barn” and “outdoor” systems. In the finishing production stage, the differentiation is made based on the feed ratio composition, as feed represents a crucial cost factor. The agri benchmark Network distinguishes between “pasture-based”, “silage-based”, “grain-finished” and “cut and carry” production systems [29].
When there is a high variability of production systems within one country that impact farm cost structure, it is advisable to cover this variability with the establishment of typical farms. Besides the beef production systems, the origins and disaggregation of beef production impact the data analysis. The origins of beef animals affect their value, starting weight and starting age. Generally, three origins of beef cattle can be differentiated: dairy production, where male calves are generally sold off for meat production shortly after birth, cow-calf systems, where the majority of weaners are sold off for meat production at the age of weaning, and dual-purpose systems, where milk and weaners are coproducts. The level of disaggregation of the beef production needs to be considered to conclude on performance and productivity indicators across countries and production regions within one country. A separation of the production stages “backgrounding” and “finishing” is common in beef producing countries. To analyze the entire production cycle, a reflection of all relevant production stages in the typical farm identification and definition is recommended. A seamless integration should be reflected, if this requires the collection of different typical farms, e.g., concerning the age and weight of animals leaving one and entering the subsequent system.
The beef branch, as well as the other livestock branches (especially sheep and pig), deals with two specifics when it comes to overhead farm costs and own forage/feed production.
To compare the typical farms globally, the costs and returns must be assigned to the different enterprises. An approach of cost and return allocations is conducted in two steps. (1) Whole-farm level costs and returns must be allocated to the enterprises like forage, beef finishing and cow-calf. This mainly applies to costs like machines and buildings, hired and family labor, own and rented land as well as overhead costs such as insurances. If a direct allocation by specific use (e.g., feeding equipment) or working hours (e.g., farm worker) is not possible, the items (e.g., manager salary) are allocated by the enterprise’s share in returns. (2) Further costs, such as the variable costs per animal, and returns are allocated to different groups of animals within the enterprises (finishing groups, calving periods) which usually have different resource and input requirements. If data availability does not allow this level of detail, allocation from enterprise level to the groups is done on a return share or weight basis.
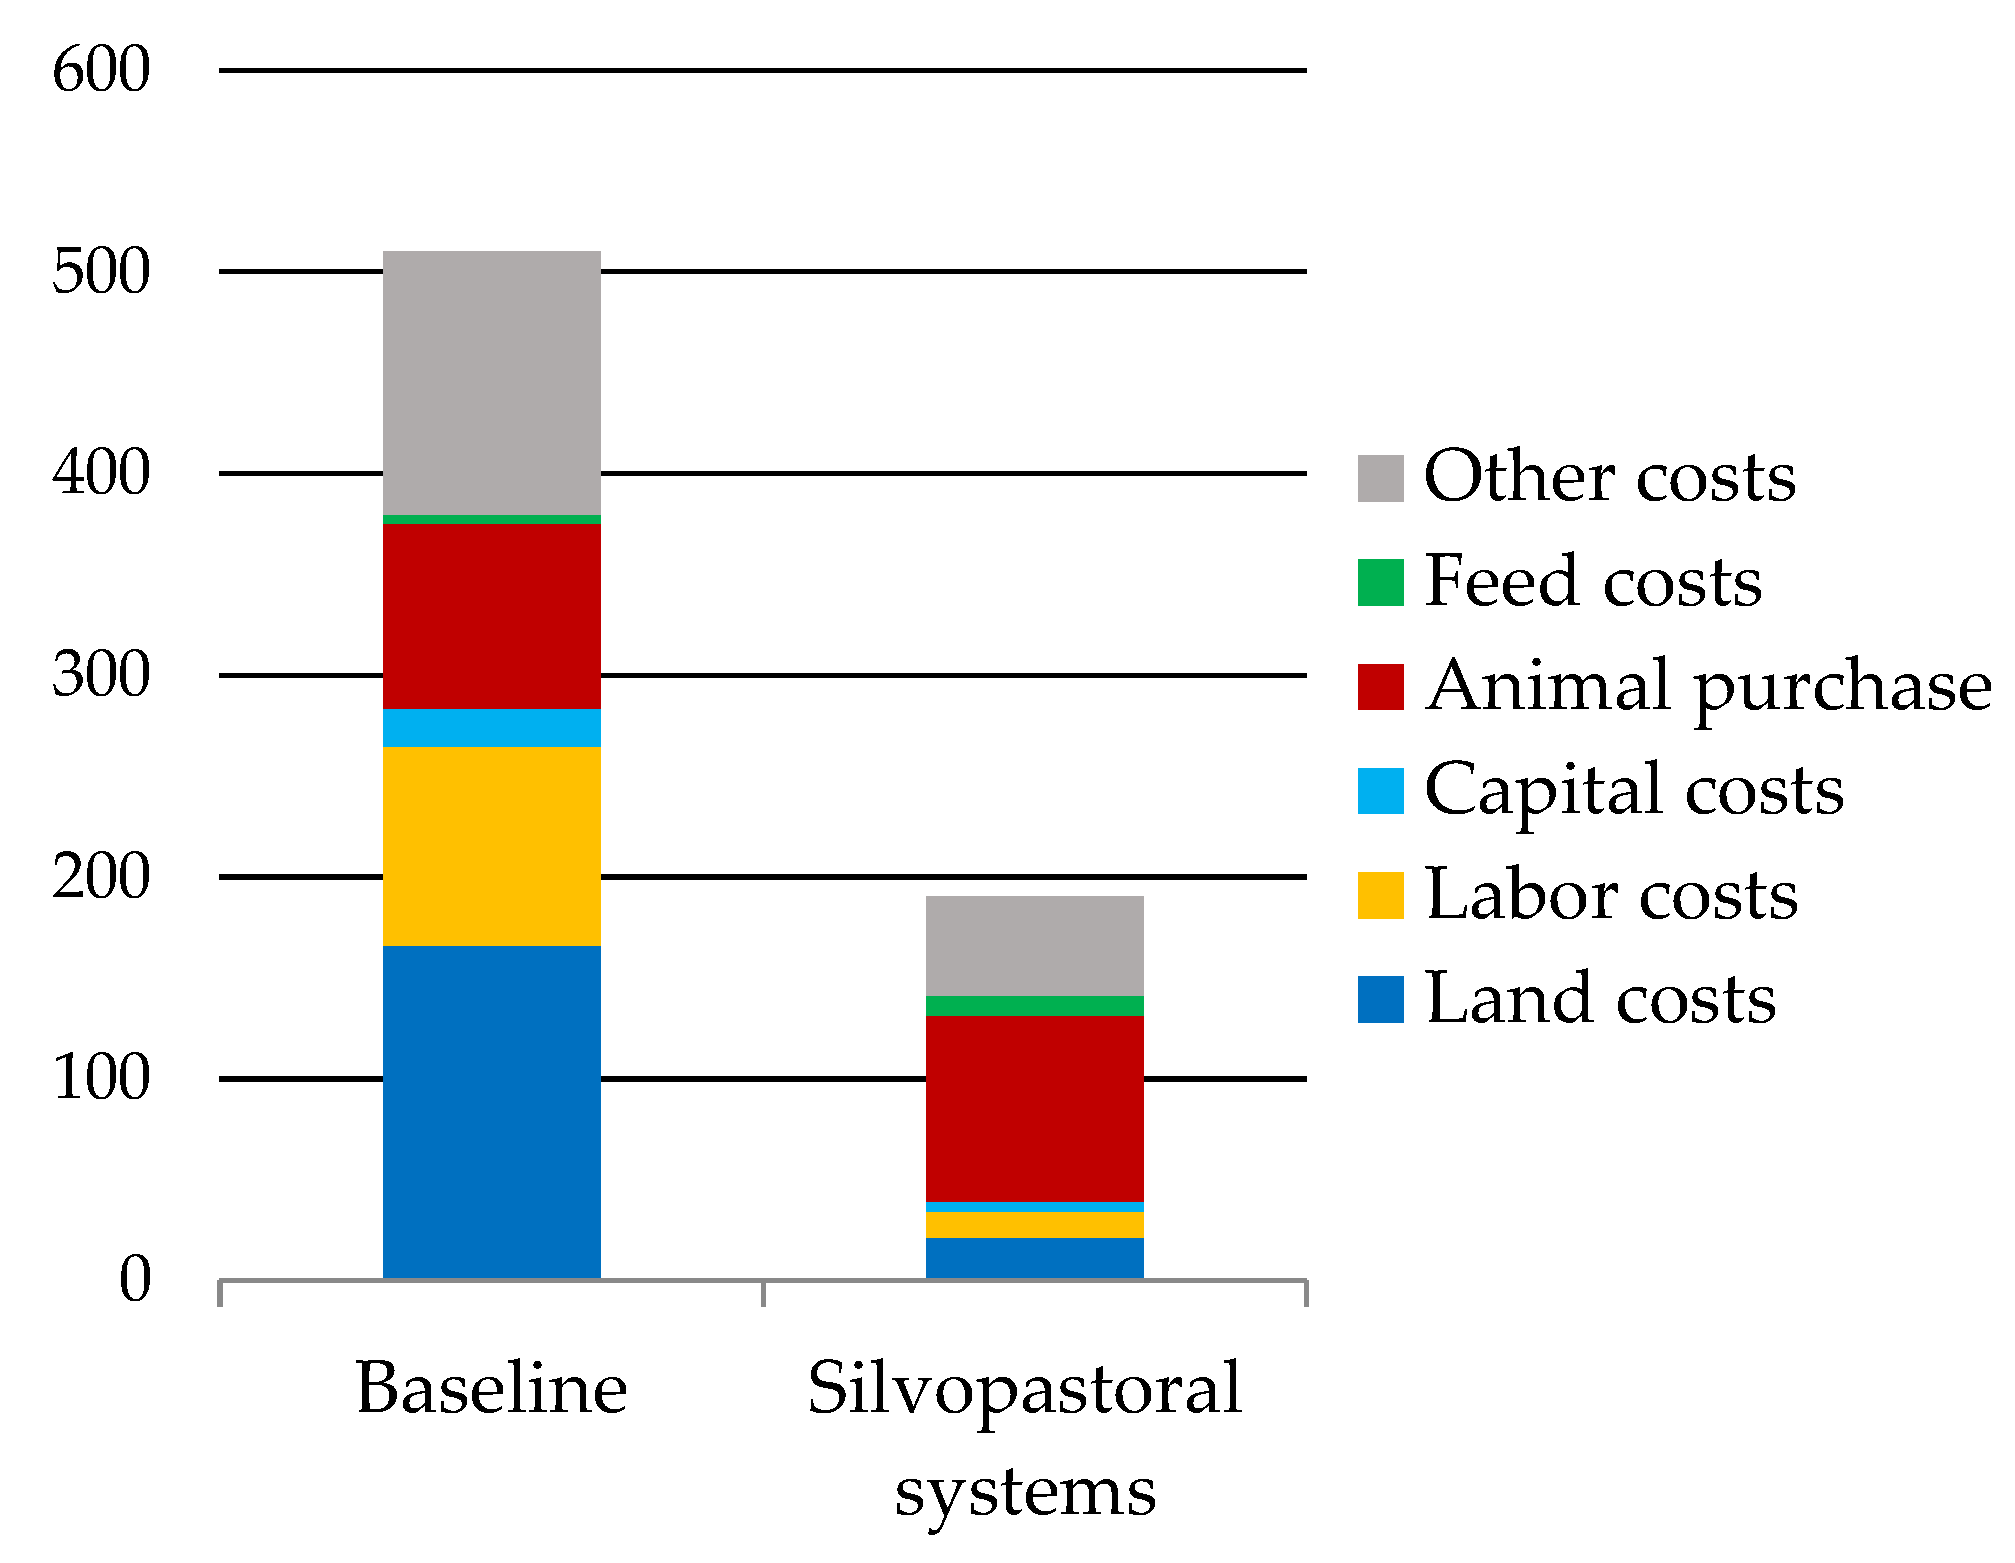
In mixed farms or grazing livestock systems, forage production can represent a substantial part of farm resource allocation and costs. Due to the fact that in many countries no markets and associated prices for grazing and forages are available, the on-farm-produced feed and forage is reflected in terms of their calculated cost of production. Thus, the principle of opportunity costs from selling and buying at market prices is not considered here. However, purchased feed components are quantified in quantity and price per tonne and added in the total feed costs.

3.2.2. Sheep

The agri benchmark Sheep Network was established in 2010. The network has 30 institutional partners from 16 countries. To date, the network has constructed 40 typical sheep farms that represent different production systems in the participating countries. Similar to beef production, sheep farms are confronted with very different production conditions worldwide. Depending on the regional availability or scarcity of production factors, different production systems are applied and different herd management strategies are used, which can lead to very different costs of production. Therefore, the agri benchmark Network defines four different production systems according to the feed rations employed on the farms (1. grazing systems, 2. forage systems, 3. grazing and forage systems and grains, 4. concentrates and forage systems). In addition to the feeding systems, the strategy for herd management is also reflected in production costs.
To consider the different strategies in herd management and reflect in the farm data, different indicators are collected. Those can be recorded for two different flocks per farm, allowing a more precise description of the production method. A distinction is made between seasonal and aseasonal lambing, whereby it can be specified what proportion of the ewes are lambing in which period. Additionally, the average date of lambing during the year, the length of the weaning period and the post-weaning time are recorded. Besides production characteristics, marketing aspects play a crucial role for the economic results. Thus, the destination of the produced animals represents another important characteristic of the farms. For each animal group (breeding rams, ewes, young ewes, male/female lambs) the share of animals sold to the different destinations (culled, sold for breeding, going to finishing, sold/ transferred as stores, sold for slaughter at weaning, sold for slaughter later) is specified. This animal flow also defines which replacement strategy is pursued by breeding farms. Lambs finished under the ewes and later after a short finishing period are accounted for in the ewe enterprise. In a few cases the finishing of lambs takes place separated from the ewe husbandry or lambs are bought from outside the farm just for finishing. If so, the lamb finishing can be analyzed as an independent operation, similar to the beef finishing operation. In addition to the selling of animals, in some countries wool production accounts for an important share of returns. In these cases, the wool yield and quality are also recorded.

3.2.3. Pig

The agri benchmark Pig Network was relaunched in 2015 and has partners from 19 countries. The countries represented in the network include major pork producing countries like China, the United States of America (USA), Germany, Spain, Vietnam, Brazil, Russia and Canada. To date, the Network has established 61 typical pig farms that represent different production systems from across the world. Global production systems in pig production show a high variability regarding their degree of specialization and integration. In order to pre-define a typical farm(s) in pig production in a country and the selected region, these two major concepts need to be outlined.
To define the degree of specialization, the prevailing combination of farm enterprises (specialized sow or pig finishing farm or mixed system) need to be described. Mixed systems might include a combination of specialized sow farm and cash crop production, a combination of sow and pig finishing farm, called a closed system [25], or a combination of a specialized pig finishing farm and other livestock enterprises. In the typical farm approach, the sow enterprise starts with the birth of the piglets and ends with the day of weaning. This can be a weaned piglet, which usually has a live weight of 6–8 kg, or a reared piglet, which usually weighs between 20–30 kg. The pig finishing enterprise starts when weaned or reared piglets are bought from outside the farm or like in closed systems where piglets are transferred from the sow to the pig finishing enterprise and normally moved to a special fattening barn. The weaning/rearing weights of the sow enterprise correspond to the start weights of the finishing enterprise [30].
The degree of integration differentiates between a single owner operation and a vertically integrated farm [25]. Integrated farms are characterized by two agents: ‘the integrator’, who is usually an upstream or downstream company like breeding companies or slaughterhouses, and ‘the integrated’, who is usually a pig farmer [31]. Data availability is mostly more restricted in integrated farms as well as in countries with big industrial companies dominating the production, such as in China, Russia and the US, than in single owner operations.
Other criteria for the classification are the productivity in terms of physical productivity (high or low), the share of purchased feed on the farm and whether the farm labor is supplied by family or hired labor. Based on this pre-definition process, we identify the characteristics of the typical farm/production system [25] based on the indicators shown in Figure A1 (in Appendix A).

3.2.4. Poultry

To date, three typical broiler farms have been constructed for Ghana, one typical broiler farm for Germany and six typical farm constellations for Germany. Within the context of the agri benchmark Network, the poultry branch currently focuses on economic analysis of broiler, layer (egg) and turkey production. The typical farm approach can also be applied in farm economic analysis of other poultry species such as ducks, guinea fowl, geese, quail and ostriches.
Similar to other branches, the poultry branch uses focus groups to construct typical farms. However, if highly vertically integrated production systems with standardized production processes and a high degree of sectoral concentration are prevailing, as in West European countries, data availability is mostly more restricted. Therefore, the individual farm approach is used instead of focus groups. Typical poultry production systems can be identified based on the level of vertical integration of operations, housing system, farm size, production intensity in terms of level of production density and input use, outdoor access, animal welfare measures and marketing systems. These production systems include the integrated large-scale, medium-scale and small-scale production systems. Positive agglomeration and cluster effects often lead to a regional concentration of land independent poultry production [32]. The increasing structural change is leading to fewer and larger entities keeping poultry in several production sites in a region.
In terms of data analysis, unlike with other branches, the feed costs include the costs of purchasing the feed ingredients and preparation of the feed (milling). Similar to the pig branch, poultry production has several cycles in a year. Therefore, calculations in the TIPI-CAL model are adjusted to account for the several production cycles in a year.

3.2.5. Cash Crops Sop

The agri benchmark Cash Crop Network was established in 2006. The Network has institutional partners from 40 countries across Africa, Asia, Europe, the Americas, and Australia. To date, the cash crop Network has established 120 typical farms and is analyzing the economics of all major broad acre crops, including corn, wheat, rice, soybeans and sunflower, and perennial crops such as sugar cane or palm oil.
With regard to cost allocation there is one major difference between the livestock- and the crop-related (both arable crops as well as horticulture) approaches. While the livestock branches (especially beef, sheep and pig) use return shares for the allocation of fixed and overhead cost to individual enterprises and products, crop and horticulture use machine run times to allocate machinery and labor cost to individual crops. The logic is that crops that are more demanding in the use of these resources are supposed to carry a higher share of the total cost than low-care crops. The basis for this allocation concept is the documentation of all major operations in crop production including data on machinery used, productivity of machine use, number of workers involved, amount of fertilizers or seeds applied per operation; cost of crop protection products applied per operation, working depth in tillage and fuel use per hectare. In case there is just manual labor involved and/or a combination with draft animals, the same concept is applied.
Furthermore, some cropping systems and crops require specific additional analyses and approaches. For crops that have low or no value when raw, such as sugarcane and cassava, the cash crop branch expands the data analysis beyond the farm gate to include the economics on the processing stage. Perennial crops, such as sugarcane or palm oil, require a specific approach to the accountancy of establishment costs. The agri benchmark Cash Crop Network considers the fact that crop establishment is an investment that is only made once and a number of subsequent harvesting periods capitalize on this investment and reflect it in the data. The Network also captures the specifics of double cropping systems, i.e., systems which allow for two or even three crops per year, that are widespread in Latin-America and found in Asian rice production. The main challenge here is to allocate annual land rents to these crops.
Last but not least, the issue of multi-annual fertilization strategies needs to be reflected. This is a very relevant feature in most cropping systems when it comes to the fertilization of Phosphate, Potash and Calcium. Since 2020, the Network applies an algorithm to allocate respective costs to those crops that benefit from this fertilization, even though the actual fertilization takes place in another crop.

3.2.6. Horticulture

The agri benchmark Horticulture Network was established in 2012 and has partners from 11 countries. To date, the network has established 19 typical farms (apples and wine grapes) that represent different production systems found in the participating countries. Horticulture or specialty crops include a very large range of production systems of vegetables, fruits, flowers and ornamentals. Necessarily, a benchmarking effort has to focus on specific products. The approach in the horticulture branch therefore is to focus on crops that are of major importance in terms of global production and trade, such as apples and wine grapes. Other specialty crop production systems, e.g., vegetables or other types of fruits can also be included according to partner interest. As these production systems are highly intensive in terms of labor and input use and require very specific know-how, equipment and marketing infrastructure, the farms targeted according to step 1 of the SOP are often specialized in one single crop. Detailed data collection includes only the target crop. If the typical farm has more enterprises, net revenues are included as an overall estimation, and the costs of machinery and farm equipment is assigned to the crops according to respective usage share for the different enterprises (e.g., x% of tractor and pesticide sprayer, but 100 % of the grape harvesting machine are assigned to grape production).
The quality of the output is a major factor for production system design. For a meaningful comparison of the competitiveness of fruit or wine grape production, it thus needs to refer to similar target markets, e.g., typical farms producing fresh apples as table fruit or wine grapes for quality bulk wine.
Specific challenges for data collection arise from the high level of input and labor use and large yield variations. Where manual harvest is common and yields are highly variable depending on weather conditions (e.g., late frost, hail), focus groups should agree on estimates of harvesting labor productivity per yield unit, so labor input can be adjusted according to yield levels in specific years. While labor usually represents a major share of costs, expenses for inputs such as pesticides or fertilizers are less important. With highly individual plant protection strategies for each farmer, focus groups may be able to agree on a realistic average lumpsum for pesticide costs per year rather than on a typical spraying scheme.
An important cost factor is the cost for orchard establishment and years to first full harvest. These costs for permanent crops are included as share of acreage in establishment or full harvest, based on the average utilization period of the orchard.

3.2.7. Aquaculture and Fisheries

The typical farm approach was applied in aquaculture and fisheries for the first time in 2014 [19]. The agri benchmark Fish Network is composed of partners from 10 countries which include Austria, Denmark, Germany, Norway, Poland, Republic of Ireland, Spain, Turkey, United Kingdom and Vietnam. This section is an extract of a more comprehensive paper “Being Typical—The Representative Farms Method in Aquaculture and Fisheries”, which was published in Mediterranean Fisheries and Aquaculture Research 3(2) [33].
In the context of aquaculture and fisheries, the typical farm approach utilizes a dataset from a farm or vessel with stable characteristics, earning adequate profit, adequately equipped, and which represents a group of similar units using a common production method in the same region [19,20]. The modal concept relies on diverse sources for pre-defining the example, but the pertinent characteristics are then verified empirically. In aquaculture and fisheries, the typical farm approach comprises three main interactive stages: abductive pre-definition of representative farms, inductive definition, and an abductive-inductive plausibility check. The pre-definition stage is based on knowledge available from the literature and statistics. According to step 2 of the SOP, the identified sector or market must be clearly framed, for example as traditional pond systems producing portion-sized rainbow trout for human consumption in Germany. This framing will later delimit what can be represented by the model. An important region for the type of production being evaluated is then selected either for its share of national production and/or for its share in the total number of farms. In some cases, niche markets (e.g., organic farms) or future-looking production systems (e.g., recirculated aquaculture systems (RAS)) might be included in a model as archetypes of good practice.
In the second stage, fish farmers (or skippers in the case of fishery vessels) and consultants from the selected production region are contacted and invited to form a focus group of up to 12 participants whose role is to define a representative farm, step by step. A researcher instigates and moderates discussions about the value of cost variables, input volumes, outputs and prices. The exact number of variable values to be defined depends on the production system, but the list includes at least 22 of the economic variables of the EU Data Collection Framework (DCF): Turnover, subsidies, other income, total income, wages and salaries, value of unpaid labour, energy costs, stocking costs, feed costs, repair and maintenance, other operational costs, depreciation of capital, financial costs, extraordinary costs, total value of assets, net investments, debt, sales volume, stocking volume, feed volume, number of employees, full-time labour equivalent (FTE). Experience suggests that annual production volume is the best starting point (e.g., 25 tonnes of portion-sized brook trout as main species) for aquaculture systems and vessel type (including machine power and vessel size as indicators) is a good starting point for modelling fisheries’ vessels. Often the value of one variable is automatically linked to that of another: for example, if the typical farm produces 25 t brook trout with a final harvest weight of 400 g per fish, it needs around 70,000 fingerlings at 10 g per piece, assuming a typical mortality of 10 % per production cycle. By working through these variables, a coherent picture of the typical farm is built up through consensus within the focus group. Simultaneously, and in contrast to statistical averaging, the defined variables control each other—for example Feed Conversion Rate (FCR) should meet the volume of fish feed used and the feed costs should be in line with feed volume and feed price etc. Finally, the modelled typical farm can be validated by real world fish farmers (or skippers) in accordance with their lived experience and by researchers, so that existing knowledge may be modified.

4. Application of the Typical Farm Approach by the Agri Benchmark Network

4.1. Analysis of the Status-Quo of Production Systems

The agri benchmark Network identifies the status-quo production systems in the network countries on an annually updated basis. This helps in building up a realistic picture of the most prevailing farming practices, management and performance in the different production systems. In this context, an example of how the typical farm approach was applied by the agri benchmark Network in the status-quo analysis will be provided. Within the framework of agri benchmark sustainability projects, status quo farm production systems were identified in Argentina and Morocco. Using the five key steps of the SOP, detailed data on (1) whole-farm characteristics, (2) beef enterprise characteristics, (3) management practices and (4) productivity and cost indicators were conducted. Two production systems were considered as typical systems in each country; pasture and grain-fed (feedlot) production systems in Argentina and extensive (cut and carry), and intensive (silage) production systems in Morocco.
In Argentina, the pasture production system represents the traditional beef production with a complete cycle farm (cow-calf and beef finishing), based exclusively on pasture in the Cuenca del Salado, Buenos Aires Province. Recently, due to the increased competition for land, many of the Argentinean pasture finishing systems have been replaced by feedlots [34]. In this production system, weaned calves are backgrounded on pasture plus supplementary feed and then moved into a feedlot with a diet of side products and grains for the last four months before slaughter.
In Morocco, the extensive production system is a mixed dairy and beef production and it represents 70–80% of beef production in the country. This system is rearing up to five cows of local breeds with relatively high animal loss rates, low growth rate and low slaughter weights. It is classified as a cut and carry production system where feed inputs obtained mainly from grazing on marginal land and cut and carry from crops land [35,36,37]. The second beef production system in Morocco is silage-based. Irrigated fodder crops such as corn silage are used where possible and mixed with straw and concentrates. Moreover, farms in this production system are much larger than the average beef farms in the country. Each of the selected production systems was represented by one typical fam. Table 1 shows the characteristics of the identified status-quo farm production systems.
The analysis of the status-quo production systems helps to understand how the identified systems are preforming. In beef production systems, key indicators in terms of animal productivity are analyzed, such as daily weight gain, length of the finishing period, finishing weight, mortality rate and dressing percentage. Figure 2 highlights how the status-quo beef production systems are performing in Argentina and Morocco.
Since production costs vary with production systems, the status-quo analysis provides insights about the different cost structures of production systems and gives an indication of how farms would be affected to different extents by changes in factor and input prices. Figure 3 shows the total costs of production as a breakdown of different cost items.

4.2. Benchmarking

The agri benchmark Network benchmarks typical farms from participating countries, which are collated using the SOP. International comparisons are carried out in terms of production systems, production costs, returns and profits for beef, cash crops, poultry, fish, pig and sheep farming. Together with the development of market shares, these indicators can be used for assessing competitiveness. Thus, benchmarking enables a close look at, and compares, farm performance to explore areas where performance can be improved, and profits increased. This helps to determine the key drivers for profitable systems and understanding their international competitiveness.

4.2.1. Beef

Beef finishing benchmarking mainly focuses on the final products (beef) that are being traded. However, to enable the analysis of cattle production chains between regions and countries, cow-calf enterprises which are mainly producing weaners as an intermediate product are also analyzed.
The output of the cow-calf enterprise comprises weaner calves, cull animals and breeding animals. The output of the beef finishing enterprise comprises all animals which are exclusively reared for slaughter: bulls, steers, heifers, calves or cows. It does not include cull animals from a dairy or a cow-calf enterprise on the same farm. The outputs of the cow-calf and beef finishing enterprise are measured in total live weight sold and in total carcass weight produced or sold, respectively. Given the wide variety of production systems and their different productivity levels per animal and per ha, the “per 100 kg” analysis is the preferred reference unit to benchmark typical farms globally, e.g., via cost breakdowns by factor composition and per 100 kg carcass weight produced or sold as well as short-, medium- and long-term profitability per 100 kg carcass weight [29].
Typically, the cow-calf and the beef enterprise are analyzed separately. This reflects the reality of generally specialized production systems in major producing countries. However, a specific approach allows merging beef and cow-calf enterprises to analyze the detailed cost and returns structure from birth to slaughter. This applies to farms with a ‘complete cycle’, where own weaners are finished within the same property and in combined enterprises where the weaners are produced in one farm and the finishing is done in another farm. In this context, the enterprise-based analysis implies an artificial separation which could create deviation in the results. Therefore, a dedicated accounting method is applied, that is described in more detail in the pig section.
The diversity of typical farms’ data enables further detailed analyses and international competitiveness comparisons within and between the different beef production systems. Benchmarking is carried out on farm demographics (land size, stocking rate, daily weight gain, prices), physical and economic labor productivity (kg beef per hour, return per unit of labor cost), land productivity (carcass weight per hectare), and whole farm profitability. The analysis of cow-calf enterprise enables further performance comparisons such as number of weaned calves per 100 cows and kg live weight produced per 100 kg cow weight.
Furthermore, the agri benchmark Beef Network is accomplishing environmental benchmarking in the area of GHG emissions. This is mainly expressed by evaluating the GHG converted in CO2 eq per kg LW of meat produced. Following the Intergovernmental Panel on Climate Change [38], the agri benchmark emissions calculator tool regarding cattle farming applies a Tier 2 characterization method to estimate (a) methane emissions from enteric fermentation, (b) methane and nitrous oxide emissions from manure management and storage, and (c) carbon dioxide and nitrous oxide emissions from feed and forage production. This helps to reflect the significant differences in the GHG emission profile of different production systems indicating each of the mentioned GHG emissions’ sources.

4.2.2. Pig

The focus of benchmarking typical pig production globally is the cost of production of pork produced. Due to the wide variety of production systems and their different performance and productivity levels, the reference unit for comparison “per 100 kg” is preferred to “per animal” to make the costs and returns globally comparable for all typical network farms. The output of the sow enterprise includes weaned or reared piglets, cull animals (sows, gilts and boars) and breeding animals, if relevant. The output of the pig finishing enterprise comprises all animals which are exclusively reared for slaughter: boars, castrates and female pigs. It does not include cull animals from the sow enterprise on the same farm. Therefore, the output of the sow and pig finishing enterprise as well as the closed systems are measured in total live weight produced and total carcass weight produced, respectively [30].
As both piglets and finished fattening pigs are tradeable goods, the results generally are presented separately for the sow enterprise (piglet production) and the pig finishing enterprise. The farm-enterprise-based analysis is based on two key assumptions: (a) it enables the comparison of closed system farms with specialized systems and (b) it reflects the (theoretical) option for farmers in closed systems to sell their own piglets to another farm and buy other piglets for the finishing enterprise. The latter assumes the principle of opportunity cost at the time of transfer. The piglets are ‘sold’ at market prices from the sow enterprise to the finishing enterprise and generate a sale income for the sow enterprise. The piglets are then ‘bought’ for the same price by the pig finishing enterprise. This generates purchase costs based on the number of transferred piglets. The sales and purchases compensate each other on whole farm level, but they appear in the enterprises [30].
The opportunity cost principle in closed systems distorts the results at the level of enterprises and reduces the validity of a comparison with specialized farms because in closed system farms no piglet costs occur in the pig finishing enterprise, nor do returns from the sale of piglets in the sow enterprise. A specific approach enables the analysis of the cost and revenue structure from birth to slaughter to better reflect closed system economics. It adds the production costs in the sow and pig finishing enterprise and comprises the returns of the fattening pigs sold, culled animals from the sow enterprise, as well as the surplus piglets sold when there are not enough fattening places available.
Finally, similar to the other livestock branches (beef and sheep), further farm system comparisons include the structure of agricultural farms, performance indicators, physical and economic labor productivity, prices and cost, as well as short-, mid- and long-term profitability.

4.2.3. Cash Crops

Economic benchmarking in the agri benchmark Cash Crop Network has three main dimensions. Firstly, the Network compares the cost per tonne of output, since this is the way trade and competition take place between sites and countries. Secondly, the Network runs benchmarking for the on-farm competitiveness of individual crops. Therefore, the Network is able to inform decision makers whether a particular crop is on the rise or in decline in a certain country or region. Additionally, based on the assumption on the availability of improved inputs or the trends in pest pressure and reduced yields, the Network can also assess the potential on-farm competitiveness of individual crops in future. Thirdly, the Network analyzes the competitiveness of an entire rotation, because in the end what matters to the entrepreneur is the profitability of the entire business, not of a single crop. This is of particular relevance when it comes to assessing land rents and land purchase prices: The return on land is the long-term basis for the evolution of rents and land purchase prices and it is based on the profitability of all crops, considering their respective share in the rotation.
In addition to that, the Network does environmental benchmarking in the area of GHG emissions or risks in water pollution. Nitrogen is by far the most important driver of GHG in crop production. In the data collection process, the Network is able to track the dominant type of nitrogen fertilizer applied in a certain region. This enables us to reflect the significant differences in the GHG emission profile of different types of fertilizers in the comparison of emission intensities per crop and production system.

4.3. Practice Change Analysis

In the context of practice change analysis, farm-level research is often confronted with a lack of data sets. The analysis of innovative technologies, the integration of new farm businesses or significant changes in management practices requires a solid qualitative and quantitative description of these technologies and their effects on existing farm enterprises. The agri benchmark typical farm approach offers opportunities to provide consistent contributions to practice change analysis in two ways: (1) New technologies are commonly tested in trial settings. The available datasets often provide excellent data depth. However, the extent of their effects on real farms is hard to assess. The integration of trial results into typical farm data sets adds knowledge about probable real-world effects, e.g., on cost structure and returns. (2) Focus group discussions have been found suitable for exploratory research in the context of complex and multifactorial challenges, e.g., rapidly changing farming techniques [39,40]. They enable the integration of a wide range of responses, conditions and experiences. In combination with typical farming systems, this enables the modeling of probable and reliable transition pathways related to practice change. This section provides concrete examples of how the typical farm approach was applied by the agri benchmark Network in practice change analysis.

4.3.1. Economic Impact of Alternatives to Surgical Piglet Castration in German Pig Production

The structural change in pig farming in Germany is mainly driven by legislation related to animal welfare and environmental protection. To evaluate the economic effects and to draw conclusions on competitiveness, economic analysis is necessary. The prohibition of castrating piglets without anesthesia led to the challenge of comparing the effects of alternative methods in different production systems, as those alternatives impact labor requirements at different stages (e.g., castration with anesthesia in sow production enterprise vs. vaccinating boars in finishing enterprise) and entail very different consequences in terms of animal performance and potential pricing (e.g., expected higher feed efficiency for entire or vaccinated males, but carcass price discrimination of entire males and potentially for vaccinated males). For the three types of production (specialized sow production, pig finishing and closed system) the alternatives of surgical castration including the use of anesthesia, entire male fattening and vaccinated boars were compared.
The available performance data were based on a comprehensive research trial on existing farms, closely observing feed intake, animal growth, carcass yields and qualities. Those trial results were combined with the typical farm approach, by transferring the measured indicators into the different production systems. All farm data were collected using the SOP, representing typical farms in all relevant German production regions. This enabled a before-and-after comparison at farm level, and comparisons of the individual farms and scenarios (benchmarking).
Figure 4 shows the possibilities of case studies and practice change analysis with the TIPI-CAL model and typical farms. The developed scenario calculator changes all relative, dependent, and absolute parameters that were quantified as a scenario of a specific baseline. Thus, multivariable scenarios can be created for each farm, all livestock branches and each production system.
In this analytic process, all scenarios were compared with each other to identify the relative excellence of any alternative for a particular typical farm. Additionally, certain scenarios of different farms were compared with each other. In the case of piglet castration, this approach enables a comparison of the economic effects of different alternative scenarios, although they change the production process at different points [21,41].

4.3.2. Transformation to Silvopastoral Systems

The popularity of silvopastoral systems in beef production has been growing given its contribution to the sustainable development of the sector [42]. The integration of trees and shrubs in pasture-based beef production systems implies substantial modifications in farm management. If the trees are integrated for indirect returns only, implementation and land maintenance costs as well as performance effects on pasture and animals still can be crucial. In case the trees are integrated as a supplementary farm enterprise providing returns from wood or orchard production, further costs and receipts need to be integrated in the economic evaluation of the production system.
In any case, silvopastoral systems imply multifactorial effects on the systems’ components that need to be assessed to the best available knowledge. These include e.g., the duration of the implementation period and resulting rest period for grazing, shade effects on animal performance and pasture productivity, forage quality of grasses and forage shrubs on animal performance, animal health effects and asset value. The research has shown that silvopastoral systems can provide substantial benefits ecologically and economically [43]. However, their uptake remains challenging. The modeling of the transition period allows the revelation of the underlying challenges in cash flow, investment steps, forage availability and herd size adjustment and animal performance. The multifactorial nature of the production system transformation requires a wide range of knowledge about agro-ecological indicators and causalities. Practical experiences of uptake processes and financial capabilities on farms provide hard to find information to model the duration and dynamic of practice change uptake. A joint development of the transformation process in focus group discussions captures various expertise. In combination with the typical farm approach and the TIPI-CAL model, the simultaneous modeling of production and financial flows provide necessary feedback to the discussion process. As a consequence of the economic modelling, results from typical farms provides decision makers with rare insights and enables informed decision making.
The agri benchmark Network has been analyzing the transformation of traditional pasture systems to silvopastoral systems in Colombia since 2015. The Colombian status-quo situation (baseline) represents a traditional, extensive cattle grazing system with degraded pasture quality and a relatively low stocking rate. Silvopastoral systems have demonstrated the potential to increase cattle productivity while making efficient use of natural resources. Assisted by advisors and producers, the detailed, realistic pathway of introducing silvopastoral systems and its implications on productivity, management, economics, greenhouse gas emissions, environmental indicators including biodiversity and animal welfare was assessed and modelled for ten years by the joining of forces of different disciplines and institutions. Silvopastoral systems convert the pastureland into an agroforestry system that combines highly-productive pasture (Guinea; Megathyrsus maximus), with a high density of legume shrubs (for example Leucaena Leucocephala with more than 10,000 plants per hectare) mixed with grasses that are directly consumed by cattle in daily rotations and can also contain timber trees (Eucalyptus tereticornis in this case). Over ten years of the establishment phase, the area of traditional grazing system will be gradually replaced by silvopastoral systems (Figure 5).
The results obtained by the agri benchmark Network show that over time, the silvopastoral systems increase plant biomass and improve soil carbon storage, the stocking rate on pasture (which increases whole-farm output and income). This allows the increase in daily weight gains and thus shortening finishing periods at a given final weight, eventually resulting in higher meat production per hectare. Figure 6 shows the transition period of silvopastoral systems in terms of feed and land productivity as well as stocking rate.
The considerable productivity increase in the Colombian silvopastoral systems dramatically reduces the total costs on a per kg output basis to approximately 60% of the baseline (Figure 7).

4.3.3. Greenhouse Gas (GHG) Emission Mitigation in Crop Production

In the view of the Paris agreement on climate change, crop production is subject to public policies aimed at reducing GHG emissions–or at least respective regulations are under discussion.
Nitrogen use–including its production–accounts for about 90% of the GHG of conventional crop production [44]. Thus, theoretically, the most straight forward option from an individual producer or country perspective is to reduce nitrogen fertilization. However, such a strategy might lead to less output and ultimately to leakage effects: somewhere in the world additional land will be needed to substitute this forgone production. This land use change is the most important factor in GHG emission from crop production [45]. Simply reducing the N-input is not a viable option, unless over-fertilization is a common issue. Nevertheless, in many production systems there are inefficiencies in general and in N-use in particular. Appropriate N-reduction strategies offer the advantage of mobilizing the economic upside potential for producers. GHG emission reduction policies that are profitable for producers potentially improve uptake in the farming community and help avoiding the policing of measures that reduce producers’ profits.
However, getting there requires a very good understanding of the current production systems and their drivers, why current inefficiencies exist and what can be done to overcome them. This information is usually not text book knowledge but expert knowledge of practitioners and their advisors. A close collaboration with these actors is key to identify and assess the real options for producers to reduce their GHG emission per ton of output. The Network makes use of the existing network of national crop production economists, regional advisors and producers in China, Brazil, the US and Germany to reveal and develop this knowledge. The focus groups that have been established to create the typical farms are approached to identify options for improvements in the production system that allow a reduction in specific GHG emissions, define measures that allow the realization of said improvements, assess the limitations and implications of those measures and identify the cost and benefits of those different options.
If the focus group does not have the necessary information at hand to assess all the technicalities of options, this process can be made revolving [46]. In such cases, agri benchmark researchers run a literature review on the specific issues and/or conduct expert interviews to supply the focus group with needed information. The technical assessment will then be used to evaluate different options in a second round in the focus group. These discussions provide the base for economic ex-ante evaluation of different approaches to improve the GHG balance in crop production. Via this mixed method approach, agri benchmark researchers formulate policy recommendations about the prioritization of different specific GHG emissions mitigation strategies.

4.4. Policy Analysis: An Example of the Cost of Regulations in the Agricultural Sector

Measures targeting farm income or risk management are usually assessed using representative data bases such as FADN, in order to estimate the effects on the sector or identify specific target groups [47]. Policies that target the production process or specific practices such as environmental standards, animal welfare or food safety protocols require changes in the production systems that can affect production costs and hence international competitiveness. These effects are product-specific and not captured in accountancy data. The typical farm approach allows the modeling of changes that farmers implement in the production systems in order to comply with regulations and to quantify the impacts on the competitiveness of specific products.
We used the typical farm approach to assess the costs of European Union (EU) regulations concerning the environment, animal welfare and food safety on the competitiveness of cow milk, beef, sheep, pork, and poultry meat, cereals (wheat), fruits (apples), and wine grapes [22]. For each of the products, the costs of compliance with a defined set of relevant EU-regulations or comparable legislation in non-EU countries were calculated for typical farms in major producing countries within and outside the EU. Building on the typical farms in the agri benchmark Networks, production costs were calculated for a specific reference year (2010), including compliance with all valid relevant legal requirements. In the focus group discussions with farmers and advisors, scenarios for a situation without the legal requirements were discussed, using the leading question “from today’s perspective, how would the typical production system look like if compliance with regulation XY was not compulsory?”.
Overall, the study included 12 EU Member States and 10 extra-EU countries [22] and assessed the cost of compliance with legal requirements in the three policy areas based on a with/without comparison. The difference of production costs for the typical farm in the baseline and the scenario without regulations was calculated and compared between countries to determine the regulations’ cost effects. The study illustrates how the typical farm approach allows in-depth analysis of agricultural policies that target specific farm management practices.

5. Conclusions

The typical farm approach, as applied by the agri benchmark Network, offers specific advantages for in-depth analysis. The close cooperation with the farming world, including producers, advisors and applied researchers enables access to information and hard-to-find data collection. This interplay during data collection and data validation ensures the reliability of data sets for the defined production system. In an analytical environment with poor public data availability regarding production economics, the typical farm approach has proven to be an efficient way to generate reliable and comparable data systematically. It provides comprehensive, consistent and coherent data on farm economics. Therefore, it helps researchers understand and analyze the fundamental economic features of different production systems globally.
Furthermore, the close interaction with producers and advisors provides researchers with access to up-to-date information which allows them to better understand recent developments and challenges in agricultural production. This, in return, enables researchers involved in focus group discussions to provide relevant policy advice based on the latest developments—an advantage to solely relying on highly aggregated and often outdated statistical datasets. Through the combination of up-to-date data on the one hand and focus group workshops with producers and advisors on the other hand, scientists can assess the feasibility of innovations and new practices. Based on the fact that they can come up with a realistic economic ex-ante analysis of changes—be it driven by changes in natural and market framework conditions, political regulation, new technologies or new technical challenges in current production systems.
Despite its suitability for the different contexts and purposes outlined in Section 4, the method, as well as the existing institutional settings (of the agri benchmark Network), have limitations. The most common criticism of the approach is that it is not statistically representative. There are two main reasons why statistical representativity cannot be achieved through the typical farm approach. Firstly, the method greatly relies on expert knowledge as, often, the data needed to comprehensively describe farming practices or agricultural production systems is not documented at all—even in most advanced farms. Secondly, unless there is a national network of typical farms to represent all major natural and structural conditions, the data points generated by the typical farms approach will usually only represent a certain fraction of the farming population in a given country. Although statistical representativeness is not an aim of the approach per se, having in mind the limitations of the data basis and the global scope of the analysis is crucial for the interpretation of the results.
Furthermore, expert knowledge by default has some subjective notion because the personality of experts, the selection of focus group participants and the dynamics in a focus group discussion may impact the outcome and the data. Therefore, usually, it is difficult to fully replicate the results from a focus group discussion. However, the dedicated data validation procedure in place and regular data updates limit the risks of outlying datasets.
Finally, for validity and continuity reasons, the establishment and maintenance of typical farms ideally requires a long-time commitment. This is a specific challenge, in cases where the management of typical farm datasets depends on individuals and determined project funding and is not embedded within the institution’s research and data collection programs.
One promising way to partly overcome these limitations is the establishment of national networks for typical farms either by public or private institutions as they currently exist or evolve in Spain, Brazil, Canada and China for diverse cropping and/or livestock production systems. An increased number of typical farms beyond the scope of international benchmarking purposes addresses the challenge of representativeness by a more detailed spatial and structural resolution. It also offers the opportunity to integrate related activities into national and institutional research agendas, thriving for more economic and institutional sustainability of the network and datasets.
A further development of the approach is to overcome the gap between farm level and sector analysis by scaling-up of results. In a current pilot project by the agri benchmark Network the validity and scope of farm level data points are addressed for the case of Brazilian cropping systems and land use. The typical farm database is scaled up to model national production by integrating crop management and farm economic data with a calibrated biophysical crop growth model. Through the bottom-up modelling approach, farm-level profitability for each crop is estimated. The comparison of estimated land use profitability of different cropping and livestock production systems delivers a projection for agricultural production under different policy or market framework conditions.
In light of the growing demand for farm economic research answering cross-country issues, both a more detailed structural and spatial resolution of typical farms and the integration of typical farm research into national research agendas can be considered necessary steps to provide relevant information to the research community. The typical farm approach is one among others to conduct economic in-depth analysis of farming activities and its impacts. In combination with other datasets, such as public structural and production statistics, farm accountancy data, geo-spatial information and models, the typical farm approach can contribute crucial knowledge of on-farm reality to the decision process for policy and program design. With its specific features, it offers opportunities to complement those for specific purposes.

Author Contributions

Conceptualization, C.C., K.A., C.D. and Y.Z.; methodology, C.C., K.A., C.D., Y.Z., M.I.A., H.G., C.R., J.S., P.T., M.V., L.B., D.T.S. and T.L.; writing—original draft preparation, C.C., K.A., C.D., Y.Z., M.I.A., H.G., C.R., J.S., P.T., M.V., L.B., D.T.S. and T.L.; writing—review and editing, C.C., K.A. and C.D.; supervision, C.C., K.A. and C.D. All authors have read and agreed to the published version of the manuscript.

Funding

This research received no external funding.

Conflicts of Interest

The authors declare no conflict of interest.

Appendix A

Figure A1. Descriptors and Indicators to predefine typical farms and production systems. Source: Own illustration.
Agriculture 10 00646 g0a1

References

  1. FAO. The Future of Food and Agriculture—Trends and Challenges; FAO: Rome, Italy, 2017; ISBN 978-92-5-109551-5.
  2. Isermeyer, F. Methodologies and comparisons of production costs—A global overview. In Sustainability and Production Costs in the Global Farming Sector: Comparative Analysis and Methodologies; Langrell, S., Ciaian, P., Gomez y Paloma, S., Eds.; European Commission: Brussels, Belgium, 2012. [Google Scholar]
  3. Marshall, A. Principles of Economics; Palgrave Macmillan: Basingstoke, UK, 2013. [Google Scholar]
  4. Feuz, D.M.; Skold, M.D. Typical Farm Theory in Agricultural Research. J. Sustain. Agric. 1990, 2, 43–58. [Google Scholar] [CrossRef] [Green Version]
  5. Taussig, F.W. Principles of Economics. Volume II; Cosimo: New York, NY, USA, 2007; ISBN 9781602063433. [Google Scholar]
  6. Miller, T.A. Aggregation Error in Representative Farm Linear Programming Supply Estimates. Retrospective Theses and Dissertations. Ph.D. Thesis, Iowa State University of Science and Technology Ames, Ames, IA, USA, 1967. [Google Scholar]
  7. Elliott, F.F. The “Representative Firm” Idea Applied to Research and Extension in Agricultural Economics. J. Farm Econ. 1928, 10, 483. [Google Scholar] [CrossRef]
  8. Becker, M.H. Discussion: Representative Farms: Guides for Decision Making? J. Farm Econ. 1963, 45, 1455–1457. [Google Scholar] [CrossRef]
  9. Carter, H.O. Representative Farms: Guides for Decision Making? J. Farm Econ. 1963, 45, 1448–1455. [Google Scholar] [CrossRef]
  10. Day, L.M. Use of Representative Farms in Studies of Interregional Competition and Production Response. J. Farm Econ. 1963, 45, 1438–1444. [Google Scholar] [CrossRef] [Green Version]
  11. Gilson, J.C. Discussion: Use of Representative Farms in Studies of Interregional Competition and Production Response. J. Farm Econ. 1963, 45, 1445–1447. [Google Scholar] [CrossRef]
  12. Seagraves, J.A. Discussion: Representative Farms for Policy and Projection Research. J. Farm Econ. 1963, 45, 1465–1468. [Google Scholar] [CrossRef]
  13. Plaxico, J.S.; Tweeten, L.G. Representative Farms for Policy and Projection Research. J. Farm Econ. 1963, 45, 1458–1465. [Google Scholar] [CrossRef]
  14. Nuthall, P.L. Farm Business Management. Analysis of Farming Systems; CAB International: Wallingford, UK; Cambridge, MA, USA, 2011; ISBN 9781845938390. [Google Scholar]
  15. Deblitz, C. agri benchmark: Benchmarking Beef Farming Systems Worldwide. In Proceedings of the 54th Annual Conference of the Australian Agricultural and Resource Economics Society, Adelaide, Australia, 10–12 February 2010. [Google Scholar]
  16. Ndambi, O.A.; Garcia, O.; Balikowa, D.; Kiconco, D.; Hemme, T.; Latacz-Lohmann, U. Milk production systems in Central Uganda: A farm economic analysis. Trop. Anim. Health Prod. 2008, 40, 269–279. [Google Scholar] [CrossRef] [PubMed]
  17. Ndambi, O.A.; Hemme, T. An economic comparison of typical dairy farming systems in South Africa, Morocco, Uganda and Cameroon. Trop. Anim. Health Prod. 2009, 41, 979–994. [Google Scholar] [CrossRef] [PubMed]
  18. Siqueira, T.T.S.; Duru, M. Economics and environmental performance issues of a typical Amazonian beef farm: A case study. J. Clean. Prod. 2016, 112, 2485–2494. [Google Scholar] [CrossRef]
  19. Lasner, T.; Brinker, A.; Nielsen, R.; Rad, F. Establishing a benchmarking for fish farming—Profitability, productivity and energy efficiency of German, Danish and Turkish rainbow trout grow-out systems. Aquac. Res. 2017, 48, 3134–3148. [Google Scholar] [CrossRef]
  20. Lasner, T.; Mytlewski, A.; Nourry, M.; Rakowski, M.; Oberle, M. Carp land: Economics of fish farms and the impact of region-marketing in the Aischgrund (DEU) and Barycz Valley (POL). Aquaculture 2020, 519, 734731. [Google Scholar] [CrossRef]
  21. Kress, K.; Verhaagh, M. The Economic Impact of German Pig Carcass Pricing Systems and Risk Scenarios for Boar Taint on the Profitability of Pork Production with Immunocastrates and Boars. Agriculture 2019, 9, 204. [Google Scholar] [CrossRef]
  22. Menghi, A.; Roest, K.; Deblitz, C.; von Davier, Z.; Wildegger, B.; de Witte, T.; Strom, K.; Garming, H.; Dirksmeyer, W.; Zimmer, Y.; et al. Assessing Farmers’ Costs of Compliance with EU Legislation in the Field of Environment, Animal Welfare and Food Safety. 2015. Available online: https://ec.europa.eu/info/sites/info/files/food-farming-fisheries/key_policies/documents/ext-study-farmer-costs-fulltext_2014_en.pdf (accessed on 20 August 2020).
  23. Agri Benchmark. Agri Benchmark Cash Crop Network. In A Standard Operating Procedure to Define Typical Farms; Agri Benchmark: Braunscweig, Germany, 2005; Available online: https://literatur.thuenen.de/digbib_extern/dk038513.pdf (accessed on 18 December 2020).
  24. Agri Benchmark. Agri Benchmark Organic Network. In A Standard Operating Procedure to Define Typical Organic Farms; Agri Benchmark: Braunscweig, Germany, 2016. [Google Scholar]
  25. Agri Benchmark. Agri Benchmark Pig Network. In A Standard Operating Procedure to Define Typical Farms; Agri Benchmark: Braunscweig, Germany, 2018; Available online: https://www.researchgate.net/publication/336769961_A_standard_operating_procedure_to_define_typical_farms (accessed on 18 December 2020).
  26. Agri Benchmark. Agri Benchmark Beef and Sheep Network. In A Standard Operating Procedure to Define Typical Farms; Agri Benchmark: Braunscweig, Germany, 2018; Available online: http://catalog.agribenchmark.org/blaetterkatalog/BSR_Report_2018/#page_1 (accessed on 18 December 2020).
  27. Hemme, T. Ein Konzept zur International Vergleichenden Analyse von Politik- und Technikfolgen in der Landwirtschaft; Bundesforschungsanst für Landwirtschaft: Braunschweig, Germany, 2000; ISBN 3933140374. [Google Scholar]
  28. Deblitz, C. Internationaler Vergleich von Systemen Extensiver Tiergebundener Grünlandnutzung: Produktionstechnische und Ökonomische Analyse, Wettbewerbsfähigkeit, Internationale Übertragbarkeit; Mellen University Press: Hemmoor, Germany; Lewiston, ME, USA, 1994. [Google Scholar]
  29. Deblitz, C. Beef and Sheep Report 2017: Understanding Agriculture Worldwide; Thünen-Institut: Braunschweig, Germany, 2017; p. 97. Available online: http://www.agribenchmark.org (accessed on 21 August 2020).
  30. Deblitz, C.; Verhaagh, M. Pig Report 2016: Understanding Agriculture Worldwide; Thünen-Institut: Braunschweig, Germany, 2016; p. 20. Available online: http://catalog.agribenchmark.org/blaetterkatalog/ExtraktPigReport2016/#page_20 (accessed on 20 August 2020).
  31. Rohlmann, C.; Verhaagh, M.; Efken, J. Steckbriefe zur Tierhaltung in Deutschland: Ferkelerzeugung und Schweinemast. 2019. Available online: https://www.thuenen.de/media/ti-themenfelder/Nutztierhaltung_und_Aquakultur/Haltungsverfahren_in_Deutschland/Schweinehaltung/Steckbrief_Schweine2019.pdf (accessed on 20 August 2020).
  32. Thobe, P.; Schickramm, L.; Chibanda, C. Steckbriefe zur Tierhaltung in Deutschland: Mastgeflügel. 2019. Available online: https://www.thuenen.de/media/ti-themenfelder/Nutztierhaltung_und_Aquakultur/Haltungsverfahren_in_Deutschland/Mastgefluegel/Steckbrief_Mastgefluegel_2019.pdf (accessed on 19 October 2020).
  33. Lasner, T. “Being Typical”—The Representative Farms Method in Aquaculture and Fisheries. Mediterr. Fish. Aquac. Res. 2020, 3, 92–100. [Google Scholar]
  34. Deblitz, C. (Ed.) Beef and Sheep Report 2015: Understanding Agriculture Worldwide; Thünen-Institut: Braunschweig, Germany, 2015; p. 136. [Google Scholar]
  35. Bergigui, F. Contribution to the Assessment of Climate Change Vulnerabilities in the Livestock Sector in North Africa, the Case of Morocco; Conference Paper, No. 1123-2016-91930; Moroccan Association of Agricultural Economics: Rabat, Morocco, 6–7 December 2011. [Google Scholar] [CrossRef]
  36. Sraïri, M.T. Is the “Livestock Revolution” achievable in water deprived areas? A reflection from experiments with irrigated smallholder farms in Morocco. In Science, Policy and Politics of Modern Agricultural System. Global Context to Local Dynamics of Sustainable Agriculture; Behnassi, M., Shahid, S.A., Mintz-Habib, N., Eds.; Springer: Dordrecht, The Netherlands, 2014. [Google Scholar]
  37. MIT D-Lab. Improving Livelihoods in Morocco: Needs Assessment of Small-Scale Cattle Farmers. D-BRIEF from MIT D-Lab Scale-Ups–Fall 2014. Available online: https://d-lab.mit.edu/resources/publications/d-brief-improving-livelihoods-morocco-needs-assessment-small-scale-cattle (accessed on 23 November 2020).
  38. Intergovernmental Panel on Climate Change. 2006 IPCC Guidelines for National Greenhouse Gase Inventories. Volume 4. Agriculture, Forestry and Other Land Use; IGES: Hayama, Kanagawa, Japan, 2006; ISBN 4-88788-032-4. [Google Scholar]
  39. Engene, S.A. Getting Research Data by Group Conference. J. Farm Econ. 1951, 33, 847–852. [Google Scholar] [CrossRef]
  40. Hoffmann, W.; Kleynhans, T. Farm Modelling for Interactive Multidisciplinary Planning of Small Grain Production Systems in the Western Cape, South Africa. In Proceedings of the 55th Annual Conference of the Australian Agricultural and Resource Economics Society, Melbourne, Australia, 8–11 February 2011. [Google Scholar]
  41. Verhaagh, M.; Deblitz, C. Wirtschaftlichkeit der Alternativen zur Betäubungslosen Ferkelkastration. Aktualisierung und Erweiterung der Betriebswirtschaftlichen Berechnungen; Thünen Working Paper No. 110. Braunschweig, Germany, 2019. Available online: https://www.thuenen.de/media/publikationen/thuenen-workingpaper/ThuenenWorkingPaper_110.pdf (accessed on 8 September 2020).
  42. Chará, J.; Reyes, E.; Peri, P.; Otte, J.; Arce, E.; Schneider, F. Silvopastoral Systems and Their Contribution to Improved Resource Use and Sustainable Development Goals (SDG): Evidence from Latin America; FAO: Rome, Italy, 2019; ISBN 978-92-5-131192-9. [Google Scholar]
  43. Reyes, E.; Bellagamba, A.; Molina, J.J.; Izquierdo, L.; Deblitz, C.; Chará, J.; Mitchell, L.; Romanowicz, B.; Gómez, M.; Murgueitio, E. Measuring Sustainability on Cattle Ranches. Silvopastoral Systems; Briefing Paper 17/2; Agri Benchmark Beef and Sheep Network and CIPAV/FEDEGAN/World Animal Protection/Good Food Futures Ltd.: Braunschweig, Germany; Cali, Colombia, 2017; Available online: http://www.agribenchmark.org/fileadmin/Dateiablage/B-Beef-and-Sheep/Reports-Abstracts/ReportSPS6-Colombiancasestudies.pdf (accessed on 26 June 2020).
  44. Sylvester-Bradley, R.; Kindred, D.R.; Wynn, S.; Thorman, R.E. Efficiencies of nitrogen fertilizers for winter cereal production, with implications for greenhouse gas intensities of grain. J. Agric. Sci. 2014, 152, 3–22. [Google Scholar] [CrossRef]
  45. Searchinger, T.; Heimlich, R.; Houghton, R.A.; Dong, F.; Elobeid, A.; Fabiosa, J.; Tokgoz, S.; Hayes, D.; Yu, T.-H. Use of U.S. croplands for biofuels increases greenhouse gases through emissions from land-use change. Science 2008, 319, 1238–1240. [Google Scholar] [CrossRef] [PubMed]
  46. Krug, J. Perspektiven Ackerbaulicher Grenzstandorte in Nordostdeutschland. Übertragbarkeit Extensiver Produktionssysteme Überseeischer Trockenstandorte; Johann Heinrich von Thünen-Institut: Braunschweig, Germany, 2013; ISBN 978-3-86576-106-4. [Google Scholar]
  47. European Commission—EU FADN. Income Development in EU Farms; Farm Economics Brief No. 1; European Commission: Brussels, Belgium, 2011; Available online: https://ec.europa.eu/agriculture/rica/publications_en.cfm (accessed on 24 September 2020).
Figure 1. Overview of agri benchmark Standard Operating Procedure (SOP). Source: Own illustration.
Agriculture 10 00646 g001
Figure 2. Performance indicators of the status-quo production systems. Source: Own illustration.
Agriculture 10 00646 g002
Figure 3. Total production costs of the status-quo production systems (USD/100 kg carcass weight) Source: Own illustration.
Agriculture 10 00646 g003
Figure 4. Possibilities of case studies and practice change analysis with TIPI-CAL. Source: Own illustration.
Agriculture 10 00646 g004
Figure 5. Transition of land use for silvopastoral systems in the establishment phase 2015–2024 (in hectares). Source: Own illustration.
Agriculture 10 00646 g005
Figure 6. Feed and land productivity and stocking rate in the establishment phase 2015–2024. Source: Own illustration.
Agriculture 10 00646 g006
Figure 7. Total production costs of the silvopastoral systems in Colombia compared to the baseline (USD/100 kg carcass weight). Source: Own illustration.
Agriculture 10 00646 g007
Table 1. Overview of the status-quo production systems. Source: Own illustration.
ArgentinaMorocco
RegionCuenca del Salado, Buenos Aires ProvinceBuenos Aires ProvinceChaouia plains, Casablanca-Settat provinceChaouia plains, Casablanca-Settat province
Farm EnterprisesBeef finishing, cow-calf, cash cropsBeef finishingDairy, Beef finishing, cash cropsBeef finishing, cash crops
Total Farm Acreage (ha)2000 of which 1400 ha pasture77724
Feeding SystemPastureGrain-fed (Feedlot)Cut and carrySilage
Main Feed SourcesNatural grass and planted pastures, concentratesGrains, products Freshly cut grass, alfalfa, wheat branSilage (corn, triticale), straw, concentrates
BreedsAngusAngus & crossesLocalHolstein (black, red pie)
Origin of Finished CattleCow-calf (own)Dairy/Cow-calf purchasedDairy (purchase)Dairy (purchase)
No. and Type of Animals Sold/Year503 male weaners to finishing
500 Steers
312 Heifers
14,250 steers,
5700 bulls,
6080 heifers
2 Bulls282 Bulls
Stocking Rate (LU/ha Forage Area) * 1.7720.67.2
Total Hired Labor (h/yr)300512,6887209389
Total Family Labor (h/yr)44539327922571
* Stocking rate: Livestock units (1 LU = 500 kg live weight) per ha forage area based on average number of animals.
Publisher’s Note: MDPI stays neutral with regard to jurisdictional claims in published maps and institutional affiliations.

