Article

Influence of Spray Technology and Application Rate on Leaf Deposit and Ground Losses in Mountain Viticulture

by
Costas Michael
1,*,
Emilio Gil
2,
Montserrat Gallart
2 and
Menelaos C. Stavrinides
1,*
1
Department of Agricultural Sciences, Biotechnology and Food Science, Cyprus University of Technology, Arch. Kyprianos 30, 3036 Limassol, Cyprus
2
Department of Agri-Food Engineering and Biotechnology, Campus del Baix Llobregat, Universitat Politècnica de Catalunya, Esteve Terradas, 8, 08860 Castelldefels, Spain
*
Authors to whom correspondence should be addressed.
Agriculture 2020, 10(12), 615; https://doi.org/10.3390/agriculture10120615
Submission received: 31 October 2020 / Revised: 22 November 2020 / Accepted: 5 December 2020 / Published: 9 December 2020

Abstract

:
Leaf deposit and ground losses generated from spray application in mountain viticulture were evaluated. Four treatments were examined: A spray gun (1000 L ha−1, High-Volume Sprayer—HVS), a motorized knapsack sprayer (200 L ha−1, Low Volume Sprayer—LVS), and a conventional orchard mist blower calibrated at 500 L ha−1 (OS500) or 250 L ha−1 (OS250). The four treatments were assessed using the same tank concentration of tracer in two training systems: a trellis and a goblet. Sprayer treatment, vine side, and vine height significantly affected leaf deposit (p < 0.05). The absolute amount of leaf deposit increased with application volume, but when the amount of deposit was standardized to 1 kg ha−1, LVS resulted in the highest deposit, followed by HVS, OS250, and OS500. Deposition for the goblet system was ca. half that for the trellised vineyard. Ground losses standardized to 1 kg of tracer ha−1 were twice as high for HVS than for LVS, and four times as high for HVS than for OS250 and OS500, in both training systems. The current work suggests that low volume applications in vineyards are a viable and more environmentally friendly alternative than high volume treatments.

1. Introduction

European member states are obliged to implement the European Directive 2009/128/EC [1] on the Sustainable Use of Pesticides, which aims at reducing the risks and impacts of pesticide use on human health and the environment. Among the Directive’s major goals are the inspection and calibration of sprayers and training on their proper use. To achieve the goals of the Directive, the European Commission launched the initiative “Better Training for Safer Food” [2], which among other topics, includes training on the proper use and calibration of Pesticide Application Equipment (PAE).
Pesticide applications aim at depositing the highest possible amount of the active ingredient on the target surface (e.g., the leaf), where the target pest resides and/or feeds [3]. Despite having state-of-the-art sprayers, a quantity of pesticide can drift through the air or can be lost to the ground. Pesticide drift and losses to the ground result in environmental pollution, and tools are being developed to measure and reduce off-target losses [4,5,6]. A major cause of ground losses is the runoff of spray liquid from the treated surface, a consequence of not using an appropriate dosing system, or because of performing low uniformity treatments from inadequate use and poor maintenance of application equipment [7]. ISO 22866 (2005) defines drift as the quantity of a plant protection product that is carried out of the treated area by the action of air currents during the application process. Many authors have attempted to quantify spray drift and direct ground losses generated by different circumstances, types of equipment, and working parameters [8,9,10,11,12].
Substantial amounts of plant protection products are used for protecting grapevines, placing viticulture amongst the most intensive cultivations worldwide [13]. Vineyards cover a surface area of 7.5 million ha globally, with 37% of the grape production in Europe, 34% in Asia, and 19% in America [14]. Mountain viticulture is an extreme form of vine growing at an altitude higher than 500 m, slopes greater than 30%, terraces, or on small islands (www.cervim.org). A common feature of mountain viticulture is the small size of vineyards that precludes intensive mechanization. Mountain viticulture is also characterized by the difficulty of using high amounts of water for pesticide applications because of scarce water resources and/or the lack of irrigation facilities. The options of spray application technologies available for mountain viticulture are limited because of the difficulties inherent in cultivating small parcels of land, especially when fields are nested on steep slopes.
Application of plant protection products in mountain viticulture relied traditionally on spray guns, also characterized as High-Volume Sprayers (HVS). HVS can be either on a tractor (mounted or trailed) or motorized (mobile units) and require high volumes of water, up to 1500 L ha−1 [15]. Spraying using high volumes results in high drift and runoff [16,17,18]. Furthermore, many farmers often apply pesticides to the point of runoff as a guarantee of high biological efficacy [19]. Spray guns are still in use, although today, most orchards and vineyards are sprayed with a machine operated air blast sprayers. Spray guns are still the most common spraying technique used by farmers in many mountainous vineyards, usually at volumes higher than 1000 L ha−1.
The motorized knapsack sprayer is another type of sprayer used in viticulture. The sprayer relies on a Venturi system, whereby through a calibration plate, the product passes and is taken to a diffuser at low pressure, where it meets a high-pressure air jet that micronizes the solution [3]. Motorized knapsack sprayers can be used in vineyards with a volume varying from 150 to 250 L ha−1 [15,20] and are classified as Low Volume Sprayers (LVS).
Another relatively recent spraying technology for vineyards is the axial fan orchard sprayer (OS) equipped with a vineyard tower. The axial fan is driven by the tractor’s power take-off, which uses side air outlets to direct the air-jet into the canopy on the left and right side of the sprayer. The liquid pressure is produced using a volumetric pump, and a constant pressure valve regulator controls the liquid output. Orchard sprayers are simple in their operation with low labor costs, with the main disadvantage being the excessive drift and losses to the ground due to the axial fan design [6], especially when used for high volume applications. However, OSs are versatile machines and can also be used for low volume applications by manipulating the tractor speed, type of nozzle, and working pressure.
Research on pesticide deposition and ground losses in viticulture has included testing different types of sprayers [16,21] or more advanced equipment such as ultrasonic sensors for target detection [22]. Nevertheless, limited research has been carried out to evaluate spray equipment’s effectiveness in mountain viticulture [20,23]. The current study aimed to define the most effective combination of spray technology and volume rate for the specific case of mountainous viticulture in Cyprus and generate useful recommendations considering vines’ particularities. Our work assessed the deposit on the vine canopy and the losses to the ground via runoff for three different types of sprayers: (a) an HVS with a spray gun, (b) a tractor-mounted air-blast OS used for both high and low volume applications, and (c) an LVS.

2. Materials and Methods

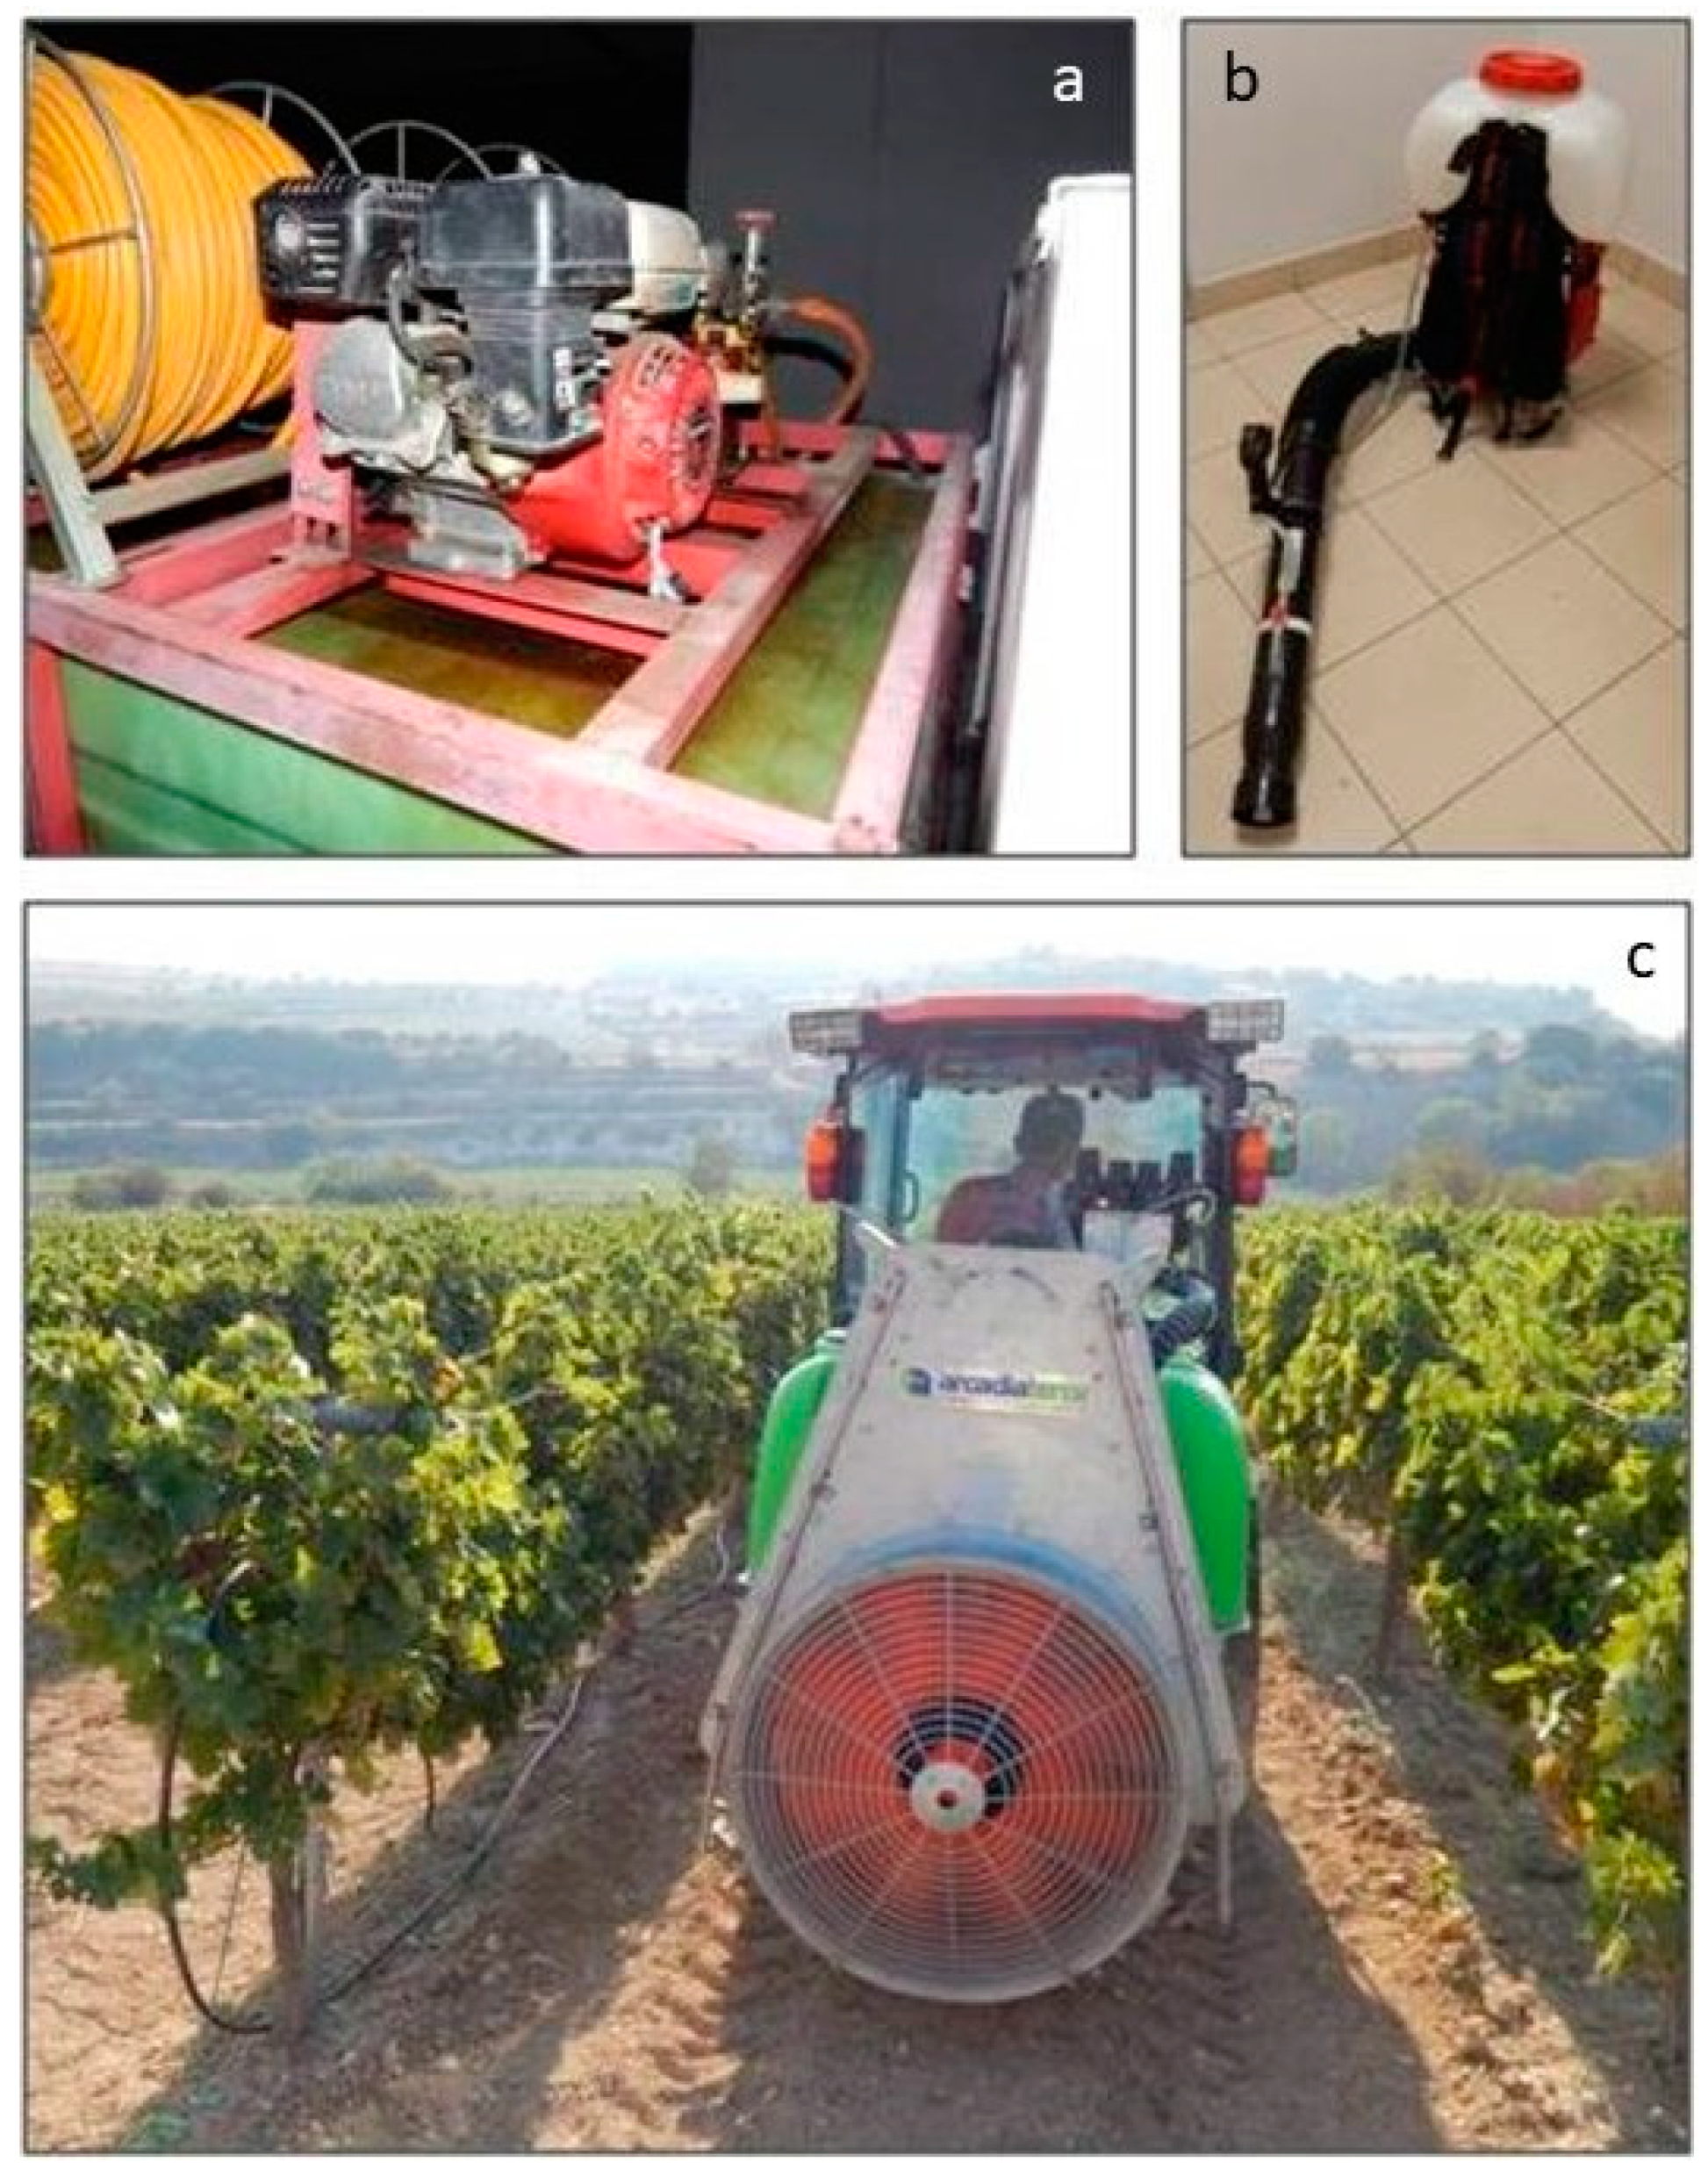
2.1. Spray Application Equipment

In the present study, the following combinations of sprayers and volume rates were tested (Figure 1):
  • A High-Volume Sprayer (HVS) with a spray gun (Honda GX 120, Hamamatsu, Japan) equipped with a 4.0 HP engine, with a hose length of 100 m, calibrated at a nominal volume of 1000 L ha−1.
  • A conventional Orchard Sprayer (OS) equipped with a vertical tower (Arcadia Terra, Model Cronos, Greece) calibrated at 500 L ha−1 (OS500).
  • The same conventional Orchard Sprayer calibrated at 250 L ha−1 (OS250).
  • A Motorized air-assisted knapsack sprayer (CIFARELLI Mist Blower M1200, CIFARELLI, Voghera, Italy) adapted for Low Volume Spray (LVS) calibrated at 200 L ha−1.
For both OS treatments, the sprayer was equipped with 12 nozzles arranged on two vertical booms (6 nozzles per side), fixed at the mid-point between the consecutive air outlets. Only the three lower nozzles on each side were used to adapt the sprayer to the vines’ height. Sprayings were made by moving the sprayer along two consecutive rows of crops. In this way, the vines were sprayed on both sides. The equivalent performance is one row per pass.
The volume rate for each technology was selected according to the farmers’ current practice and the reduction we wanted to achieve. Farmers use HVS connected to spray guns at or more than 1000 L ha−1 [15,17,20]. LVS was calibrated according to the common practice of the farmers and a previous study [15]. The two volumes with OS were chosen to achieve a 50 and 75% reduction of the HVS volume rate, in line with the practice of vine growers in other regions [24].

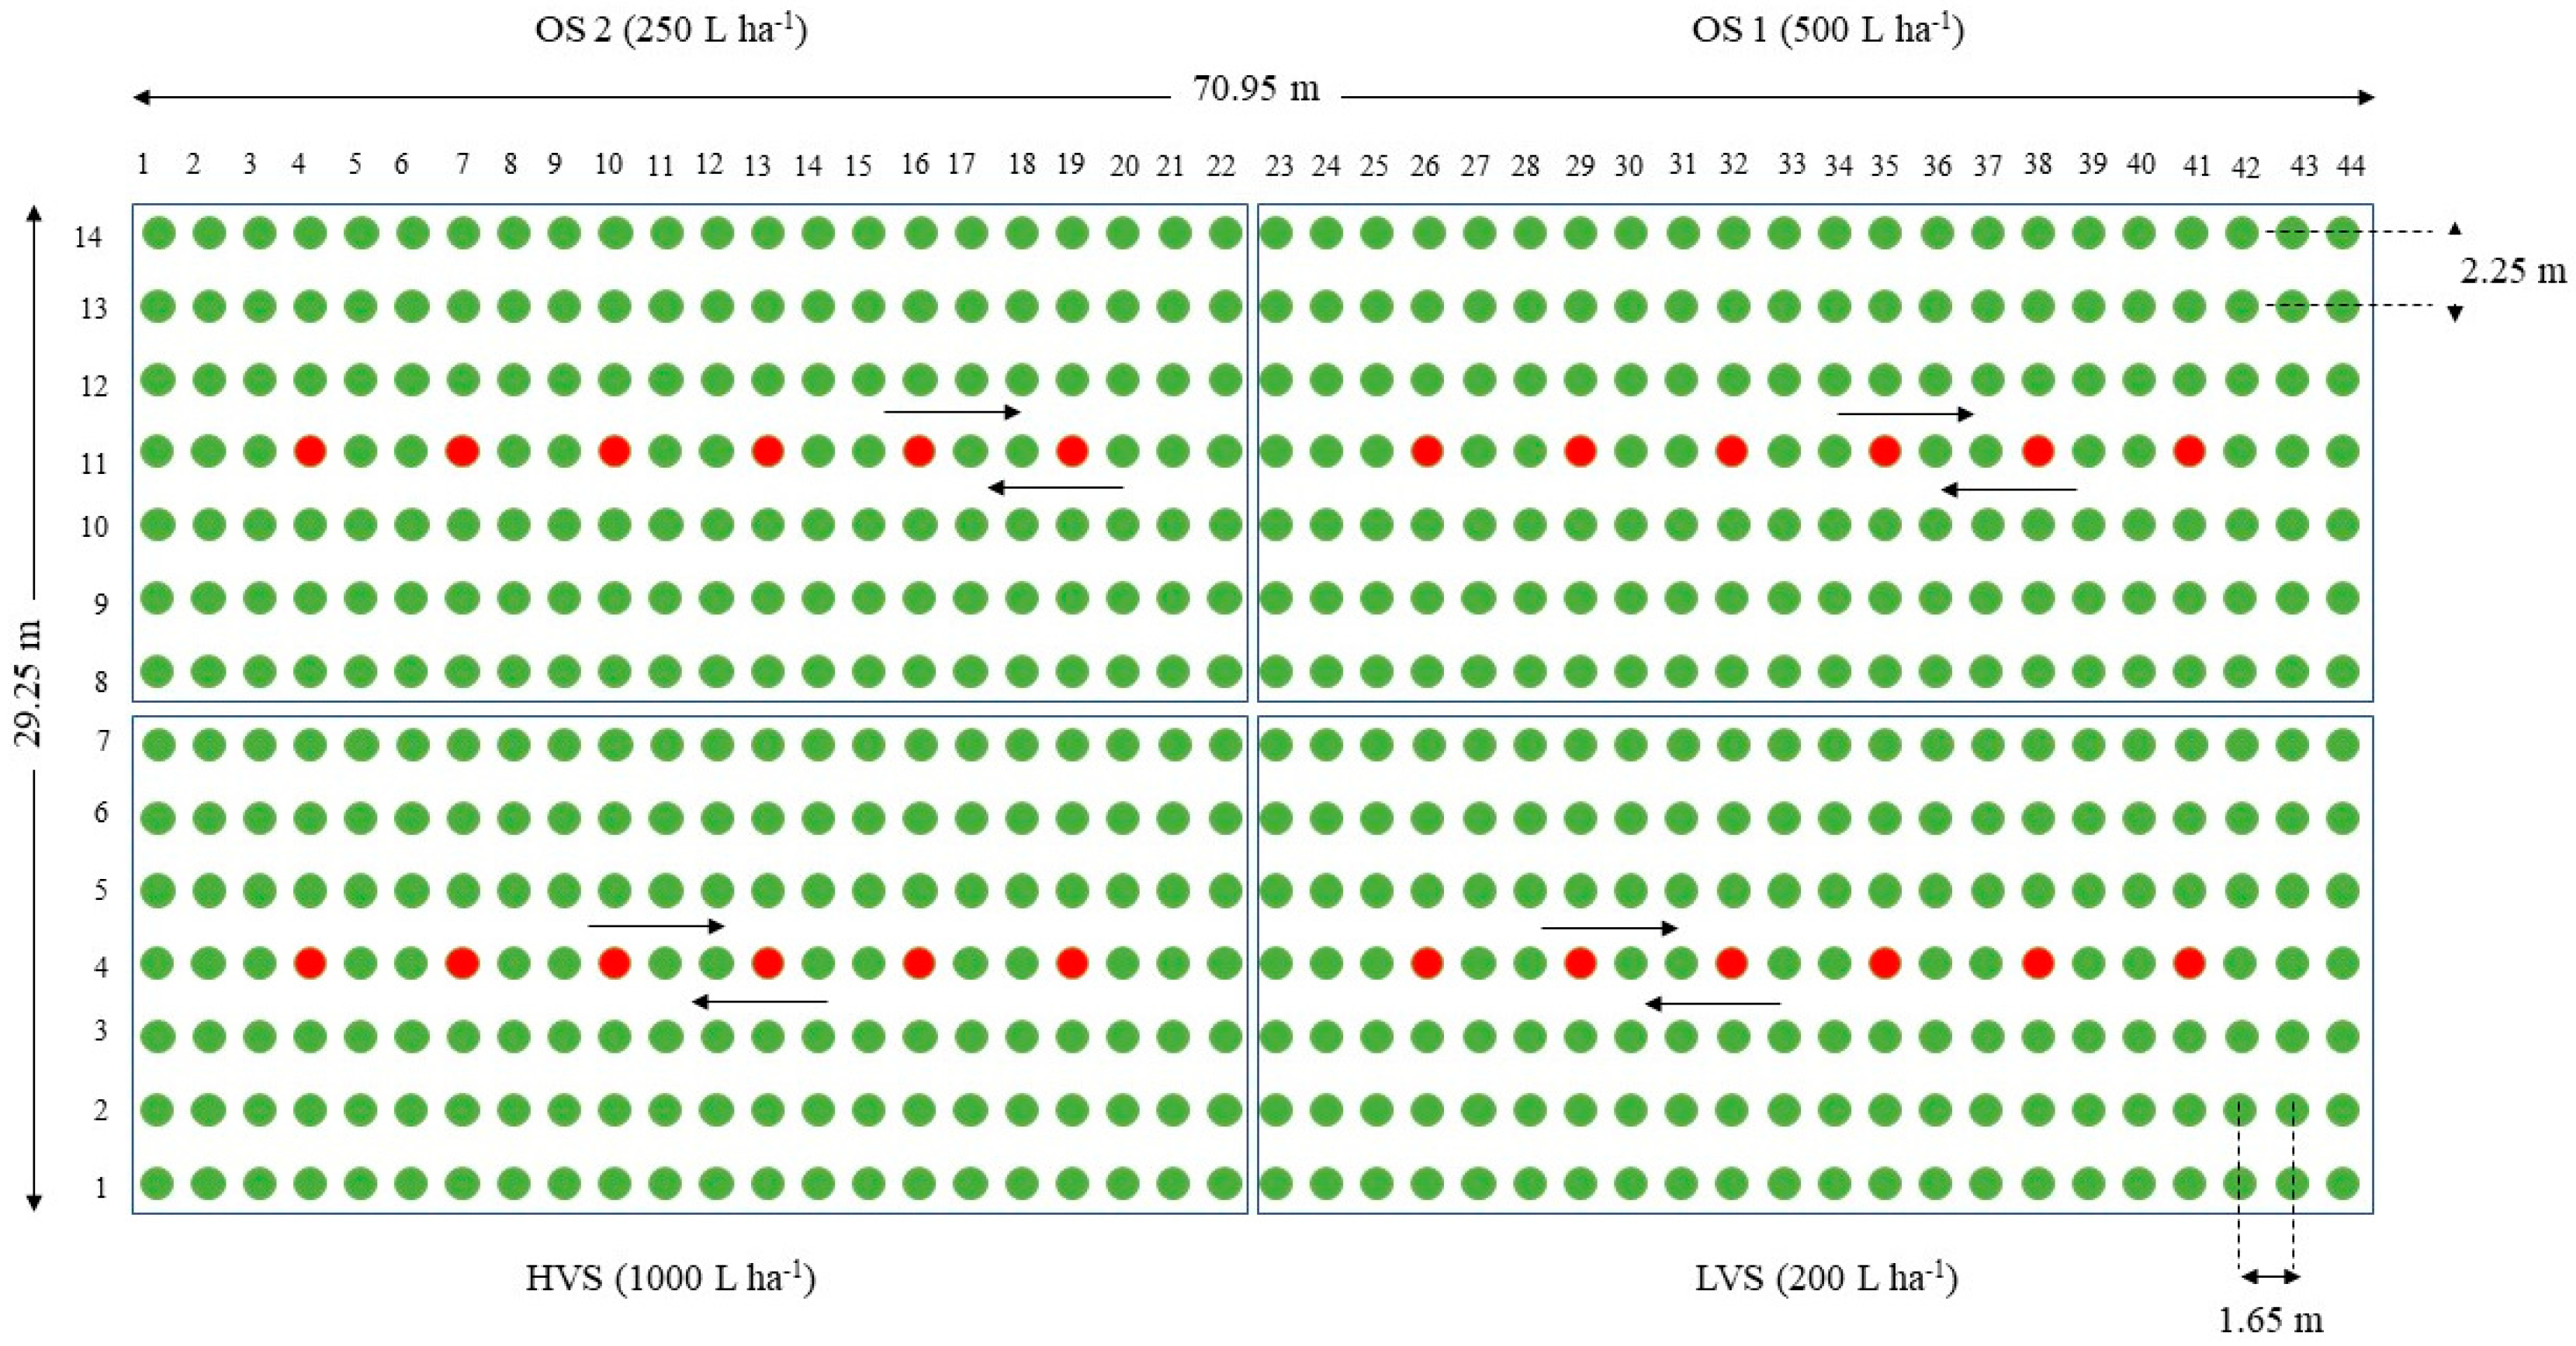
2.2. Experimental Design and Spraying Technique

The study was conducted in 2016 in two 0.3 ha−1 vineyards, planted with the indigenous white variety Xynisteri. The vineyards were located in Lemona Village, Paphos, Cyprus (34°51′47″ N, 32°33′26″ E, altitude: 308 m). Both vineyards were planted in 2004. The first vineyard was trained as a trellis system and the second as a goblet (sprawled) system. Vine spacing was 1.65 m within and 2.25 m between rows in both vineyards.
Spray deposition was evaluated on 13 July 2016 at the BBCH 79 stage (most grape berries touching). The sprayers were used to spray 154 plants per treatment (7 rows × 22 plants per row) (Figure 2). Applications were made to both sides of each treated row, by the same person—sprayer, at the same speed and technique. Working parameters and calibration values of the sprayers during the tests are provided in Table 1.
Spraying was carried out with a tracer’s aqueous solution, the food color adjuvant Tartrazine (E 102) 85% at a nominal concentration of 4000 mg L−1. Tartrazine is photostable, non-toxic, and has high recovery rates since it remains on the leaves when it dries and can be washed out from the leaves in the lab with distilled water [25,26]. Before and after each sprayer’s test, a tank sample was taken to measure the actual tracer concentration, while the sprayer was activated at the set operating pressure in a static position. The samples were collected and stored in a dark recipient for laboratory analysis to obtain the reference absorbance value.
During the spraying, best management practices for a good and safe spray application process were followed [27]. Air temperature, relative humidity, and wind speed were measured by a WatchDog 2000 Series Weather Station (Spectrum Technologies, Inc., Fort Worth, TX, USA). The weather station was placed at the height of 2.0 m, free from obstacles. For the trellis system, the mean wind velocity during the trial was 0.3 m s−1, and the mean values for temperature and RH were 33.7 °C and 26.9%, respectively. For the goblet system, the mean wind velocity was 0.2 m s−1, and the mean values for temperature and RH were 35 °C and 25.8%, respectively.

2.3. Determination of the Relationship between Leaf Weight-Area and Estimation of the Leaf Area Index

After that, 18 leaves were collected randomly from each training system (trellis and goblet) to determine the relationship between leaf weight and leaf area. Each leaf was weighted, and its surface (one side only) was measured with the software ImageJ [28]. The relationship between leaf weight and leaf area was determined using linear regression.
The leaf area index (LAI) was determined by the area-weight ratio estimation [6,22,29]. For the study, a canopy area of 1.0 m in length for the trellis training system and a single vine for the goblet training system were randomly selected, and all leaves were removed. Leaves were collected in a plastic bag, and the weight of each leaf was determined in the laboratory. The unitless LAI was calculated by dividing the canopy’s total surface area corresponding to one plant with the vineyard ground area corresponding to each plant, which is proportional to the planting density (Table 2).

2.4. Characterization of the Canopy

Canopy size characterization parameters for the vines for the two training systems were measured in the vineyard at the BBCH 79 stage and are shown in Table 2.

2.5. Leaf Sampling Procedure

Before the spray application, 25 leaves from each training system were collected as blank samples. Those leaves were taken to determine the pre-spraying amounts of tartrazine (expected to be near zero).
Leaf samples to evaluate spray deposits were collected from the central row of each treatment to avoid cross-contamination from neighboring treatments (Figure 2). Additionally, the first three and last three plants on each row were excluded from the sampling process for the same reason.
Once the spray residues dried out, leaves were collected from six vines per treatment (Figure 2). Nine leaves were collected from each vine, representing nine different zones: three heights (top, middle, and bottom of the canopy) × three depths (outer left, center, and outer right side) (Figure 3), following the methodology used in previous trials in vineyards [22,29,30]. Subsequently, there were three positions on the left side of the vine, three in the middle and three on the right side, which resulted in nine zones covering the whole canopy. Collected leaves were placed individually in plastic bags and were stored in a cool box until transportation to the laboratory, where they were placed in a refrigerator until measurements took place.

2.6. Quantification of Spray Deposition on Leaves

In the laboratory, each plastic bag containing samples was weighted. The weight of the bag was subtracted from the total to estimate the weight of the leaf. The leaf surface area was estimated based on the relationship between leaf weight and leaf area (see the section on Characterization of the canopy).
The total amount of tracer per unit leaf surface (μg cm−2) was measured following Llorens et al. [29]. Briefly, 20 mL of deionized water were added to each plastic bag containing the sample. The bag was shaken for at least one minute to allow tartrazine to dissolve in the water. The solution’s tracer concentration was measured using a Tecan Infinite M200 Pro Fluorometer (Tecan Austria GmbH, Austria, Europe) using absorbance spectrometry at L = 423 nm [25].
The amount of tracer deposited on each sample was determined by dividing the amount of tracer deposited on each leaf by the area of the collector (leaf) according to Equation (1), as proposed by Gil et al. [22] and Llorens et al. [29]:
d = (Tcl × w)/La
where d is the actual deposit (μg cm−2) per leaf area, Tcl is the tracer concentration in the washing solution of the sample (mg L−1), w is the deionized water volume (mL), and La is the surface area of the upper leaf side (cm2).

2.7. Data Normalization

The normalized deposition dN was calculated to account for differences between nominal and actual tracer concentration and volume rate for each sprayer (Table 1) [22,29,31].
dN = d × fTcs × fVR,
where dN is the normalized tracer deposit (µg cm−2 leaf), fTcs is a factor correcting for differences between the nominal (Tcs—4000 mg L−1) and actual concentration of the tracer in the spray tank, and fVR compensates for the difference between the nominal (VR) and actual volume rate for each sprayer (Table 1).
The deposit on leaves standardized to one kg of tracer per ha (dG) was calculated as follows [32]:
dG = (dN × 106)/(Tcs × VR),
where dG is the amount of deposit per unit of tracer applied per hectare (µg cm−2/kg tracer ha−1), dN is the normalized tracer deposit (µg cm−2), Tcs is the tracer concentration in the tank (mg L−1), and VR is the nominal application rate (L ha−1) (Table 1).
Following Codis et al. [32], the amount of tracer deposit (µg cm−2) standardized over a volume of 100 L ha−1 was determined as follows:
d100 = (dN × 100)/VR
where d100 is the deposit (µg cm−2/100 L ha−1), dN is the normalized tracer deposit (µg cm−2 leaf), and VR is the nominal application rate (L ha−1).

2.8. Evaluation of Spray Losses to the Ground

A wooden board (40 cm × 20 cm) with two round pieces (11 cm Ø) of absorbent filter paper (Whatman, No 4 Qualitative) was placed on the ground [16] under each vine from which leaves were sampled to collect spray deposits (total of six boards per treatment). This was done to assess spray losses to the ground for each treatment. Tartrazine has a high recovery rate from absorbent paper [16]. The determination of the spray losses was assessed in the same way as for the leaves. After the spray, each filter paper was placed in a plastic bag, stored in a cool box in the field, and afterward in a refrigerator until extraction in the laboratory.

2.9. Statistical Analyses

Statistical analyses were carried out using the statistical software R [33]. The relationship between leaf weight and leaf area was determined using linear regression (function lm) as implemented in the base package of R [31]. Data were plotted using the package ggplot2 [34].
The spray deposition data on leaves were analyzed in a linear mixed-effects model framework in the package lme4 with the function lmer [35]. Treatment, sample side, sample height, and their interactions were included as fixed factors and vine (plant) as a random factor to account for the multiple measurements per plant. A natural logarithm transformation was applied to stabilize the variance. Degrees of freedom for F-tests were estimated with Satterthwaite’s approximation as implemented in the ANOVA function of the package lmerTest [36]. The difflsmeans function of the lmerTest package was used to compare treatment means for the losses to the ground data. A similar approach was followed to analyze losses to the ground, with vine included as a random factor.

3. Results

3.1. Relationship between Leaf Weight-Area and Estimation of the Leaf Area Index

There was a significant relationship between leaf area and leaf weight for both varieties (Figure 4). For leaves from trellised vines, the intercept was estimated at 22.07 ± 4.45 (estimate ± 1 SE), while the slope at 34.04 ± 1.86 (leaf area = 22.07 + 34.04 ∗ leaf weight), and the regression was statistically significant (F = 336.2; df = 1, 16; p < 0.001; R2 = 0.95). For leaves from vines trained in the goblet system, the intercept was estimated at 28.34 ± 4.16, the slope at 29.48 ± 1.69 (leaf area = 28.34 + 29.48 ∗ leaf weight), and the relationship was also statistically significant (F = 304.8; df = 1, 16; P < 0.001; R2 = 0.95). The LAI for the trellis system was 2.21 and for the goblet 1.00.

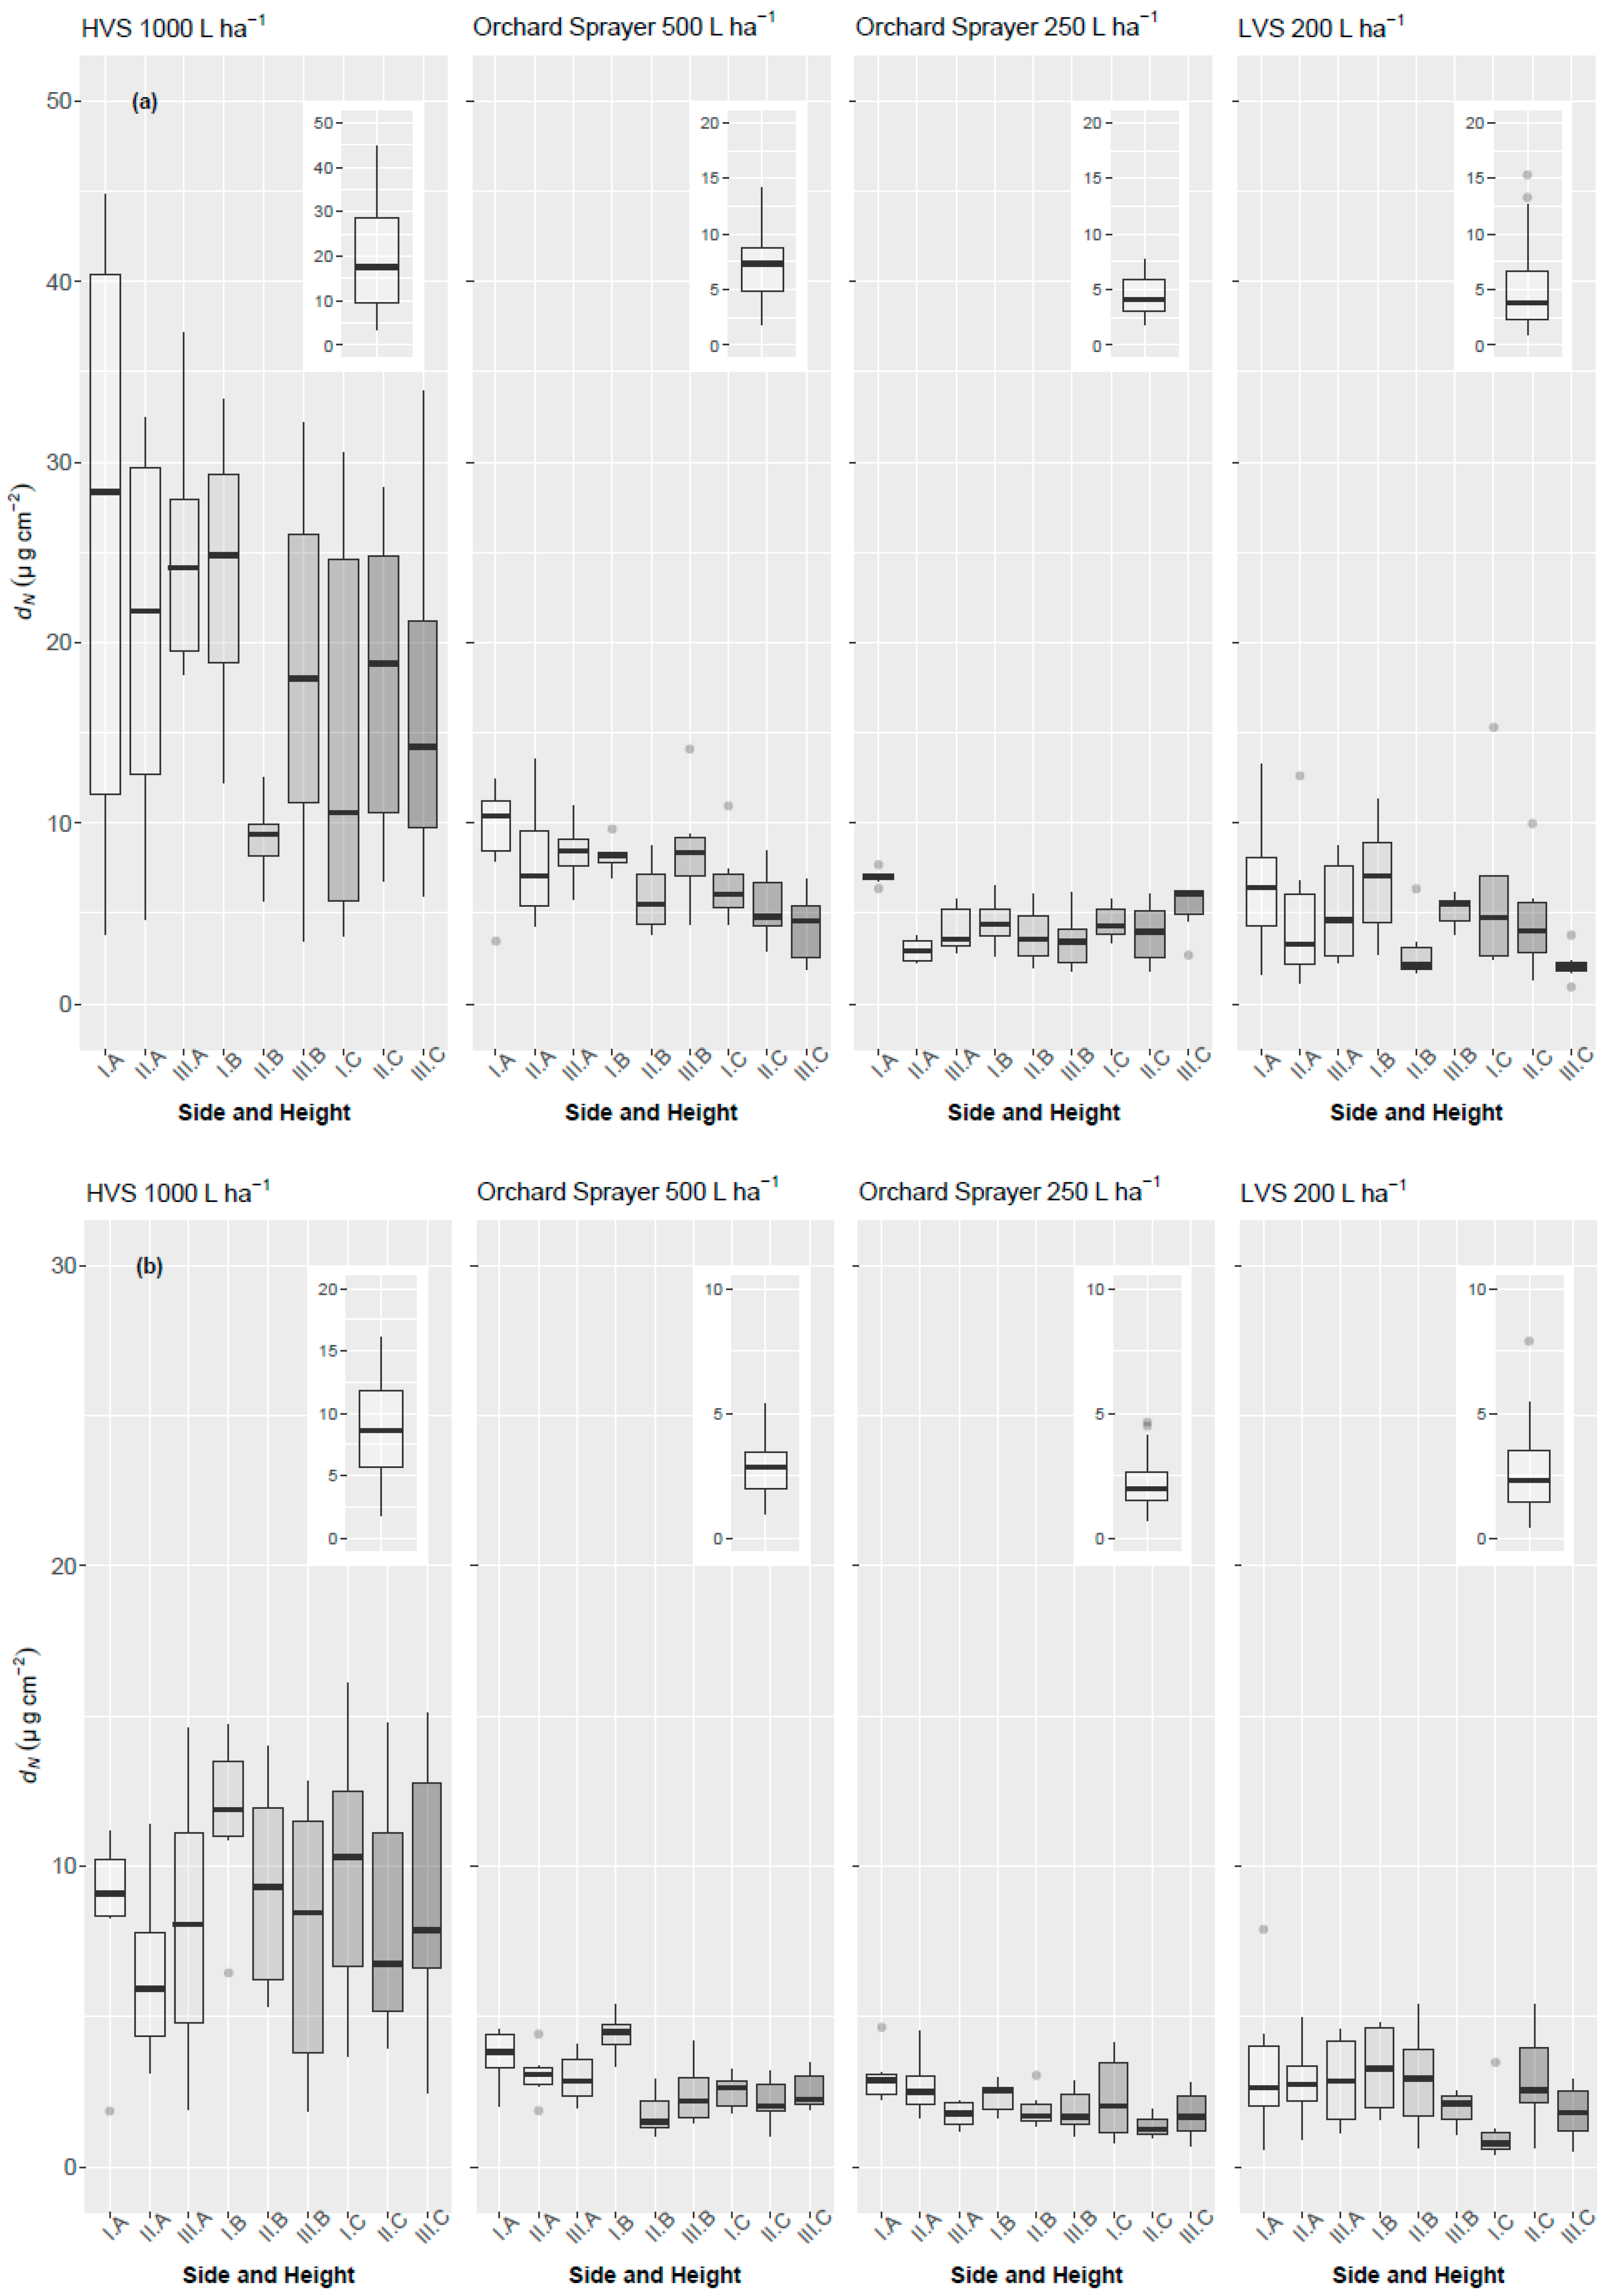
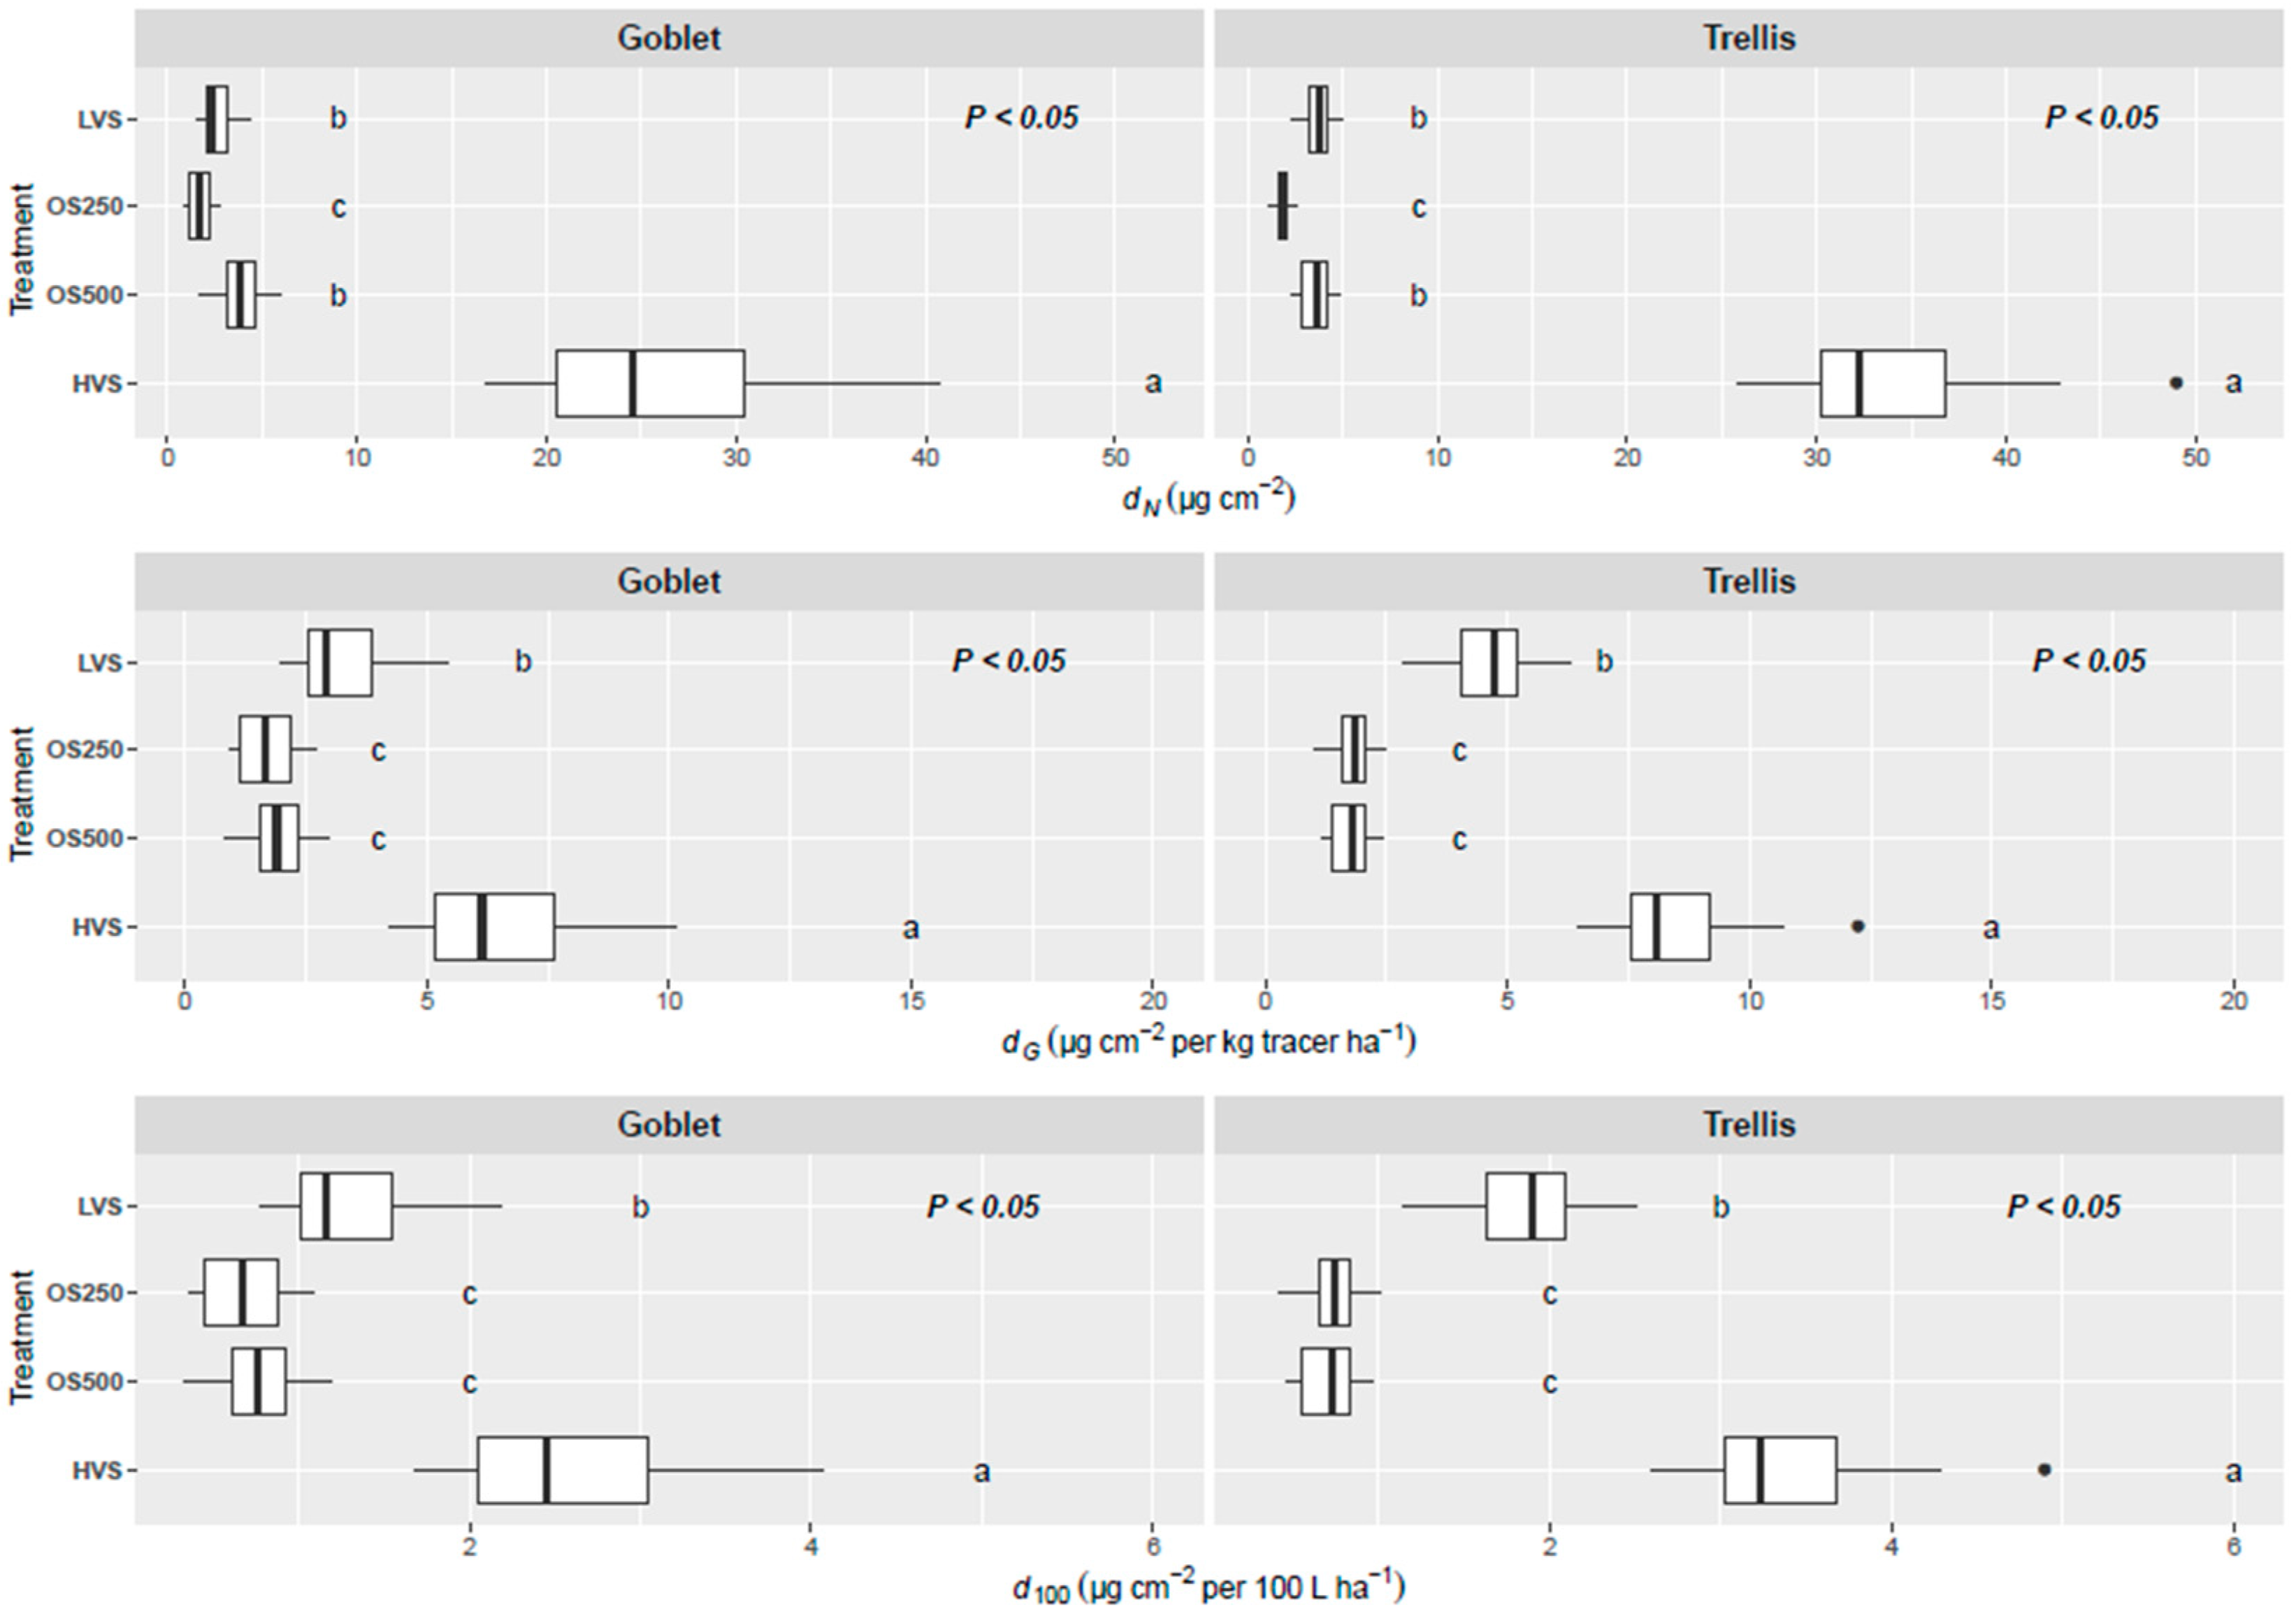
3.2. Quantification of Spray Deposition on Leaves

Tracer concentration in the blank leaf samples was lower than the spectrophotometer’s detection limit (<0.01 ppm) for both training systems.
The dN for the trellis system was higher for HVS, followed by OS500, OS250, and LVS (Figure 5a). The median dN was 17.57, 7.33, 4.12, and 3.80 for HVS, OS500, OS250, and LVS, respectively. The main effects for sprayer, sampling side, and height were statistically significant (Table 3). The interactions between side and height, and sprayer, side, and height were very close to significance and were retained in the model (Table 3). The dN was generally higher on the lower and middle than the top part of the vine (Figure S1a), and there was a trend of higher dN on the outer sides of the vine compared to the interior part (Figure S1b). Low dN values were reported from the canopy’s central middle part (sampling area IIB—Figure 3) for all sprayers (Figure 5a), and especially HVS. The variability in dN was higher in HVS, followed by LVS and the two OS treatments. Among vine variation was an important source of variability for dN (Table 3—random effect for vine).
The dN for the goblet system was higher on leaves sprayed with the HVS, followed by OS500, LVS, and OS250 (Figure 5b). The median dN was 8.59, 2.83, 2.32, and 1.96 for HVS, OS500, LVS, and OS250, respectively. Τhe main effects for the sprayer, side, and height were statistically significant (Table 3). The interactions between sprayer and height and side and height were very close to significance. Except for HVS, dN was higher on lower parts of the vine (Figure S1a). A weak trend of lower dN in the internal part of the vine was observed only for OS250 and OS500 (Figure S1b). The variability in dN was higher in HVS, followed by LVS and the two OS treatments. Among vine variation was an important source of variability for dN (Table 3—random effect for vine).
The median dG values for trellised vines were 4.75, 4.39, 4.12, and 3.67 for LVS, HVS, OS250, and OS500, respectively (Figure 6a). The statistical analysis results showed that the main effects for sprayer, side, and height were statistically significant (Table 4). The interactions between side and height, and sprayer, side and height were very close to significance. The variability in dG for LVS and HVS was generally greater than that for OS500 and OS250. For each sprayer, the trend among sides and height was the same as for dN. Among vine variation was an important source of variability for dG (Table 4—random effect for vine).
For the goblet training system, the median dG values were 2.90, 2.15, 1.96, and 1.42 for LVS, HVS, OS250, and OS500, respectively (Figure 6b). The main effect for sprayer, side and height was significant (Table 4). The interactions between sprayer and height, and side and height were not far from significance (Table 4). The variability in dG was higher for LVS and HVS than for OS500 and OS250. Within each sprayer, the trend among sides and height was the same as for dN. Among vine variation was an important source of variability for dG (Table 4—random effect for vine).
The median d100 values for trellised vines were 2.47, 1.91, 1.75, and 1.46 for LVS, HVS, OS250, and OS500, respectively (Figure 7). Given that the nominal tracer concentration was the same for all sprayer treatments, the statistical analysis for d100 is equivalent to that for dG (Table 4) as the two parameters differ only by a divisor of 2.5 (see Equations (3) and (4)). For the goblet training system, the median d100 values were 1.28, 0.87, 0.84, and 0.57 for the LVS, HVS, OS250, and OS500, respectively (Figure 7 and Table 4 show the results of the statistical analysis).

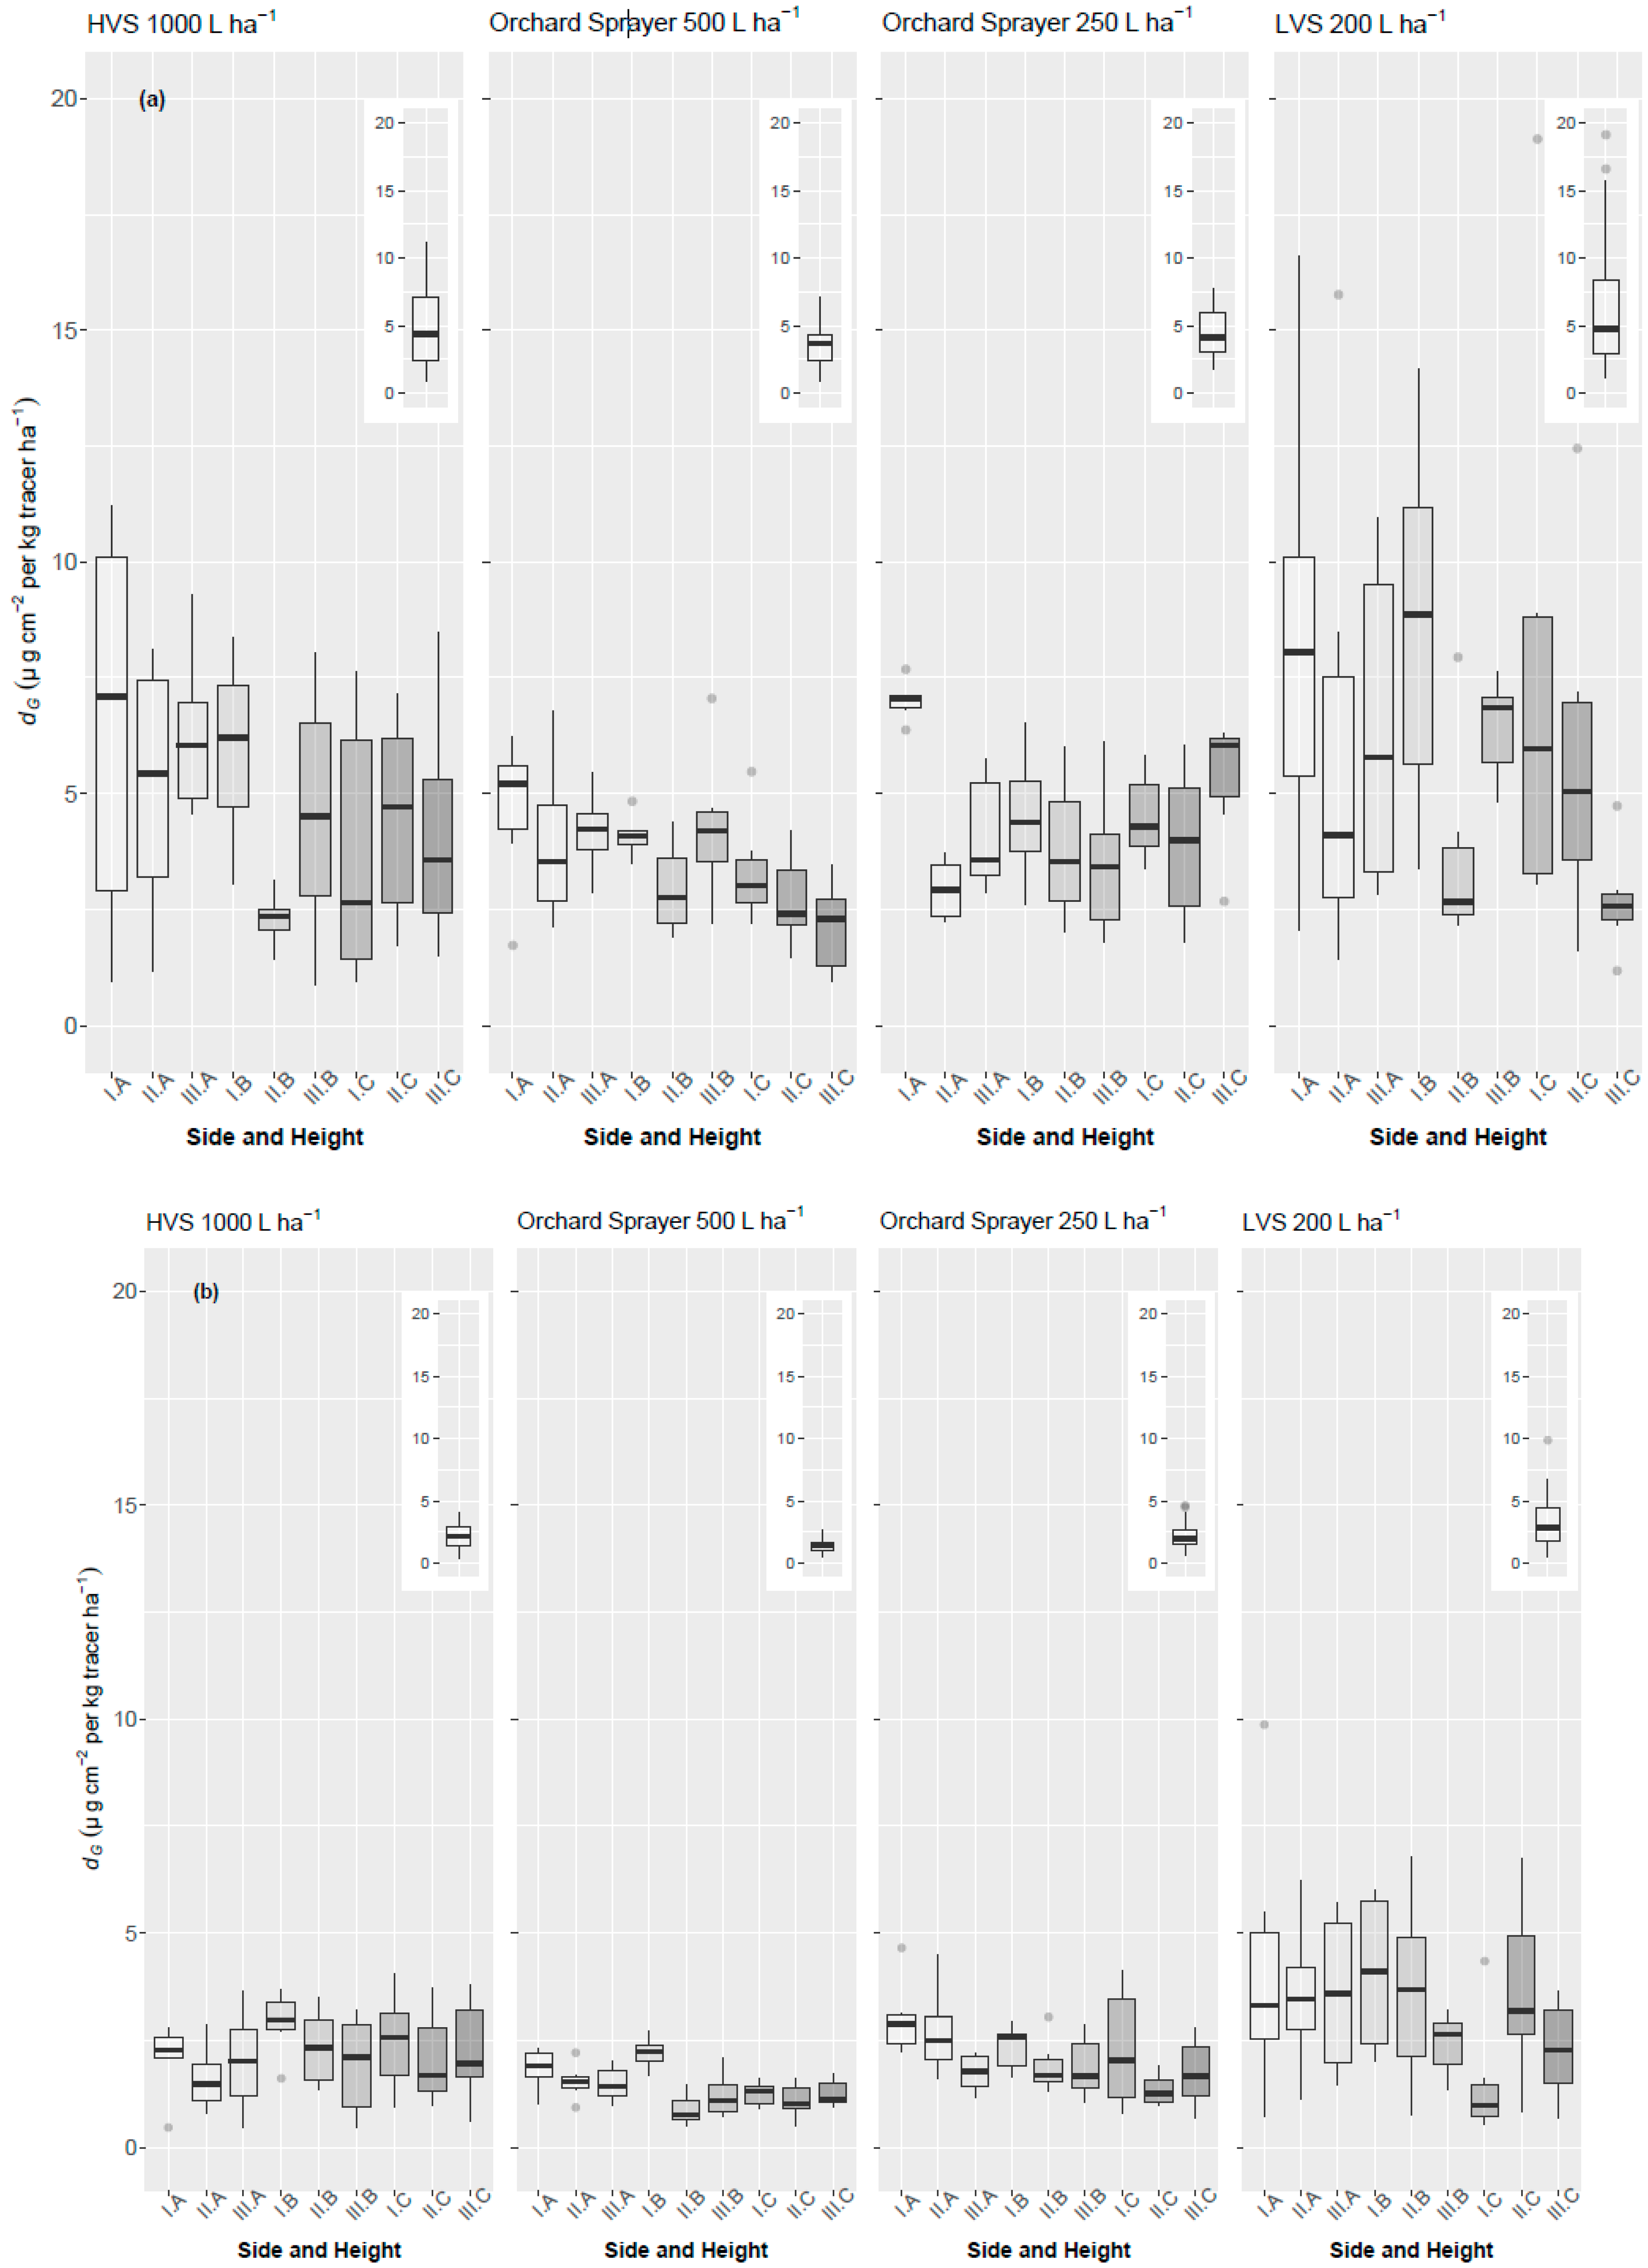
3.3. Losses to the Ground

The median dN for the trellis system’s ground losses was 32.26, 3.80, 3.62, and 1.85 for the HVS, LVS, OS500, and OS250, respectively (Figure 8 top). The dN for HVS was significantly higher than that of the other three treatments, while that for OS250 was significantly lower than the rest of the treatments (Table 5 and Figure 8 top). The median dN for the goblet system was 24.54, 3.80, 2.33, and 1.67 for the HVS, OS500, LVS, and OS250, respectively (Figure 8 top). As for the trellis system, the dN for HVS was significantly higher than that of the other three treatments, while that for OS250 was significantly lower than the rest of the treatments (Table 5 and Figure 8 top).
Normalized deposition on the ground per kg of tracer per ha (dG) and d100 were almost twice as high for the HVS than for the LVS for both the goblet and trellis training systems (Figure 8 middle and bottom, respectively). The dG and d100 values for the HVS were significantly higher than that for the other three treatments, and dG and d100 for LVS were significantly higher than that for OS250 and OS500 (Table 5, Figure 8 middle and bottom).

4. Discussion

The current work assessed the deposition on leaves and losses to the ground for four different sprayer treatments in a trellis and a goblet training system. The tracer’s tank concentration was selected using the HVS as the base level because the sprayer represents the commercial practice currently applied in vineyards in the study region.

4.1. Deposition on Leaves

In the trellis system, HVS achieved the highest median dN at 17.57 μg cm−2, followed by OS500 at 7.33, OS250 at 4.12, and LVS at 3.80 (Figure 5a). The dN for the goblet system was ca. 50% lower than that for the trellis system for all sprayers (Figure 5b). HVS resulted in the highest dN for the goblet system at 8.59 μg cm−2, which was at least three times higher than that of the other three treatments. As Manktelow et al. [37] and Michael et al. [15] found, both the leaf deposit and plant surface coverage tend to increase with increasing application volume.
However, comparing the dN among treatments provides a misleading picture of spraying efficiency because of the different volume rates used for each sprayer. The HVS applied 4 kg of tracer per ha, while the OS500, OS250, and LVS applied 2, 1, and 0.8 kg ha−1, respectively. The dG, which standardizes the leaf deposit at 1 kg of tracer per ha, decreased with increasing application volume for the air-assisted sprayers (LVS, OS250, and OS500) in both training systems (Figure 6). The median dG for the trellis system was 4.75 for the LVS, 4.39 for HVS, 4.12 for OS250, and 3.67 for OS500. The dG for the goblet system was ca. 50% that of the trellis system (Figure 6), indicating that the trellis training system results in better deposition than the goblet system. The HVS was ranked second in terms of dG in both the goblet and trellis systems. The same trend as for dG was evident when comparing d100 (Figure 7), which standardizes deposition for both volume rate (100 L per ha) and tank concentration. The median d100 for the trellis system was 2.47 for the LVS, 1.91 for HVS, 1.75 for OS250, and 1.46 for OS500. The d100 for the goblet system was ca. 50% that of the trellis system (Figure 7), suggesting that the trellis system gives higher deposition values than the goblet system. Previous authors [30,37] found that as the application volume decreases, normalized deposition increases. Lower volume rates yield savings in time and fuel consumption, as shown by Gil et al. [30] since they reduce the need for water and pesticide refilling.
Low volumes at 187 and 468 L ha−1 represent the typical range of application used in Michigan (USA) vineyards [24]. Gil et al. [30] tested a wide range of sprayers with optimal volume rates estimated by a decision support system (Dosaviña) and found that the Dosaviña rate yielded higher leaf deposits than the conventional higher volumes typically applied by farmers. Savings in the applied volume were greater than 50% in accordance with previous research [22,38,39]. Manktelow et al. [37] stated that if the chemical application rate is held constant and application volume is adjusted to canopy and sprayer effects on deposits, the highest overall deposits will be achieved at low volumes at which runoff losses are minimized. The emerging evidence shows that high volume rates increase losses, with a corresponding reduction in efficiency and a higher risk of environmental contamination. However, most pesticide labels in Cyprus and elsewhere prescribe application rates tailored to high volume sprayings, inhibiting the transition to low volume applications.
Variation in spray coverage among different vine areas is a prime factor influencing pest control success [20]. Control of diseases and pests depends on the amount of active ingredient deposited and its distribution on the target surfaces [20]. Similarly, Viret et al. [20] proposed that the incidence of fungal diseases is correlated with the amount of leaf deposit and the uniformity of its distribution on both leaf surfaces. The higher and more evenly distributed the deposit on both leaf sides, the less prevalent the disease incidence. In the current work, the highest variation in dN was observed for HVS followed by LVS and the two OS treatments (Figure 5). Within vine, dN followed a similar trend for all sprayers (Figure S1a,b), with deposition generally higher on the lower and middle than the top part of the vine. There was also a trend of higher dN on the outer sides of the vine compared to the interior part. Variation in dG, which standardizes the amount of tracer used to 1 kg per ha, was highest in LVS, followed by the HVS and the two OS treatments (Figure 6). Both the LVS and HVS rely on the operator to move the nozzle to cover the foliage, which inevitably increases deposition variation [17].
OS500, OS250, and LVS rely on air stream to achieve good coverage of the leaves. The air assistance increases the spray liquid penetration of the foliage since it creates a small amount of turbulence within the canopy [40,41] and allows better coverage of the plant surface, including the underside of leaves [15]. The advantages of air support for orchard spraying are unquestioned. Without air assistance, the spray liquid dispersion is not adequate, especially in the interior layers of the canopy, in either goblet or trellis training systems [42].
In addition to perceived effectiveness and cost, farmers select sprayers based on their ease of use. LVS operation is labor demanding since the farmer needs to carry the loaded knapsack sprayer on his back. On the other hand, LVS use requires only one person and uses very low water volumes compared to HVS. The operation of an HVS usually requires two persons, that is, the operator and a helper to carry the hose, a difficult task in mountainous viticulture. Furthermore, the HVS requires high volumes of water, which is not always readily available in mountainous areas.
The training system had an important impact on deposition. The dN was twice as high for the trellis than for the goblet training system (Figure 5 and Figure 6). In the trellis system, the foliage is spread as a continuous leaf wall, and therefore, a large amount of spray hits the foliage without drifting away. In contrast, the vines’ non-uniform and spherical shape in the goblet system seems to allow a larger amount of spray to drift away. Furthermore, the foliage in the trellis system is more exposed to the spray because of the canopy’s narrower width compared to the goblet system (0.85 and 1.05 m, respectively, Table 2). Training a grapevine accomplishes many objectives besides spray distribution, such as the exposure of leaf area to maximize the interception of light, leading to higher yield potential, optimizing the leaf area to fruit ratio, higher quality, and better disease control. Additionally, trellised systems facilitate the movement of equipment through the vineyard and, in general, facilitate mechanization of vineyard operations [43]. Different training systems in vineyards exist, and the criteria for the choice of the proper one depend substantially on the target ratio of leaf to fruit [44].

4.2. Losses to the Ground

The losses to the ground (dN) were much higher for the HVS followed by OS500, LVS, and OS250, which were at a similar level (Figure 8). This indicates that the volume of 1000 L ha−1 appears to cause an excessive runoff to the ground. Normalized deposition, dG and d100, again point out that the HVS resulted in higher losses to the ground in both training systems, with LVS ranked second (Figure 8). LVS losses were half that of the HVS, showing that the former represents a more environmentally friendly approach regarding the pollution and waste of chemicals, especially in mountainous viticulture areas. Losses to the ground were higher in the trellis training system for the HVS and LVS than the goblet training system (Figure 8). It is possible that the spherical canopy of the goblet system intercepted less of the spray liquid as shown by the leaf deposit amounts, and therefore, resulted in lower losses to the ground. Additionally, the differences might be a consequence of the placement of the spray collectors under the canopy. Adding collectors between rows can give a more representative picture of spray losses. OS250 resulted in the lowest dN for losses to the ground among all sprayers, while the dG was similar between OS250 and OS500. In general, losses to the ground were at similar levels for both training systems (Figure 8).

5. Conclusions

The current work assessed the deposition on leaves and losses to the ground for four different spraying treatments in a trellis and a goblet training system. Although normalized tracer deposit (dN) was higher at higher volumes, standardizing the amount of spray used per ha−1 (dG) showed a trend of increasing normalized deposition with decreasing volume rate, especially for the three air-assisted treatments. The normalized leaf deposit for the high-volume treatment of 1000 L ha−1 was between that for the 200 and 250 L ha−1 treatments, showing the potential of low volume applications to replace high volume pesticide sprayings. The high-volume sprayer resulted in the highest normalized deposit on the ground (Figure 8), suggesting that runoff is excessive compared to the other types of sprayers. Furthermore, volume reduction results in savings of time and fuel consumption, as shown by Gil et al. [30], as more area is covered with one refill reducing the time needed for water and pesticide refilling.
The training system had an important impact on leaf deposit. We note that dN was twice as high for the trellis than for the goblet training system (Figure 5), possibly because of the vines’ spherical shape in the goblet system, in contrast to the trellis where the foliage is spread as a continuous wall. In addition, the narrower width of the trellised systems facilitates the penetration of the spray liquid.
In conclusion, the current work demonstrates the potential of low volume applications in mountainous viticulture for reducing the environmental and financial costs of pest control. Low volume applications need to be an integral part of EU policies for sustainable pest management. Future work needs to focus on assessing the drift potential of different spray technologies. In addition, follow-up studies must assess the effectiveness of low volume sprayings against vine pests and diseases.

Supplementary Materials

The following are available online at https://www.mdpi.com/2077-0472/10/12/615/s1, Figure S1: Normalized deposition (dN) on (a) different heights of vines (A-lower—see Figure 3 for details) and (b) different sides (II—interior part of the vine) for the goblet and the trellis training systems. Boxplots show the median for each treatment, box boundaries show the 25th and 50th percentile, while whiskers extend to 1.5 times the interquartile range (IQR). Points beyond 1.5 times the IQR are plotted individually. See text for results of statistical analyses.

Author Contributions

Conceptualization, C.M., E.G., and M.C.S.; Data curation, C.M.; Formal analysis, M.C.S.; Funding acquisition, E.G.; Investigation, C.M.; Methodology, C.M.; Project administration, M.C.S.; Resources, M.C.S.; Supervision, E.G. and M.C.S.; Validation, C.M. and M.C.S.; Visualization, C.M.; Writing—original draft, C.M.; Writing—review & editing, E.G., M.G., and M.C.S. All authors have read and agreed to the published version of the manuscript.

Funding

This research received no external funding.

Acknowledgments

We acknowledge the support of the vine grower Christos Christou, who willingly accepted the trial’s implementation in his vineyards. Special thanks to the Cyprus Crop Protection Association (CCPA) and its Director Andreas Krambias, for its valuable assistance and guidance during the study.

Conflicts of Interest

The authors declare no conflict of interest

References

  1. Directive 2009/128/EC of the European Parliament and of the Council of 21 October 2009 Establishing a Framework for Community Action to Achieve the Sustainable Use of Pesticides. OJ L 309. 24 November 2009, pp. 71–86. Available online: https://eur-lex.europa.eu/legal-content/EN/ALL/?uri=celex%3A32009L0128 (accessed on 15 October 2018).
  2. BTSF. Available online: https://ec.europa.eu/chafea/food/index_en.htm (accessed on 30 July 2019).
  3. Matthews, G.; Bateman, R.; Miller, P. Pesticide Application Methods, 4th ed.; Wiley & Blackwell: Hoboken, NJ, USA, 2014. [Google Scholar]
  4. Balsari, P.; Gil, E.; Marucco, P.; van de Zande, J.C.; Nuyttens, D.; Herbst, A.; Gallart, M. Field-crop-sprayer potential drift measured using test bench: Effects of boom height and nozzle type. Biosyst. Eng. 2017, 154, 3–13. [Google Scholar] [CrossRef] [Green Version]
  5. Lefrancq, M.; Payraudeau, S.; Verdú, A.J.G.; Maillard, E.; Millet, M.; Imfeld, G. Fungicides transport in runoff from vineyard plot and catchment: Contribution of non-target areas. ESPR 2014, 21, 4871–4882. [Google Scholar] [CrossRef] [PubMed]
  6. Cross, J.V.; Walklate, P.J.; Murray, R.A.; Richardson, G.M. Spray deposits and losses in different sized apple trees from an axial fan orchard sprayer: 1. Effects of spray liquid flow rate. Crop Prot. 2001, 20, 13–30. [Google Scholar] [CrossRef]
  7. Miranda-Fuentes, A.; Llorens, J.; Rodríguez-Lizana, A.; Cuenca, A.; Gil, E.; Blanco-Roldán, G.L.; Gil-Ribes, J.A. Assessing the optimal liquid volume to be sprayed on isolated olive trees according to their canopy volumes. Sci. Total Environ. 2016, 568, 296–305. [Google Scholar] [CrossRef]
  8. Arvidsson, T.; Bergström, L.; Kreuger, J. Spray drift as influenced by meteorological and technical factors. Pest Manag. Sci. 2011, 67, 586–598. [Google Scholar] [CrossRef]
  9. Gil, E.; Llorens, J.; Llop, J.; Fàbregas, X.; Gallart, M. Use of a terrestrial LIDAR sensor for drift detection in vineyard spraying. Sensors 2013, 13, 516–534. [Google Scholar] [CrossRef] [Green Version]
  10. Gregorio, E.; Rosell-Polo, J.R.; Sanz, R.; Rocadenbosch, F.; Solanelles, F.; Garcerá, C.; Chueca, P.; Arnó, J.; del Moral, I.; Masip, J.; et al. LIDAR as an alternative to passive collectors to measure pesticide spray drift. Atmosp. Environ. 2014, 82, 83–93. [Google Scholar] [CrossRef] [Green Version]
  11. Nuyttens, D.; De Schampheleire, M.; Verboven, P.; Sonck, B. Comparison between indirect and direct spray drift assessment methods. Biosyst. Eng. 2010, 105, 2–12. [Google Scholar] [CrossRef]
  12. Landers, A.J. Developments towards an Automatic Precision Sprayer for Fruit Crop Canopies. In Proceedings of the ASABE Annual International Meeting, Pittsburg, PA, USA, 20–23 June 2010. [Google Scholar] [CrossRef]
  13. Pertot, I.; Caffi, T.; Rossi, V.; Mugnai, L.; Hoffmann, C.; Grando, M.S.; Gary, C.; Lafond, D.; Duso, C.; Thiery, D.; et al. A critical review of plant protection tools for reducing pesticide use on grapevine and new perspectives for the implementation of IPM in viticulture. Crop Prot. 2017, 97, 70–84. [Google Scholar] [CrossRef]
  14. OIV-International Organization of Vine and Wine 2018; OIV Statistical Report on World Vitiviniculture; World Vitiviniculture: Paris, France, 2018.
  15. Michael, C.; Gil, E.; Gallart, M.; Kanetis, L.; Stavirinides, M.C. Evaluating the effectiveness of low volume spray application using air-assisted knapsack sprayers in wine vineyards. Int. J. Pest Manag. 2020. [Google Scholar] [CrossRef]
  16. Pergher, G.; Gubiani, R.; Tonetto, G. Foliar deposition and pesticide losses from three air-assisted sprayers in a hedgerow vineyard. Crop Prot. 1997, 16, 25–33. [Google Scholar] [CrossRef]
  17. Koch, H. How to achieve conformity with the dose expression and sprayer function in high crops. Bayer Cropsci. J. 2007, 60, 71–84. [Google Scholar]
  18. Pivato, A.; Barausse, A.; Zecchinato, F.; Palmeri, L.; Raga, R.; Lavagnolo, M.C.; Cossu, R. An integrated model-based approach to the risk assessment of pesticide drift from vineyards. Atmos. Environ. 2015, 111, 136–150. [Google Scholar] [CrossRef]
  19. Miranda-Fuentes, A.; Rodríguez-Lizana, A.; Gil, E.; Agüera-Vega, J.; Gil-Ribes, J.A. Influence of liquid-volume and airflow rates on spray application quality and homogeneity in super-intensive olive tree canopies. Sci. Total Environ. 2015, 537, 250–259. [Google Scholar] [CrossRef] [PubMed]
  20. Viret, O.; Siegfried, W.; Holliger, E.; Raisigl, U. Comparison of spray deposits and efficacy against powdery mildew of aerial and ground-based spraying equipment in viticulture. Crop Prot. 2003, 22, 1023–1032. [Google Scholar] [CrossRef]
  21. Baldoin, C.; Zanche, C.; De, B.D. Field testing of a prototype recycling sprayer in a vineyard: Spray distribution and loss. Agric. Eng. Int. CIGR J. 2008, X, 1–10. [Google Scholar]
  22. Gil, E.; Escola, A.; Rosell, J.R.; Planas, S.; Val, L. Variable rate application of plant protection products in vineyard using ultrasonic sensors. Crop Prot. 2007, 26, 1287–1297. [Google Scholar] [CrossRef] [Green Version]
  23. Sarri, D.; Martelloni, L.; Rimediotti, M.; Lisci, R.; Lombardo, S.; Vieri, M. Testing a multi-rotor unmanned aerial vehicle for spray application in high slope terraced vineyard. J. Agric. Eng. 2019, 50, 38–47. [Google Scholar] [CrossRef]
  24. Wise, J.C.; Jenkins, P.E.; Schilder, A.M.C.; Vandervoort, C.; Isaacs, R. Sprayer type and water volume influence pesticide deposition and control of insect pests and diseases in juice grapes. Crop Prot. 2010, 29, 378–385. [Google Scholar] [CrossRef]
  25. Naud, O.; Verges, A.; Herbard, O.; Codis, S.; Douzals, J.-P.; Ruelle, B. Comparative assessment of agro-environmental perfor-mance of vineyard sprayers using a physical full scale model of a vineyard row. In Proceedings of the AgEng 2014, Zurich, Switzerland, 6–10 July 2014. [Google Scholar] [CrossRef]
  26. Pergher, G. Recovery rate of tracer dyes used for spray deposit assessment. Trans. ASAE 2001, 44, 787. [Google Scholar] [CrossRef]
  27. TOPPS. Available online: http://www.topps-life.org/topps-prowadis-project.html (accessed on 29 October 2019).
  28. Rasband, W.S. ImageJ, U.S. National Institutes of Health, Bethesda, MD, USA, 1997–2008. Available online: https://imagej.nih.gov/ij/ (accessed on 16 October 2018).
  29. Llorens, J.; Gil, E.; Llop, J.; Escola, A. Variable rate dosing in precision viticulture: Use of electronic devices to improve application efficiency. Crop Prot. 2010, 29, 239–248. [Google Scholar] [CrossRef] [Green Version]
  30. Gil, E.; Llorens, J.; Landers, A.; Llop, J.; Giralt, L. Field validation of DOSAVIÑA, a decision support system to determine the optimal volume rate for pesticide application in vineyards. Eur. J. Agron. 2011, 35, 33–46. [Google Scholar] [CrossRef]
  31. Salcedo, R.; Llop, J.; Campos, J.; Michael, C.; Gallart, M.; Ortega, P.; Gil, E. Evaluation of leaf deposit quality between electrostatic and conventional multi-row sprayers in a trellised vineyard. Crop Prot. 2020, 127, 104964. [Google Scholar] [CrossRef]
  32. Codis, S.; Carra, M.; Delpuech, X.; Montegano, P.; Nicot, H.; Ruelle, B.; Ribeyrolles, X.; Savajols, B.; Vergès, A.; Naud, O. Dataset of spray deposit distribution in vine canopy for two contrasted performance sprayers during a vegetative cycle associated with crop indicators (LWA and TRV). Data Brief. 2018, 18, 415–421. [Google Scholar] [CrossRef]
  33. R Core Team. R: A Language and Environment for Statistical Computing; R Foundation for Statistical Computing: Vienna, Austria, 2019; Available online: https://www.R-project.org/ (accessed on 16 October 2020).
  34. Wickham, H. ggplot2: Elegant Graphics for Data Analysis; Springer: New York, NY, USA, 2016; Available online: https://ggplot2.tidyverse.org (accessed on 16 October 2020)ISBN 978-3-319-24277-4.
  35. Bates, D.; Maechler, M.; Bolker, B.; Walker, S. Fitting linear mixed-effects models using lme4. J. Stat. Softw. 2015, 67, 1–48. [Google Scholar] [CrossRef]
  36. Kuznetsova, A.; Brockhoff, P.B.; Christensen, R.H.B. lmerTest Package: Tests in Linear Mixed Effects Models. J. Stat. Softw. 2017, 8, 1–26. [Google Scholar] [CrossRef] [Green Version]
  37. Manktelow, D.W.; Gurnsey, S.J.; MacGregor, A.M. Deposit variability and prediction in fruit crops: What use are label rates anyway? Asp. Appl. Biol. 2004, 71, 269–278. [Google Scholar]
  38. Solanelles, F.; Escola, A.; Planas, S.; Rosell, J.R.; Camp, F.; Gracia, F. An electronic control system for pesticide application proportional to the canopy width of tree crops. Biosyst. Eng. 2006, 95, 473–481. [Google Scholar] [CrossRef] [Green Version]
  39. Molto, E.; Martin, B.; Gutierrez, A. Design and testing of an automatic machine for spraying at a constant distance from the tree canopy. J. Agric. Eng. Res. 2000, 77, 379–384. [Google Scholar] [CrossRef]
  40. Landers, A. Improving spray deposition and reducing drift—Air flow adjustment is the answer. N. Y. Fruit Q. 2011, 19, 1–6. [Google Scholar]
  41. Pergher, G.; Petris, R. The effect of air flow rate on spray deposition in a guyot-trained vineyard. Agric. Eng. Int. CIGR J. 2008. [Google Scholar] [CrossRef]
  42. Pergher, G.; Gubiani, R. The effect of spray application rate and airflow rate on foliar deposition in a hedgerow vineyard. J. Agric. Eng. Res. 1995, 61, 205–216. [Google Scholar] [CrossRef]
  43. Reynolds, A.G.; Heuvel, J.E.V. Influence of grapevine training systems on vine growth and fruit composition: A review. Am. J. Enol. Vitic. 2009, 60, 251–268. [Google Scholar]
  44. Deloire, A. A few thoughts on grapevine training systems. Wineland Mag. 2012, 274, 82–86. [Google Scholar]
Figure 1. Sprayers tested: (a) HVS with a spray gun (b) LVS (Motorized knapsack sprayer) (c) OS (Axial fan orchard sprayer).
Agriculture 10 00615 g001
Figure 2. Experimental design. Red circles show sampling vines.
Agriculture 10 00615 g002
Figure 3. Leaf sampling positions for (a) Trellis trained vines and (b) Goblet trained vines. Leaves were taken from three heights (A–C) and three sides (I–III), resulting in nine leaf samples per vine.
Agriculture 10 00615 g003
Figure 4. Relationship between leaf area and leaf weight for leaves collected from Xynisteri vines trained as either goblet or trellis. See text for results of statistical analyses.
Agriculture 10 00615 g004
Figure 5. Normalized deposition (dN) for different sides (II—interior part of the vine) and heights (A-lower—see Figure 3 for details) of vines for (a) the trellis and (b) the goblet training system. The insets show dN values for all leaves in each sprayer treatment (note the different scale for the HVS inset). Boxplots show the median for each treatment, box boundaries show the 25th and 50th percentile, while whiskers extend to 1.5 times the interquartile range (IQR). Points beyond 1.5 times the IQR are plotted individually. See text for results of statistical analyses.
Agriculture 10 00615 g005
Figure 6. Normalized deposition (dG) per kg of tracer per ha (μg cm−2 per kg of tracer per ha) for different sides (II—interior part of the vine) and heights (A-lower—see Figure 3 for details) of the vines for (a) the trellis and (b) the goblet training system. The insets show dG values for all leaves in each sprayer treatment. Boxplots show the median for each treatment, box boundaries show the 25th and 50th percentile, while whiskers extend to 1.5 times the interquartile range (IQR). Points beyond 1.5 times the IQR are plotted individually. See text for results of statistical analyses.
Agriculture 10 00615 g006
Figure 7. Normalized deposition (μg cm−2) per 100 L of spray liquid per ha (d100) for the four different sprayers for the goblet and trellis training systems. Boxplots show the median for each treatment, box boundaries show the 25th and 50th percentile, while whiskers extend to 1.5 times the interquartile range (IQR). Points beyond 1.5 times the IQR are plotted individually.
Agriculture 10 00615 g007
Figure 8. Deposition on the ground for the four sprayer treatments. Normalized deposition (dN—μg cm−2) [top], normalized deposition (dG) per kg of tracer per ha (μg cm−2 per kg of tracer per ha) [middle] and normalized deposition per 100 L of spray liquid per ha (d100—μg cm−2 per 100 L ha−1) [bottom] for the four different sprayers for the goblet and trellis training systems. Boxplots show the median for each treatment, box boundaries show the 25th and 50th percentile, while whiskers extend to 1.5 times the interquartile range (IQR). Points beyond 1.5 times the IQR are plotted individually. See text for results of statistical analyses. Note the different scales for the three graphs.
Agriculture 10 00615 g008
Table 1. Forward speed (km h−1), actual volume rate (L ha−1), flow rate (L min−1) and number of nozzles for the four different treatments.
Treatment—Nominal Volume Rate (VR)Forward Speed
(km h−1)
Actual Volume Rate
(L ha−1)
Flow Rate
(L min−1)
Number of Nozzles
HVS (High Volume Sprayer—1000 L ha−1)1.5107710.001
OS500 (Orchard Sprayer—500 L ha−1)4.052412.966
OS250 (Orchard Sprayer 250 L ha−1)4.02837.006
LVS (Low Volume Sprayer—200 L ha−1)1.51881.751
Table 2. Canopy characterization parameters for the two training systems where the trials took place at BBCH 79.
VineyardRow Distance (m)Distance Between Plants (m)Canopy Height (m)Canopy Width (m)LAI
Trellis system2.251.651.180.852.21
Goblet system2.251.650.981.051.00
Table 3. Results of the linear mixed-effects model for the effect of the sprayer, side, and height on dN on leaves for the trellis and goblet training systems.
Fixed EffectsdfF-Valuep-ValueF-Valuep-Value
TrellisGoblet
Sprayer3, 2058.170.0263.32<0.001
Side2, 1608.96<0.0013.710.03
Height2, 1605.740.0045.050.01
Sprayer: Side6, 1600.720.631.620.15
Sprayer: Height6, 1601.320.251.990.07
Side: Height4, 1602.310.062.120.08
Sprayer: Side: Height12, 1601.740.061.060.40
Random Effect Vine0.1140.102
(standard deviation)Residual0.5100.503
Table 4. The linear mixed-effects model results for the effect of sprayer, side and height on dG or d100 on leaves for the trellis and goblet training systems. The analysis for d100 is equivalent to that for dG as the two parameters differ only by a divisor of 2.5 (see Equations (3) and (4)).
Fixed EffectsdfF-Valuep-ValueF-Valuep-Value
TrellisGoblet
Sprayer3, 204.170.0211.95<0.001
Side2, 1608.96<0.0013.700.03
Height2, 1605.740.0045.050.01
Sprayer: Side6, 1600.720.631.610.15
Sprayer: Height6, 1601.320.251.990.07
Side: Height4, 1602.310.062.110.08
Sprayer: Side: Height12, 1601.740.061.060.40
Random Effect Vine0.1140.102
(standard deviation)Residual0.5100.503
Table 5. The linear mixed effects model results for the effect of the sprayer on dN and dG or d100 on ground losses for the trellis and goblet training systems. The analysis for d100 is equivalent to that for dG as the two parameters differ only by a divisor of 2.5 (see Equations (3) and (4)).
dfF-Valuep-ValueF-Valuep-Value
TrellisGoblet
dN (Fixed effect)
Sprayer3, 20253.79<0.00179.641<0.001
Random effect Vine id0.1430.298
(standard deviation)Residual0.1920.216
dG or d100
Sprayer (Fixed effect)3, 2092.28<0.00121.41<0.001
Random effect Vine id0.1430.298
(standard deviation)Residual0.1920.216
Publisher’s Note: MDPI stays neutral with regard to jurisdictional claims in published maps and institutional affiliations.

