Article

Climate Change Impacts Assessment on Wine-Growing Bioclimatic Transition Areas

by
Alba Piña-Rey
1,
Estefanía González-Fernández
1,
María Fernández-González
1,*,
Mª. Nieves Lorenzo
2 and
Fco. Javier Rodríguez-Rajo
1
1
CITACA, Agri-Food Research and Transfer Cluster, University of Vigo, 32002 Ourense, Spain
2
Department of Applied Physics, EPhysLab, Universidade de Vigo, Campus As Lagoas s/n, 36310 Ourense, Spain
*
Author to whom correspondence should be addressed.
Agriculture 2020, 10(12), 605; https://doi.org/10.3390/agriculture10120605
Submission received: 18 October 2020 / Revised: 8 November 2020 / Accepted: 1 December 2020 / Published: 7 December 2020
(This article belongs to the Special Issue Sustainable Agriculture and Viticulture)

Abstract

:
Viticultural climatic indices were assessed for the evaluation of the meteorological variations in the requirements of wine cultivars. The applied bioclimatic indices have been widely used to provide an initial evaluation of climate change impacts on grapevine and to delineate wine regions and suitable areas for planting around the world. The study was carried out over a period of 16 years (from 2000 to 2015) in five Designation of Origin areas in Northwestern Spain located in the Eurosiberian region, the transition zone between the Eurosiberian and the Mediterranean areas, and in the Mediterranean area. In addition, the high-resolution meteorological dataset “Spain02” was applied to the bioclimatic indices for the period 1950–2095. To further assess the performance of “Spain02”, Taylor diagrams were elaborated for the different bioclimatic indices. A significant trend to an increase of the Winkler, Huglin, Night Cold Index and GSS Indices was detected in the North-western Spain, whereas slight negative trends for BBLI and GSP Indices were observed. To analyze future projections 2061–2095, data from the high-resolution dynamically downscaled daily climate simulations from EURO-CORDEX project were used. To further assess the performance of Spain02, Taylor diagrams were elaborated for the different bioclimatic indices. A trend to an increase of the Winkler, Huglin, Night Cold Index and GSP Indices was detected in Northwestern Spain, whereas slight negative trends for BBLI and GSP Indices were observed. Our results showed that climatic conditions in the study region could variate for the crop in the future, more for Mediterranean than Eurosiberian bioclimatic area. Due to an advance in the phenological events or the vintage data, more alcohol-fortified wines and variations in the acidity level of wines could be expected in Northwestern Spain, these processes being most noticeable in the Mediterranean area. The projections for the BBLI and GSP Indices will induce a decrease in the pressure of the mildew attacks incidence in the areas located at the Eurosiberian region and the nearest transition zones. Projections showed if the trend of temperature increase continues, some cultural practice variations should be conducted in order to preserve the grape cultivation suitability in the studied area.

Graphical Abstract

1. Introduction

The potential economic and social impacts that climate change can effect have been the subject of growing concern in recent decades [1]. Modifications in the evolution of several meteorological parameters would lead to changes in the distribution of vegetation, since solar radiation, water and temperature are factors controlling plant growth and reproduction [2]. The use of the vine as an effective climate change indicator is justified by the high sensitivity of this crop to climate variations, which could prompt serious consequences and significant economic damage on the wine sector [3,4]. The response to changing environmental conditions is particularly notable in vineyards Europe and North America [1,3,4]. Spain is one of the most important wine producing countries, mainly due to its favorable climate and soil conditions. Climate change would significantly affect the viability of vine cultivation, varying the production and quality of the wine with different incidence depending on the region [1,5]. Future climate scenarios predict that Northern European regions will become areas suitable for viticulture, while Southern regions would be too hot [1,6,7]. Several studies analyzed the impact of climate change on wine production around the world. Most of them used a large number of available climatic parameters, temperature being the most important [6,8,9]. Hall and Jones [9] found that the quality of the wines produced and the length of growth stages in Australian vineyards were affected by climatic change. Jones et al. [10] compared European wine regions with others around the world, considering topographic characteristics, and they found that climate change can negatively or positively affect the world’s vineyards [1].
Expected climatic changes, such as the increase in the frequency of extreme meteorological and hydrological phenomena, will alter the usual conditions of vine growing [11,12,13]. The trend of an increasing temperature observed during the 1990–2000 decade is expected to continue in the coming decades [14]. Air temperature is a key factor for the composition, color and aroma acquisition of berries [15,16]. Parker et al. [17] showed that a temperature-based model can be used to predict the date of the optimal sugar concentrations for different cultivars. In addition, the anthocyanin-sugar balance is altered by high temperatures, which can cause problems in the color and structure of tannins [18]. Otherwise, excessive cold temperatures can inhibit the formation of sugar and anthocyanins due to a delayed development of the berries [19], which reduces the quality of the wine [20,21,22]. The opposite behavior to this late development due to colder temperatures was also found by Webb et al. [23]: an early grape ripening caused by unusual warm weather conditions during the growing season. This fact implies significant impacts on the flavor and composition of the grapes, since a rapid development due to high temperatures causes sugar accumulation and acid deficits [24,25], which results in unbalanced wines with high alcohol content [26].
Several Viticultural Climatic Indices (VCI) have been developed with the aim to relate the requirements of the cultivars with climatic conditions. The integrating of temperature as a main variable for the construction of simple or complex indices allowed us to define the suitability of a cultivar, the phenology of the grapevine, the possible environmental risks or the potential styles of wine [27]. These indices have been widely used throughout the world to assess the effects of climate change and determine possible new land areas suitable for viticulture [28,29,30,31,32,33]. Most of these calculations are obtained from temperature statistics during the growing season, using daily or monthly temperature data [34,35,36]. However, some indices also consider other environmental variables, such as soil moisture [37], rainfall [38], or the degree-days during the growing season that establish the requirements of the cultivar to achieve adequate maturation [5]. Many indices are based on the Growing Degree Days (GDD), such as the Growing Season Temperature (GST) [29,37,39,40,41,42,43] or the Biological Effective Degree Days (BEDD) [8]. Variations in wine quality are also determined by the worldwide climate regime, but knowledge about climatic variables at a microscale (mainly temperature), is important for winegrowers [44]. Fine-scale models are essential for linking global and regional models of climate change [44].
The aim of this work was to assess the variations of important bioclimatic indices, taking into account the interactions between the climatic requirements of the grape and its cultivation cycle in recognized Designation of Origin (DO) wine-growing areas of Northwestern Spain, located in two bioclimatic areas, Mediterranean and Eurosiberian. Future scenarios of climate change applying the EUROCORDEX project were assessed to track the consequences of climate change for future grape cultivation in both bioclimatic areas.

2. Materials and Methods

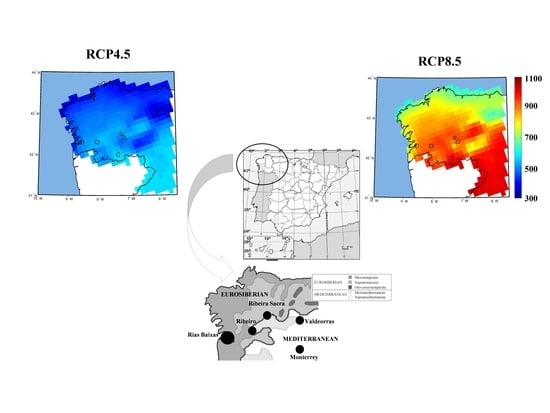
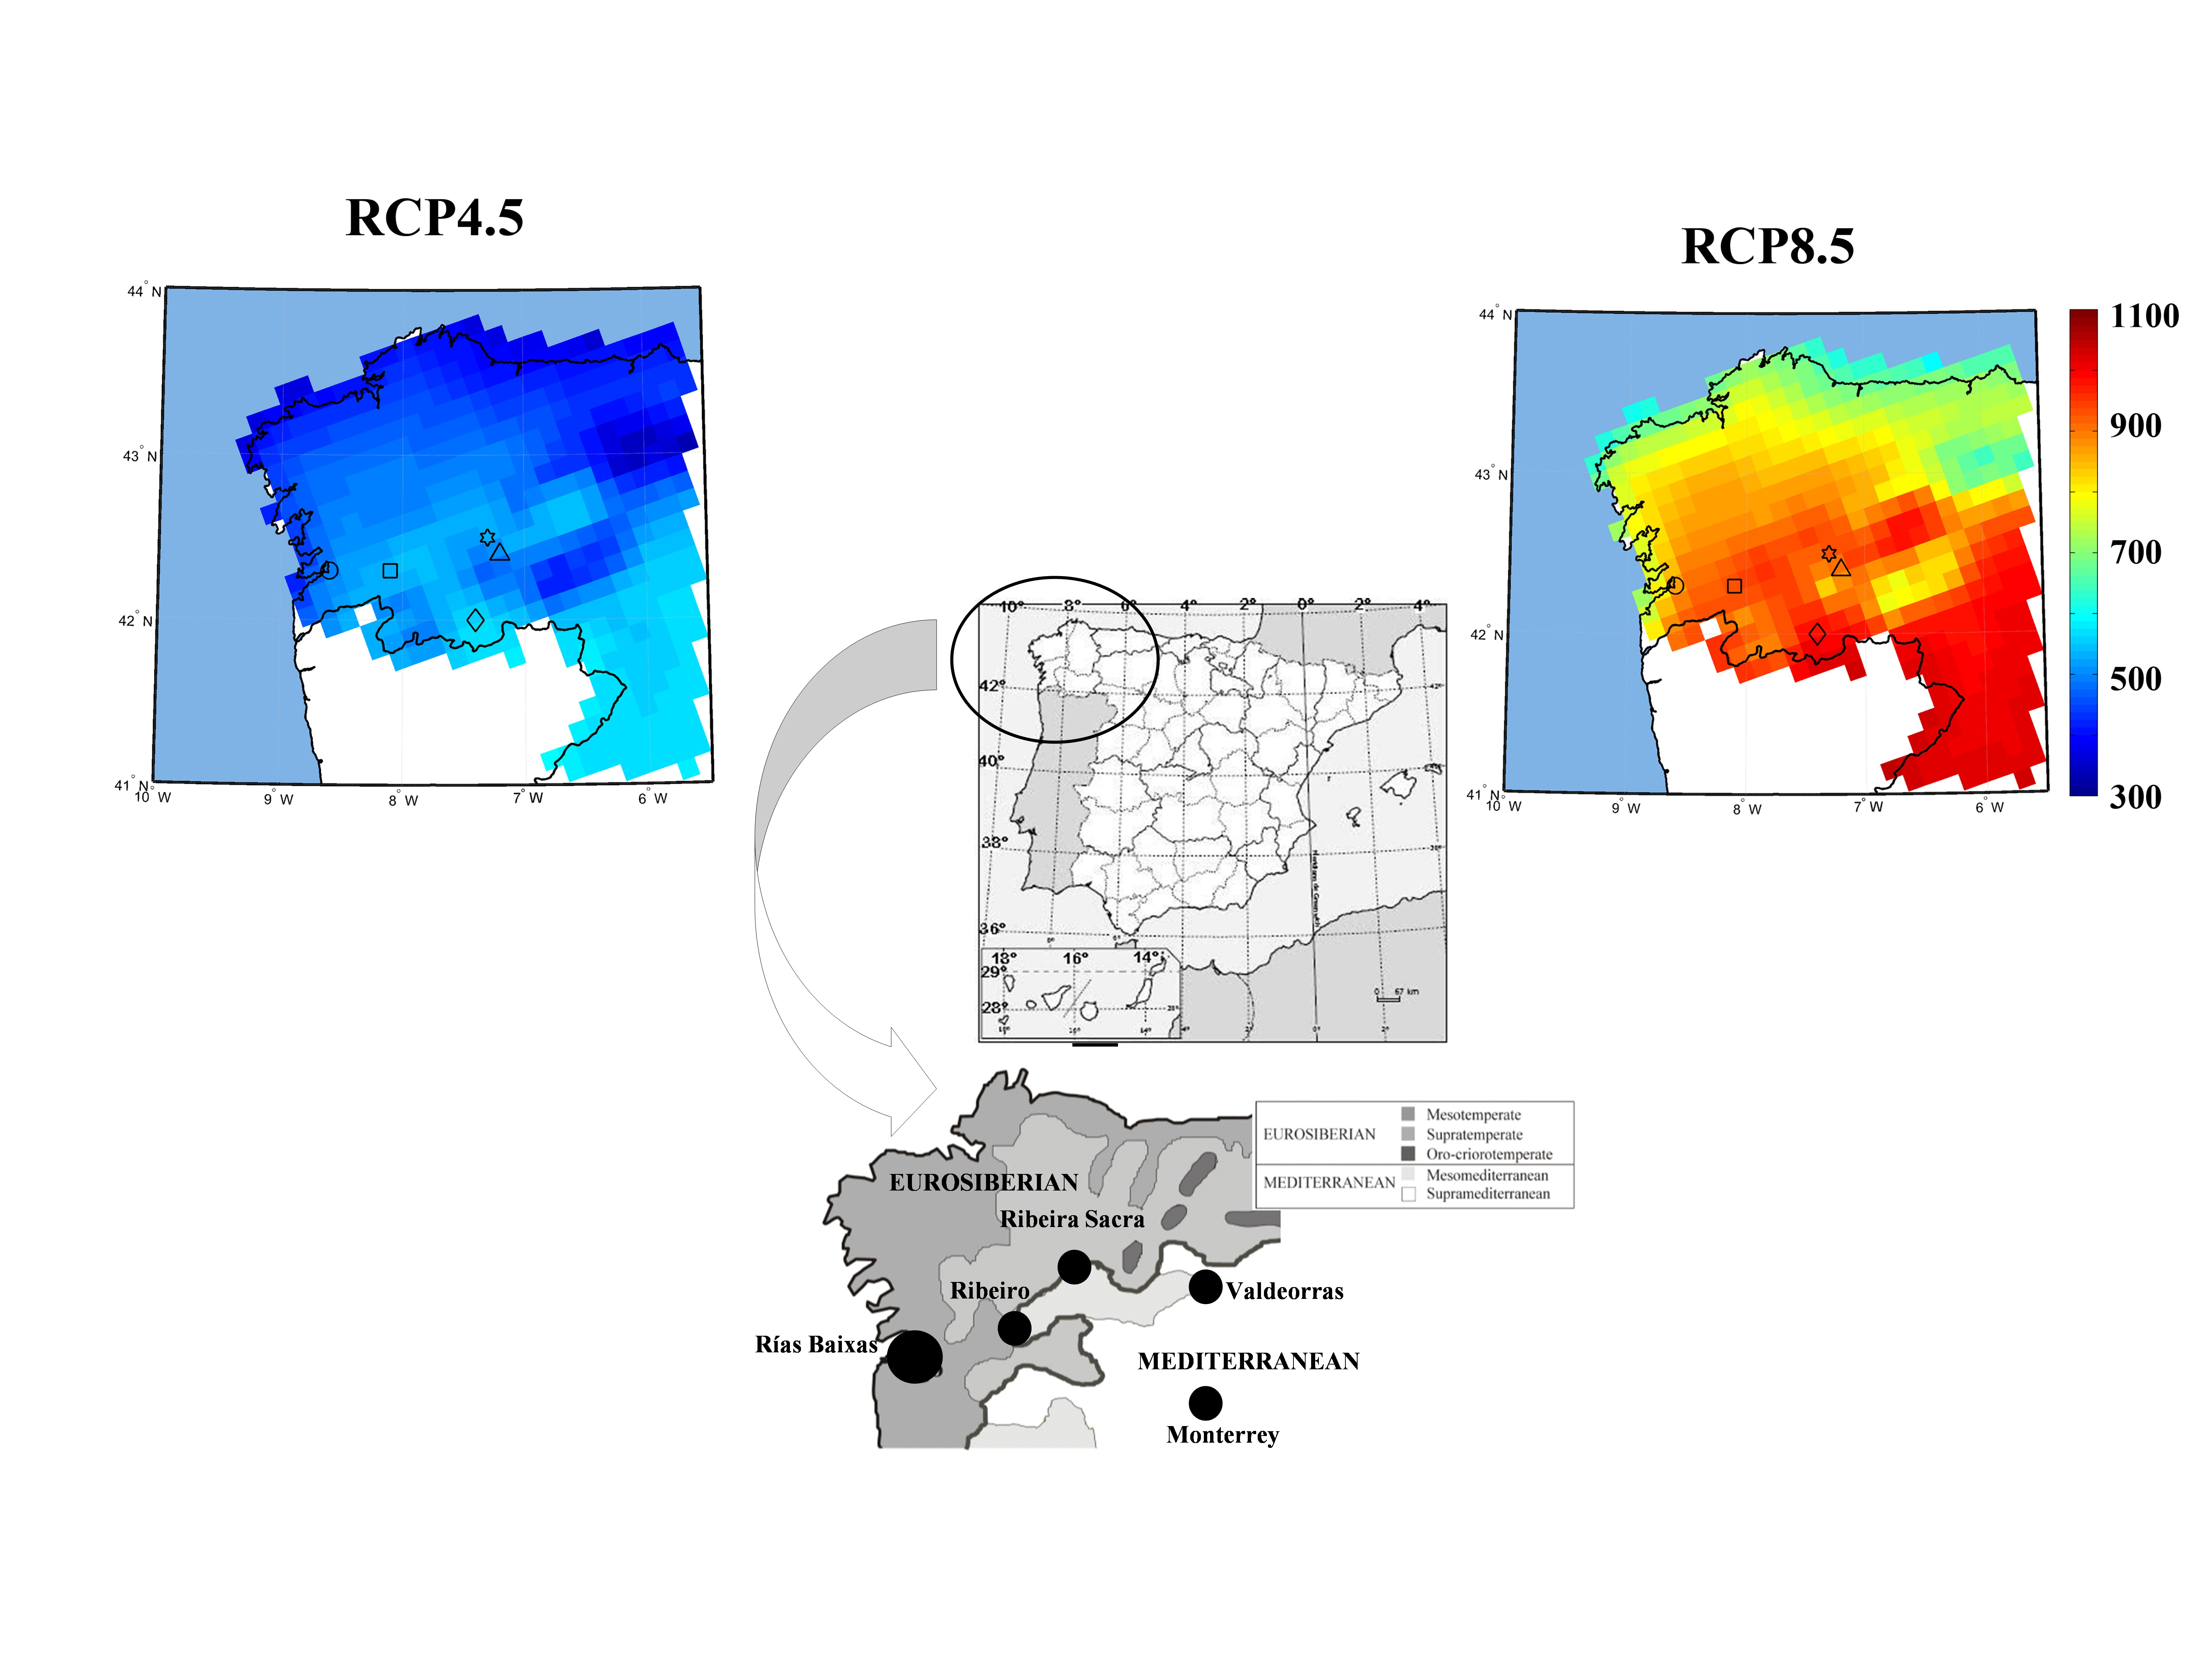
2.1. Period of Study and Area

The study was carried out over a period of 15 years (from 2000 to 2015) in five DO areas in Northwestern Spain. DO Rías Baixas is located in the Eurosiberian region, DOs Ribeiro and Ribeira Sacra in the transition zone between the Eurosiberian and the Mediterranean areas and DOs Valdeorras and Monterrei in the Mediterranean area (Figure 1). In addition, the high-resolution meteorological dataset “Spain02” [45] was used for the bioclimatic indexes calculation during the period 1950–2015.
The main characteristics of the designation origin areas were shown in Table 1. The DO Rías Baixas is located in the Eurosiberian bioclimatic region and covers the province of Pontevedra and a small part in the province of A Coruña. The DO is placed near to the sea which determines an Atlantic climate [44]. The DO Ribeiro wine-growing region is located in Ourense and characterized by fairly steep valleys and hillsides. The soils are of granitic origin, with an important presence of stones and gravel, sandy texture and an average depth at 70 to 100 cm [46,47]. The Ribeira Sacra DO is located on the banks of the Miño and Sil rivers, south of the province of Lugo and north of the province of Ourense. The Valdeorras DO is located at the East of the province of Ourense with a Mediterranean-Oceanic climate with Atlantic influence. The DO Monterrei in the east of the Ourense province has a temperate Mediterranean climate with a continental trend with dry and hot summers of up to 35 °C and cold winters below −5 °C [48].

2.2. Bioclimatic Indices

Several bioclimatic indices were applied throughout the years of study to describe the suitability of the different viticultural areas (Table 2).
The applied bioclimatic indices are commonly used to assess the impacts of climate change on viticulture [9,28,30,31,32,33,49]: Winkler Index (WI, [50]), Huglin Index (HI, [35]), Cool Night Index (CI, [51]), Growing Season Suitability (GSS, [31,52]), Hydrothermic Index of Branas, Bernon and Levadoux (BBLI, [53]) and Growing Season Precipitation Index (GSP, 40). The first four indices are related to temperature and the last two are also related to atmospheric precipitation [37,40,54].
The Winkler Index uses the sum of the average daily temperatures between 1 April and 31 October minus a base temperature. We considered a base temperature of 10 °C as the active physiologically threshold of the vines to begin their growth cycle [34,49,50]. This Index provides information on heat accumulation during the growing season [34]. The Huglin Index was determined by summing the mean and maximum temperatures above 10 °C for the period from 1 April to 30 September. This calculation took into account a coefficient associated with the length of day “d”, which ranges between 1.02 and 1.06 in latitudes between 40° and 50° [37]. The HI is correlated with growth of the vine and the concentration of sugar in the berries [35,37,55]. The Cool Night Index represents the average of minimum night temperatures during the ripening period (September for the Northern Hemisphere). The objective of the CI is to improve the evaluation of the qualitative potentials of wine-growing regions, especially in relation to the secondary metabolites of grapes (polyphenols, aromas), responsible for the color and aromas of grapes and wine [37,51,56,57,58]. The Growing Season Suitability Index (GSS) is the percentage of days from 1 August to 31 September with a mean daily air temperature above 10 °C [31,52]. The Growing Season Precipitation Index (GSP) shows the accumulated precipitation during the same period [40]. Lastly, the Hydrothermic Index of Branas, Bernon and Levadoux (BBLI) measures the surpluses or moisture deficits that can affect grape yield and wine quality [40]. The calculation is the result of the monthly products of average temperature (degrees Celsius) and the amount of rainfall (mm) between April and August [54]. The BBLI provides an upper limit below which the possibility of a mildew attack on vines is low [40].

2.3. Meteorological Data

Meteorological data were obtained from the Xunta de Galicia stations controlled by MeteoGalicia and located in the main wine-growing regions: Rías Baixas 42° N 25′8″/8° W 47′38″; Ribeira Sacra 42° N 27′53″/7° W 17′26″; Valdeorras 42° N 24′48″/7° W 7′7″; Monterrei 41° N 56′24″/7° W 27′31″. In the DO Ribeiro, the meteorological information was complemented with an automatic weather station correlated to a data logger from the HOBO Micro Station data logger (Onset, USA), placed in a vineyard (42° N 19′54″/8° W 7′34″). The monitored parameters were maximum, average and minimum temperatures (°C) and precipitation (mm). The considered stations were: SoutoMaior (DO Rías Baixas), Cenlle (DO Ribeiro), San Clodio (DO Ribeira Sacra), Verín-Vilamaior (DO Monterrey) and Larouco (DO Valdeorras).
The Spain02 dataset (available at: http://www.meteo.unican.es/en/datasets/) was also considered [59]. Spain02 is a high-resolution gridded dataset of daily precipitation and maximum and minimum temperatures developed for mainland Spain and the Balearic Islands. The latest version (Spain02 v5) provides daily temperature and precipitation data from 1951 to 2015 on a regular 0.1° grid (~10 km) (details of specific interpolation methodologies are available in [45]). This dataset was used to calculate the observed climatologies of the different bioclimatic indices above described.
To analyze the future projections, data from the high-resolution dynamically downscaled daily climate simulations from EURO-CORDEX project were used [59] (http://www.euro-cordex.net/). This project offers model simulations over Europe considering global climate simulations from the Coupled Model Intercomparison Project Phase 5 (CMIP5) long experiments up to the year 2100 with a high spatial resolution data focusing on grid-sizes of about 12 km (0.11 degrees). We considered an ensemble of 8 members that consisted of different combinations of four global climate models–GCMs-(HadGem2, CNRM, MPI, EC-EARTH) and two regional climate models–RCMs-(cclm4, rca4), in two Representative Concentration Pathways–RCPs-(RCP4.5 and RCP8.5) in order to improve forecasts.

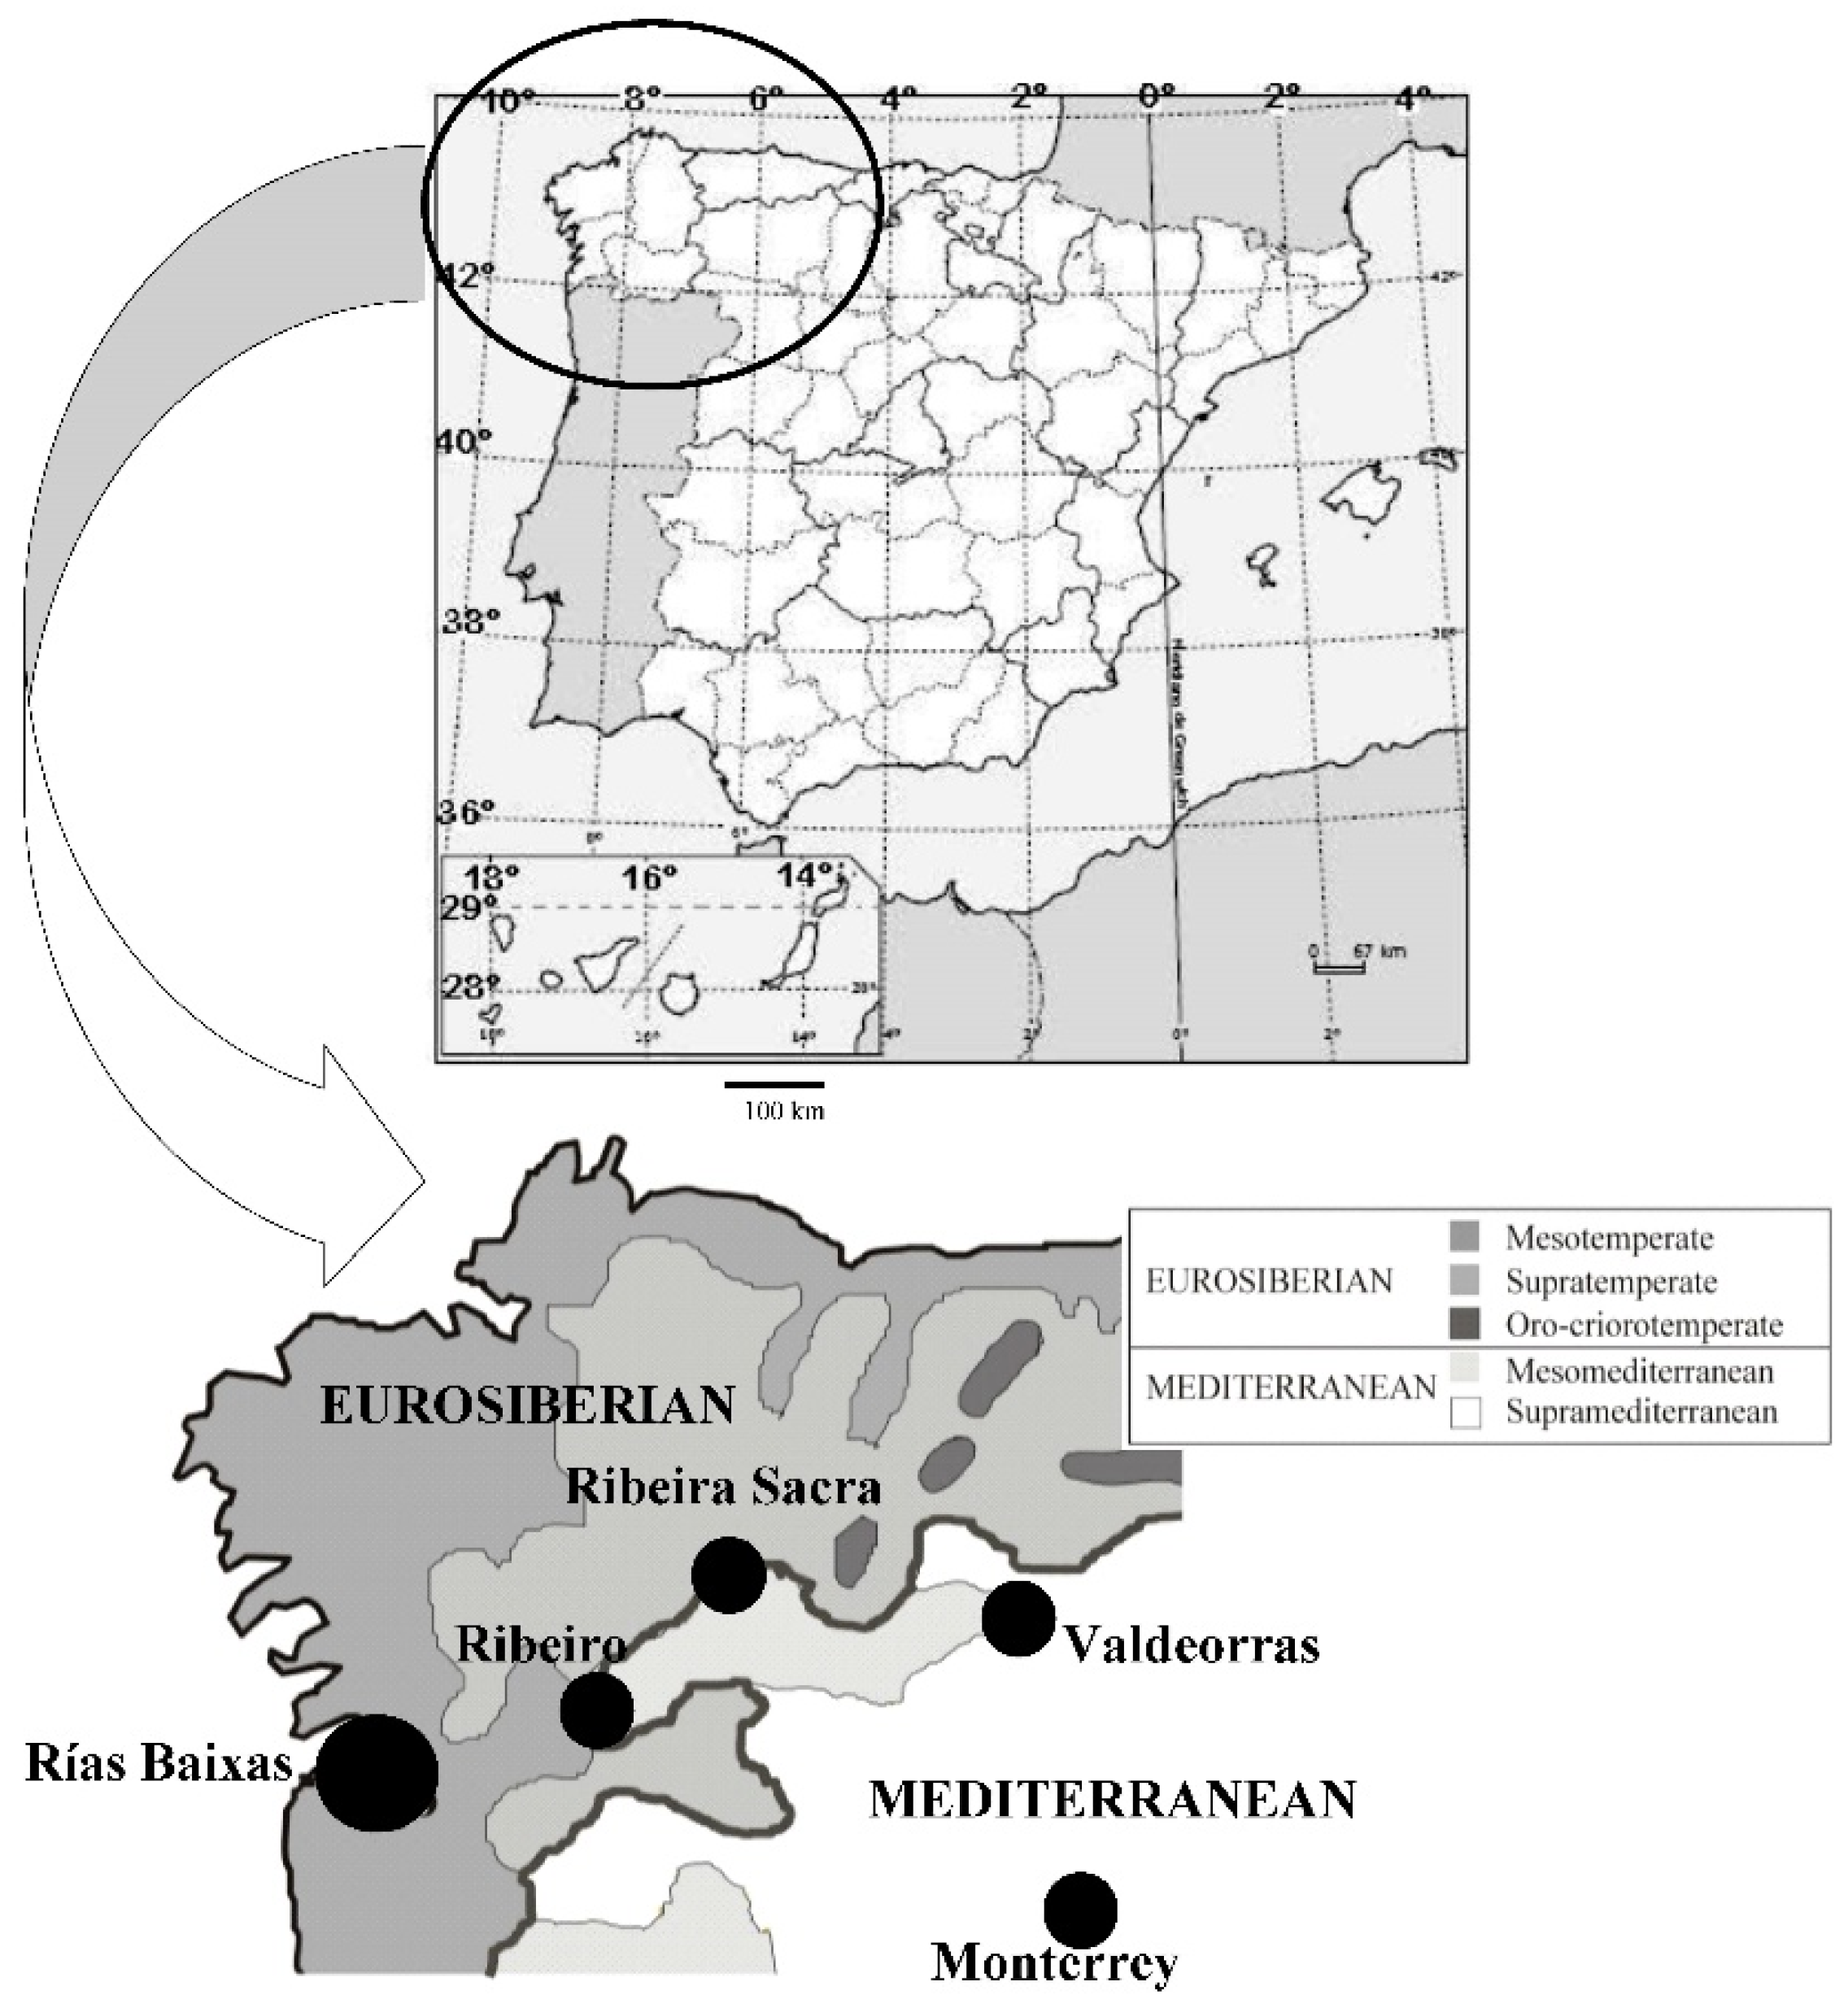
2.4. Statistical Study and Graphic Representation

To further assess the Spain02 performance, Taylor diagrams [60] were elaborated for the different bioclimatic indices. Taylor Diagrams show the correlation among time series, the centered root-mean-square (RMS) difference and the standard deviation (σ) [60]. The RMS and σ are normalized by the standard deviation of SPAIN02 data which is considered as the reference field. This consideration leaves the correlation coefficient unchanged and yields a normalized diagram. Thus, Taylor diagrams make it easy to identify the database which performs relatively well because data lie fairly close to the reference field (SPAIN02 data) [61]. A short distance to the reference point signaled by ‘‘Spain02” indicates a high adjustment of the data series of each DO and vice versa. To avoid long-term trends, all series were linearly detrended before the correlations’ calculation. This process is especially important for those variables that have shown clear increasing trends in the recent years due to climate change such as temperature [62]. The evaluation of the calculated indices with the obtained data from the meteorological stations located in the main Designation of Origin areas and the calculated indices with the set of high-resolution dataset “Spain02” was carried out for the common period 2000–2015.
The variability of the bioclimatic indices was analyzed for the period 1950–2015 and for the period 2000–2015 by means of the high-resolution dataset “Spain02” [45]. In this analysis, trends for the bioclimatic indices and significant changes between the two analyzed periods were searched. The significance of these trends was assessed using the nonparametric Mann-Kendall test [63,64].
In the future sceneries, an ensemble with multilinear regression–MLR-was conducted. MLR is a statistical technique that consists of finding a linear relationship between a dependent variable (spain02 data) and multiple independent variables (Cordex model outputs). A multiple regression model can be represented by the following equation:
Yi = a + b1X1 + b2X2 + … +bmXm + C;
where Yi is the dependent variable; X1, X2, …, Xm are the independent variables; a is the intercept; b1, b2 and bm are the multiple regression coefficients, to be estimated by the least-squares method; and C is the error term.
Previous results show that a multimodel ensemble using a MLR gives better results than using a multimodel ensemble mean [65].

3. Results

3.1. Climatic Characterization of the Different DO Areas during the Period 2000–2015

The analysis of average temperatures and precipitation in the different Designation of Origin areas during the period 2000–2015 showed average temperatures between 16.94 and 17.43 °C for all areas during the growing season (from 1 August to 31 October) (Table 2). In addition, minimum temperatures were higher in the more Eurosiberian areas, with 12.6 °C in the Rías Baixas DO and 11.4 °C in the Ribeiro DO. Regarding the maximum temperatures, a close range between 24.44 and 25.43 °C was detected, with the exception of the DO Rías Baixas in the Eurosiberian region with 22.77 °C. During the study period, a positive trend for temperatures was observed, mainly for the maximum values. The increase is more pronounced in the center of the territory at the Mediterranean region (DO Monterrei and Ribeira Sacra). The DO Rías Baixas of the Eurosiberian region accumulates the highest annual rainfall with 742.7 mm, while the DO Valdeorras, with the most inland location in the Mediterranean region, only accumulates 269.9 mm. The precipitation trend was negative in all study areas, with the most marked decrease in the Eurosiberian region (Table 3).
The different bioclimatic indices recorded during the study period are shown in Table 4. Mediterranean DO areas were included in Region II of the Winkler Index (Early and midseason table wine varieties will produce good quality wines), with similar values from 1590.7 in the Ribeiro DO (on the border with the Eurosiberian region) to 1486.2 in the Valdeorras DO.
The values obtained for the Huglin Index varied between 1916 and 2257, identifying the most inland Mediterranean areas as warm temperate climates as Napa and the Eurosiberian area as temperate as Bodeaux.
Considering the Cool Night Index (CI) the Rías Baixas DO was the warmest categorized as Cool nights, while the more Mediterranean DOs, Ribeira Sacra, Monterrei and Valdeorras, registered temperatures slightly above 11 °C, class of very cool nights.
The BBLI results revealed that the risk of mold infestation was generally moderate (Low risk BBLI < 2500; high risk BBLI > 5100) for almost all of the studied territory, except in the Eurosiberian region categorized as high risk of downy mildew disease. A decreasing gradient was detected between the coastal and inland zones, probably influenced by the terrain topography that affects the spatial distribution of precipitation in the study region. Our GSP results ranged from 205 to 530 mm and are consistent with those obtained for BBLI.
For all DO areas, a GSS higher than 93.1% was obtained, which indicates that the mean daily air temperature is higher than 10 °C during more than 90% of the days in the vine vegetative period from April to September.
The detected trends for the bioclimatic index in the study period were positive in all the DO areas for Winkler, Huglin and GSP Indices and negative for BBLI and GSP. For the Night Cold Index, a positive trend was only detected for the DO Rías Baixas, Ribeira Sacra and Valdeorras (Table 4).
A Taylor diagram is presented in Figure 2 (Taylor 2001) to assess the similarity between the “Spain02” data (red point) and the measurements taken in the different DOs. The best fit was observed with the Winkler and GSS Indices for all DO areas (Figure 2). The Huglin Index showed better correspondence with Valdeorras and Rias Baixas DOs while Ribeira Sacra DO present the worst results although show a correlation higher than 0.7 and RMS lower than 1.0. The BBLI and GSP indices show worst result especially in the Rias Baixas DO these errors are mainly determined by the poor performance for precipitation in Spain and in general in the numerical models. However, despite certain discrepancies, these results show, in general, an acceptable concordance between the measurements in the vineyard and the “Spain02” database during the period 2000-2015. This results allow us to make maps of the behavior of these bioclimatic indices with the "Spain02" database. The proximity of the most points of DOs to the reference point signaled by ‘‘Spain02’’ indicates an acceptable adjustment of the data series of each DO and vice versa (Figure 2).

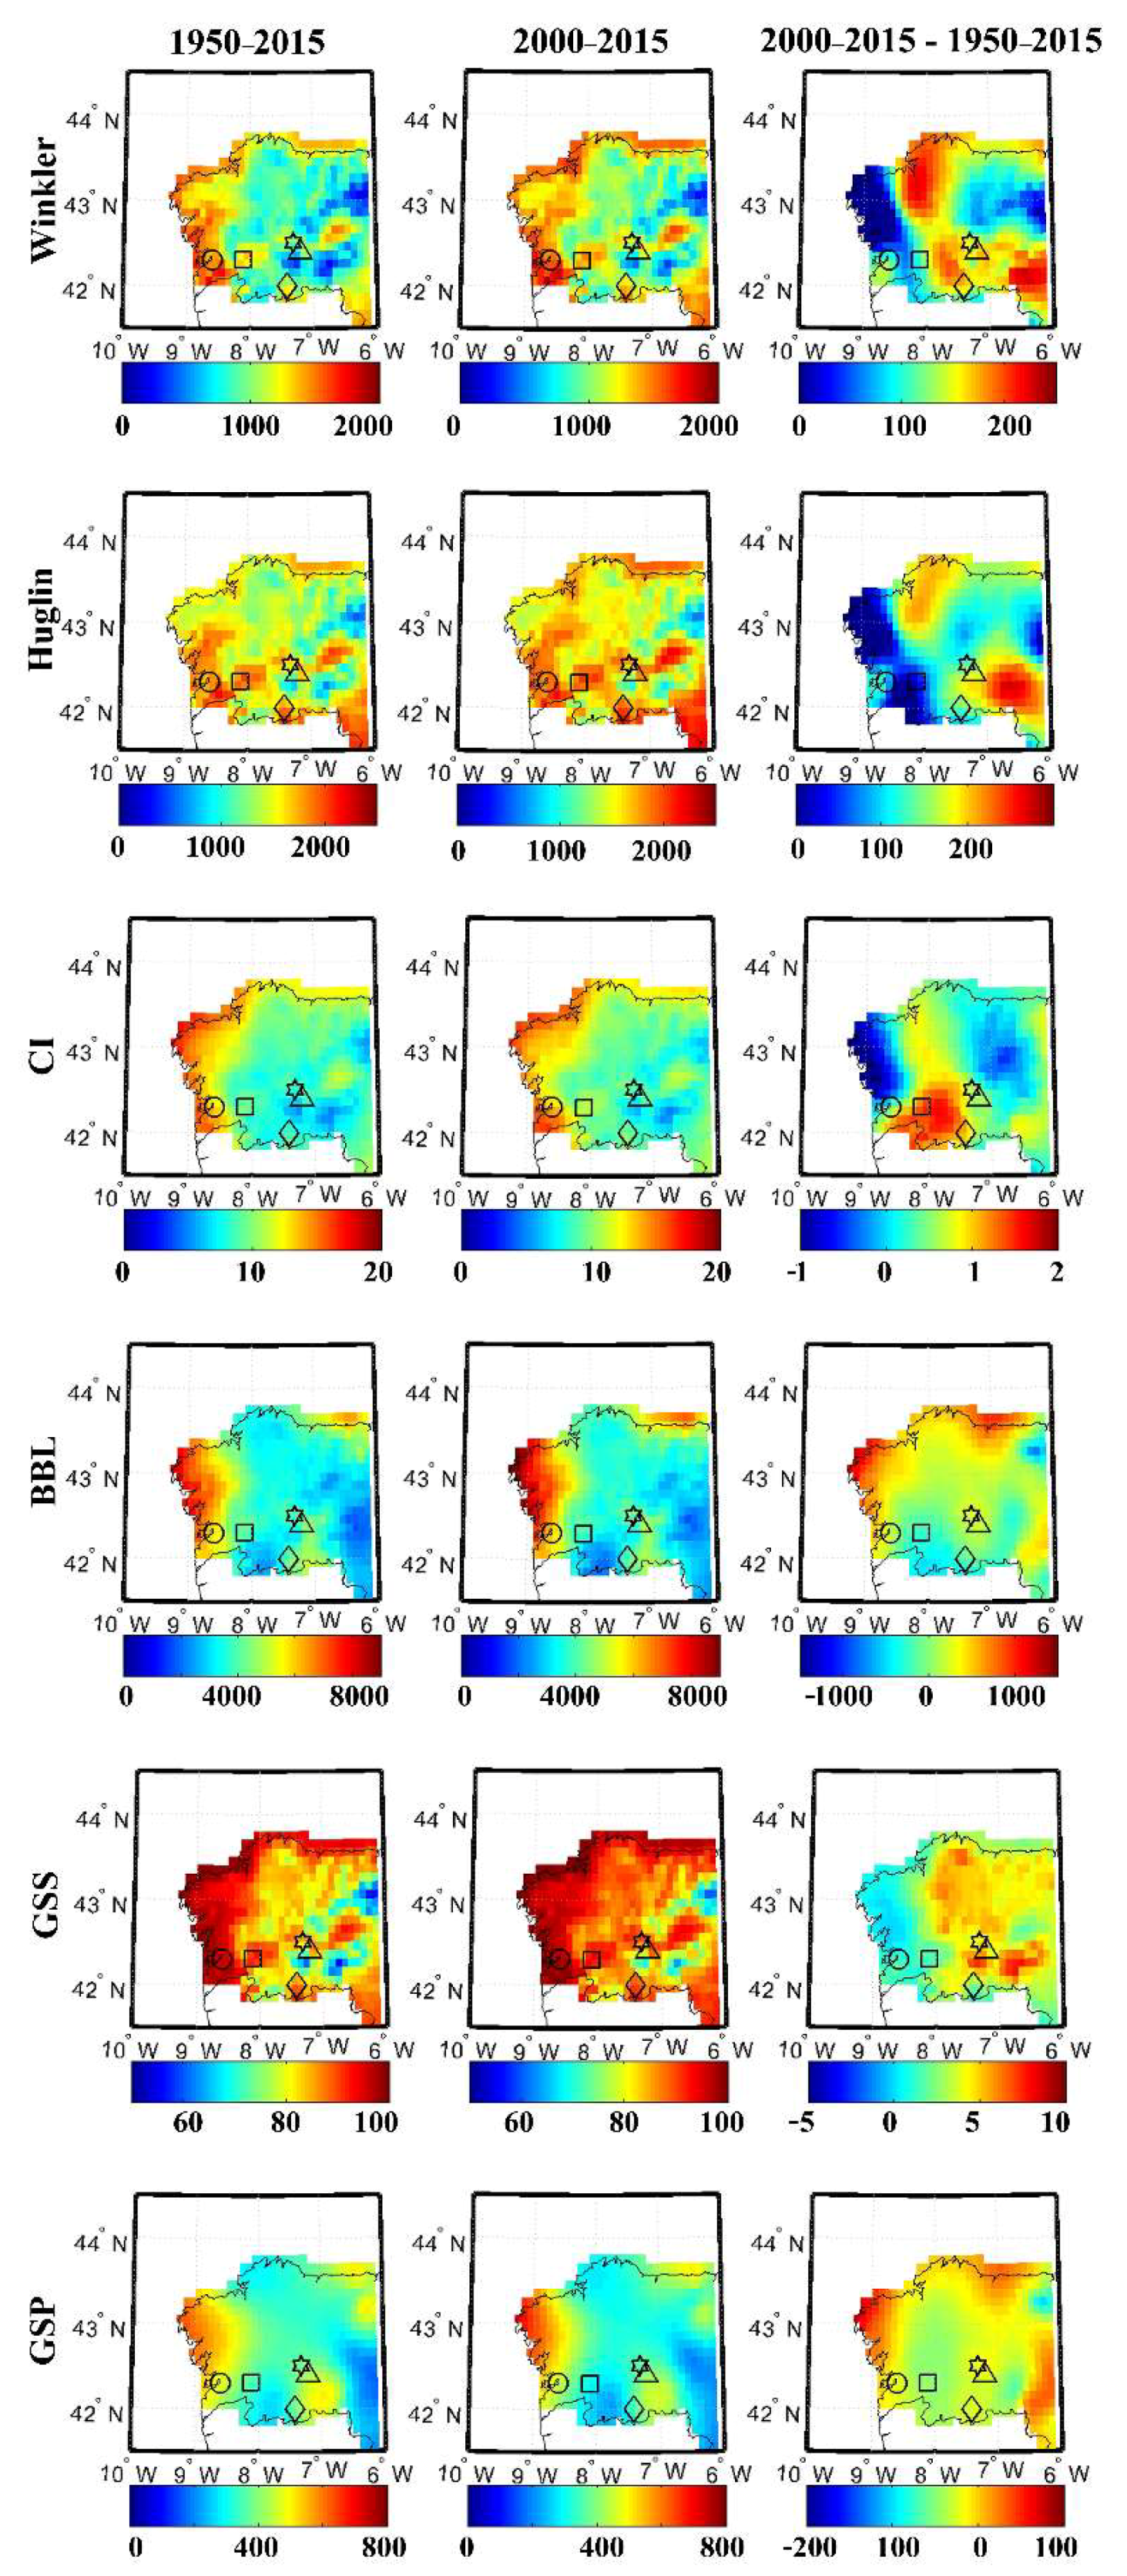
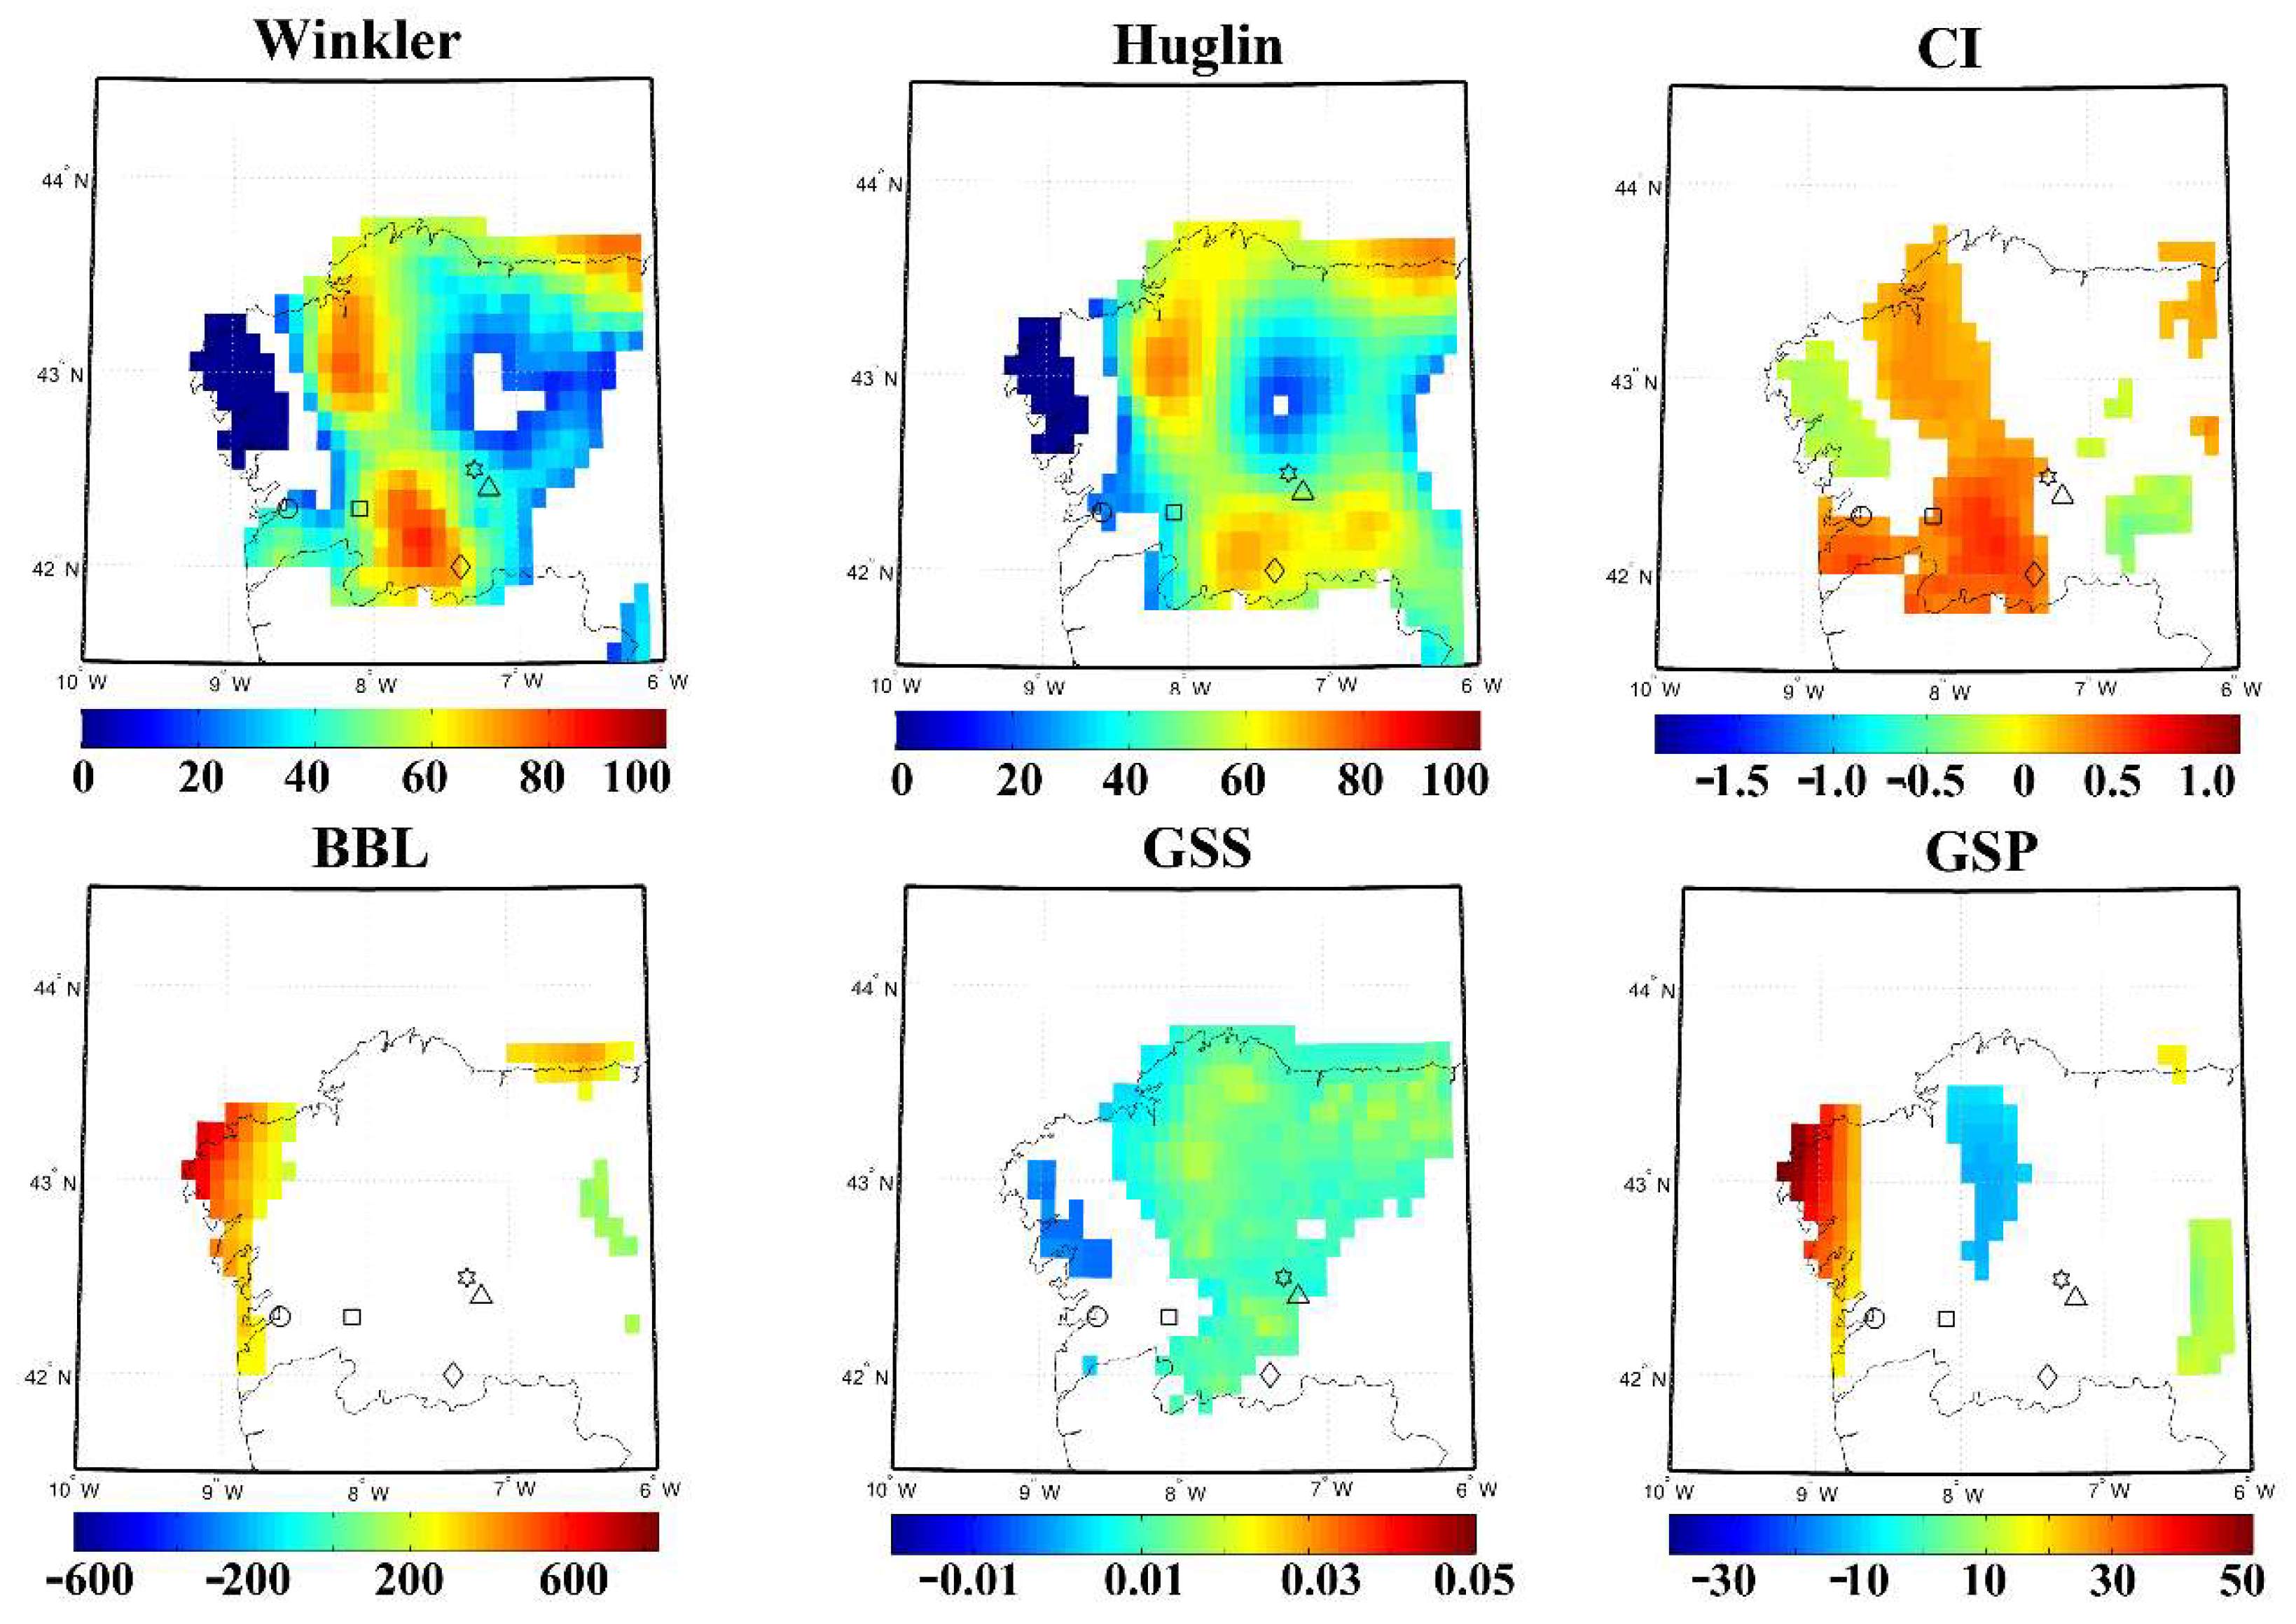
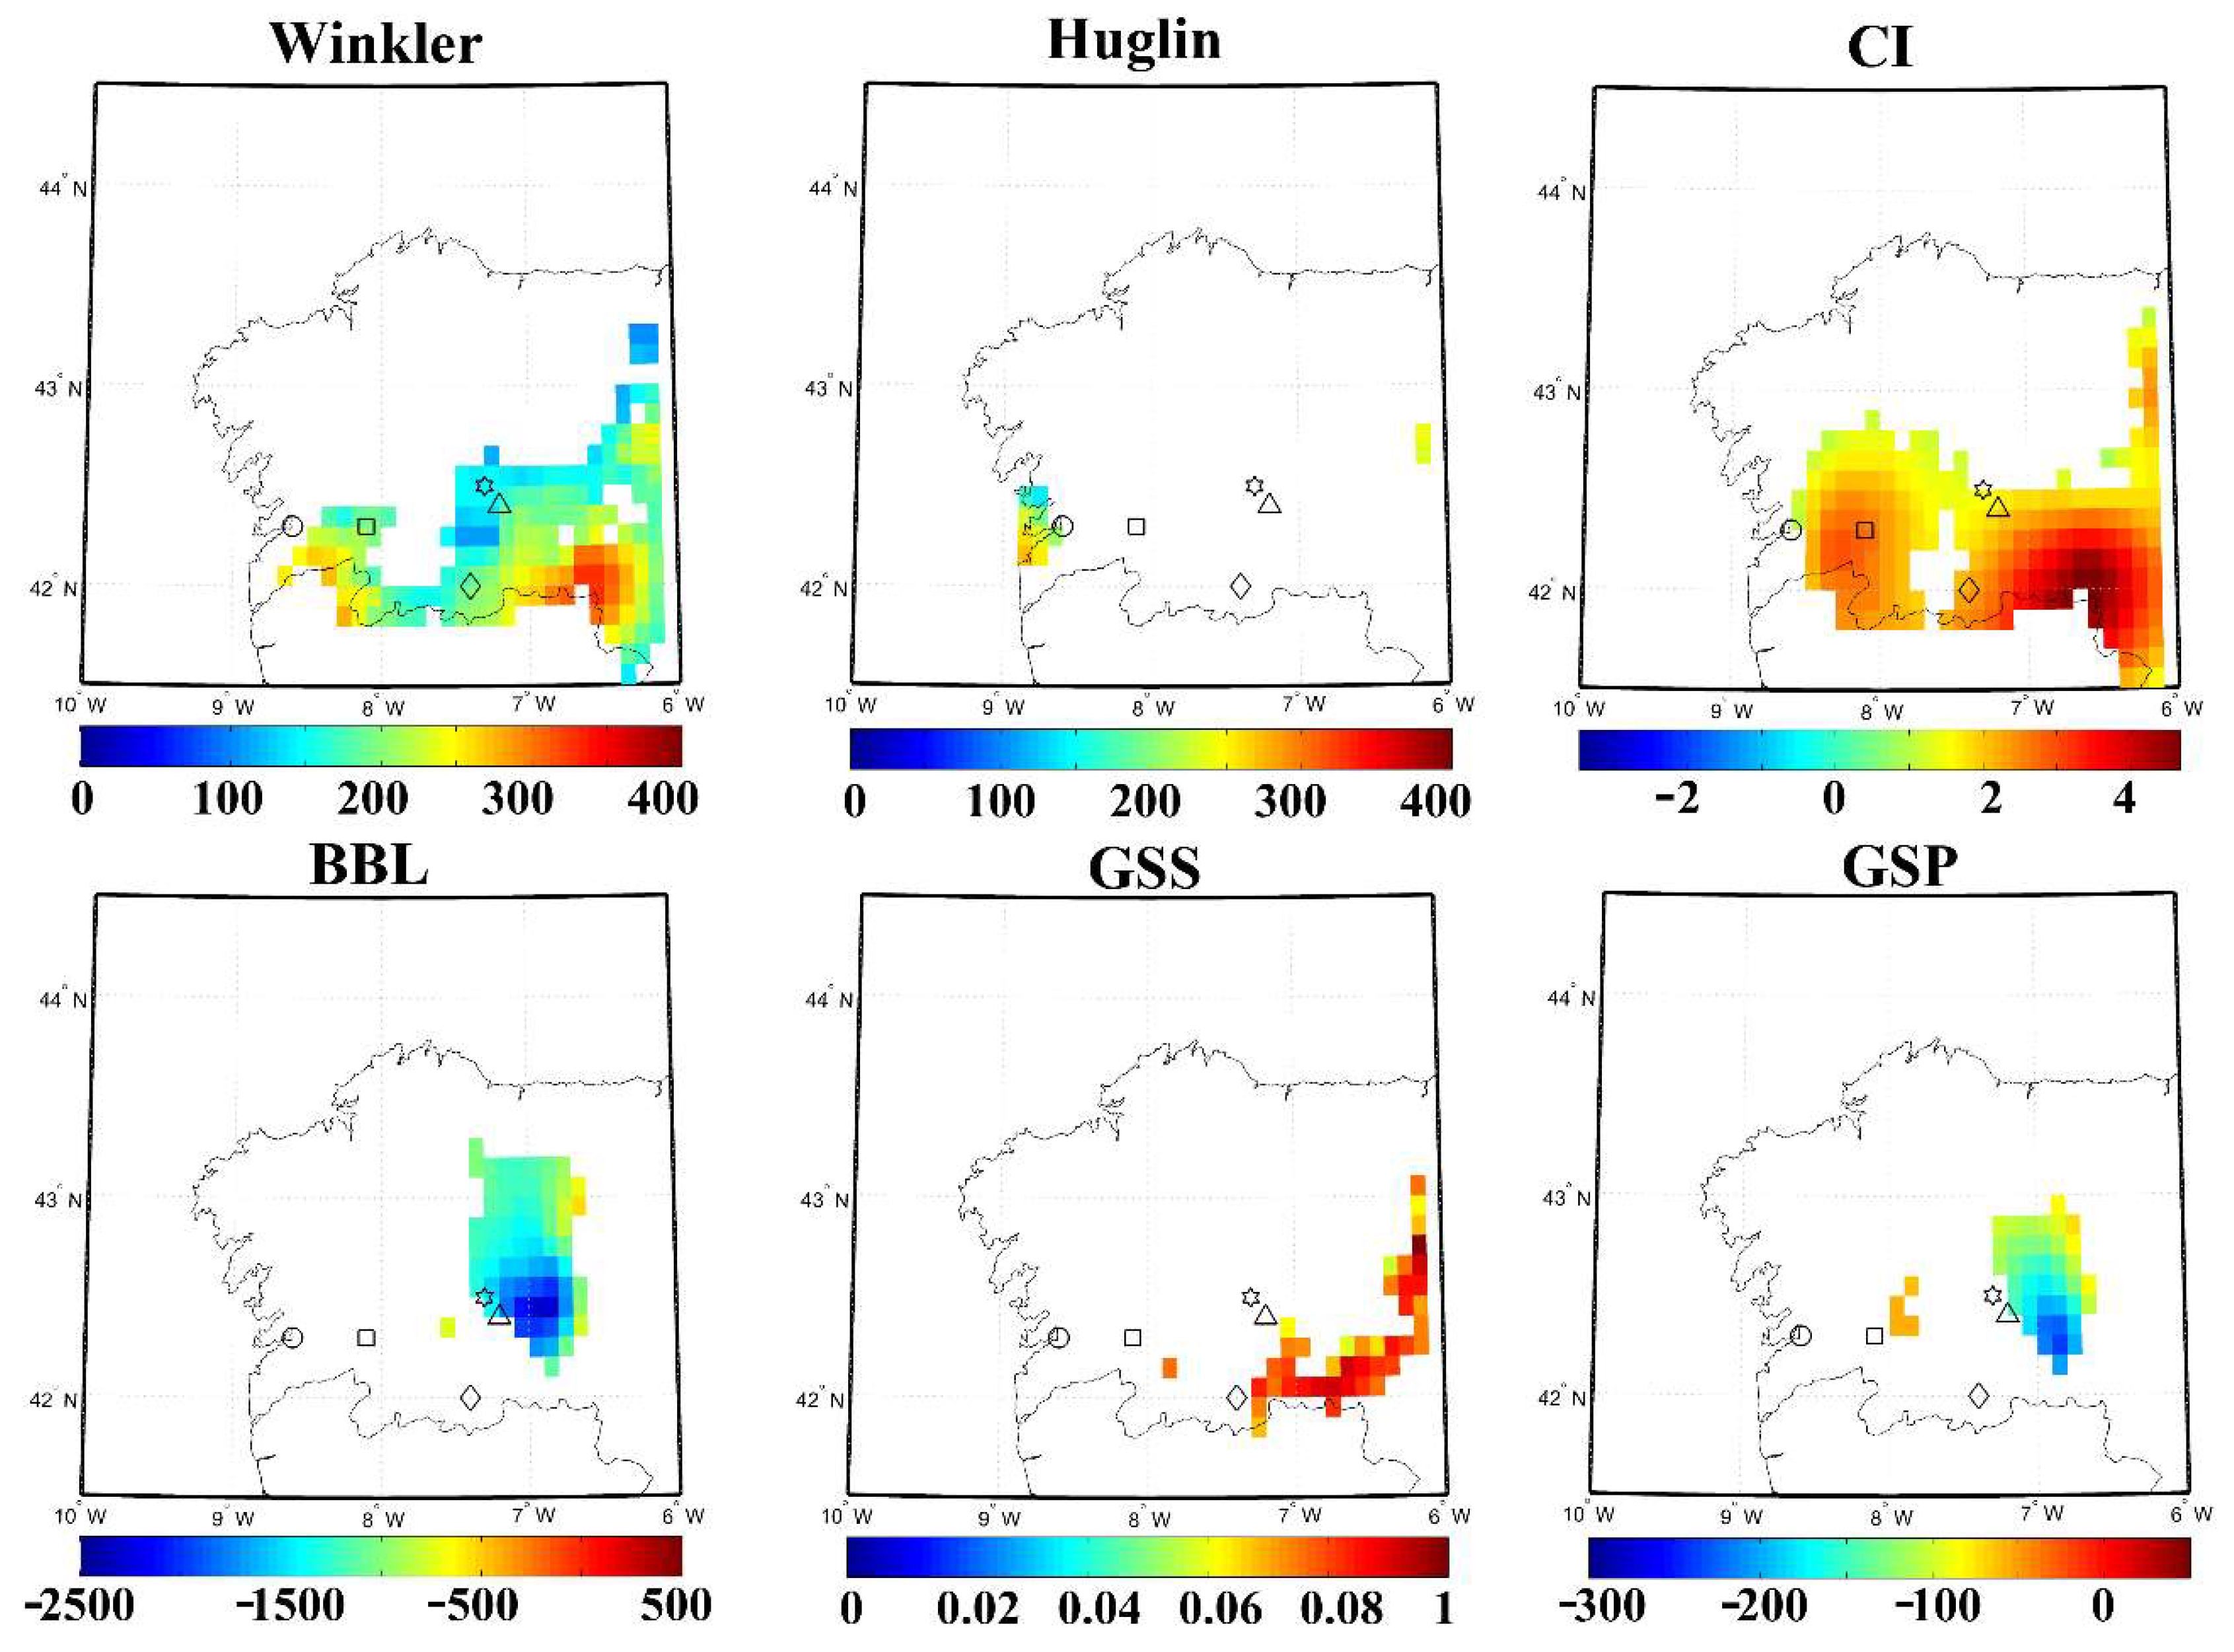
3.2. Changes in the Bioclimatic Indices

After verifying the compatibility between our recordings at the vineyard and the “Spain02” database, the variations in the bioclimatic indices for the 1950–2015 and 2000–2015 periods were analyzed (Figure 3). During the 1950–2015 period, the Winkler Index showed the higher values in the Eurosiberian area, around 1500 in the Ribeiro DO transition bioclimatical area and below 1000 in the more Mediterranean vine-growing areas. For the most recent period 2000–2015, all the DO areas presented increased values of the Winkler Index values. In this period a more pronounced increase of 420 units in the WI was observed in the DO areas located in the eastern Mediterranean area.
Taking into account both study periods for the Huglin Index (HI), markedly related to temperature, an increase between 210 and 520 units in the Huglin Index was observed for all the DO areas in the period 2000–2015. This evolution was more pronounced in the more Mediterranean DO, Valdeorras.
A similar pattern for the Cool Night Index (CI) was detected. In the Eurosiberian DO, the nights were warmer, while in the Eastern DOs of the Mediterranean area lower values than 5 °C in the minimum temperatures can be recorded. However, the values of the last period showed an increase close to 2 °C in the Monterrei and Ribeiro DO areas. Regarding the other indices, the GSS Index was higher on the Eurosiberian DO Rias baixas and more moderate in the Eastern DOs. However, in the 2000–2015 period an increase of the GSS Index was observed for the most Mediterranean areas (Valdeorras, Ribeira Sacra and Monterrei DO) compared to the period 1950–2000. The strongest increases of the GSP Index (Figure 3) were observed in areas out of the DOs without viticulture agronomic importance (Figure 1). A minor general decrease in the percentage of rainy days was observed during the last 15 years but with no changes in the index pattern.
The significance of increases of the aforementioned bioclimatic indices were evaluated for the 1950–2015 (Figure 4) and the 2000–2015 periods (Figure 5) using the nonparametric Mann-Kendall test. The trend for the Winkler and Huglin Indices during the 1950–2015 period were significant with values between 50 and 80 units/decade in the Mediterranean areas and between 20 and 40 units/decade in the Eurosiberian area. These results suggest that the thermal conditions for the development and ripening of the grapes shift depending on the area between 20 and 80 units per decade.
During the last fifteen years (Figure 5), The growing trend was more pronounced for the Winkler index in the southern zone of the Northwestern Spain, being significant for all DO areas except Rias Baixas. The Cool Night Index also show a significant positive trend around 0.5 °C per decade, mainly in the western area, where the Ribeiro and Monterrei DO areas are located in both periods, 1950–2015 and 2000–2015. The GSS Index shows a slight significant positive trend since 1950–2015 that affects the DOs of the Mediterranean areas, Ribeira Sacra and Valdeorras (Figure 4). The BBLI index did not show significant trends in the DO areas since 1950–2015, although in the last fifteen years registered negative and significant trends in the DO Ribeira Sacra and Valdeorras areas where the lower amount of precipitations has been detected during the studied period (Table 3). Otherwise, for the GSP Index, we did not find significant trends that affect the main viticulture areas during the studied periods.

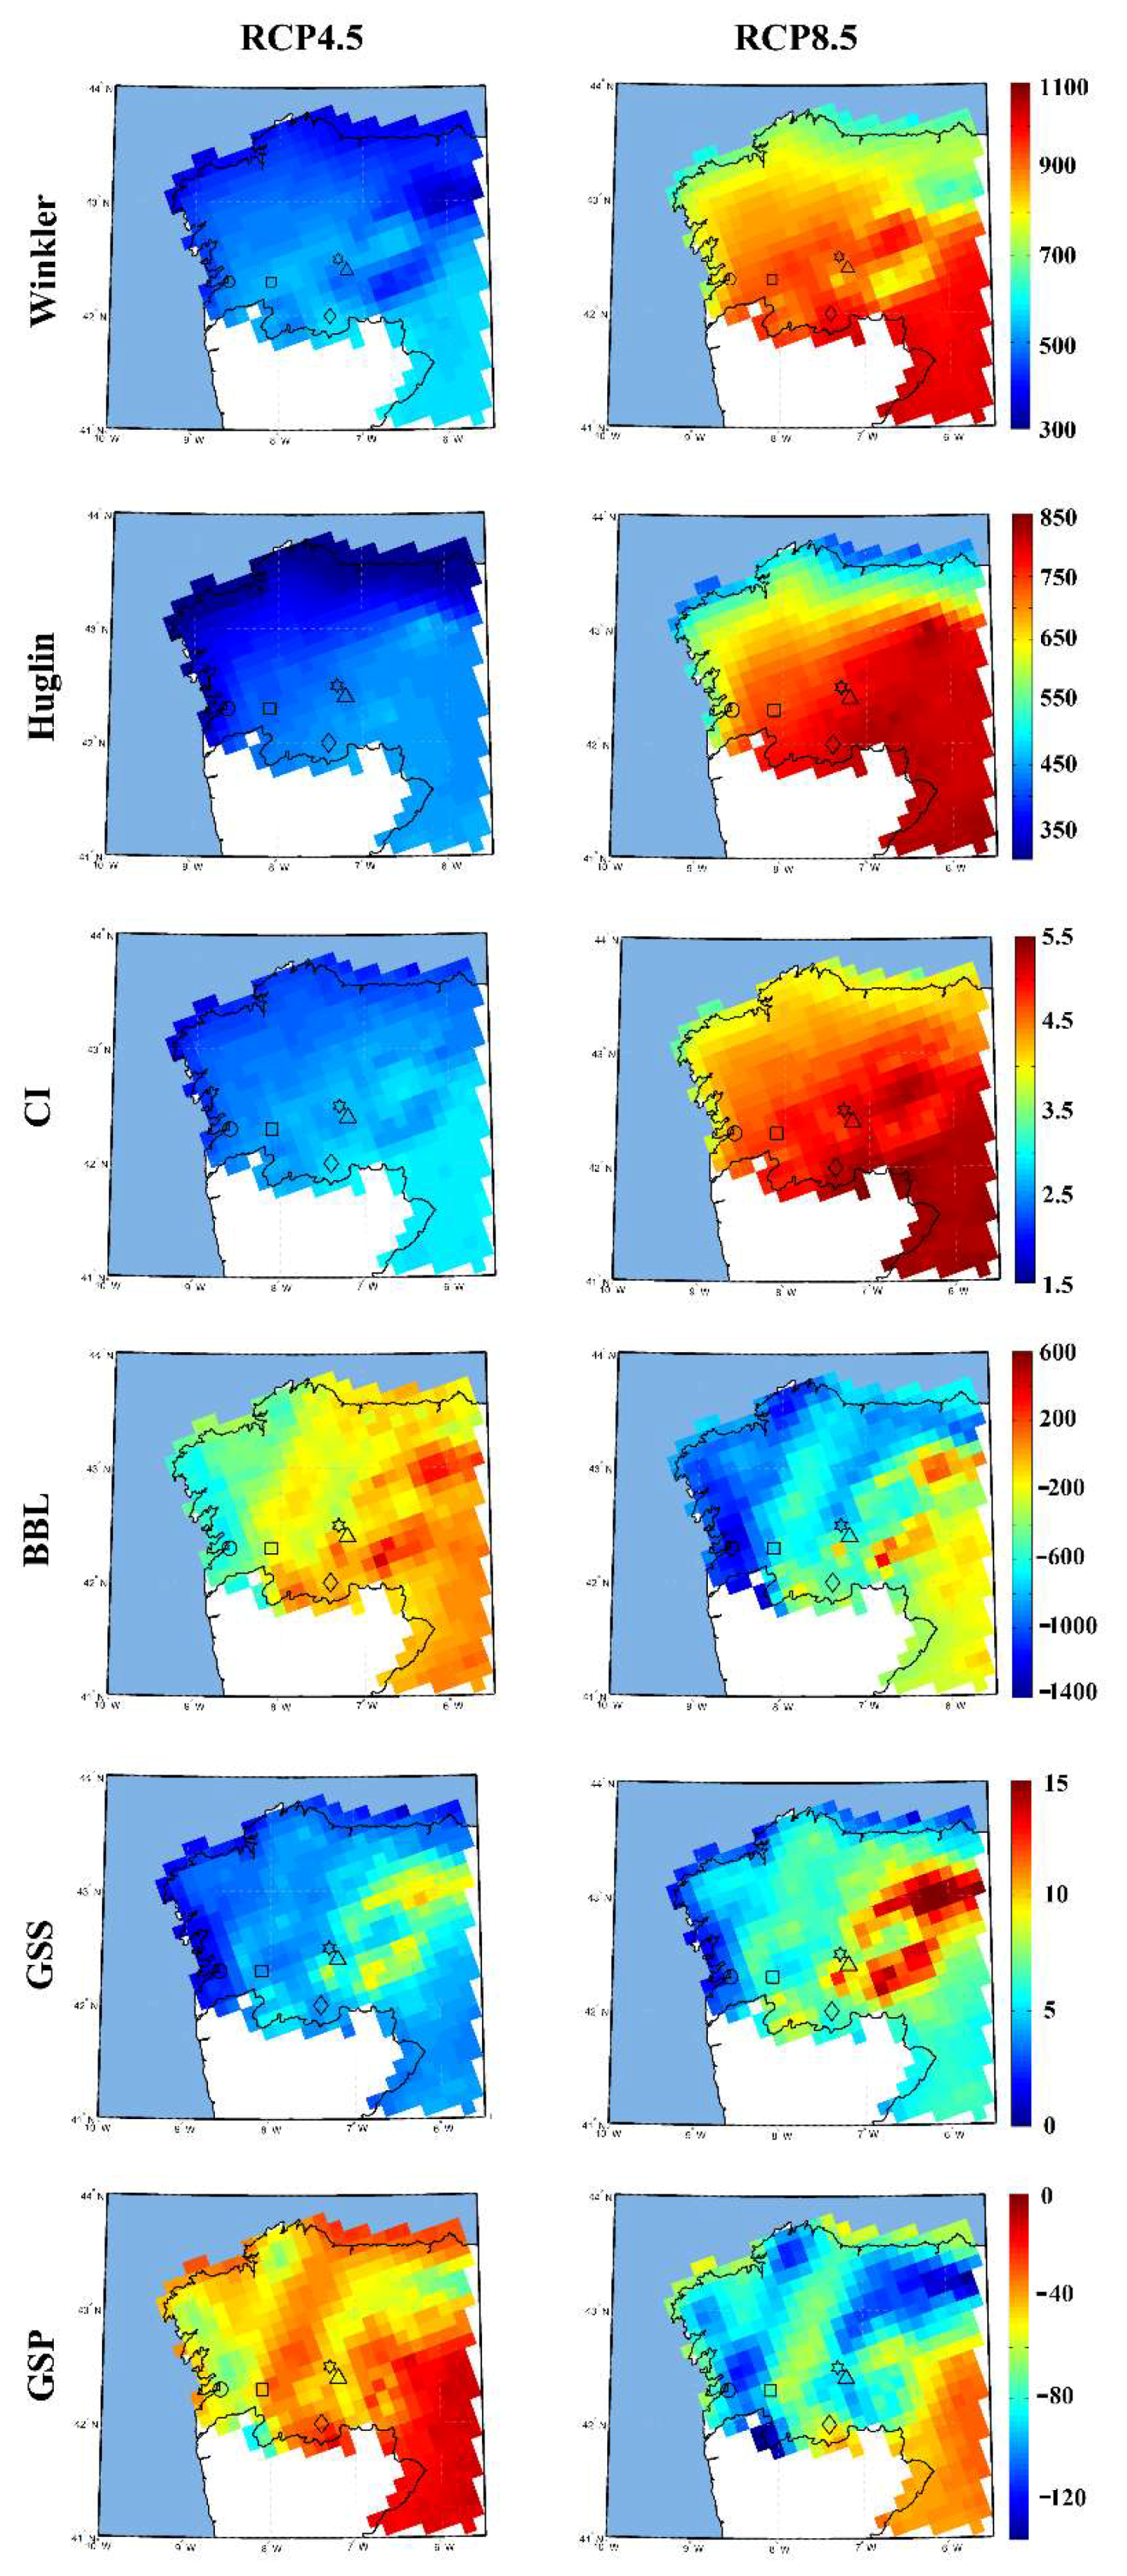
3.3. Future Projections of the Bioclimatic Indices

The results of the studied Index considering the future meteorological projections between 2061 and 2095, obtained by adding the delta-change estimates to the observational mean values, were showed in Figure 6. The delta-change estimate is defined as the 2061–2095 scenario integration mean minus the 1971–2005 historic integration mean.
Results for the Winkler index shows a greater increase in the values under the RCP8.5 scenario for the period (2061–2095) (Figure 6). In the Eurosiberian region, the value of 3000 would rise, while most areas could present values higher than 2000 units. For the intermediate scenario RCP4.5 (Figure 6), the increase was not large since the Index could rise between 475 and 550 units in all areas.
The Huglin index also showed future overall increases, both for the RCP4.5 and for the RCP8.5 scenarios. As in the case of the WI, the increase is lower in the RCP4.5 scenario, with increments between 400 and 450 units, and greater under the RCP8.5 scenario, with values between 650 and 800 units. In general, the increments will be highest in the more Mediterranean DOs, Monterrei and Valdeorras.
In the case of the Cool Night Index CI, important differences were detected between the RCP4.5 and RCP8.5 scenarios. In the RCP45, the values could increase between 2.4 and 2.8 units, whereas under the RCP8.5 scenario the value of the CI could highly increase between 4.5 and 5.25 units, mainly in the more Mediterranean DOs located in the east of Galicia.
Low differences were detected for the BBLI index between the two scenarios. In general, the index decreases, mainly in the Eurosiberian DO and the Ribeiro DO located at the border of the Eurosiberian and Mediterranean bioclimatic regions. In this case, the differences between the two scenarios are not as important as in the other indices, due to the uncertainties of meteorological models in terms of rainfall.
Finally, the Growing Season Suitability Index (GSS) experiment higher increases in Valdeorras, Ribeira Sacra and Monterrei DO areas within both scenarios. The GSP Index values showed a small decrease, especially in the Eurosiberian bioclimatic area.

4. Discussion

The assessment of the climate evolution in a given area allowed us to evaluate its future suitability for agriculture, providing an adequate and timely planning of crop adaptation measures to stakeholders, policymakers and the socioeconomic associate sectors [32,54,66]. The influence of meteorology on the grapevine growing season period has been widely demonstrated [67,68,69,70,71,72,73], as only optimal temperature and water availability conditions resulted in successful and high-quality harvests [74,75,76,77,78,79]. In this sense, the most important six bioclimatic indices, considering the aforementioned parameters during different annual periods, were applied in the DO wine-growing areas of Northwestern Spain located in two main bioclimatic areas, Mediterranean and Eurosiberian.
A temperature-increase trend was detected in our study, mainly for the maximum values, with a greater increase in the more continental Mediterranean wine-growing areas (Monterrrei and Ribeira Sacra DOs). This detected trend prompted modifications in the considered bioclimatic indices during recent years. Thus, an increase of the Winkler, Huglin, Night Cold Index and GSP Index was detected during the period 1950–2015 in the area of study. Significant increases for these indices, mainly the HI values, were previously noted over most of the European viticultural areas [32,80]. In addition, the obtained projections for the 2061–2095 period considering the intermediate scenario RCP4.5 predicted additional increases of the indices (ranging from 450–550 units for the WI, 650–800 units for the HI and 2.4–2.8 for CI) in all studied DOs areas, the Mediterranean area being the most affected. Previous studies conducted by Lorenzo et al. [54] in the coastal areas of Northwestern Spain also showed significant positive trends, at 95% level in the Winkler Index and at 99% in the Huglin Index. These results are consistent with previous findings throughout the Iberian Peninsula and other European areas [14,52,67,81,82,83]. Some studies pointed out an overall loss of viticultural suitability could occur in the future along the Mediterranean basin, meanwhile in central and northern Europe warming conditions should improve wine-growing conditions [67,68]. Adaptation strategies to higher temperatures were proposed by different authors [83], involving the use of late ripening varieties [84], clones [85] and rootstocks [86], as well as changes to some management practices, such as increasing the trunk height [87] or applying late pruning [88].
Therefore, the viticultural potential of the study area will be altered because of thermal variations, since increases of temperatures and their related indices were expected in future-projections. The first consequence will be associated with an advance in the phenological events and vintage data and the consequent modification of grapes development and maturation in all the studied DOs. Flowering reveals less pronounced projected changes that those for budburst [67,82,89]. Earliest harvests will be further noticeable in the Mediterranean area, where harvest during the hotter summer days under higher water stress will cause a lower crop yield [67], and the acceleration of chemical and microbiological reactions, increasing oxidations, microbiological development, uncontrolled macerations or undesirable fermentations. A second alteration in all studies DOs could be associated with future production of more alcohol-fortified wines due to a greater sugar formation in grapes [82,90,91]. A rapid development caused by higher temperatures leads to total soluble solids/treatable acidity ratio skewed towards sugar accumulation and acid loss in grapes [25]. However, the advance of phenological events could modulate the increase in alcoholic degree as the acceleration of the ripening process would induce a rapid sugar development and their relatively small final accumulation [76,92]. Our results showed that this process will be more pronounced in the future for wines produced in the DOs of the Mediterranean area. A third consequence in our area of study could be the variation in the acidity level of wines in the study area. Air temperature during the ripening period is decisive for berry composition, color and aroma [15]. High temperatures conditions lead to the formation of polyphenols as a consequence of sugars alteration, which trigger problems with color, tannin structure, astringency and bitterness in wine [18,77,93]. Grapes grown in warmer climates will have lower acidity and higher sugar levels than those grown in colder climates, with higher acidity and lower sugar levels [83,94,95]. Consequently, the quality of wines produced in the studied DOs of the most Mediterranean area could be affected by an increase in their acidity, astringency and bitterness, in comparison with the wines produced in the transition zone or the Eurosiberian area. Similarly, previous studies conducted in Portugal also detected a viticultural zoning that clearly showed an Atlantic/Mediterranean climatic contrast [32].
Another important meteorological variable that affects the suitability of the wine-growing areas is rainfall [96,97,98]. In agriculture, water limitation depends on the effect of several factors, such as soil type, cultivars and crop management among others [99]. Our study showed a negative precipitation trend in all the assessed DO areas in the future projections. The amount of precipitation and its temporal distribution affect the water absorption by the roots, the final grape quality and yield [100,101]. The detected decrease in the values of the precipitation-related index were more noticeable in the Eurosiberian bioclimatic area and the nearest areas of the transition zone, such as the Ribeiro DO. This change is expected to continue in the future in both studied areas. Therefore, climate change projections indicate that water stress conditions may intensify, which is in agreement with studies using grapevine dryness indices for Europe, particularly in the Iberian Peninsula and Italy [31,32,102], suggesting that grapevine yields in southern Europe may decrease [71,83,103]. In spite of a huge amount of 742 mm of annual precipitation registered in the Eurosiberian area of study, it is expected that plants will suffer a slight water stress during ripening in the future (not affecting the physiological activity of the vine). This fact could promote an increase in the concentration of aromatic and polyphenolic compounds in the future wines of the Eurosiberian area and the nearest transition zones such as the Ribeiro DO. Adaptation strategies to water stress were proposed by different authors [79], promoting a higher efficiency in water use by means of drought-resistant rootstocks [104] or varieties [105] and changing the current training systems, increasing row spacing or ferti-irrigation [79].
Moreover, the lower BBLI rates estimated in the future projections could introduce another positive aspect in the potential viticulture suitability of Northwestern Spain studied DO areas. The decrease of the BBLI Index provides an upper limit below which the possibility of a mildew attack on vines will be lower [40]. Similar findings were noted for the Northern and coastal viticultural regions of Portugal exposed to Atlantic air masses [32] or the Central part of the Iberian Peninsula [81] but in this last case by applying the Branas Heliothermic Index (P1). As a consequence, a reduction of the phytopathological fungal pressure in the vineyard could occur due to the less frequent propitious humidity conditions expected for infection and disease development, mainly in the Rias Baixas DO of the Eurosiberian area and the nearest transition zones. Therefore, a significant reduction in the number of phytochemical treatments will be expected, which will diminish the production costs and the risk of environmental pollution [106,107,108]. Malheiro et al. [31] noted that the downy mildew contamination risk is low for BBLI values below 2500 and high for values exceeding 5100 [102]. For this index, the unrealistic wavelike patterns determined by the poor performance for precipitation in the climate models were similar to observations in previous studies that used data of the ENSEMBLE project [102]. The improvements added to models in the EUROCORDEX project and CMIP5 did not achieve significant progress in the simulation of rainfall [65].
Finally, due to the projected hotter and drier conditions towards the end of the twenty-first century, viticulture suitability in Northwestern Spain will be threatened as other viticultural areas located at the same latitude [82]. For southern European winemaking regions (i.e., Italy, Spain and Portugal), projections indicate that viticulture will still remain suitable, although its sustainability will decrease due to lower yields [67]. Changes in the regional land categorization and new suitable areas for viticulture will be expected in Northwestern Spain. Increases of the Winkler and Huglin Indices indicate that the current cooler vine growing regions are expected to be suitable areas for growing quality wine grapes, mainly in the more elevated zones of the more Mediterranean areas, Valdeorras and Monterrei DOs. Moreover, the increasing trend of the Huglin Index values revealed the aptitude of Northwestern Spain as a future suitable area for late-maturing cultivars [31]. Studies conducted in Italian vineyards located at similar latitude noted certain areas becoming “very hot” under the RCP 4.5 scenario, suggesting that these areas would still be suitable for late-ripening grape varieties cultivation (82). Several authors have observed a shift of wine growing areas towards the poles as a consequence of climate change [5] Future climate scenarios predicted that Northern European regions, or more elevated areas, will become suitable zones for viticulture [1,6,7]. Nevertheless, preserving the current vineyard location is a primary goal when adapting to climate change rather than the relocation to higher altitude zones [17,79]. Many southern Europe regions (latitude lower than 41° N) shift to unsuitable conditions. Otherwise, within the latitude belt of 41–50° N, where the DOs of the study area are located, no critical changes for winemaking suitability are expected [5,33]. The GSP Index provides the general suitability of a given area for viticulture and it is also used for wine climate zoning considering the accumulated rainfall along the growing season [40]. The obtained results for the GSP Index reinforced the fact that Northwestern Spain area will be sensitive to the climate change effect. Likewise, the GSS Index indicated that our region will be suitable for grapevine cultivation [51]. Santos et al. [52] pointed out that winegrowing regions can be considered as suitable for viticulture if at least 90% of days of the grapevine growing season reach a daily mean temperature higher that the base temperature of 10 °C. This is the case of large areas in the Iberian Peninsula and other regions, which tend to be the most suitable areas for wine growing. However, other important wine-growing areas of North America or Western Europe had lower GSS values, reaching the thermal requirement between 80% to 90% of days during the growing season. Despite these areas generally being at slightly higher altitude or higher latitude, they are still suitable to viticulture but with a more pronounced climate variability and a shorter growing season. GSS values lower than 80% indicate not suitable areas for viticulture, being generally high altitude or latitude zones.

5. Conclusions

The assessment of the regional climatic suitability for a given grapevine cultivar in present and future climates, is critical for a strategic planning of the winemaking sector in the new climate change context. In this situation, our study could help winegrowers and policymakers to identify and prioritize adaptation measures.
A trend to an increase of the Winkler, Huglin, Night Cold Index and GSP Indices was detected in Northwestern Spain, whereas slight negative trends for BBLI and GSP Indices were observed. Our results showed that climatic conditions in the study region could variate for the crop in the future, more for Mediterranean than Eurosiberian bioclimatic area. An advance in the phenological events or the vintage data, a more alcohol-fortified wines and variations in the acidity level of wines could be expected in Northwester Spain, these processes being more noticeable in the Mediterranean area. Moreover, current cooler vine growing locations are estimated to be suitable areas for growing quality wine grapes, mainly in the more altitudinal zones of the more Mediterranean areas. The forecast changes for the BBLI and GSP Indices will induce a decrease in the pressure of the mildew attacks incidence in the areas located at the Eurosiberian region and the nearest transition zones.
If the trend of temperature increase continues, some cultural practice variations should be conducted in order to preserve the grape cultivation suitability in the studied area, such as the grape cultivars change in the next decades, irrigation applications or the vineyards shift to more elevated areas characterized at this moment by colder weather conditions.

Author Contributions

Conceptualization, F.J.R.-R. and M.F.-G.; methodology, A.P.-R. and E.G.-F.; software, M.N.L.; validation, A.P.-R., E.G.-F. and M.N.L.; formal analysis, A.P.-R.; investigation, F.J.R.-R., M.F.-G. and A.P.-R.; resources, F.J.R.-R. and M.N.L.; data curation, A.P.-R. and E.G.-F.; writing—original draft preparation, A.P.-R., E.G.-F., M.F.-G., F.J.R.-R. and M.N.L.; writing—review and editing, A.P.-R., E.G.-F., M.F.-G., F.J.R.-R. and M.N.L.; visualization, A.P.-R., E.G.-F., M.F.-G., F.J.R.-R. and M.N.L.; supervision, F.J.R.-R. and M.N.L.; project administration, F.J.R.-R.; funding acquisition, F.J.R.-R. All authors have read and agreed to the published version of the manuscript.

Funding

This research received no external funding.

Acknowledgments

This work was partially supported by the VITICAST 20190020007473 project of the Agriculture, Fisheries and Food Ministry of Spain Government. This research was partially supported by INTERREG-POCTEP under project RISC_ML (Code: 0034_RISC_ML_6_E) co-funded by the European Regional Development Fund (ERDF) and by Xunta de Galicia under Project ED431C 2017/64-GRC “Programa de Consolidación e Estruturación de Unidades de Investigación Competitivas (Grupos de Referencia Competitiva).” Piña-Rey A. was supported by Xunta de Galicia Pre-doctoral Period Support Program (ED481A-2017/209). González–Fernández E. was supported by the FPU Formación de Profesorado Universitario grant from Ministerio de Ciencia, Innovación y Universidades (FPU15/03343). National Funds through FCT–Scholarship (SFRH/BDP/125686/2016) of Fernández-González M.

Conflicts of Interest

The authors declare no conflict of interest.

References

  1. Lazoglou, G.; Anagnostopoulou, C.; Koundouras, S. Climate change projections for Greek viticulture as simulated by a regional climate model. Theor. Appl. Climatol. 2018, 133, 551–567. [Google Scholar] [CrossRef]
  2. Ewert, F.; Rounsevell, M.D.A.; Reginster, I.; Metzger, M.J.; Leemans, R. Future scenarios of European agricultural land use: I. Estimating changes in crop productivity. Agric. Ecosyst. Environ. 2005, 107, 101–116. [Google Scholar] [CrossRef]
  3. Ollat, N.; Van Leeuwen, C.; de Cortazar-Atauri, I.G.; Touzard, J.M. The challenging issue of climate change for sustainable grape and wine production. OENO One 2017, 51, 58–60. [Google Scholar] [CrossRef] [Green Version]
  4. Teslić, N.; Zinzani, G.; Parpinello, G.P.; Versari, A. Climate change trends; grape production; and potential alcohol concentration in wine from the “Romagna Sangiovese” appellation area (Italy). Theor. Appl. Climatol. 2018, 131, 793–803. [Google Scholar] [CrossRef]
  5. Jones, G.V.; White, M.A.; Cooper, O.R.; Storchmann, K. Climate change and global wine quality. Clim. Chang. 2005, 73, 319–343. [Google Scholar] [CrossRef]
  6. Kenny, G.J.; Harrison, P.A. The effects of climate variability and change on grape suitability in Europe. J. Wine Res. 1992, 3, 163–183. [Google Scholar] [CrossRef]
  7. Butterfield, R.E.; Gawith, M.J.; Harrison, P.A.; Lonsdale, K.J.; Orr, J. Modelling climate change impacts on wheat; potato and grapevine in Great Britain. In Climate Change; Climate Variability and Agriculture in Europe: An Integrated Assessment; Final Report; Environmental Change Institute, Downing, T.E., Harrison, P.A., Butterfield, R.E., Lonsdale, K.G., Eds.; University of Oxford: Oxford, UK, 2000. [Google Scholar]
  8. Gladstones, J. Viticulture and Environment; Winetitles: Adelaide, Australia, 1992. [Google Scholar]
  9. Hall, A.; Jones, G.V. Effect of potential atmospheric warming on temperature-based indices describing Australian winegrape growing conditions. Aust. J. Grape Wine Res. 2009, 15, 97–119. [Google Scholar] [CrossRef]
  10. Jones, G.V.; Moriondo, M.; Bois, B.; Hall, A.; Duff, A. Analysis of the spatial climate structure in viticulture regions worldwide. Bull. Off. Int. Vigne Vin 2009, 82, 507–517. [Google Scholar]
  11. Nastos, P.T.; Matzarakis, A.P. Variability of tropical days over Greece within the second half of the twentieth century. Theor. Appl. Climatol. 2008, 93, 75–89. [Google Scholar] [CrossRef]
  12. Nastos, P.T.; Philandras, C.M.; Founda, D.; Zerefos, C.S. Air temperature trends related to changes in atmospheric circulation in the wider area of Greece. Int. J. Remote Sens. 2011, 32, 737–750. [Google Scholar] [CrossRef]
  13. Mavromatis, T. Changes in exceptional hydrological and meteorological weekly event frequencies in Greece. Clim. Chang. 2012, 110, 249–267. [Google Scholar] [CrossRef]
  14. Matzarakis, A.; Ivanova, D.; Balafoutis, C.; Makrogiannis, T. Climatology of growing degree days in Greece. Clim. Res. 2007, 34, 233–240. [Google Scholar] [CrossRef]
  15. Jackson, D.I.; Lombard, P.B. Environmental and management practices affecting grape composition and wine quality. A review. Am. J. Enol. Vitic. 1993, 44, 409–430. [Google Scholar]
  16. Ramos, M.C.; Jones, G.V.; Martínez-Casasnovas, J.A. Structure trends in climate parameters affecting winegrape production in Northeast Spain. Clim. Res. 2008, 38, 1–15. [Google Scholar] [CrossRef] [Green Version]
  17. Parker, A.K.; García de Cortázar-Atauri, I.; Gény, L.; Spring, J.L.; Destrac, A.; Schultz, H.; Molitor, D.; Lacombe, T.; Graça, A.; Monamy, C.; et al. Temperature-based grapevine sugar ripeness modelling for a wide range of Vitis vinifera L. cultivars. Agric. For. Meteorol. 2020, 285–286, 107902. [Google Scholar] [CrossRef]
  18. Sadras, V.O.; Moran, M.A. Elevated temperature decouples anthocyanins and sugars in berries of Shiraz and Cabernet Franc. Aust. J. Grape Wine Res. 2012, 18, 115–122. [Google Scholar] [CrossRef]
  19. Cohen, S.D.; Tarara, J.M.; Kennedy, J.A. Assessing the impact of temperature on grape phenolic metabolism. Anal. Chim. Acta 2008, 621, 57–67. [Google Scholar] [CrossRef]
  20. Spayd, S.E.; Tarara, J.M.; Mee, D.L.; Ferguson, J.C. Separation of sunlight and temperature effects on the composition of Vitis vinifera cv. Merlot berries. Am. J. Enol. Vitic. 2002, 53, 171–182. [Google Scholar]
  21. Schultz, H.R.; Jones, G.V. Climate induced historic and future changes in viticulture. J. Wine Res. 2010, 21, 137–145. [Google Scholar] [CrossRef]
  22. Jarvis, C.; Darbyshire, I.; Goodwin, I.; Barlow, R.; Eckard, R. Spatial variation in springtime temperature index values during ENSO and IOD events shows non-equivalent phase response for viticultural regions in Australia. Agric. For. Meteorol. 2018, 250, 217–225. [Google Scholar] [CrossRef]
  23. Webb, L.B.; Whetton, P.H.; Barlow, E.W.R. Observed trends in winegrape maturity in Australia. Glob. Chang. Biol. 2011, 17, 2707–2719. [Google Scholar] [CrossRef]
  24. Godden, P.; Wilkes, E.; Johnson, D. Trends in the composition of Australian wine 1984–2014. Aust. J. Grape Wine Res. 2015, 21, 741–753. [Google Scholar] [CrossRef]
  25. Vrsic, S.; Vodovnik, T. Reactions of grape varieties to climate changes in North East Slovenia. Plant Soil Environ. 2012, 58, 34–41. [Google Scholar] [CrossRef] [Green Version]
  26. Dry, P.R.; Coombe, B.G.; Anderson, C.J. Viticulture, 2nd ed.; Winetitles: Adelaide, Australia, 2004. [Google Scholar]
  27. Neethlinga, E.; Barbeaua, G.; Coulon-Leroya, C.; Quénol, H. Spatial complexity and temporal dynamics in viticulture: A review of climate-driven scales. Agric. For. Meteorol. 2019, 276–277, 107618. [Google Scholar] [CrossRef]
  28. Quénol, H. Observation et Modélisation Spatiale du Climat aux Échelles Fines dans un Contexte de Changement Climatique Volume 1: Position et Projet Scientifique; Unité Mixte de Recherche 6554 LETG du CNRS Université de Rennes 2 Haut-Bretagne: Rennes, France, 2012; p. 103. [Google Scholar]
  29. Hall, A.; Jones, G.V. Spatial analysis of climate in winegrape-growing regions in Australia. Aust. J. Grape Wine Res. 2010, 16, 389–404. [Google Scholar] [CrossRef]
  30. Bonnefoy, C.; Quénol, H.; Planchon, O.; Barbeau, G. Températures et indices bioclimatiques dans le vignoble du Val de Loire dans un contexte de changement climatique. EchoGéo 2010, 14, 1–13. [Google Scholar] [CrossRef]
  31. Malheiro, A.C.; Santos, J.A.; Fraga, H.; Pinto, J.G. Climate change scenarios applied for viticultural zoning in Europe. Clim. Res. 2010, 43, 163–177. [Google Scholar] [CrossRef] [Green Version]
  32. Fraga, H.; Malheiro, A.C.; Moutinho-Pereira, J.; Jones, G.V.; Alves, F.; Pinto, J.G.; Santos, J.A. Very high resolution bioclimatic zoning of Portuguese wine regions: Present and future scenarios. Reg. Environ. Chang. 2014, 14, 295–306. [Google Scholar] [CrossRef]
  33. Fraga, H.; Malheiro, A.C.; Moutinho-Pereira, J.; Santos, J.A. Future scenarios for viticultural zoning in Europe: Ensemble projections and uncertainties. Int. J. Biometeorol. 2013, 57, 909–925. [Google Scholar] [CrossRef]
  34. Amerine, M.A.; Winkler, A.J. Composition and quality of musts and wines of California grapes. Hilgardia 1944, 15, 493–673. [Google Scholar] [CrossRef] [Green Version]
  35. Huglin, P. Nouveau mode d’évaluation des possibilités héliothermiques d’un milieu viticole. Comptes Rendus de l’Académie d’Agriculture de France 1978, 64, 1117–1126. [Google Scholar]
  36. Gladstones, J. Wine, Terroir and Climate Change; Wakefield Press: Adelaide, Australia, 2011; pp. 112–129. [Google Scholar]
  37. Tonietto, J.; Carbonneau, A. A multicriteria climatic classification system for grape growing regions worldwide. Agric. Meteorol. 2004, 124, 81–97. [Google Scholar] [CrossRef] [Green Version]
  38. Hidalgo, L.H. Tratado de Viticultura General; Mundi-Prensa: Madrid, Spain, 2002. [Google Scholar]
  39. Fregoni, M. L‘Indice Bioclimatico di Qualitá Fregoni. In Terroir, Zonazione, Viticoltura; Fregoni, M., Schuster, D., Paoletti, A., Eds.; Phytoline Press: Piacenza, Italy, 2003; pp. 115–127. [Google Scholar]
  40. Blanco-Ward, D.; Queijeiro, J.M.; Jones, G.V. Spatial climate variability and viticulture in the Miño River Valley of Spain. Vitis 2007, 46, 63–70. [Google Scholar]
  41. Jones, G.V.; Duff, A.A.; Hall, A.; Myers, J.W. Spatial analysis of climate in winegrape growing regions in the western United States. Am. J. Enol. Vitic. 2010, 61, 313–326. [Google Scholar]
  42. Jones, G.V. Climate, grapes, wine: Structure and suitability in a changing climate. Acta Hortic. 2012, 931, 19–28. [Google Scholar] [CrossRef]
  43. Honorio, F.; García-Martín, A.; Moral, F.J.; Paniagua, L.L.; Rebollo, F.J. Spanish vineyard classification according to bioclimatic indexes. Aust. J. Grape Wine Res. 2018, 24, 335–344. [Google Scholar] [CrossRef]
  44. Le Roux, R.; de Rességuier, L.; Corpetti, T.; Jégou, N.; Madelin, M.; van Leeuwen, C.; Quénol, H. Comparison of two fine scale spatial models for mapping temperatures inside winegrowing areas. Agric. For. Meteorol. 2017, 247, 159–169. [Google Scholar] [CrossRef]
  45. Herrera, S.; Fernández, J.; Gutiérrez, J.M. Update of the Spain02 Gridded Observational Dataset for Euro-CORDEX evaluation: Assessing the Effect of the Interpolation Methodology. Int. J. Climatol. 2016, 36, 900–908. [Google Scholar] [CrossRef] [Green Version]
  46. Orriols, I.; Vázquez, I.; Losada, A. Variedades gallegas. Terruños 2006, 16, 11–18. [Google Scholar]
  47. Fernández-González, M.; Rodríguez-Rajo, F.J.; Escuredo, O.; Aira, M.J. Optimization of integrated pest management for powdery mildew (Uncinula necator) control in a vineyard based on a combination of phenological; meteorological and aerobiological data. J. Agric. Sci. 2013, 151, 648–658. [Google Scholar] [CrossRef]
  48. Fernández-Calviño, D.; Nóvoa-Muñoz, J.C.; López-Periago, E.; Arias-Estévez, M. Changes in copper content and distribution in young; old and abandoned vineyard acid soils due to land use changes. Land Degrad. Dev. 2008, 19, 165–177. [Google Scholar] [CrossRef]
  49. Huglin, P. Biologie et Écologie de la Vigne; Lausanne, P., Ed.; Technique et Documentation: Paris, France, 1986. [Google Scholar]
  50. Winkler, A.J.; Cook, J.A.; Kliewere, W.M.; Lider, L.A. General Viticulture, 4th ed.; University of California Press: Berkeley, CA, USA, 1974. [Google Scholar]
  51. Tonietto, J. Les Macroclimats Viticoles Mondiaux et L’influence du Mésoclimat sur la Typicité de la Syrah et du Muscat de Hambourg dans le sud de la France: Méthodologie de Caráctérisation. Ph.D. Thesis, Ecole Nationale Supérieure Agronomique, Montpellier, France, 1999. [Google Scholar]
  52. Santos, J.A.; Malheiro, A.C.; Pinto, J.G.; Jones, G.V. Macroclimate and viticultural zoning in Europe: Observed trends and atmospheric forcing. Clim. Res. 2012, 51, 89–103. [Google Scholar] [CrossRef] [Green Version]
  53. Branas, J.; Bernon, G.; Levadoux, L. Eléments de Viticulture Générale; Imp. Dehan: Montpellier, France, 1946. [Google Scholar]
  54. Lorenzo, M.N.; Taboada, J.J.; Lorenzo, J.F.; Ramos, A.M. Influence of climate on grape production and wine quality in the Rías Baixas; north-western Spain. Reg. Environ. Chang. 2013, 13, 887–896. [Google Scholar] [CrossRef]
  55. Briche, E.; Beltrando, G.; Somot, S.; Quenol, H. Critical analysis of simulated daily temperature data from the ARPEGE-climate model: Application to climate change in the Champagne wine-producing region. Clim. Chang. 2014, 123, 241–254. [Google Scholar] [CrossRef]
  56. Kliewer, W.M.; Torres, R.E. Effect of controlled day and night temperatures on grape coloration. Am. J. Enol. Vitic. 1972, 2, 71–77. [Google Scholar]
  57. Kliewer, W.M. Berry composition of Vitis vinifera cultivars as influenced by photo and nycto-temperatures during maturation. J. Am. Soc. Hortic. Sci. 1973, 2, 153–159. [Google Scholar]
  58. Tomana, T.; Utsunomiya, N.; Dataoka, I. The effect of environmental temperatures on fruit on ripening on the tree. J. Jpn. Soc. Hortic. Sci. 1979, 48, 261–266. [Google Scholar] [CrossRef] [Green Version]
  59. Jacob, D.; Petersen, J.; Eggert, B.; Alias, A.; Christensen, O.B.; Bouwer, L.M.; Braun, A.; Colette, A.; Deque, M.; Georgievski, G.; et al. EURO-CORDEX: New high-resolution climate change projections for European impact research. Reg. Environ. Chang. 2014, 14, 563–578. [Google Scholar] [CrossRef]
  60. Taylor, K.E. Summarizing multiple aspects of model performance in a single diagram. J. Geophys. Res. 2001, 106, 7183–7192. [Google Scholar] [CrossRef]
  61. Dong, S.; Xu, Y.; Zhou, B.; Shi, Y. Assessment of indices of temperature extremes simulated by multiple CMIP5 models over China. Adv. Atmos. Sci. 2015, 32, 1077–1091. [Google Scholar] [CrossRef]
  62. Gimeno, L.; Ribera, P.; Iglesias, R.; de la Torre, L.; García, R.; Hernández, E. Identification of empirical relationships between indices of ENSO and NAO and agricultural yields in Spain. Clim. Res. 2002, 21, 165–172. [Google Scholar] [CrossRef] [Green Version]
  63. Mann, H.B. Nonparametric tests against trend. Econometrica 1945, 13, 245–259. [Google Scholar] [CrossRef]
  64. Kendall, M.G. Rank Correlation Methods; Griffin: London, UK, 1975. [Google Scholar]
  65. Lorenzo, M.N.; Taboada, J.J. Future Scenarios for Viticultural Zoning in Spain Using a Multiple Linear Regression Model with the EURO-CORDEX Database. In A Closer Look at Grapes, Wines and Winemaking; Nova Science Publishers: New York, NY, USA, 2018; pp. 223–244. [Google Scholar]
  66. Badr, G.; Hoogenboom, G.; Abouali, M.; Moyer, M.; Keller, M. Analysis of several bioclimatic indices for viticultural zoning in the Pacific Northwest. Clim. Res. 2018, 76, 203–223. [Google Scholar] [CrossRef]
  67. Fraga, H.; García de Cortázar, I.; Malheiro, A.; Santos, J. Modelling climate change impacts on viticultural yield, phenology and stress conditions in Europe. Glob. Chang. Biol. 2016, 22, 3774–3788. [Google Scholar] [CrossRef]
  68. Fraga, H.; Santos, J.A.; Moutinho-Pereira, J.; Carlos, C.; Silvestre, J.; Eiras-Dias, J.; Mota, T.; Malheiro, A.C. Statistical modelling of grapevine phenology in Portuguese wine regions: Observed trends and climate change projections. J. Agric. Sci 2016, 154, 795–811. [Google Scholar] [CrossRef] [Green Version]
  69. Koufos, G.; Mavromatis, T.; Koundouras, S.; Fyllas, N.M.; Jones, G.V. Viticulture-climate relationships in Greece: The impacts of recent climate trends on harvest date variation. Int. J. Climatol. 2014, 34, 1445–1459. [Google Scholar] [CrossRef]
  70. Olsson, C.; Jonsson, A.M. Budburst model performance: The effect of the spatial resolution of temperature data sets. Agric. For. Meteorol. 2015, 200, 302–312. [Google Scholar] [CrossRef]
  71. Orlandi, F.; Bonofiglio, T.; Aguilera, F.; Fornaciari, M. Phenological characteristics of different winegrape cultivars in Central Italy. Vitis 2015, 54, 129–136. [Google Scholar]
  72. Ramos, M.C.; Jones, G.V.; Yuste, J. Phenology and grape ripening characteristics of cv Tempranillo within the Ribera del Duero designation of origin (Spain): Influence of soil and plot characteristics. Eur. J. Agron. 2015, 70, 57–70. [Google Scholar] [CrossRef]
  73. Bock, A.; Sparks, T.H.; Estrella, N.; Menzel, A. Climate-induced changes in grapevine yield and must sugar content in Franconia (Germany) between 1805 and 2010. PLoS ONE 2013, 8, e69015. [Google Scholar] [CrossRef]
  74. Costantini, E.A.C.; Lorenzetti, R.; Malorgio, G. A multivariate approach for the study of environmental drivers of wine economic structure. Land Use Policy 2016, 57, 53–63. [Google Scholar] [CrossRef]
  75. Makra, L.; Vitanyi, B.; Gal, A.; Mika, J.; Matyasovszky, I.; Hirsch, T. Wine quantity and quality variations in relation to climate factors in the Tokaj (Hungary) Winegrowing Region. Am. J. Enol. Vitic. 2009, 60, 312–321. [Google Scholar]
  76. Mira de Orduña, R. Climate change associated effects on grape wine quality production. Food Res. Int. 2010, 43, 1844–1855. [Google Scholar] [CrossRef]
  77. Beelman, R.B.; Gallander, J.F. Wine deacidification. Adv. Food Res. 1979, 25, 1–53. [Google Scholar]
  78. Hanson, C.E.; Palutikof, J.P.; Livermore, M.T.J.; Barring, L.; Bindi, M.; Corte-Real, J.; Durao, R.; Giannakopoulos, C.; Good, P.; Holt, T.; et al. Modelling the impact of climate extremes: An overview of the MICE project. Clim. Chang. 2007, 81, 163–177. [Google Scholar] [CrossRef]
  79. Fraga, H. Climate Change: A New Challenge for the Winemaking Sector. Agronomy 2020, 10, 1465. [Google Scholar] [CrossRef]
  80. Biasi, R.; Brunori, E.; Ferrara, C.; Salvati, L. Assessing impacts of Climate Change on phenology and quality traits of Vitis vinifera L.: The contribution of local knowledge. Plants 2019, 8, 121. [Google Scholar] [CrossRef] [Green Version]
  81. Sánchez, A.; Martínez-Graña, A.M.; Santos-Francés, F.; Yenes, M. Index for the calculation of future wine areas according to climate change application to the protected designation of origin “Sierra de Salamanca” (Spain). Ecol. Indic. 2019, 107, 105646. [Google Scholar] [CrossRef]
  82. Teslic, N.; Vujadinovic, M.; Rumi, M.; Ricci, A.; Vukovic, A.; Parpinello, G.; Versari, A. Future climatic suitability of the Emilia-Romagna (Italy) region for grape production. Reg. Environ. Chang. 2019, 19, 599–614. [Google Scholar] [CrossRef]
  83. Jones, G.V. Climate change in the western United States grape growing regions. Acta Hortic. 2005, 689, 41–60. [Google Scholar] [CrossRef]
  84. van Leeuwen, C.; Roby, J.-P.; Alonso-Villaverde, V.; Gindro, K. Impact of Clonal Variability in Vitis vinifera Cabernet franc on Grape Composition, Wine Quality, Leaf Blade Stilbene Content, and Downy Mildew Resistance. J. Agric. Food Chem. 2013, 61, 19–24. [Google Scholar] [CrossRef] [PubMed] [Green Version]
  85. van Leeuwen, C.; Destrac-Irvine, A. Modified grape composition under climate change conditions requires adaptations in the vineyard. OENO One 2017, 51, 147–154. [Google Scholar] [CrossRef]
  86. Parker, A.K.; Hofmann, R.W.; van Leeuwen, C.; McLachlan, A.R.G.; Trought, M.C.T. Leaf area to fruit mass ratio determines the time of veraison in Sauvignon Blanc and Pinot Noir grapevines. Aust. J. Grape Wine Res. 2014, 20, 422–431. [Google Scholar] [CrossRef]
  87. Friend, A.P.; Trought, M.C.T. Delayed winter spur-pruning in New Zealand can alter yield components of Merlot grapevines. Aust. J. Grape Wine Res. 2007, 13, 157–164. [Google Scholar] [CrossRef]
  88. Fraga, H.; Atauri, I.G.D.; Malheiro, A.C.; Moutinho-Pereira, J.; Santos, J.A. Viticulture in Portugal: A review of recent trends and climate change projections. OENO One 2017, 51, 61–69. [Google Scholar] [CrossRef] [Green Version]
  89. Malheiro, A.C.; Campos, R.; Fraga, H.; Eiras-Dias, J.; Silvestre, J.; Santos, J.A. Winegrape phenology and temperature relationships in the Lisbon wine region, Portugal. J. Int. Sci. Vigne Vin. 2013, 47, 287–299. [Google Scholar] [CrossRef] [Green Version]
  90. Adams, D.O. Phenolics and ripening in grape berries. Am. J. Enol. Vitic. 2006, 57, 249–256. [Google Scholar]
  91. Jones, G.V. Making wine in a changing climate. Geotimes 2004, 49, 24–27. [Google Scholar]
  92. Kliewer, W.M. Effect of day temperature and light intensity on concentration of malic and tartaric acids in Vitis vinifera L. grapes. J. Am. Soc. Hortic. Sci. 1971, 96, 372–377. [Google Scholar]
  93. Cheynier, V.; Dueñas-Paton, M.; Salas, E.; Maury, C.; Souquet, J.M.; Sarni-Machado, P.; Fulcrand, H. Structure and properties of wine pigments and tannins. Am. J. Enol. Vitic. 2006, 57, 298–305. [Google Scholar]
  94. Bock, A.; Sparks, T.; Estrella, N.; Menzel, A. Changes in the phenology and composition of wine from Franconia, Germany. Clim. Res. 2011, 50, 69–81. [Google Scholar] [CrossRef] [Green Version]
  95. van Leeuwen, S. The concept of terroir in viticulture. J. Wine Res. 2006, 17, 1–10. [Google Scholar] [CrossRef]
  96. Fernández-González, M.; Escuredo, O.; Rodríguez-Rajo, F.J.; Aira, M.J.; Jato, V. Prediction of grape production by grapevine cultivar Godello in north-west Spain. J. Agric. Sci. 2011, 149, 725–736. [Google Scholar] [CrossRef]
  97. Fernández-González, M.; Rodríguez-Rajo, F.J.; Jato, V.; Escuredo, O.; Aira, M.J. Estimation of yield ’Loureira’ variety with an aerobiological and phenological model. Grana 2011, 50, 63–72. [Google Scholar] [CrossRef]
  98. Jagosz, B.; Rolbiecki, S.; Stachowski, P.; Ptach, W.; Łangowski, A.; Kasperska-Wołowicz, W.; Sadan, H.; Rolbiecki, R.; Prus, P.; Kazula, M.J. Assessment of water needs of grapevines in western Poland from the perspective of climate change. Agriculture 2020, 10, 477. [Google Scholar] [CrossRef]
  99. Fraga, H.; Malheiro, A.C.; Moutinho-Pereira, J.; Cardoso, R.M.; Soares, P.M.M.; Cancela, J.J.; Pinto, J.G.; Santos, J.A. Integrated analysis of climate; soil; topography and vegetative growth in Iberian viticultural regions. PLoS ONE 2014, 9, e108078. [Google Scholar] [CrossRef]
  100. Lebon, E.; Dumas, V.; Pieri, P.; Schultz, H. Modelling the seasonal dynamics of the soil water balance of vineyards. Funct. Plant Biol. 2003, 30, 699–710. [Google Scholar] [CrossRef]
  101. Permanhani, M.; Miguel Costa, J.M.; Conceição, M.A.F.; de Souza, R.T.; Vasconcelos, M.A.S.; Chaves, M.M. Deficit irrigation in table grape: Eco-physiological basis and potential use to save water and improve quality. Theor. Exp. Plant Physiol. 2016, 28, 85–108. [Google Scholar] [CrossRef] [Green Version]
  102. Lorenzo, M.N.; Ramos, A.M.; Brands, S. Present and future climate conditions for winegrowing in Spain. Reg. Environ. Chang. 2016, 16, 617–627. [Google Scholar] [CrossRef]
  103. Fraga, H.; García de Cortázar Atauri, I.; Santos, J.A. Viticultural irrigation demands under climate change scenarios in Portugal. Agric. Water Manag. 2018, 196, 66–74. [Google Scholar] [CrossRef]
  104. Carbonneau, A. The Early Selection of Grapevine Rootstocks for Resistance to Drought Conditions. Am. J. Enol. Vitic. 1985, 36, 195–198. [Google Scholar]
  105. Schultz, H.R. Differences in hydraulic architecture account for near-isohydric and anisohydric behaviour of two field-grown Vitis vinifera L. cultivars during drought. Plant. Cell Environ. 2003, 26, 1393–1405. [Google Scholar] [CrossRef]
  106. Fernández-González, M.; Ramos-Valcárcel, D.; Aira, M.J.; Rodríguez-Rajo, F.J. Prediction of biological sensors appearance with ARIMA models as a tool for integrated pest management protocols. Ann. Agric. Environ. Med. 2016, 23, 129–137. [Google Scholar] [CrossRef] [PubMed]
  107. Fernández-González, M.; Piña-Rey, A.; González-Fernández, E.; Aira, M.J.; Rodríguez-Rajo, F.J. First assessment of Goidanich Index and aerobiological data for Plasmopara viticola infection risk management in north-west Spain. J. Agric. Sci. 2019, 157, 129–139. [Google Scholar] [CrossRef]
  108. González-Fernández, E.; Piña-Rey, A.; Fernández-González, M.; Aira, M.J.; Rodríguez-Rajo, F.J. Identification and evaluation of the main risk periods of Botrytis cinerea infection on grapevine based on phenology, weather conditions and airborne conidia. J. Agric. Sci. 2020, 158, 88–98. [Google Scholar] [CrossRef]
Figure 1. Location of five Designation of Origin Areas in Galicia (Northwestern Spain) and the two Bioclimatic regions (Eurosiberian and Mediterrranean).
Agriculture 10 00605 g001
Figure 2. Taylor diagrams for the six bioclimatic indices of the five considered Designations of Origin areas. Ribeiro(2000-2015) ■, Valdeorras ▲, Monterrei ◆, Ribeira Sacra ★, Rías Baixas ●.
Agriculture 10 00605 g002
Figure 3. Maps of the mean values of the bioclimatic indices analyzed for the 1950–2015 period and for the 2000–2015 period. Symbols mark the DO area (Ribeiro ■, Valdeorras ▲, Monterrei ◆, Ribeira Sacra ★, Rías Baixas ●) for the different indices.
Agriculture 10 00605 g003
Figure 4. Trends by decade of bioclimatic indices during the 1950–2015 period only taking into account significant trends at 95 percent level using a Mann-Kendall test. Ribeiro ■, Valdeorras ▲, Monterrei ◆, Ribeira Sacra ★, Rías Baixas ●.
Agriculture 10 00605 g004
Figure 5. Trends by decade of bioclimatic indices during the 2000–2015 period only taking into account significant trends at 95 percent level using a Mann-Kendall test. Ribeiro ■, Valdeorras ▲, Monterrei ◆, Ribeira Sacra ★, Rías Baixas ●.
Agriculture 10 00605 g005
Figure 6. Projections for the 2061–2095 period. Delta-change estimates obtained by subtracting the MLR of the control integration (1971–2005) from the MLR of the RCP4.5 and RCP8.5 scenario integrations (2061–2095).
Agriculture 10 00605 g006
Table 1. Characteristics of the designation origin areas.
DOCoordinatesArea (Ha.)Altitude (m.)Cultivars
Rías Baixas (Eurosiberian)42° N 25′22″/8° W 47′7″40610–300Albariño
Ribeiro (Transition zone)42° N 17′16″/8° W 8′34″268575–400Treixadura
Ribeira Sacra (Transition zone)42° N 25′57″/7° W 40′1″2500200–400Mencía
Valdeorras (Mediterranean)42° N 24′27″/7° W 0′24″1286300–700Godello
Monterrei (Mediterranean)41° N 56′18″/7° W 26′20″650300–650Godello
Table 2. Climate indices, equations and sources.
Index and AbbreviationEquationSource
Winkler index (WI) 01 / 04 31 / 10 ( T m a x + T m i n ) 2 10 Winkler et al., 1974
Huglin index (HI) 01 / 04 30 / 09 [ ( T a v g 10 ) + ( T m a x 10 ) 2 ] d Huglin 1978
Cool night index (CI) C I = T min S e p t e m b e r Tonietto 1999
Hydrothermic index of Branas, Bernon, and Levadoux (BBLI) 01 / 04 31 / 08 T a v g P a m o u n t Branas et al., 1946
GSS% day T a v g > 10 °CMalheiro et al., 2010; Santos et al., 2012
GSP 01 / 04 30 / 09 P a m o u n t Blanco-Ward et al., 2007
Tmax, Tmin, Tavg: maximum, minimum and average temperatures (°C). d: correction coefficient for the average daylight period in the studied latitude (40–50°). Pamount: monthly accumulated precipitation (mm).
Table 3. Summary of temperatures and rainfall during the grapevine growing season (from 1 August to 31 October) in the studied designation origin (DO) areas during the 2000–2015 period.
DOsParametersMeanR2Slopep Level
Rias Baixas (Eurosiberian)T mean (°C)17.090.440.140.027
T max (°C)22.770.270.150.100
T min (°C)12.640.350.100.054
Precipitation (mm)742.670.35−56.180.056
Ribeiro (Transition zone)T mean (°C)17.430.400.100.038
T max (°C)25.420.290.170.087
T min (°C)11.370.470.170.019
Precipitation (mm)416.730.02−4.800.650
Ribeira Sacra (Transition zone)T mean (°C)17.370.700.210.001
T max (°C)25.430.540.290.010
T min (°C)10.550.620.100.004
Precipitation (mm)322.160.05−6.330.511
Monterrei (Mediterranean)T mean (°C)17.080.390.130.039
T max (°C)24.640.630.300.003
T min (°C)10.550.020.020.647
Precipitation (mm)340.720.03−4.200.614
Valdeorras (Mediterranean)T mean (°C)16.940.620.190.004
T max (°C)24.440.440.210.026
T min (°C)10.500.770.130.000
Precipitation (mm)269.900.00−0.890.266
Table 4. Results of the six bioclimatic indices of each DO areas during the 2000–2015 period and their trends.
Dos (Bioclimatic Region)IndexMeanSDR2Slopep Level
Rias Baixas (Eurosiberian)WI1516.63146.990.4429.280.026
HI1915.97140.700.3324.450.063
BBLI6232.493557.450.47−735.850.019
CI13.891.110.000.020.878
GSS96.772.670.120.270.307
GSP530.04278.610.32−47.780.067
Ribeiro (Transition zone)WI1590.67174.560.4021.400.038
HI2256.92194.160.4231.950.031
BBLI3242.17882.290.07−76.300.424
CI12.161.010.02−0.050.717
GSS95.733.270.060.230.182
GSP280.5187.010.00−1.140.890
Ribeira Sacra (Transition zone)WI1576.22149.510.7043.950.001
HI2253.30180.400.6547.370.002
BBLI3040.38973.370.12−92.770.293
CI11.341.010.050.070.519
GSS95.584.540.200.440.167
GSP254.8380.310.07−7.130.419
Monterrei (Mediterranean)WI1515.05169.710.3928.170.039
HI2148.78172.880.5740.930.007
BBLI2727.68529.280.19−128.210.139
CI11.701.020.15−0.120.245
GSS93.344.500.000.140.758
GSP244.6048.770.08−6.690.410
Valdeorras (Mediterranean)WI1486.16112.760.6240.290.004
HI2107.52163.710.5137.150.013
BBLI2396.36941.620.01−16.500.762
CI11.601.300.100.100.346
GSS93.143.260.110.440.328
GSP205.7981.100.00−0.700.890
Publisher’s Note: MDPI stays neutral with regard to jurisdictional claims in published maps and institutional affiliations.

