Article

Organic Matter Composition and Phosphorus Speciation of Solid Waste from an African Catfish Recirculating Aquaculture System

by
Julia Prüter
1,*,
Sebastian Marcus Strauch
2,
Lisa Carolina Wenzel
2,
Wantana Klysubun
3,
Harry Wilhelm Palm
2 and
Peter Leinweber
1
1
Soil Science, Faculty of Agricultural and Environmental Science, University of Rostock, D-18051 Rostock, Germany
2
Department of Aquaculture and Sea-Ranching, Faculty of Agricultural and Environmental Science, University of Rostock, D-18051 Rostock, Germany
3
Synchrotron Light Research Institute, Muang District, 111 Moo 6 University Avenue, Nakhon Ratchasima 3000, Thailand
*
Author to whom correspondence should be addressed.
Agriculture 2020, 10(10), 466; https://doi.org/10.3390/agriculture10100466
Submission received: 11 September 2020 / Revised: 6 October 2020 / Accepted: 7 October 2020 / Published: 11 October 2020
(This article belongs to the Section Agricultural Systems and Management)

Abstract

:
Recycling of phosphorus (P) from feed input in aquaculture systems gains increasing importance, especially relating to sustainable agriculture and food production. In order to find possible areas of application of African catfish solid waste, the purpose of this study was to characterize the elemental and organic matter composition and P speciation in the aquaculture fish waste. Pyrolysis-field ionization mass spectrometry (Py-FIMS) was used to investigate the composition of organic matter and P K-edge X-ray absorption near edge structure (XANES) spectroscopy to describe the occurring P-containing compounds in African catfish solid waste from an intensive recirculation aquaculture system (RAS). The solid fish waste was mainly composed of sterols, free fatty acids and alkylaromatics, as it is common for digestive systems of animals. Ingredients such as the phytosterol beta-sitosterin confirm plant-based feed ingredients and some recalcitrance against digestion in the African catfish gut. The P in the solid fish waste was exclusively bound as calcium-phosphates. These calcium-phosphate minerals as major constituents of African catfish waste may have beneficial effects when applied to soils, suggesting the use of this waste as possible soil amendment in the future.

1. Introduction

Phosphorus (P) is one essential element for organism growth and a key factor limiting the primary production of plants in various ecosystems [1]. Developing circular flows of P in agriculture can enhance the environmental sustainability of P use [2,3]. Recycling P from biological waste materials contributes to a sustainable P management [4,5]. Intensive recirculation aquaculture systems (RAS) have the potential to become one of the most sustainable animal protein production systems [6]. Nevertheless, up to 80% of carbon (C), 76% of nitrogen (N) and 82% of P from total feed input in aquaculture can be lost to the environment [7,8]. Thus, to assess possible environmental impacts and to enable nutrient reuse, it is highly relevant to identify the composition of aquaculture fish waste [9].
The characteristics of traditional agricultural waste, such as compost [10], farmyard manure from animal production systems for pigs, poultry and cattle [11], slurry [12], sewage sludge [13] and digestates from biogas plants [14] have been intensively researched, and these materials are widely used as organic amendments and P fertilizers in arable soils. Solid waste from modern aquaculture systems, especially intensive African catfish RAS, has scarcely been investigated to date. A recent investigation demonstrated that the reuse of nutrients from commercial African catfish RAS in aquaponics can reduce the demand for mineral fertilizer in plant production because it contains substantial amounts of P and organic matter [15]. However, the chemical composition of that organic matter is completely unknown. Pyrolysis-field ionization mass spectrometry (Py-FIMS) has been used to characterize the composition of organic matter in complex matrices, such as fertilized soils [16], municipal solid waste leachates [17], agro-industrial byproducts [18], biochars [19], pig slurry [20] or chicken manure [21], but not yet applied to solid waste from African catfish RAS.
The P K-edge X-ray absorption near edge structure (XANES) spectroscopy is a promising method to describe the P speciation of different environmental materials. Several studies used this technique to disclose the P speciation, for example, in soils of different genesis [22,23,24,25,26], fertilized and organically amended soils [27], soils treated with biosolids [28], poultry litter [29], in poultry manure [30] and in sediments [31,32,33]. Fish fecal matter has not yet been investigated by this Pspeciation method leaving the P speciation of solid RAS waste almost unknown. Furthermore, this material can be transported over long distances and contribute to the composition of sediments at sea bottoms [34]. For the above knowledge gaps concerning P in fish fecal matter there is no indication whether distinct P compounds occurring at the bottom of aquatic environments can have their origin in fish fecal matter. Furthermore, to support the idea of closed nutrient cycles and to estimate the suitability of solid waste from African catfish RAS as possible soil amendment, data on P speciation and the specific organic matter composition are urgently needed.
Thus, the aims of this study were (1) to characterize the organic matter composition of African catfish RAS solid waste with Py-FIMS and (2) to disclose the P speciation of this waste with XANES spectroscopy.

2. Materials and Methods

2.1. Solid Waste Samples

Sampling was conducted on 8 May 2017 at the research facilities of the FishGlassHouse at the University of Rostock (Faculty of Agricultural and Environmental Sciences), Germany. Within the scope of sampling, settled solids from three semi-commercial African catfish (Clarias gariepinus) RAS were collected. The fish were fed with Skretting ME-4.5 Meerval Top with 42% crude protein (consisting of processed proteins from poultry, wheat, fish meal, soya meal feed, corn gluten feed, wheat gluten), 13% crude fat (poultry oil, fish oil), 1.8% crude fibre and 8.5% ash. Combined with nitrogen (N) free substances and water (6%–8%) the feed included 2% calcium (Ca), 0.4% natrium (Na) and 1.2% P. The three systems consisted of nine fish tanks (FT) with 1.2 m3 water volume each, one clarifier with lamella inserts for solid separation (point of sampling), one nitrifying trickling filter for biological oxidation of ammonia to nitrite and further to nitrate and a sump with two pumps. For further specifications see [35]. The systems differed in the size of biofilters and sedimenters, resulting in total RAS water volumes for extensive aquaculture system (EAS) of 13.9 m3, semi-intensive aquaculture system (SIAS) of 15.1 m3, and intensive aquaculture system (IAS) of 16.9 m3 and allowing the different stocking densities of EAS with 35 fish FT−1, SIAS with 70 fish FT−1 and IAS with 140 fish FT−1. Due to differences in stocking densities, the feed inputs also differed. Every six days during the regular maintenance, the clarifiers were temporarily set from flow through to bypass to be able to clean them by emptying the supernatant via an integrated pump while the solid wastes deposited in the lamella inserts were removed with a high-pressure cleaner and the slurry was then collected in the clarifier. Sampling took place six days after cleaning the clarifier and a total feed input of 7.28 kg in EAS, 14.59 kg in SIAS and 28.78 kg in IAS during this time period. At the time of sampling, EAS had a total fish biomass of 147 kg RAS−1 (13.6 kg m−3), SIAS of 287 kg RAS−1 (26.6 kg m−3) and IAS of 551 kg RAS−1 (51.0 kg m−3).

2.2. Determination of Elemental Concentrations

To determine the concentrations of the elements N, sulphur (S), P, aluminium (Al), iron (Fe), Ca, magnesium (Mg) and potassium (K) in the deposited solids, from the slurry samples that were collected in the clarifiers the supernatants were decanted and the remaining, concentrated slurry was transferred into glass trays and oven dried at 60 °C until weight constancy, what was reached after 24 h. The dried samples were then homogenized and acid-digested with concentrated HNO3 and HClO4 as preparation for the following analyses of S, P, Al, Fe, Ca, Mg and K with an inductively coupled plasma-emission spectrometer (ICP-OES) and N by combustion in an elemental analyzer (for methodological details see [15]).

2.3. Pyrolysis-Field Ionization Mass Spectrometry (Py-FIMS)

About 5 mg of finely ground and homogenized samples were thermally degraded by pyrolysis in the ion source (emitter: 4.7 kV, counter electrode −5.5 kV) of a double-focusing Finnigan MAT 95 mass spectrometer. The samples were heated in a vacuum of 10−4 Pa from ambient temperature to 700 °C, in temperature steps of 10 K over a time period of 15 minutes. Between magnetic scans the emitter was flash heated to avoid residues of pyrolysis products. About 60 spectra were recorded for the mass range m/z 15 to 900 for each of the three replicates per sample. Ion intensities were referred to 1 mg of the sample. Volatile matter was calculated as mass loss in percentage of sample weight. For spectra interpretation marker signals (m/z) according to different studies [36,37,38,39,40] were assigned to important compound classes.

2.4. P K-edge X-ray Absorption Near Edge (XANES) Spectroscopy

The P K-edge XANES spectra for characterizing P species in the samples were recorded at the Synchrotron Light Research Institute (SLRI) in Nakhon Ratchasima, Thailand on the beamline 8 (BL8) [41]. The electron storage ring with a covering photon energy from 1 to 13 KeV operated at 1.2 GeV electron energy and a beam current of 80–150 mA [42]. The XANES data were collected from dry and finely-ground samples thinly spread on P-free kapton tape (Lanmar Inc. Northbrook, IL, USA) attached to a plastic sample holder. The samples were diluted to P concentrations < 2 mgPkg−1 with SiO2 powder (to eliminate self-absorption effects [26]) and again ground and homogenized in a mini mill (Pulverisette 23, Fritsch GmbH Milling and Sizing, 55743 Idar-Oberstein, Germany). Data collection operated in standard conditions with energy calibration by standard pure elemental P and allocating the reference energy (E0) at 2145.5 eV using the maximum peak of the first derivative spectrum. All spectra were recorded at photon energies between 2045.5 and 2495.5 eV in step sizes of 5 eV (2045.5 to 2105.5 eV and 2245.5 to 2495.5 eV), 1 eV (2105.5 to 2135.5 eV and 2195.5 to 2245.5 eV) and 0.25 eV (2135.5 to 2195.5 eV) with a 13-channel germanium detector in fluorescence mode. Three scans were collected and averaged for each sample.
All P K-edge XANES spectra were normalized and the replicates were merged. Linear combination fitting (LCF) was performed using the ATHENA software package [43] in the energy range between −20 eV and +30 eV of E0. The XANES spectral data were baseline corrected in the pre-edge region between 2115 and 2145 eV and normalized in the post-edge region of 2190-2215 eV. The same ranges were used for the reference P K-edge XANES spectra to achieve consistency in the following fitting analysis [44]. To achieve the best compatible set of references with each specified sample spectrum, LCF analysis was performed using the combinatorics function of ATHENA software to attain all possible binary to quaternary combinations between all 19 P reference spectra in which the share of each compound was ≥10%. The following set of reference P K-edge XANES spectra, all recorded in SLRI under the same adjustments [44,45], were used for fitting and calculations: Ca-, Al- and Fe-phytate, noncrystalline and crystalline AlPO4, noncrystalline and crystalline FePO4·2H2O, Ca-5-hydroxyapatite (Ca5(OH)(PO4)3), inositol hexakisphosphate (IHP), ferrihydrite–IHP, montmorillonite–Al–IHP, soil organic matter Al–IHP (SOM–Al–IHP), ferrihydrite–orthophosphate, montmorillonite–Al–orthophosphate, SOM–Al–orthophosphate, boehmite–IHP, boehmite–10 orthophosphate, CaHPO4, Ca(H2PO4)2 and MgHPO4. The R-factor values were used as goodness-of-fit criteria and significant differences between fits were evaluated using the Hamilton test (p < 0.05) [46] with the number of independent data points calculated by ATHENA, estimated as data range divided by core-hole lifetime broadening. The best fits of P reference compound combinations were considered as the most probable P species in the material. If R-factors of fits with the same number of reference compounds were not significantly different from each other according to the Hamilton test, fit proportions were averaged.

2.5. Statistical Analyses

Data analysis was performed using the open-source statistical software R (version 3.4.3, R Core Team 2019, Vienna, Austria). R package agricolae was used and significance level was 0.05. Differences in compound classes between the stocking densities EAS, SIAS and IAS determined with Py-FIMS were tested for significance (*P < 0.05, **P < 0.01, ***P < 0.001) by the Welch’s T-test. The precondition of normal distribution was proven using the Shapiro-Wilk normality test previously.

3. Results

3.1. Elemental Composition

The average chemical compositions of solid fish waste from different stocking densities EAS, SIAS and IAS are presented in Table 1. The total dry matter contents (in g kg−1) of the slurry samples before drying were EAS = 24.9, SIAS = 29.9 and IAS = 18.8. There are minor differences in elemental contents between the individual stocking densities. Percentages of nitrogen (N) and sulphur (S) are quite similar in EAS, SIAS and IAS. Percentages of P and calcium (Ca) were highest in SIAS (1.7% P, 4.2% Ca) and lowest in EAS (1.4% P, 3.4% Ca). The contents of aluminum (Al), iron (Fe), magnesium (Mg) and potassium (K) all were very low in a range of 0.0% to 0.5% in all stocking densities.

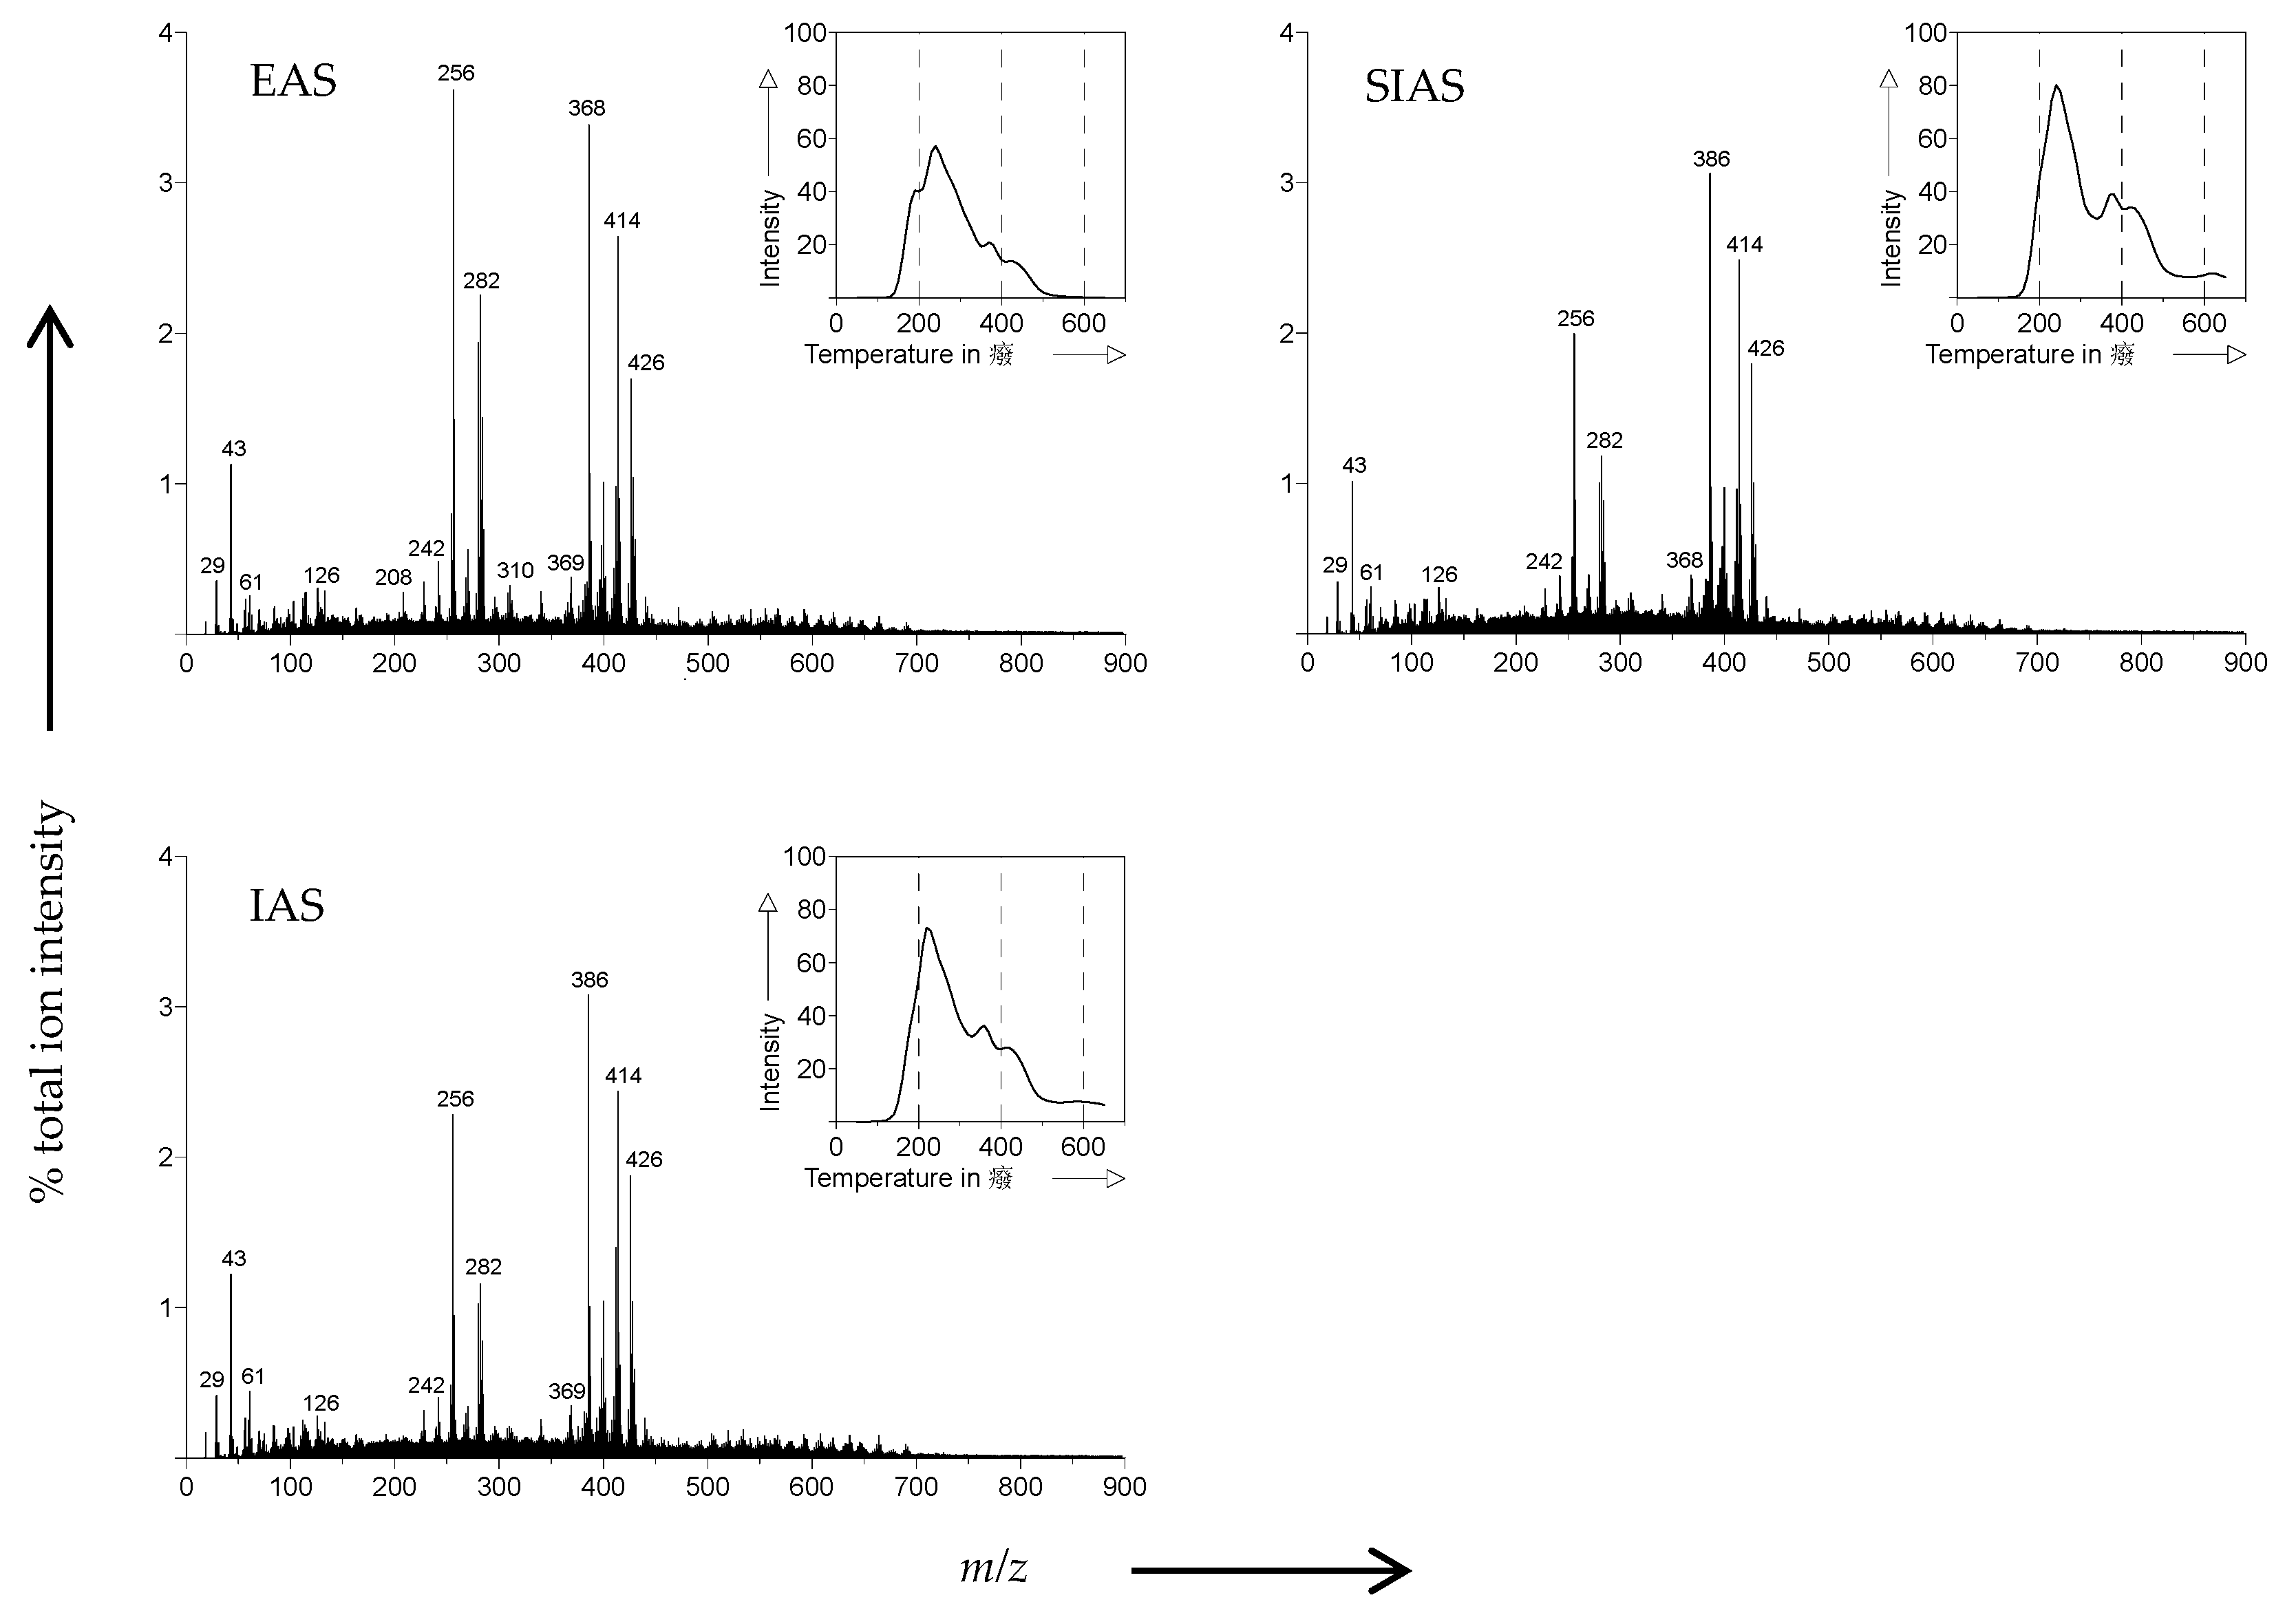
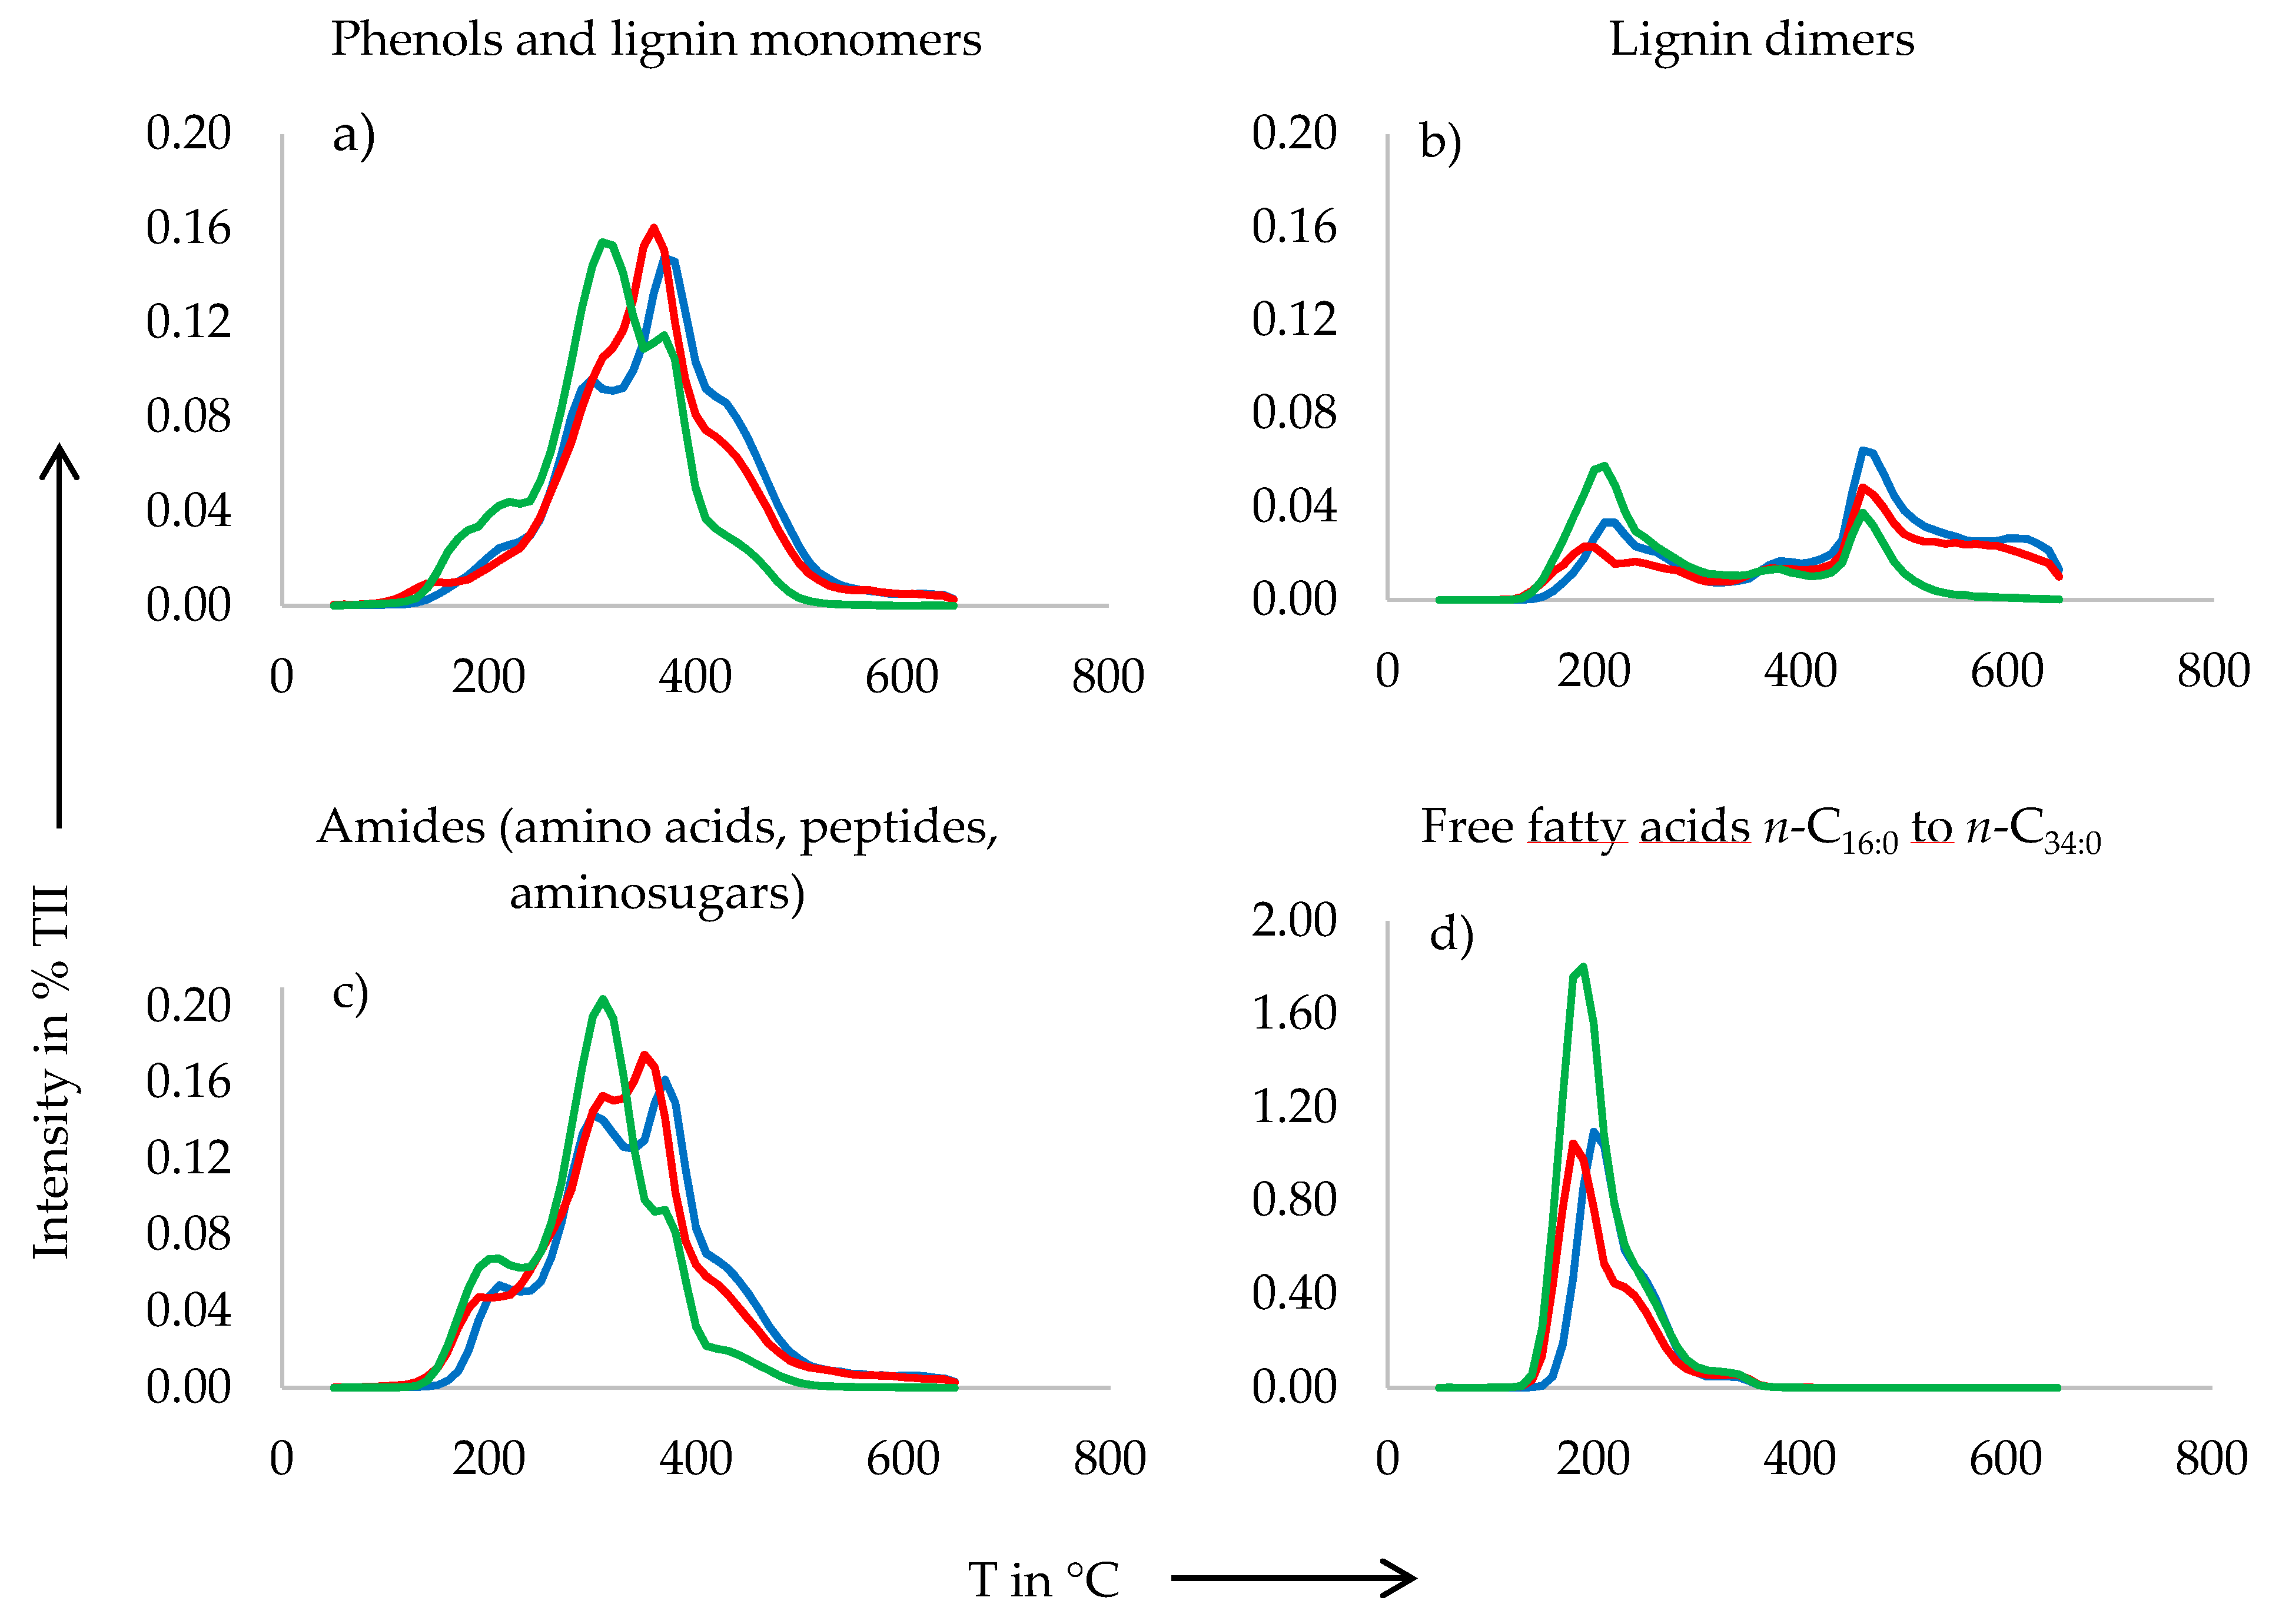
3.2. Pyrolysis-Field Ionization Mass Spectrometry (Py-FIMS)

Py-FI mass spectra of all three stocking densities (Figure 1) were dominated by cholesterol (m/z 386) and beta-sitosterin (m/z 414). The compound at m/z 426 could be the triterpenoids lupeol/taraxerol or the marine sterol gorgosterol. The fatty acid palmitic acid C16H32O2 at m/z 256 occurs in EAS, SIAS and IAS together with the fatty acids n-C18:3, n-C18:2, n-C18:1 and n-C18:0 at m/z 278 to 284 and n-C15:0 at m/z 254. Compounds at m/z 61 and m/z 126 represent sugars and were also present in all samples. The lignin monomer sinapylic aldehyde (m/z 208) was visible in EAS but not in SIAS or IAS. All samples showed low contents of elemental S at m/z 255.7 but the largest concentration was present in IAS.
Similar proportions of volatile matter (VM) were revealed for EAS (79%) and SIAS (77%), whereas for IAS (86%) it was significantly higher compared to EAS (*P = 0.0288) and SIAS (*P = 0.0169) (Table 2). Total ion intensity (TII) was larger by factor 1.5 (*P = 0.0113) in SIAS (1468 × 106 counts mg−1) than in EAS (959 × 106 counts mg−1) but there was no significant difference in TII of SIAS compared to IAS (1396 × 106 counts mg−1). Proportions of carbohydrates, phenols and lignin monomers, lipids, alkylaromatics, sterols and amino acids, peptides and amino sugars revealed no significant differences among the stocking densities EAS, SIAS and IAS but the proportions of lignin dimers were significantly different. The proportion of lignin dimers was significantly lower in EAS (0.8%) than in IAS (1.0%; **P = 0.0068) and it was highest in SIAS (1.2%) and thereby significantly different compared to IAS (**P = 0.0013). The percentage of heterocyclic nitrogen (N) containing compounds was significantly lower in EAS (1.1%) compared to SIAS (1.3%) (**P = 0.0055) and IAS (1.4%). Similar proportions of suberin were determined in SIAS and IAS (0.8%) but in EAS (0.7%) the amount was significantly lower (**P = 0.0036). The highest amount of free fatty acids was present in EAS (12.2%) and thereby significantly different from SIAS (7.4%; **P = 0.0014) and IAS (7.2%; **P = 0.0020).
Thermal volatilization curves for the compound classes phenols and lignin monomers, lignin dimers, amides (amino acids, peptides, amino sugars) and free fatty acids (n-C16:0 to n-C34:0) of all samples are displayed in Figure 2. Graphs for the individual stocking densities show clear differences in the thermal volatilization curves. The thermogram for phenols and lignin monomers (Figure 2a) shows that EAS, SIAS and IAS contained almost similar amounts of these compounds which, however, differed in their thermal volatilization. The volatilization of phenols and lignin monomers occurred at a slightly lower temperature in EAS than in IAS and SIAS. The thermograms for lignin dimers (Figure 2b) display the highest thermal volatilization of these compounds in EAS at the first maximum at lower temperatures and in SIAS at the second maximum at higher temperatures. Figure 2c shows a higher thermal volatilization of amides (amino acids, peptides and amino sugars) in EAS at slightly lower temperatures compared to SIAS and IAS, although the total proportion of amides was marginally higher in SIAS and IAS than in EAS (Table 2). The content of free fatty acids (n-C16:0 to n-C34:0) (Figure 2d) in all samples was much larger than the proportions of the other compound classes (by factor 10). Again, the thermogram of EAS differs from SIAS and IAS (Figure 2d). The amount of free fatty acids in EAS is nearly two times higher compared to SIAS and IAS and all free fatty acids are volatilized at about 200 °C.

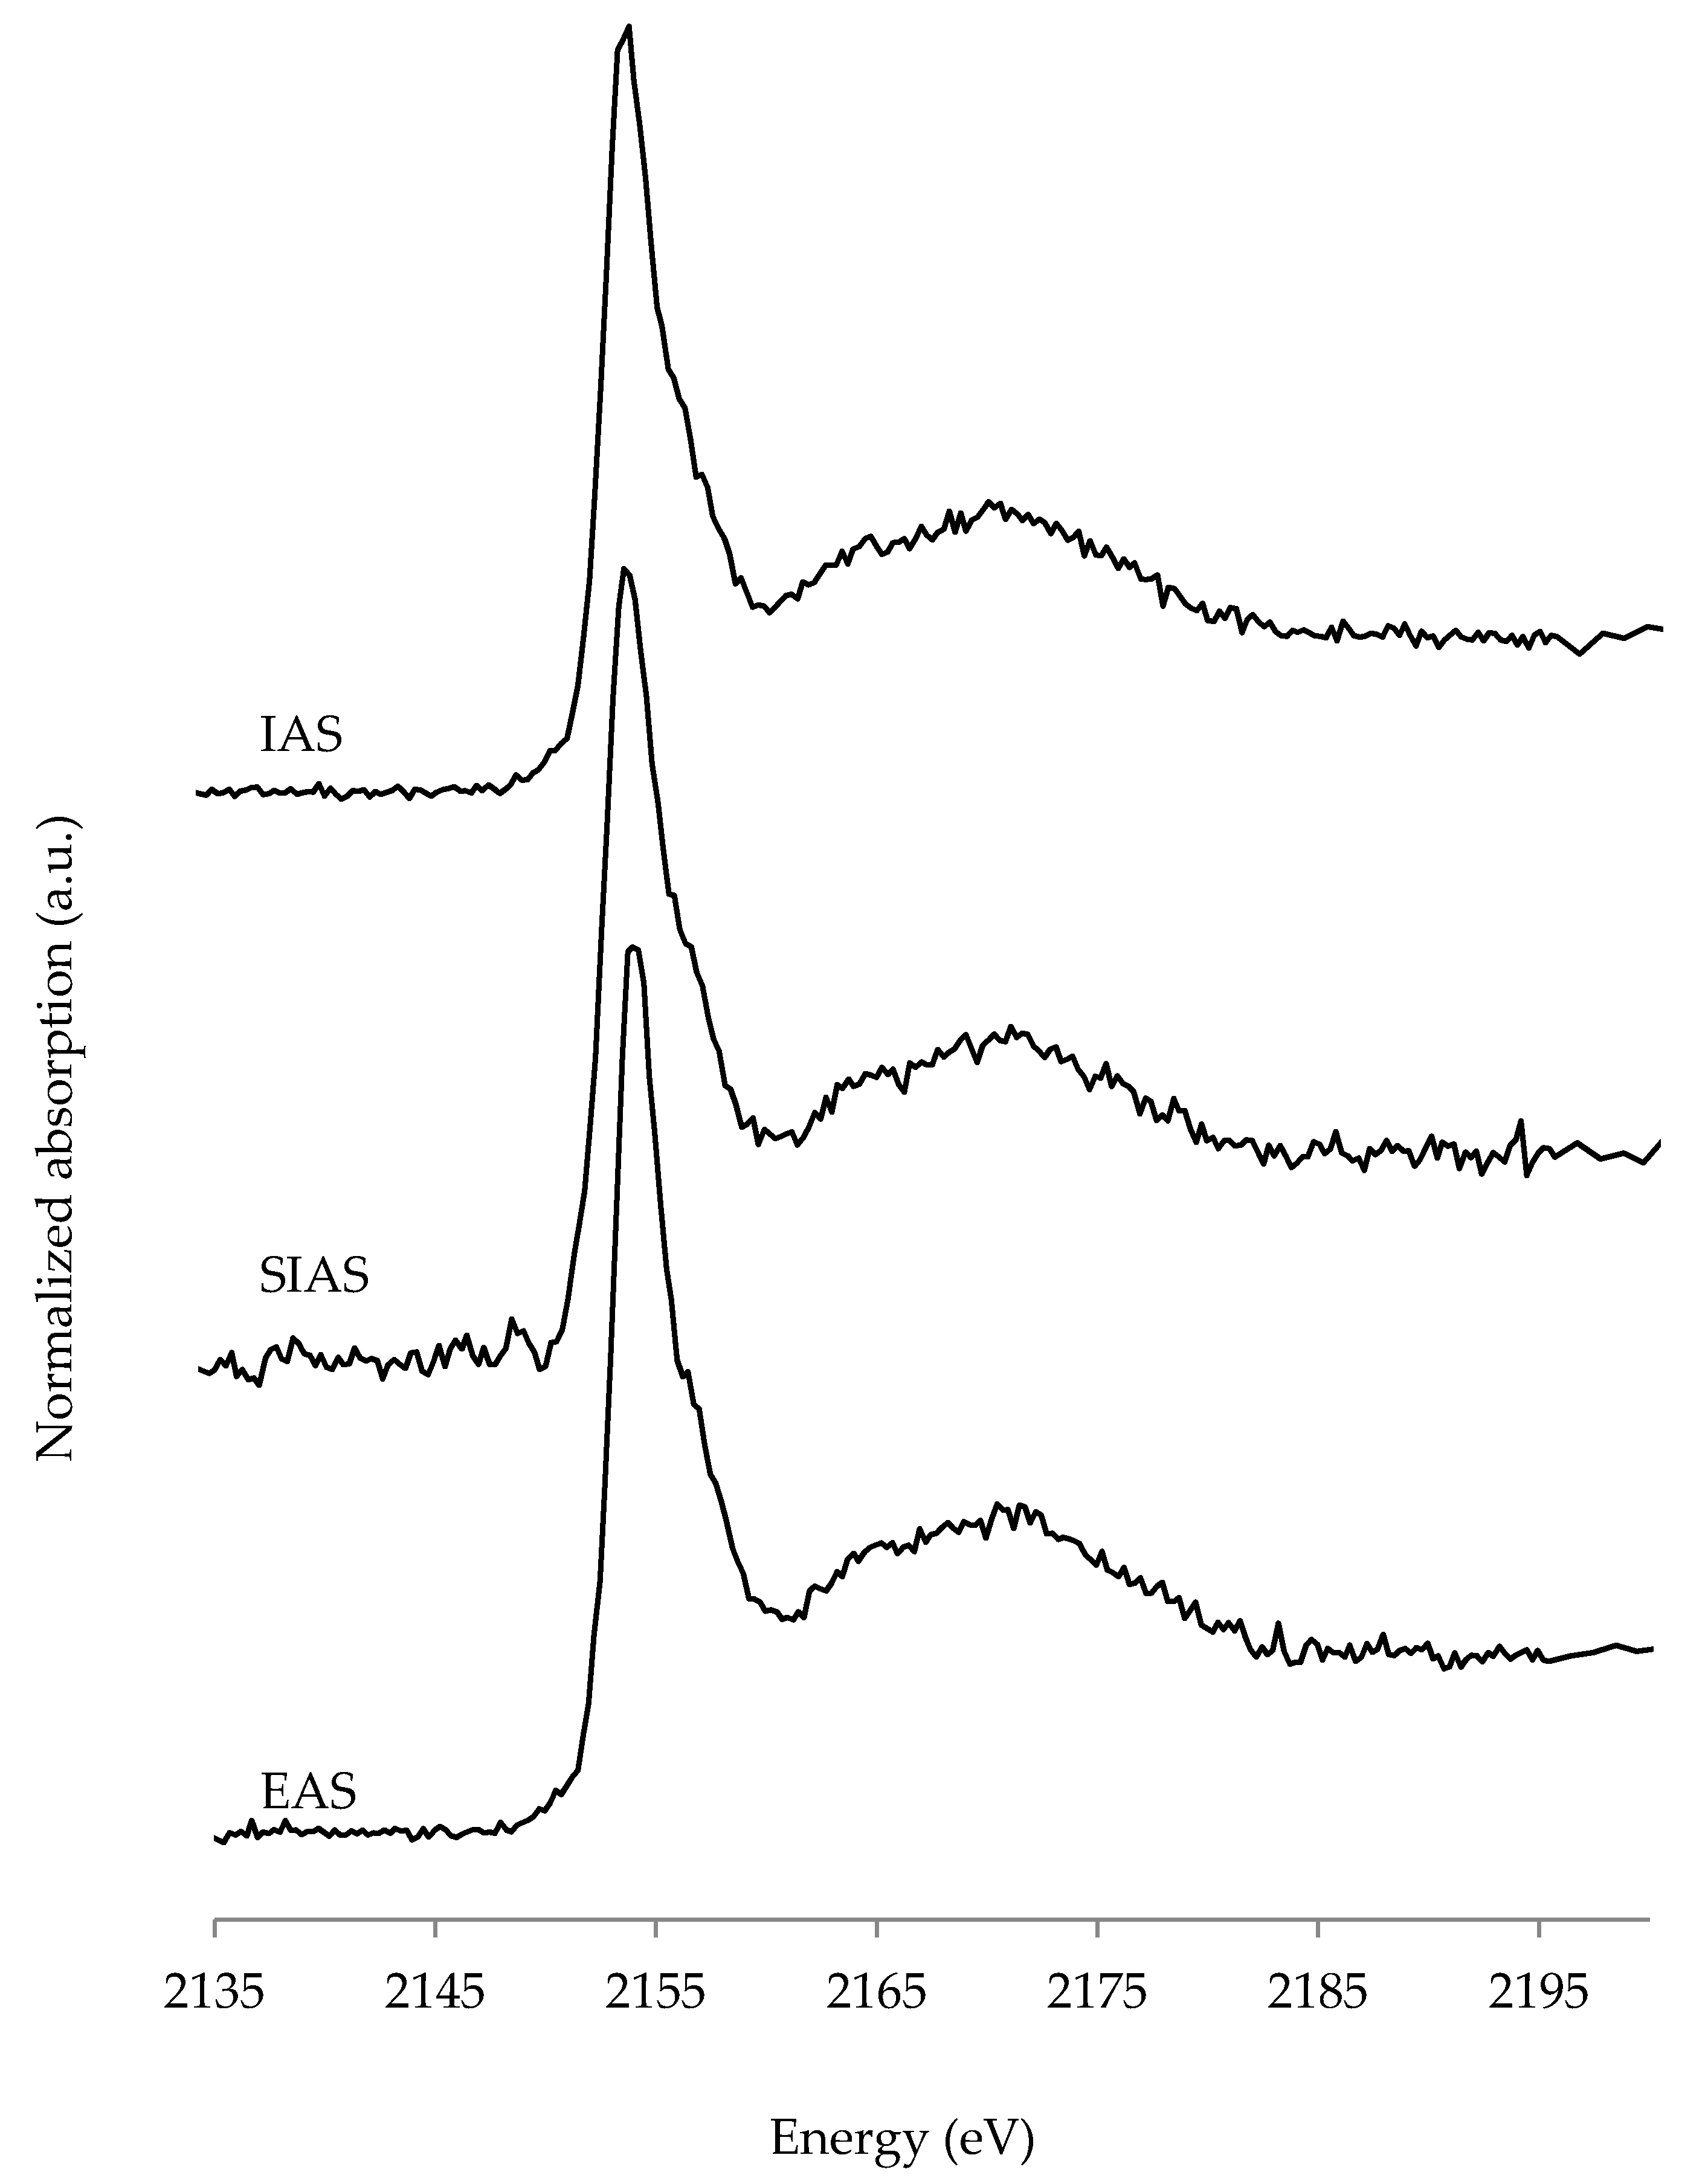
3.3. P K-edge X-ray Absorption Near Edge (XANES) Spectroscopy

The XANES spectra where characterized by an intense white line peak at around 2152 eV (Figure 3). The linear combination fitting (LCF) of spectra using 19 spectra of P reference compounds indicated that the P composition of all samples can be described by Ca-P-compounds like Ca-phytate, Ca-hydrogen phosphate (CaHPO4) and Ca-5-hydroxyapatite (Table 3). Within these compounds Ca phytate was most abundant in EAS (87%), whereas CaHPO4 predominated in SIAS (47%). Ca-hydroxyapatite exclusively occurred in EAS and constituted 7% of all P compounds in this sample as determined by XANES spectroscopy.

4. Discussion

4.1. Organic Matter Composition

Organic compounds of solid waste from African catfish RAS were mainly composed of sterols, free fatty acids and alkylaromatics (Table 2). The dominant occurrence of cholesterol (m/z 386) and beta-sitosterin (m/z 414) in the samples of all stocking densities coincided with the highest relative abundance of the compound class of sterols (14.1% to 14.4%) compared to the other compound classes of the samples (Table 2). Similarly, high proportions of sterols have been observed by Py-FIMS in samples from penguin excrement-rich gelic histosols from Antarctica and from Podzol subsoils [39], and in samples from pig slurry [20]. Thus, high sterol proportions indicate an origin from the digestive system of animals which may be valid also for the sediment from the present RAS. Furthermore, this composition agreed with those of effluents from an Atlantic cod aquaculture facility, where sterols are also one of the major classes present in the organic matter [47].
A different investigation associated high sterol proportions up to 10.2% in an arable gleyic podzol, analysed by Py-FIMS with an inhibitory effect on the mineralizability of soil organic N [48]. This effect has been as well reported in other studies [18,49]. The phytosterol beta-sitosterin likely originates from the plant-based feed ingredients of the African catfish RAS and its occurrence in the solid waste indicates some recalcitrance against digestion in the fish gut.
A comparison of the amount of free fatty acids shows higher proportions in the solid waste from African catfish RAS than in different soils and agro-industrial byproducts (Table 2). For instance, the highest reported amounts of free fatty acids determined with Py-FIMS were 6.6% of total ion intensity in wet-processed coffee byproducts and filter cakes [18]. These proportions of fatty acids were near to those measured by Py-FIMS in SIAS (7.4%) and IAS (7.2%). In sandy arable soils, the highest proportions of free fatty acids were determined in two gleyic podzols (10.6% and 11.8% of Py-FIMS TII) [48], which are still slightly lower than the amount of fatty acids determined in EAS (12.2%) in the present study. Next to lipids, the compound class of free fatty acids was the dominating class determined with Py-FIMS in the higher-mass range in different agro-industrial byproducts reported by [18]. Free fatty acids are one of the major compounds in effluents of an Atlantic cod aquaculture facility as well [47]. Furthermore, long-chain fatty acids (n-C12:0 to n-C34:0) were identified as abundant components of higher plant waxes [50]. Thus, we suppose the plant-based ingredients of the African catfish feed to be the origin of the free fatty acids in the solid waste samples, indicating that portions of the fatty acids were not digested by the fish. Free fatty acids could have positive effects on soil because evidence was found that especially n-C21:0 to n-C34:0 helps to stabilize aggregates in soil [51].
The third highest amount of Py-FIMS from solid African catfish RAS waste was the compound class of alkylaromatics (Table 2). Proportions of alkylaromatics in the solid waste (6.0% to 6.2%) were in the range of those reported for different agro-industrial byproducts, e.g. 4.8% in sisal factory byproducts and 8.3% in dry-processed coffee byproducts [18]. Wheat straw had about 14% TII alkylaromatics, and this proportion decreased to a minimum of 11% TII when the straw was incubated with saprotrophic fungi for some weeks [52]. Alkylaromatics in pig slurry accounted from 7% to 16% of TII, depending on the size of the slurry separates [20], but generally confirming that excrement can contain this compound class. By comparison, soils treated with mineral fertilizer or compost over many years showed clearly higher amounts of alkylaromatics (10.3% to 13.4%) compared to the solid fish waste [16]. Alkylaromatic compounds in soil can have their origin in inputs from plant roots [53], they can be formed by pyrolysis of lignin [54] and they can originate from transformation processes by earthworms [53]. In the solid fish waste, plant-derived lignin from fish feed could be the origin of alkylaromatics but a formation during digestion in the fish, or subsequently in the sedimenters and biofilters cannot be excluded. Alkylaromatic compounds were characterized as backbone of humified substances [55,56] and thereby play a substantial role in soil fertility and possible plant growth.
A comparison of spectral patterns (Figure 1) and proportions of compound classes (Table 2) of the three samples show that the organic matter composition slightly differed between samples from the different stocking densities. Generally, the lowest stocking density EAS differed more from SIAS and IAS than the latter among each other. The higher proportion of free fatty acids on total ion intensity in EAS (12.2%) compared to SIAS and IAS (7.4% and 7.2%) (Table 2) coincides with the visual impression from Py-FI mass spectra (Figure 1), where the palmitic acid C16H32O2 signal at m/z 256 was most prominent in EAS. Furthermore the proportion of free fatty acids not only was 10 times higher than proportions of the other compound classes displayed in Figure 2, it was also nearly two times higher in EAS compared to SIAS and IAS in the thermal volatilization curves for the compound class of free fatty acids (n-C16:0 to n-C34:0) (Figure 2d). It seems that the lower the stocking density of African catfish RAS, the higher the proportions of fatty acids in the samples. In summary, the compound classes of sterols, free fatty acids and alkylaromatics show evidence for plant origin of several compounds in solid African catfish RAS waste. Especially the first maximum in the thermal volatilization curve of the compound class of lignin dimers (Figure 2b) confirms that the samples contain plant material, supporting previous findings on fibre analysis [15].
It must be stated that the relatively long collection period of six days in combination with high feed input and certainly reduced oxygen availability inside the sludge layer in the clarifiers likely provided anaerobic conditions. These may have supported fermentative breakdown processes, resulting in the production of long chain fatty acids and volatile fatty acids by acid forming bacteria, explaining the observed differences in fatty acid composition [57]. This acid production may also explain the absence of hydroxyapatite in SIAS and IAS.
A lower amount of P inside the sediments of EAS also relates to less feed input and reduced availability of dissolved P inside the process water [15]. This differs to similar proportions of N, S, Al, Fe, Mg and K, where the elementary S, also present in all samples, likely has been formed during degradation of biomass by putrefaction, other digestive processes in the fish, or by reductive decomposition processes in the clarifier.

4.2. P XANES Spectroscopy

The fish waste from the stocking density SIAS contained 47% CaHPO4 (Table 3) determined with XANES spectroscopy, and thereby the greatest proportion among the three stocking densities, what coincides with highest elemental percentage of Ca in SIAS (4.2%, Table 1). EAS showed the lowest amount of CaHPO4 (6%) determined with XANES, again in accordance with the smallest elemental proportion of Ca (3.4%) in this sample. Additionally, EAS contained 7% of Ca hydroxyapatite but this has to be taken with caution, because XANES spectroscopy is not able to detect one chemical species certainly in the presence of great proportions of a different species of the same element [58]. Two studies reported a high correlation of XANES spectra of many P standards due to very similar spectral features [59,60]. Furthermore, P XANES spectroscopy is capable to distinguish various chemical inorganic P forms [61] but it is limited in differentiating P adsorbed by organic matter and certain minerals [27] because of very similar spectral features [29]. In consequence, also the calculated proportions of organic Ca phytate in the solid African catfish RAS waste have to be considered with caution. To avoid misinterpretations of LCF results of XANES spectroscopy, some authors recommended sorting of standards into different groups such as Ca- or Fe-phosphates [59,62]. A previous study on semi-commercial African catfish RAS suggested chemical precipitation of phosphates with the binding partners Ca and Mg, resulting in lower availability of dissolved nutrients for plant production in aquaponics [35]. The present study demonstrates the relatively confident occurrence of almost all P compounds in bonds with Ca in the solid fraction of African catfish RAS waste, regardless of stocking density (Table 3). This plausibly can be explained by the lower concentrations of other possible elemental P binding partners in the slurry. For instance, the elemental contents of Al, Fe, Mg and K all were very low in EAS, SIAS and IAS (<0.1% to 0.5%, Table 1). In addition, while a related investigation reported mean pH values between 5.2 and 6.3 [35], pH of water in the current study was much lower (pH 4.5–4.9) [15]. Formation of Ca-phosphates occurs under more acidic conditions (pH ~ 5–6.5) compared with Mg-phosphates (pH > 6.5) [63]. These effects of pH on the formation of either Mg- or Ca-phosphates may therefore explain the absence of Mg-phosphates in the slurry of the present study.
We also found that the concentration of total P and Ca, largely bound as Ca-phosphates, were higher in SIAS than in EAS and IAS. It is important to note that no alkaline substances were added to the RAS to increase the pH of water. Consequently, the only input pathways for Ca were feed and tap water [15]. As a consequence of maintenance works on the RAS before the start of this study, SIAS experienced the highest and EAS the lowest water exchange rates over the run of the experiment (EAS = 1.6 m3, SIAS = 3.5 m3, IAS = 2.5 m3). This additional water input of freshwater in SIAS increased the input of Ca that obviously directly combines with dissolved P resulting from fish feed and possibly increasing the Ca-phosphate abundance in the slurry recovered from SIAS when compared with EAS and IAS.
Freshwater aquaculture systems that utilize groundwater sources with hard water conditions therefore might release significant amounts of Ca-phosphates to the environment. Ca-phosphates were also the most abundant P form determined in bottom sediments from the Baltic Sea [64]. In sediments from the Arabian Sea, increasing amounts of Ca-associated P with depth were investigated [31]. It was confirmed that fecal matter from fish cultured in sea cages can contribute up to 80% to particulate organic waste in the direct aquatic environment [34]. Since the solid African catfish RAS waste exclusively contains Ca-bound P compounds, it seems reasonable to assume that such waste can also contribute to high amounts of Ca-associated P in marine sediments. However, African catfish live in freshwater and the chemical composition of solid waste especially with regard to P speciation originating from mariculture systems or fish species naturally occurring in marine environments yet have to be examined.
Similar to the results in Table 3, Ca-bound P was detected as the dominant form of P in potential alternative P fertilizers such as biochar from wetland reed and animal bone chips with XANES spectroscopy [65]. XANES spectroscopy of dairy manures, poultry litters and biosolids revealed up to 71% of total P as hydroxyapatite [66]. In another study, CaO has been added to poultry waste to improve pathogenic characteristics and to avoid P losses via runoff [67]. The CaO addition increased the proportion of hydroxyapatite in the manure to a maximum of 86% (determined with XANES spectroscopy), contributing to a reduced water solubility of P [67]. Thus, Ca-phosphate minerals play a substantial and advantageous role in P fertilizers. Next to traditional organic fertilizers, such as green waste compost, solid African catfish RAS waste, especially those from intensive RAS systems with the absence of hydroxyapatite, can be considered as potential P fertilizer in agriculture based on its Ca-bound dominated P speciation.

5. Conclusions

  • The methodological approach of using Py-FIMS and XANES spectroscopy as methods to determine organic matter composition and P speciation of solid African catfish RAS waste samples was appropriate. It revealed insight into the distribution of organic matter compound classes in solid waste of three different fish stocking densities and provided evidence for the occurrence of exclusively Ca-bound P compounds in African catfish RAS waste.
  • The high amounts of sterols, fatty acids and alkylaromatics in the solid waste of all three stocking densities of African catfish RAS determined by Py-FIMS reflect the plant-based feed of the fish. To assess the suitability of African catfish RAS solid waste as organic soil amendment and to prevent possible negative effects of sterols on the N-cycle in soil, further research is needed, especially on soils that have been amended by solid waste from African catfish RAS. Alternatively to direct land application of this waste, some pretreatments such as anaerobic digestion for biogas production or vermifiltration, should be tested.
  • The stocking density had an influence on feed input, water exchange rates and total oxygen concentrations in the tested African catfish RAS systems. These three factors, alone and in combination, alter solid waste composition, and its applicability as soil amendment if originating from extensive or (semi)intensive catfish aquaculture.
  • XANES spectroscopy detected exclusively Ca-associated P compounds in solid African catfish RAS waste of three different fish stocking densities. Ca-phosphate minerals as a major constituent of many bio-waste material P fertilizers have beneficial properties when applied on soils. Thus, solid African catfish RAS waste can be considered as possible addition to traditional organic P fertilizers. However, this first investigation of African catfish RAS waste with P XANES spectroscopy would benefit from the application of more different complementary techniques, such as solution 31P nuclear magnetic resonance (NMR) spectroscopy and sequential P fractionation to get a more comprehensive view on P speciation.

Author Contributions

Conceptualization, J.P. and P.L.; methodology, J.P., W.K., P.L., S.M.S. and L.C.W.; validation, P.L., W.K. and H.W.P.; formal analysis, J.P.; investigation, J.P.; resources, J.P., P.L., S.M.S., L.C.W. and H.W.P; writing—original draft preparation, J.P.; writing—review and editing, P.L., S.M.S., L.C.W. and H.W.P.; supervision, P.L.; funding acquisition, P.L. All authors have read and agreed to the published version of the manuscript.

Funding

This research was funded by the Leibniz Association within the scope of the Leibniz ScienceCampus Phosphorus Research Rostock (www.sciencecampus-rostock.de). We acknowledge financial support by Deutsche Forschungsgemeinschaft and Universität Rostock within the funding programme Open Access Publishing.

Acknowledgments

The authors wish to thank Kai-Uwe Eckhardt (Soil Science, University of Rostock) for his support with Py-FIMS analyses and evaluation. Furthermore, we are grateful to Jörg Prietzel (Department of Soil Science, Technical University of Munich) for providing the P XANES reference spectra and to the technical staff at beamline 8 of SLRI for their friendly support.

Conflicts of Interest

The authors declare no conflict of interest. The funders had no role in the design of the study; in the collection, analyses, or interpretation of data; in the writing of the manuscript, or in the decision to publish the results.

References

  1. Elser, J.J.; Bracken, M.E.S.; Cleland, E.E.; Gruner, D.S.; Harpole, W.S.; Hillebrand, H.; Ngai, J.T.; Seabloom, E.W.; Shurin, J.B.; Smith, J.E. Global analysis of nitrogen and phosphorus limitation of primary producers in freshwater, marine and terrestrial ecosystems. Ecol. Lett. 2007, 10, 1135–1142. [Google Scholar] [CrossRef] [PubMed] [Green Version]
  2. Leinweber, P.; Bathmann, U.; Buczko, U.; Douhaire, C.; Eichler-Löbermann, B.; Frossard, E.; Ekardt, F.; Jarvie, H.; Krämer, I.; Kabbe, C.; et al. Handling the phosphorus paradox in agriculture and natural ecosystems: Scarcity, necessity, and burden of P. Ambio 2018, 47, 3–19. [Google Scholar] [CrossRef] [Green Version]
  3. Withers, P.; Doody, D.; Sylvester-Bradley, R. Achieving sustainable phosphorus use in food systems through circularisation. Sustainability 2018, 10, 1804. [Google Scholar] [CrossRef] [Green Version]
  4. Schroder, J. Revisiting the agronomic benefits of manure: A correct assessment and exploitation of its fertilizer value spares the environment. Bioresour. Technol. 2005, 6, 253–261. [Google Scholar] [CrossRef] [PubMed]
  5. Le Corre, K.S.; Valsami-Jones, E.; Hobbs, P.; Parsons, S.A. Phosphorus recovery from wastewater by struvite crystallization: A review. Crit. Rev. Env. Sci. Tec. 2009, 39, 433–477. [Google Scholar] [CrossRef] [Green Version]
  6. Martins, C.I.M.; Eding, E.H.; Verdegem, M.C.; Heinbroek, L.T.; Schneider, O.; Blancheton, J.P.; Roques d’Orbcastel, E.; Verreth, J.A.J. New developments in recirculating aquaculture systems in Europe: A perspective on environmental sustainability. Aquac. Eng. 2010, 43, 83–93. [Google Scholar] [CrossRef] [Green Version]
  7. Hall, O.J. Chemical flux and mass balances in a marine fish cage farm. IV. Nitrogen. Mar. Ecol. Prog. Ser. 1992, 89, 81–91. [Google Scholar] [CrossRef]
  8. Holby, O.; Hall, O.J. Chemical fluxes and mass balances in a marine fish cage farm. II. Phosphorus. Mar. Ecol. Prog. Ser. 1991, 70, 263–272. [Google Scholar] [CrossRef]
  9. Galasso, H.L.; Callier, M.D.; Bastianelli, D.; Blancheton, J.-P.; Aliaume, C. The potential of near infrared spectroscopy (NIRS) to measure the chemical composition of aquaculture solid waste. Aquaculture 2017, 476, 134–140. [Google Scholar] [CrossRef] [Green Version]
  10. Gómez-Brandón, M.; Juárez, M.F.-D.; Zangerle, M.; Isam, H. Effects of digestate on soil chemical and microbiological properties: A comparative study with compost and vermicompost. J. Hazard. Mater. 2016, 302, 267–274. [Google Scholar] [CrossRef]
  11. Case, S.D.C.; Oelofse, M.; Hou, Y.; Oenema, O.; Jensen, L.S. Farmer perceptions and use of organic waste products as fertilisers–A survey study of potential benefits and barriers. Agric. Syst. 2016, 151, 84–95. [Google Scholar] [CrossRef]
  12. Köster, J.R.; Cárdenas, L.M.; Bol, R.; Lewicka-Szczebak, D.; Senbayram, M.; Well, R.; Giesemann, A.; Dittert, K. Anaerobic digestates lower N2O emissions compared to cattle slurry by affecting rate and product stoichiometry of denitrification–An N2O isotopomer case study. Soil. Biol. Biochem. 2015, 84, 65–74. [Google Scholar] [CrossRef]
  13. Adani, F.; Tambone, F. Long-term effect of sewage sludge application on soil humic acids. Chemosphere 2005, 60, 1214–1221. [Google Scholar] [CrossRef] [PubMed]
  14. Hupfauf, S.; Bachmann, S.; Fernández-Delgado Juárez, M.; Insam, H.; Eichler-Löbermann, B. Biogas digestates affect crop P uptake and soil microbial community composition. Sci. Total Environ. 2016, 542, 1144–1154. [Google Scholar] [CrossRef]
  15. Strauch, S.; Wenzel, L.; Bischoff, A.; Dellwig, O.; Klein, J.; Schüch, A.; Wasenitz, B.; Palm, H.W. Commercial African catfish (Clarias gariepinus) recirculating aquaculture systems: Assessment of element and energy pathways with special focus on the phosphorus cycle. Sustainability 2018, 10, 1805. [Google Scholar] [CrossRef] [Green Version]
  16. Eshetu, B.; Jandl, G.; Leinweber, P. Compost changed soil organic matter molecular composition: A study by Py-GC/MS and Py-FIMS. Compos. Sci. Util. 2012, 20, 230–238. [Google Scholar] [CrossRef]
  17. Franke, M.; Jandl, G.; Leinweber, P. Organic compounds in re-circulated leachates of aerobic biological treated municipal solid waste. Biodegradation 2006, 17, 473–485. [Google Scholar] [CrossRef]
  18. Negassa, W.; Baum, C.; Leinweber, P. Soil amendment with agro-industrial byproducts: Molecular-chemical compositions and effects on soil biochemical activities and phosphorus fractions. J. Plant. Nutr. Soil Sci. 2011, 174, 113–120. [Google Scholar] [CrossRef]
  19. Jegajeevagan, K.; Mabilde, L.; Gebremikael, M.T.; Ameloot, N.; De Neve, S.; Leinweber, P.; Sleutel, S. Artisanal and controlled pyrolysis-based biochars differ in biochemical composition, thermal recalcitrance, and biodegradability in soil. Biomass Bioenerg. 2016, 84, 1–11. [Google Scholar] [CrossRef]
  20. Aust, M.-O.; Thiele-Bruhn, S.; Eckhardt, K.-U.; Leinweber, P. Composition of organic matter in particle size fractioned pig slurry. Bioresour. Technol. 2009, 100, 5736–5743. [Google Scholar] [CrossRef]
  21. Kazi, Z.H.; Schnitzer, M.I.; Monreal, C.; Mayer, P. Separation and identification of heterocyclic nitrogen compounds in biooil derived by fast pyrolysis of chicken manure. J. Environ. Sci. Heal. B 2011, 46, 51–61. [Google Scholar] [CrossRef] [PubMed]
  22. Acksel, A.; Amelung, W.; Kühn, P.; Gehrt, E.; Regier, T.; Leinweber, P. Soil organic matter characteristics as indicator of Chernozem genesis in the Baltic Sea region. Geoderma Reg. 2016, 7, 187–200. [Google Scholar] [CrossRef]
  23. Hesterberg, D.; Zhou, W.; Hutchison, J.; Beauchemin, S.; Sayers, D.E. XAFS study of adsorbed and mineral forms of phosphate. J. Synchrotron Rad. 1999, 6, 636–638. [Google Scholar] [CrossRef] [PubMed]
  24. Koch, M.; Kruse, J.; Eichler-Löbermann, B.; Zimmer, D.; Willbold, S.; Leinweber, P.; Siebers, N. Phosphorus stocks and speciation in soil profiles of a long-term fertilizer experiment: Evidence from sequential fractionation, P K-edge XANES, and 31P NMR spectroscopy. Geoderma 2018, 316, 115–126. [Google Scholar] [CrossRef]
  25. Morshedizad, M.; Panten, K.; Klysubun, W.; Leinweber, P. Bone char effects on soil: Sequential fractionations and XANES spectroscopy. Soil 2018, 4, 23–35. [Google Scholar] [CrossRef] [Green Version]
  26. Prietzel, J.; Dümig, A.; Wu, Y.; Zhou, J.; Klysubun, W. Synchrotron-based P K-edge XANES spectroscopy reveals rapid changes of phosphorus speciation in the topsoil of two glacier foreland chronosequences. Geochim. Cosmochim. Acta. 2013, 108, 154–171. [Google Scholar] [CrossRef]
  27. Ajiboye, B.; Akinremi, O.O.; Hu, Y.; Jürgensen, A. XANES speciation of phosphorus in organically amended and fertilized vertisol and mollisol. Soil Sci. Soc. Am. J. 2008, 72, 1256–1262. [Google Scholar] [CrossRef]
  28. Kar, G.; Hundal, L.S.; Schoenau, J.J.; Peak, D. Direct chemical speciation of P in sequential chemical extraction residues using P K-edge X-ray absorption near-edge structure spectroscopy. Soil Sci. 2011, 176, 589–595. [Google Scholar] [CrossRef]
  29. Peak, D.; Sims, J.T.; Sparks, D.L. Solid-state speciation of natural and alum-amended poultry litter using XANES spectroscopy. Environ. Sci. Technol. 2002, 36, 4253–4261. [Google Scholar] [CrossRef]
  30. Sato, S.; Solomon, D.; Hyland, C.; Ketterings, Q.M.; Lehmann, J. Phosphorus speciation in manure and manure-amended soils using XANES spectroscopy. Environ. Sci. Technol. 2005, 39, 7485–7491. [Google Scholar] [CrossRef]
  31. Kraal, P.; Bostick, B.C.; Behrends, T.; Reichart, G.-J.; Slomp, C. Characterization of phosphorus species in sediments from the Arabian Sea oxygen minimum zone: Combining sequential extractions and X-ray spectroscopy. Mar. Chem. 2015, 168, 1–8. [Google Scholar] [CrossRef] [Green Version]
  32. Li, W.; Joshi, S.R.; Hou, G.; Burdige, D.J.; Sparks, D.L.; Jaisi, D.P. Characterizing phosphorus speciation of Chesapeake Bay sediments using chemical extraction, 31P NMR, and X-ray absorption fine structure spectroscopy. Environ. Sci. Technol. 2015, 49, 203–211. [Google Scholar] [CrossRef] [PubMed]
  33. Prüter, J.; Leipe, T.; Michalik, D.; Klysubun, W.; Leinweber, P. Phosphorus speciation in sediments from the Baltic Sea, evaluated by a multi-method approach. J. Soils Sediments 2020, 20, 1676–1691. [Google Scholar] [CrossRef]
  34. Zhang, J.; Kitazawa, D. Numerical analysis of particulate organic waste diffusion in an aquaculture area of Gokasho Bay, Japan. Mar. Pollut. Bull. 2015, 93, 130–143. [Google Scholar] [CrossRef] [PubMed]
  35. Palm, H.W.; Knaus, U.; Wasenitz, B.; Bischoff, A.A.; Strauch, S.M. Proportional up scaling of African catfish (Clarias gariepinus Burchell, 1822) commercial recirculating aquaculture systems disproportionally affects nutrient dynamics. Aquaculture 2018, 491, 155–168. [Google Scholar] [CrossRef]
  36. Hempfling, R.; Zech, W.; Schulten, H.-R. Chemical composition of the organic matter in forest soils: 2. Moder Profile. Soil Sci. 1988, 146, 262–276. [Google Scholar] [CrossRef]
  37. Schnitzer, M.; Schulten, H.-M. The analysis of soil organic matter by pyrolysis-field ionization mass spectrometry. Soil Sci. Soc. Am. J. 1992, 56, 1811. [Google Scholar] [CrossRef]
  38. Schulten, H.-R.; Leinweber, P. Characterization of humic and soil particles by analytical pyrolysis and computer modelling. J. Anal. Appl. Pyrolysis 1996, 38, 1–53. [Google Scholar] [CrossRef]
  39. Leinweber, P.; Jandl, G.; Eckhardt, K.-U.; Schulten, H.-R.; Schlichting, A.; Hoffman, D. Analytical pyrolysis and soft-ionization mass spectrometry. In Biophysico-Chemical Processes Involving Natural Nonliving Organic Matter in Environmental Systems, 1st ed.; Senesi, N., Xing, B., Huang, P.M., Eds.; Wiley-Interscience: Hoboken, NJ, USA, 2009; pp. 539–588. [Google Scholar]
  40. Leinweber, P.; Kruse, J.; Baum, C.; Arcand, M.; Knight, J.D.; Farrell, R.; Eckhardt, K.-U.; Kiersch, K.; Jandl, G. Advances in understanding organic nitrogen chemistry in soils using state-of-the-art analytical techniques. Adv. Agron. 2013, 119, 83–151. [Google Scholar]
  41. Klysubun, W.; Tarawarakarn, P.; Thamsanong, N.; Amonpattaratkit, P.; Cholsuk, C.; Lapboonrueng, S.; Chaichuay, S.; Wongtepa, W. Upgrade of SLRI BL8 beamline for XFAS spectroscopy in a photon energy range of 1 keV to 13 keV. Radiat. Phys. Chem. 2020, 175, 108145. [Google Scholar] [CrossRef]
  42. Klysubun, W.; Sombunchoo, P.; Deenan, W.; Kongmark, C. Performance and status of beamline BL8 at SLRI for X-ray absorption spectroscopy. J. Synchrotron Radiat. 2012, 19, 930–936. [Google Scholar] [CrossRef] [PubMed]
  43. Ravel, B.; Newville, M. ATHENA, ARTEMIS, HEPHAESTUS: Data analysis for X-ray absorption spectroscopy using IFEFFIT. J. Synchrotron Radiat. 2005, 12, 537–541. [Google Scholar] [CrossRef] [PubMed] [Green Version]
  44. Prietzel, J.; Harrington, G.; Häusler, W.; Heister, K.; Werner, F.; Klysubun, W. Reference spectra of important adsorbed organic and inorganic phosphate binding forms for soil P speciation using synchrotron-based K-edge XANES spectroscopy. J. Synchrotron Radiat. 2016, 23, 532–544. [Google Scholar] [CrossRef] [PubMed]
  45. Werner, F.; Prietzel, J. Standard protocol and quality assessment of soil phosphorus speciation by P K-Edge XANES spectroscopy. Environ. Sci. Technol. 2015, 49, 10521–10528. [Google Scholar] [CrossRef]
  46. Calvin, S. XAFS for Everyone, 1st ed.; CRC Press: Boca Raton, FL, USA, 2013; p. 427. [Google Scholar]
  47. Both, A.; Parrish, C.C.; Penney, R.W.; Thompson, R.J. Physical and biochemical properties of effluent leaving an onshore Atlantic cod (Gadus morhua, Linnaeus 1758; Gadiformes: Gadiae) aquaculture facility and potential use in integrated multi-trophic aquaculture. Aquac. Res. 2012, 44, 1–12. [Google Scholar] [CrossRef]
  48. Heumann, S.; Schlichting, A.; Böttcher, J.; Leinweber, P. Sterols in soil organic matter relation to nitrogen mineralization in sandy arable soils. J. Plant. Nutr. Soil Sci. 2011, 174, 576–586. [Google Scholar] [CrossRef]
  49. Leite, S.P.; Vieira, J.R.C.; de Medeiros, P.L.; Leite, R.M.P.; Lima, V.M.; Xavier, H.S.; Lima, E.O. Antimicrobial activity of Indigofera suffruticosa. Evid. Based Complementray Altern. Med. 2006, 3, 261–265. [Google Scholar] [CrossRef] [Green Version]
  50. Stevenson, F.J. Humus Chemistry: Genesis, Composition and Reactions, 2nd ed.; John Wiley & Sons: New York, NY, USA, 1994; pp. 166–187. [Google Scholar]
  51. Jandl, G.; Leinweber, P.; Schulten, H.-R.; Eusterhues, K. The concentration of fatty acids in organo-mineral particle-size fraction of a Chernozem. Eur. J. Soil Sci. 2004, 55, 459–469. [Google Scholar] [CrossRef]
  52. Wiedow, D.; Baum, C.; Leinweber, P. Inoculation with Trichoderma saturnisporum accelerates wheat straw decomposition on soil. Arch. Agron. Soil Sci. 2007, 53, 1–12. [Google Scholar] [CrossRef]
  53. Leue, M.; Eckhardt, K.-U.; Ellerbrock, R.H.; Gerke, H.H.; Leinweber, P. Analyzing organic matter composition at intact biopore and crack surfaces by combining DRFIT spectroscopy and Pyrolysis-Field Ionization Mass Spectrometry. J. Plant. Nutr. Soil Sci. 2016, 179, 5–17. [Google Scholar] [CrossRef]
  54. Sleutel, S.; Leinweber, P.; Begum, S.A.; Kader, M.A.; Van Oostveldt, P.; De Neve, S. Composition of organic matter in sandy relict and cultivated heathlands as examined by pyrolysis-field ionization MS. Biogeochemistry 2008, 89, 253–271. [Google Scholar] [CrossRef]
  55. Schulten, H.-R.; Schnitzer, M. A state of the art structural concept for humic substances. Naturwissenschaften 1993, 80, 29–30. [Google Scholar] [CrossRef]
  56. Negassa, W.; Acksel, A.; Eckhardt, K.-U.; Regier, T.; Leinweber, P. Soil organic matter characteristics in drained and rewetted peatlands of northern Germany: Chemical and spectroscopic analyses. Geoderma 2019, 353, 468–481. [Google Scholar] [CrossRef]
  57. Comeau, Y. Microbial Metabolism. In Biological Wastewater Treatment: Principles, Modelling and Design, 1st ed.; Henze, M., van Loosdrecht, M.C.M., Ekama, G.A., Brdjanovic, D., Eds.; IWA Publishing: London, UK, 2008; pp. 16–17. [Google Scholar]
  58. Pickering, I.J.; Brown, G.E., Jr.; Tokunaga, T.K. Quantitative speciation of selenium in soils using X-ray absorption spectroscopy. Eviron. Sci. Technol. 1995, 29, 2456–2459. [Google Scholar] [CrossRef] [PubMed]
  59. Beauchemin, S.; Hesterberg, D.; Chou, J.; Beauchemin, M.; Simard, R.R.; Sayers, D.E. Speciation of phosphorus in phosphorus-enriched agricultural soils using X-ray absorption near-edge structure spectroscopy and chemical fractionation. J. Environ. Qual. 2003, 32, 1809–1819. [Google Scholar] [CrossRef] [PubMed]
  60. Gustafsson, J.P.; Braun, S.; Tuyishime, J.R.M.; Adediran, G.A.; Warrinnier, R.; Hesterberg, D. A probabilistic approach to phosphorus speciation of soils using P K-edge XANES spectroscopy with linear combination fitting. Soil Syst. 2020, 4, 26. [Google Scholar] [CrossRef]
  61. Kruse, J.; Leinweber, P. Phosphorus in sequentially extracted fen peat soils: A K-edge X-ray absorption near-edge structure (XANES) spectroscopy study. J. Plant. Nutr. Soil Sci. 2008, 171, 613–620. [Google Scholar] [CrossRef]
  62. Eriksson, A.K.; Hillier, S.; Hesterberg, D.; Klysubun, W.; Ulén, B.; Gustafsson, J.P. Evolution of phosphorus speciation with depth in an agricultural soil profile. Geoderma 2016, 280, 29–37. [Google Scholar] [CrossRef] [Green Version]
  63. Darn, S.M.; Sodi, R.; Ranganath, L.R.; Roberts, N.B.; Duffield, J.R. Experimental and computer modelling speciation studies of the effect of pH and phosphate on the precipitation of calcium and magnesium salts in urine. Clin. Chem. Lab. Med. 2006, 44, 185–191. [Google Scholar] [CrossRef]
  64. Frankowski, L.; Bolałek, J.; Szostek, A. Phosphorus in bottom sediments of Pomeranian Bay (Southern Baltic–Poland). Estuar. Coast. Shelf Sci. 2002, 54, 1027–1038. [Google Scholar] [CrossRef]
  65. Robinson, J.S.; Baumann, K.; Hu, Y.; Hagemann, P.; Kebelmann, L.; Leinweber, P. Phosphorus tranformation in plant-based and bio-waste materials induced by pyrolysis. Ambio 2018, 47, S73–S82. [Google Scholar] [CrossRef] [PubMed] [Green Version]
  66. Shober, A.; Hesterberg, D.L.; Sims, J.T.; Gardner, S. Characterization of phosphorus species in biosolids and manures using XANES spectroscopy. J. Environ. Qual. 2006, 35, 1983–1993. [Google Scholar] [CrossRef] [PubMed]
  67. Maguire, R.O.; Hesterberg, D.; Gernat, A.; Anderson, K.; Wineland, M.; Grimes, J. Liming poultry manures to decrease soluble phosphorus and suppress the bacteria population. J. Environ. Qual. 2006, 35, 849–857. [Google Scholar] [CrossRef] [PubMed] [Green Version]
Figure 1. Pyrolysis-field ionization mass spectra and thermograms of the stocking densities extensive aquaculture system (EAS), semi-intensive aquaculture system (SIAS) and intensive aquaculture system (IAS).
Agriculture 10 00466 g001
Figure 2. Thermograms of the substance classes (a) phenols and lignin monomers, (b) lignin dimers, (c) amides (amino acids, peptides, amino sugars) and (d) free fatty acids (n-C16:0 to n-C34:0) of the different stocking density samples: EAS (graph in green), SIAS (graph in blue) and IAS (graph in red). For reasons of clearness, the scale of the graph of free fatty acids is 10 times higher than the graphs of the other substance classes.
Agriculture 10 00466 g002
Figure 3. Stacked and normalized P K-edge X-ray absorption near edge structure (XANES) spectra of fish waste samples with the different stocking densities EAS, SIAS and IAS.
Agriculture 10 00466 g003
Table 1. Chemical characterization of solid African catfish waste. Nitrogen (N), sulphur (S), C:N ratio (C:N), phosphorus (P), aluminium (Al), iron (Fe), calcium (Ca), magnesium (Mg) and potassium (K) were averaged (± standard deviation) from three measurements in each of the stocking densities EAS, SIAS and IAS.
ParameterUnitEASSIASIAS
N%5.2 ± 0.25.4 ± 0.25.1 ± 0.3
S%0.9 ± 0.00.9 ± 0.01.0 ± 0.1
C:Nratio7.9 ± 0.27.4 ± 0.27.8 ± 0.2
P%1.4 ± 0.11.7 ± 0.11.6 ± 0.1
Al%0.1 ± 0.00.1 ± 0.00.0 ± 0.0
Fe%0.2 ± 0.00.3 ± 0.00.3 ± 0.0
Ca%3.4 ± 0.14.2 ± 0.23.9 ± 0.1
Mg%0.2 ± 0.00.2 ± 0.00.2 ± 0.0
K%0.2 ± 0.00.3 ± 0.00.5 ± 0.0
EAS = extensive aquaculture system, SIAS = semi-intensive; aquaculture system, IAS = intensive aquaculture system.
Table 2. Averaged volatile matter (VM), total ion intensity and relative abundance of 10 important compound classes (% of total ion intensity (TII)) from three measurements in each of the stocking densities EAS, SIAS and IAS determined with pyrolysis-field ionization mass spectrometry (Py-FIMS). Different superscripted letters in one line represent significant differences among the stocking densities.
SampleVMTII%TII From Compound Classes
(%)(106 counts mg−1)CHYDRPHLMLDIM LIPIDALKYLNCOMPSTEROLAMIDSUBERFATTY
EAS78.5 a958.5 a2.3 a2.3 a0.8 a3.6 a6.1 a1.1 a14.4 a2.6 a0.7 a12.2 a
SIAS77.2 a1467.8 b2.5 a2.5 a1.2 c3.7 a6.2 a1.3 b14.1 a2.8 a0.8 b7.4 b
IAS85.8 b1396.3 b2.7 a2.4 a1.0 b3.7 a6.0 a1.4 b14.2 a2.9 a0.8 b7.2 b
CHYDR = carbohydrates; PHLM = phenols and lignin monomers; LDIM = lignin dimers; LIPID = lipids; ALKYL = alkyl- aromatics; NCOMP = heterocyclic N containing compounds; STEROL = sterols; AMID = amino acids, peptides, amino sugars; SUBER = suberin; FATTY = free fatty acids.
Table 3. Proportions of Ca phytate, Ca hydrogen phosphate (CaHPO4) and Ca hydroxyapatite in % in the samples EAS, SIAS and IAS determined with K-edge XANES analysis, including R-factor as a goodness-of-fit criterion.
SampleCa PhytateCaHPO4Ca HydroxyapatiteR-Factor
in %
EAS87670.0094
SIAS5347 0.0267
IAS7624 0.0102

