Article

Impact of Climate Change in the Banat Plain, Western Romania, on the Accessibility of Water for Crop Production in Agriculture

Banat’s University of Agricultural Sciences and Veterinary Medicine “King Michael I of Romania” from Timisoara, Calea Aradului no. 119, 300645 Timișoara, Romania
*
Authors to whom correspondence should be addressed.
Agriculture 2020, 10(10), 437; https://doi.org/10.3390/agriculture10100437
Submission received: 7 September 2020 / Revised: 22 September 2020 / Accepted: 24 September 2020 / Published: 27 September 2020

Abstract

:
Global warming is an unanimously accepted phenomenon by the international scientific community, being already highlighted by the analysis of observational data over long periods of time, with an increase in temperature of over 1 °C. Climate change in Romania is part of the global context, taking into account the regional conditions, with an increasing trend of arid summer. While the link between high temperatures, climate change and rainfall has been modeled in detail, the situation is not the same for plant water accessibility. The period of time between 1898 and the present, corresponding to the annual records of precipitation and evapotranspiration, overlapped with important political and administrative changes in the studied area, and with extensive hydro-amelioration works. The aim of the paper is to statistically follow the evolution over time of precipitation, namely of evapotranspiration measured in Western Romania, which would allow the expression of conclusions regarding the improvement directions of the water regime. In order to follow the evolution in time of these data, the interval of 1898–2019 was divided into three periods: 1898–1950, 1951–1989 and 1990–2019, respectively. The increase in temperature, especially during the vegetation period and the large number of years in which evapotranspiration quantitatively exceeds the precipitation, indicating the need for effective measures to regulate the water balance.

1. Introduction

Globally, the general effects of climate change on freshwater resources have direct negative repercussions for the water circuit [1,2,3]. These negative effects are observed by changing their distribution around the globe, such as the fall area, their quantity, as well as their distribution over time (vegetation period, cold period of the year). These changes in the water circuit in nature, as a consequence of climate change, have a stronger impact than global warming [4,5]. More floods are being recorded, while arid areas are increasing globally, which has negative repercussions on ensuring the food of an ever-growing population, providing the necessary water to industry, agriculture and water supply to the population, as well as ensuring a hygienic and comfortable standard of living [6,7,8].
The complex effects of climate change on agriculture underpin the need for risk reduction decision making in order to maintain adequate crop standards and promote sustainable agriculture. Most of the authors say that the temperature is the most relevant factor affecting growth and yield of crops and also increasing CO2 concentrations [9,10]. Thus, variability and climate change must be addressed through the efficient management of water resources in agriculture, respectively, a better use of soil moisture reserves throughout the growing season, including the choice of sowing periods according to the degree of water supply of soils, as well as low energy consumption through the application of irrigation. Studies show the impact of climate change on agriculture as having irreversible effects if no action is taken in time, especially for water factors [11,12,13].
Changes in the global and regional rainfall regime are expected to have a significant impact on the accessibility of water to plants and implicitly in the distribution, structure, composition and diversity of populations and communities of plants, animals and microbes as well as the ecosystems that protect them [14,15,16].
Climate change has a significant impact on water runoff by changing the amount of rainfall and potential evapotranspiration. This translates into the fact that the runoff is due to the difference in water between precipitation and evapotranspiration noted with ET (water consumption of plants together with evaporation) [17]. According to the fourth IPCC report, the global temperature has risen by 0.85 °C and is constantly rising [18]. This will have the effect not only of melting snow, glaciers, rising sea levels, but will also have an effect on evapotranspiration [19,20,21]. Research on evapotranspiration has shown that a parameter responsible for a significant upward trend in evapotranspiration of ET reference cultures, would be strong winds [22]. Hidalgo and collaborators [23] found strong correlations between daily ET variation and that of net radiation, relative humidity and cloud cover, but a weak correlation between daily ET variations and average daily air temperature. Xu et al. [24] detected a decreasing trend in ET due to significant decreasing trends in net radiation and wind speed, despite a significant increasing trend in air temperature for the Changjiang River watershed.
There is a lasting distinction between ET and Precipitation (P) which has been taken into account as an action of drought applied in many climate categorization (Koppen; Thornthwaite) [25]. From a climatological point of view, aridity is considered to be a crucial environmental agent being able to establish the features and the lasting of the natural vegetation and earthly ecosystems, and is still becoming connected to the access of the water to the plant and the condition of water supplies. The fluctuations of such distinction may represent a dryness indicator. Pursuant to actual shaping analysis, climate change may soon lead to some growing in the frequency and intensity of drought and the extension of desert areas. [26]. Thus, these transformations would have a serious impact on water provisions, eco-systems, and socio-economic facilities. Consequently, a study on the difference between ET and P is needed to discover how much water in precipitation covers the water requirement of plants and can provide us with the basis for early warning systems in case of climate changes [27,28].
Awareness of climate processes associated with ET variability is also needed to improve hydrological models [29,30]. Climate mechanisms related to ET variability can provide information needed for water and energy resource management, to assess the influences of changing land surface conditions, and to anticipate the need for irrigation water, water supply system requirements, and plants’ water accessibility [31,32]. In recent decades, satellite data have been used to estimate evapotranspiration, providing information on vegetation indices and scintillometer systems, which have developed rapidly as a result of equipment development, data acquisition and access to remote sensing [33].
More models for calculating water consumption, evapotranspiration culture, index, related evaluations of evapotranspiration (ET) are disclosed in the literature and utilized to expend, assess, and verify major process patterns of evapotranspiration. ET information are resulting from a series of appreciation system, containing lysimiters, swirl estimator. The percentage of the bowen, groundwater equilibrium (volumetric, neutron meter, other soil water detections), Seva flow, scintillometry, also earth observations and modeling directly satellite. All evaluations methods demand major experimental methods and are subject to interpretations in the given results. The indicated data, including evaluation and measurement interpretations, lead to major confusion and also independence for the progress of ET models and in determining water requirements for irrigation and turns into important financial losses produced by the management of misinformed water [34,35,36,37,38,39]. Although there are many methods of calculating evapotranspiration which have been debated by many researchers, it is important to use the most appropriate method for the geographical conditions in the studied area and with the climatic data that are available to the users.
The purpose of this paper is not to find the most advanced calculation method for evapotranspiration, namely water consumption of plants, but it aims to analyze in the first phase the climate change in the Banat Plain, if it folds on the global warming trend. The evolution of temperature and rainfall over a long series of years (over 100 years) is analyzed, as well as the determination of water consumption for this period under study. The impact of the study consists in the statistical processing of precipitation and evapotranspiration for periods of time between 1898 to present, which overlapped with important political and administrative changes in the studied area. All this has led to important changes in local agriculture, from the structure of land ownership to applied agricultural technologies. Additionally, this period of time, for more than a century, has undergone continuous changes in terms of soil water regime through hydro-amelioration works to which climate change has been added. In order to follow the evolution in time of these data, the period of 1898–2019 was divided into three periods: 1898–1950, 1951–1989, and 1990–2019, respectively; thus, the limits of the time periods are symbolic. It should be mentioned that from the series of 122 years when the registrations were made, only five registrations are missing related to the period of the first great world conflagration.

2. Materials and Methods
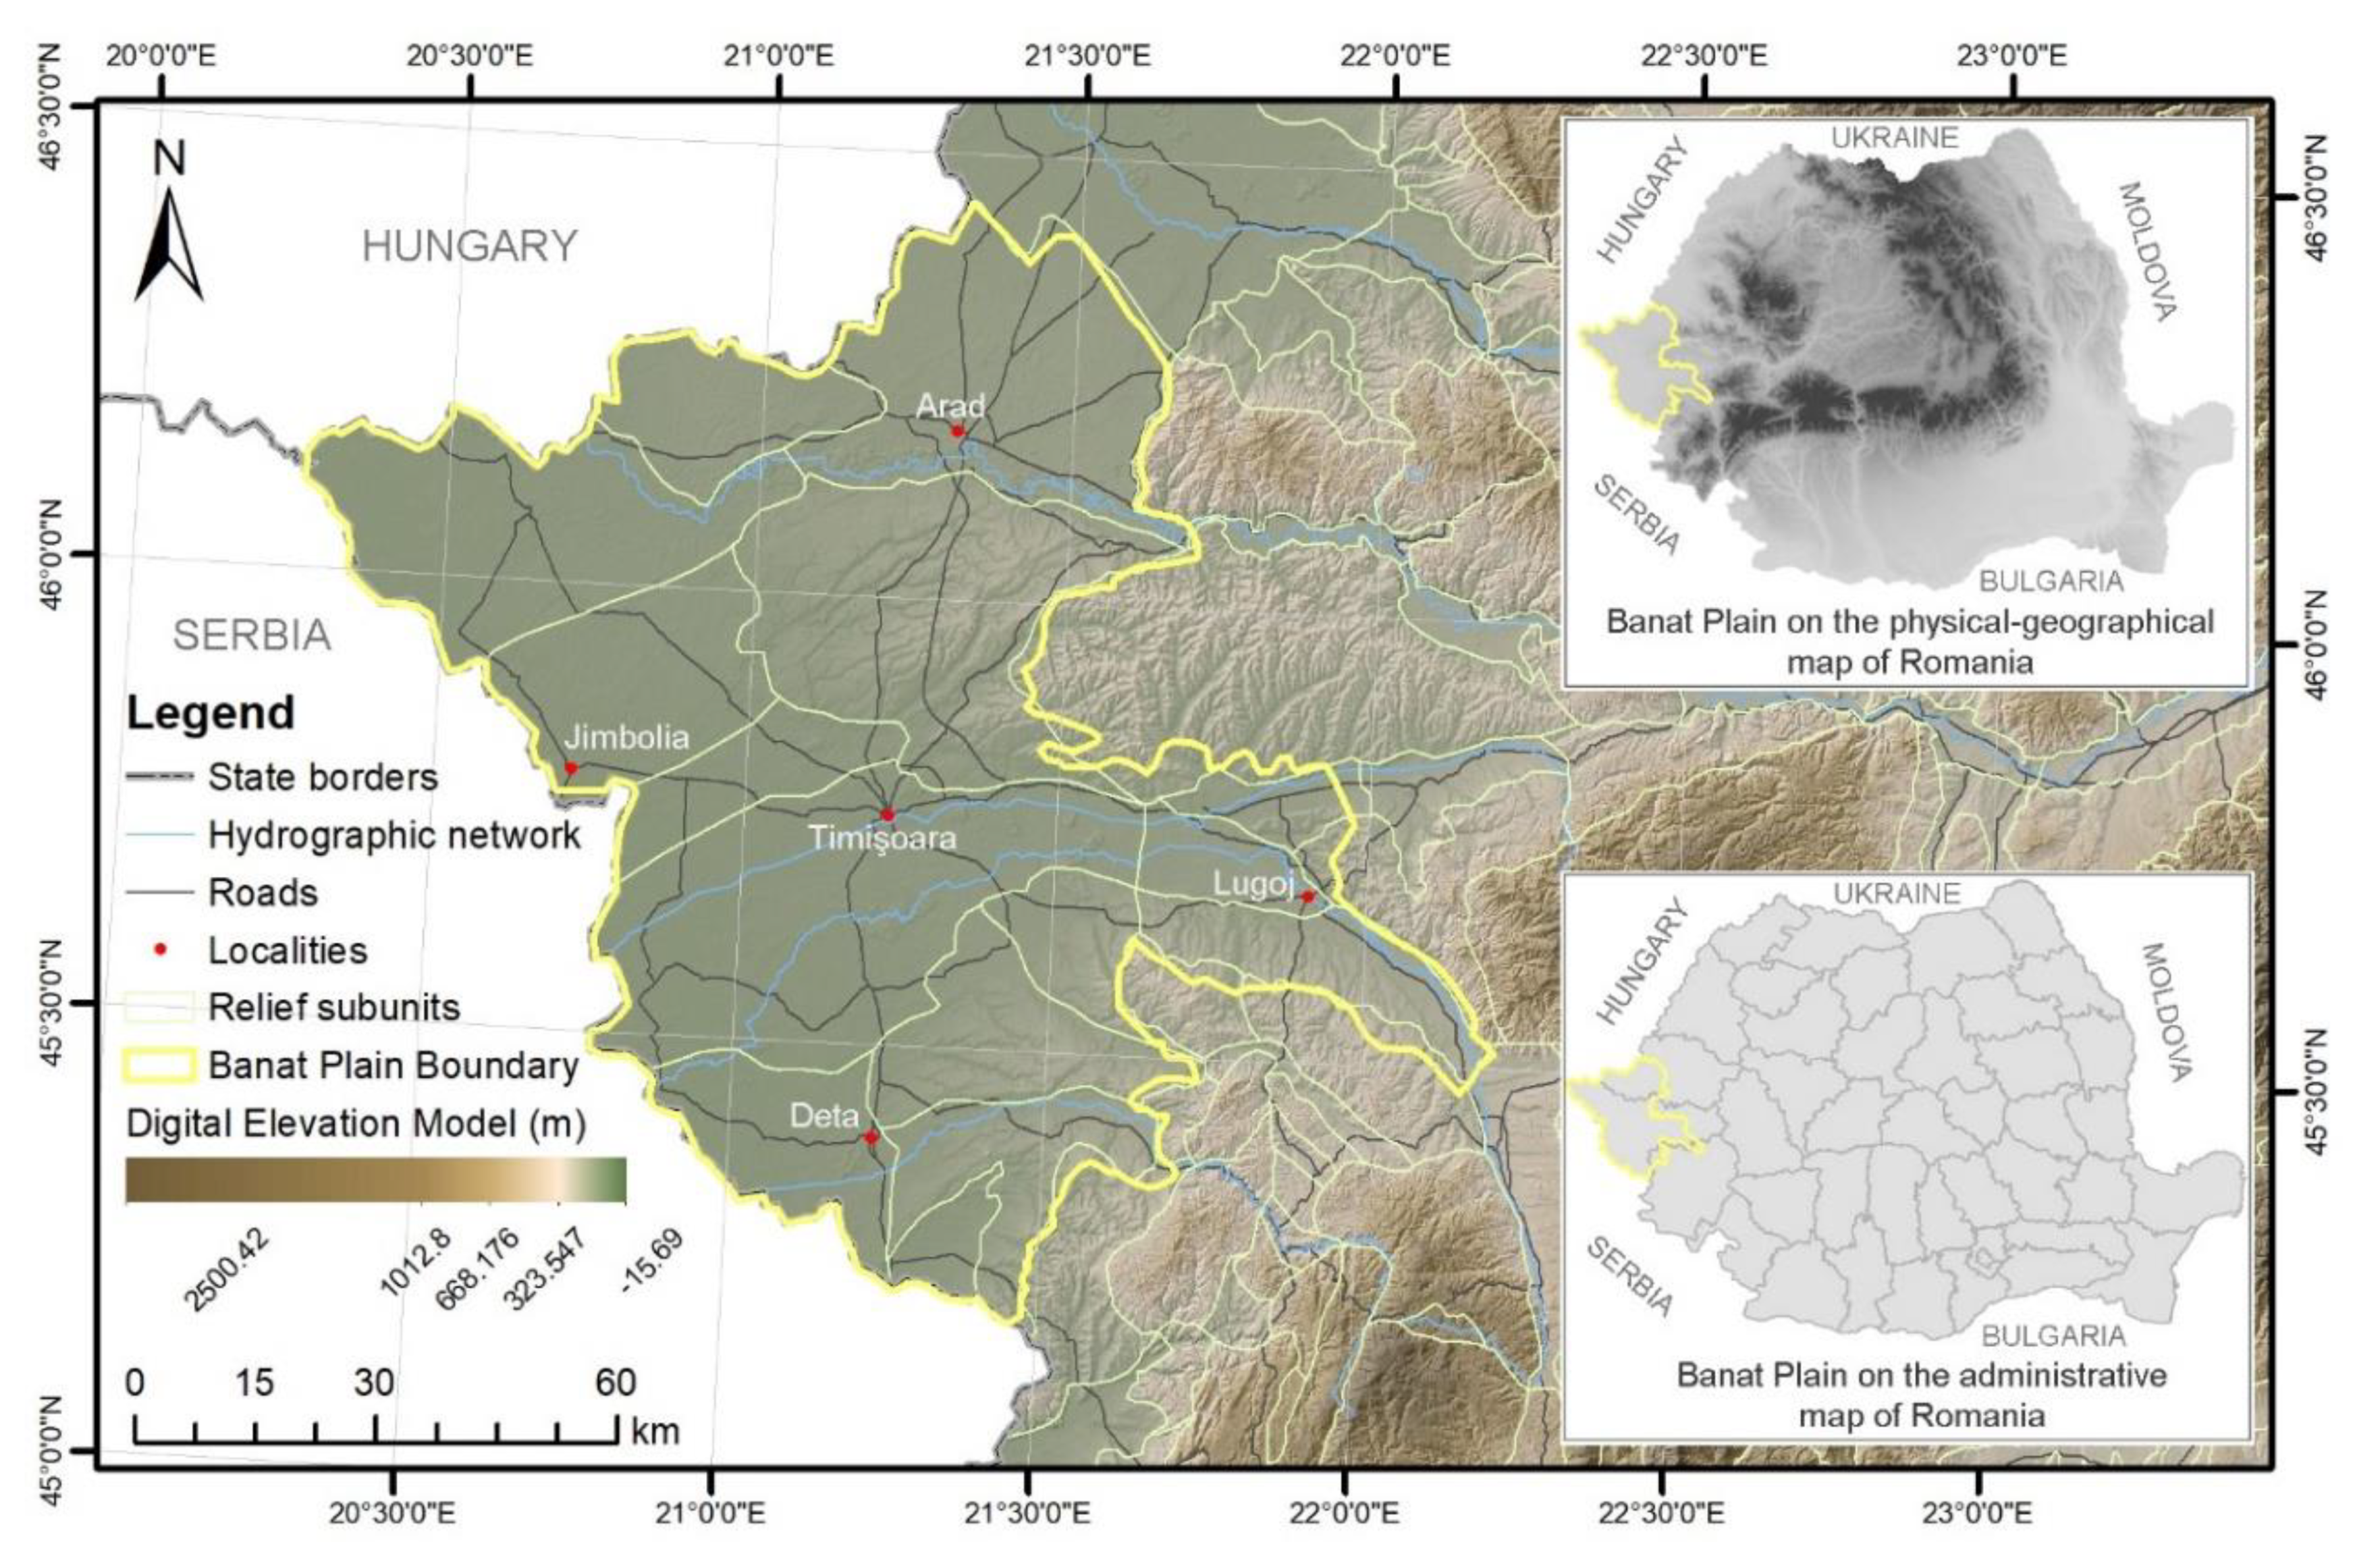
2.1. Study Area

The Banat Plain is located in western Romania and is the largest landform in Banat, occupying about half of the area. It is in the form of a strip limited to the western part by Romania’s border with Serbia and at east of the hilly area, where it penetrates under the appearance of bays of different widths, to the interior of the mountains, in the north it is after the Mureş River, and the southern limit is given by the border with Serbia (Figure 1).
The surface of the Banat Plain has a reduced slope from east to west, a fact highlighted by the direction of the rivers permanently furrowing it. Its altitudes oscillate between 80–180 m, exceptionally descending to 75–77 m at the exit of Aranca and Timiş from the country and climbing to about 200 m on some terraces under the Pogăniş Hills or in the eruptive nipple Şumig (198 m). The Banat Plain is one of the eastern parts of the large sedimentation basin called the Pannonian Depression. The latter sank, on alignments of faults oriented approximately N-S (Pannonian type faults), more to the west and less near the Carpathians. The immersion took place mainly starting with the Badenian, and had a subsident character, with a maximum during the Pannonian, after which the abandonment became slower [42]. The subsidence movements are translated in the landscape by the unraveling of the rivers, the digression of the watercourses, the existence of large swampy areas of lakes and alluvial plains.
The rhythmic retreat of the lake domain, a direct consequence of the rhythmic uplift movements of the neighboring mountains and hills, as well as of the subsidence movements in the center of the middle Danube Plain, determined the flooring of the Banat Plain, resulting in a high Pleistocene step in the vicinity of low step, of digression, Holocene and a meadow area, with a young relief, little evolved.
The deplorable state of extensive swamps and permanent flooding of the uncontrolled rivers in the Banat Plain in the early 18th century, after the expulsion of the Turks from Banat, led the provincial administration to take measures to drain these swamps and regularize rivers, especially the Bega Canal. The special impact of the hydro-amelioration works in the Banat Plain, started in the 18th century, determined the lowering of the groundwater level on the entire area of the plain, with repercussions on the current soil moisture regime, implicitly of water accessibility for plants.
The slow descent of the groundwater level under the influence of the first hydro-amelioration works and its maintenance for long periods of time (over 200 years) at critical depths (0.5–1.5 m), corroborated some climatic aridity that has begun to manifest itself since the end of the 19th century, making the entire area of the Banat Plain function as a huge vaporizer. Since 1950, land improvement works are resumed in Banat based on large national projects and with increased intensity. Groundwater levels are rapidly falling below critical levels, and the remaining swamps of the past are drained rapidly. Currently, the Banat Plain is completely drained.
Through these hydro-amelioration measures, it was possible to stop the expansion of the salted lands. But the dry climate favored the intensification of the exudative regime. Against the background of a slight climatic aridity, recent accumulations of sodium are reported in the lower and middle part of the soil profile. The extensive hydro-amelioration works started in the 18th century determined the lowering of the groundwater level on almost the entire area of the low plain. However, the exudative water regimes installed in the soils of the low plains of Banat can create major problems in the future. If a longer period of excess moisture is added, the groundwater level will rise and sodium accumulations will be reported. The most affected areas are the low plains, where ion exchange positions are still taking place. The accentuated geometrization of the desiccation–drainage system also prevented the total solution of the excess stagnant humidity.
The climate of the Banat Plain is under the domination of the western circulation, of Atlantic nuance, but also feeling strongly Mediterranean influences. On the other hand, its geographical position and the shelter offered by the Carpathians, protect this unit from the cold air masses in the N and NE. However, the influences of the Scandinavian anticyclone, which pushes cold air here, especially in spring, are not excluded, as well as rare influences of the Eastern European anticyclone, especially in winter, with direction from N, NE and E.
The Banat plain is defined as a wetland with sweet winters and warm summers. According to Koppen, the investigated territory falls into the province “C”, the subprovince “f”, the region “b” and the sub region “x” (Cfbx). Cf means regions with milder winter and precipitation all year round, b—the average temperature of the warmest month, which is below 22 °C, and x means that precipitation falls, in the greatest amount, at the beginning of summer.

2.2. Data Sources

Climate change in the Banat Plain was highlighted by using meteorological data from the Regional Meteorological Center Banat-Crisana, Romania, because it is the station with the oldest records in Western Romania, and a long series of data can highlight the best the evolution and climate trend. In this station from 1873 the precipitations were registered, and the temperatures started to be registered from 1897, unlike the other stations from the Banat Plain which started their activity only around 1950. This resulted in a series of data of 146 years (1873–2019) in which the precipitation fell, although information on the years 1916–1921 is missing due to the world conflagration, it was estimated that a long series of data can bring us relevant conclusions about the evolution over time and probable precipitation trend. Temperatures were recorded for a period of 122 years (1897–2019) except that between 1917 and 1920, when records are missing.
In order to highlight the accessibility of water for plants in agriculture, the data have been processed per agricultural year and not per calendar year. The two periods of the year were also differentiated: the conventional warm period, 1 April–30 September described in the content of the paper by IV–IX, and the cold period of the year, 1 October–31 March described by X–III.
The evolution of temperatures and precipitations was also represented by averages of 10 and 50 years, respectively. The average temperature and precipitation for decades was calculated for the following periods of the year: Agricultural year (October–September), conventional warm period (April–September) and extended warm period (March–October). Multiannual averages of 50 years, shifted by 10 years, were also calculated for the three intervals, but also for October–March (conventional cold period).

2.3. Methodology

In order to assess the water consumption of the plants, the evapotranspiration was taken into account, which represents the amount of water extracted from the soil and lost through the perspiration of the plants, to which is added the direct evaporation of water from the soil surface.
The potential evapotranspiration was calculated with the Thornthwaite method because it can be calculated with the data provided by the Regional Meteorological Center Banat-Crisana, Romania.
By using the Thornthwaite method, the best results are obtained for the calculation of the potential evapotranspiration, but it is necessary that, for the calculation of the water consumption, proportionality coefficients be established depending on the climatic and soil conditions area and the plant.
This method is based on temperature, an argument in its choice, because some errors that may occur in the recording of temperature have a small influence on the calculated evapotranspiration. Thus, for example, an error of ± 1 °C on the monthly average leads to a variation of consumption of maximum ± 50 m3 ha−1.
The general formula for calculating potential evapotranspiration after Thornthwaite is:
PET = 1.6 · ( 10 · t I ) a   · K
where PET is the potential evapotranspiration (cm), t is the average temperature of the month for which PET is calculated, in °C, a is an empirical coefficient, determined by the relation:
a = 0.000000675 · I3 − 0.0000771 · I2 + 0.01792 I + 0.49239
where K is the brightness coefficient, corresponding to the geographical position (latitude) of the studied area, established according to the average number of hours’ light of the days of each month, I represents the thermal index of the area where the land is located;
I =   n = 1 n = 12 i
where i is the monthly thermal index, the values of which are according to the average multiannual temperature.
i = ( t n 5 ) 1.514
where tn is the average multiannual (normal) temperature of each month of the year, in °C. Monthly indices (i) are calculated only for positive temperatures.
In order to obtain the optimal real evapotranspiration (ETRopt), the data calculated by the Thornthwaite formula must be converted with the help of the correction coefficients for the crops studied in this case from the Banat Plain area.
The monthly statistical data series on evapotranspiration and precipitation, recorded annually, led by the cumulation of values during the warm period of the years (April–September) to two ETP series (IV–IX)—Cumulative evapotranspiration during the warm period, respectively P (IV–IX)—Cumulative precipitation during the warm period. Additionally, by cumulation during a whole year of the precipitations, respectively, of the evapotranspiration, at the level of each year during the entire studied period, the ETP (year) and P (year) series were determined. Performing the ratio between precipitation and evapotranspiration for each year, for the entire time period studied, 1898–2019, the P/ETP series (IV–IX) and P/ETP (year) were determined. Statistical calculations were performed using SPSS (Version 20, IBM, Armonk, NY, USA). SPSS, Microsoft Excel (2016, Microsoft Corporation, Redmond, WA, USA) and Past 4.03 were used for graphical representations [43].

3. Results and Discussion

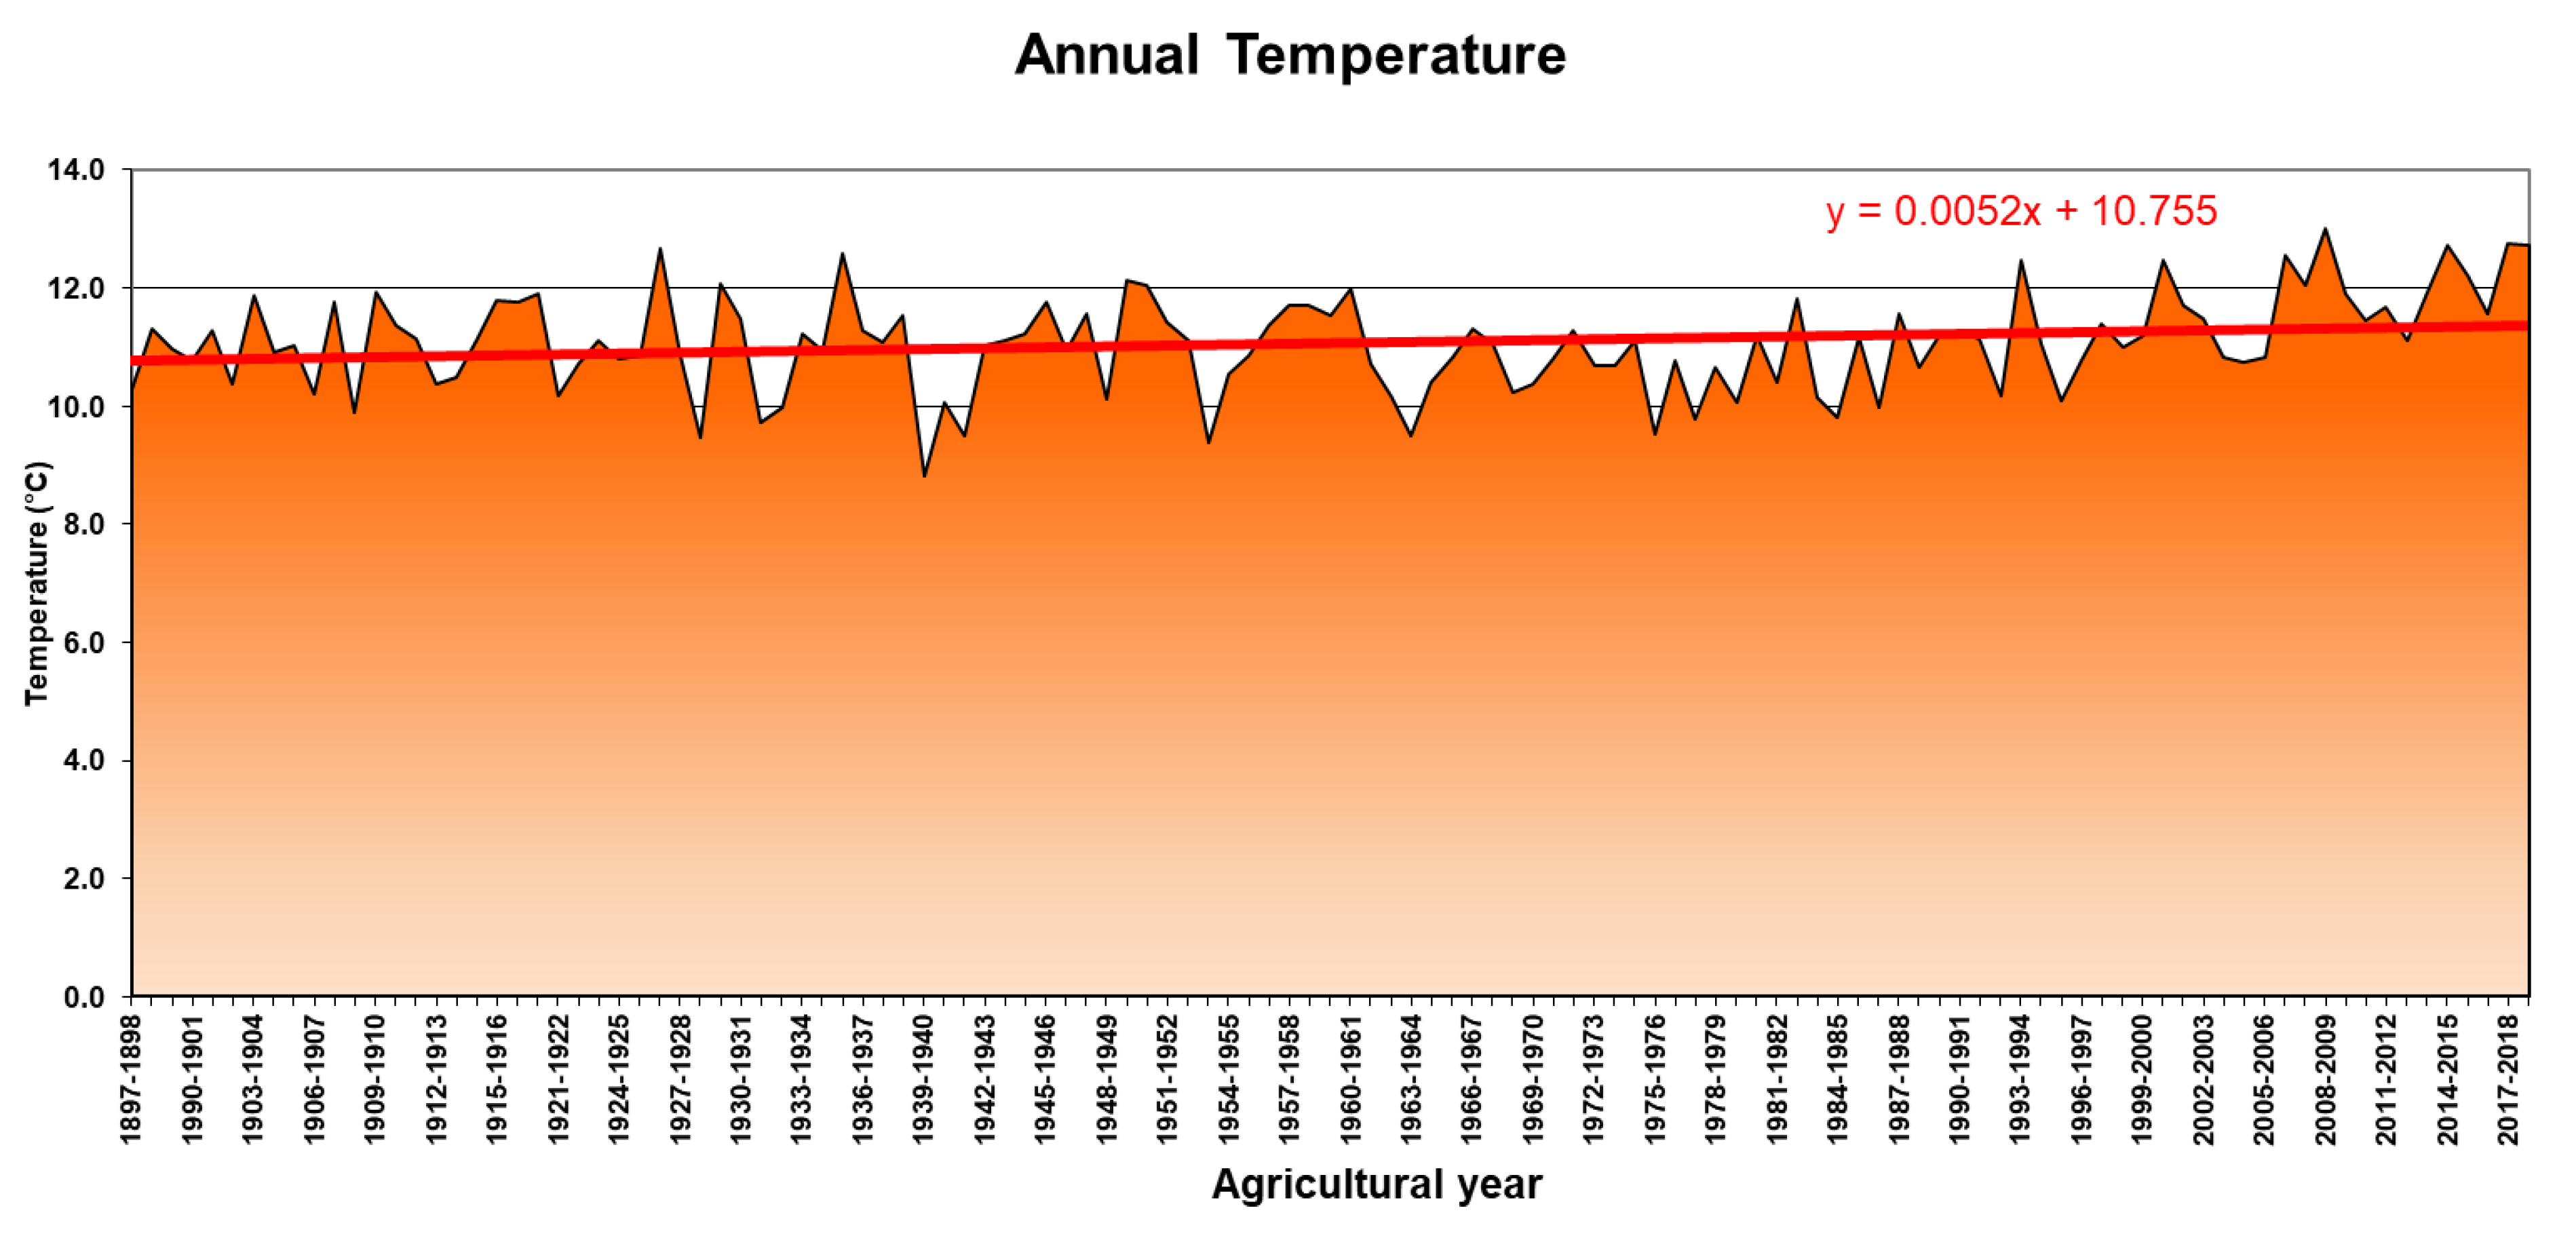
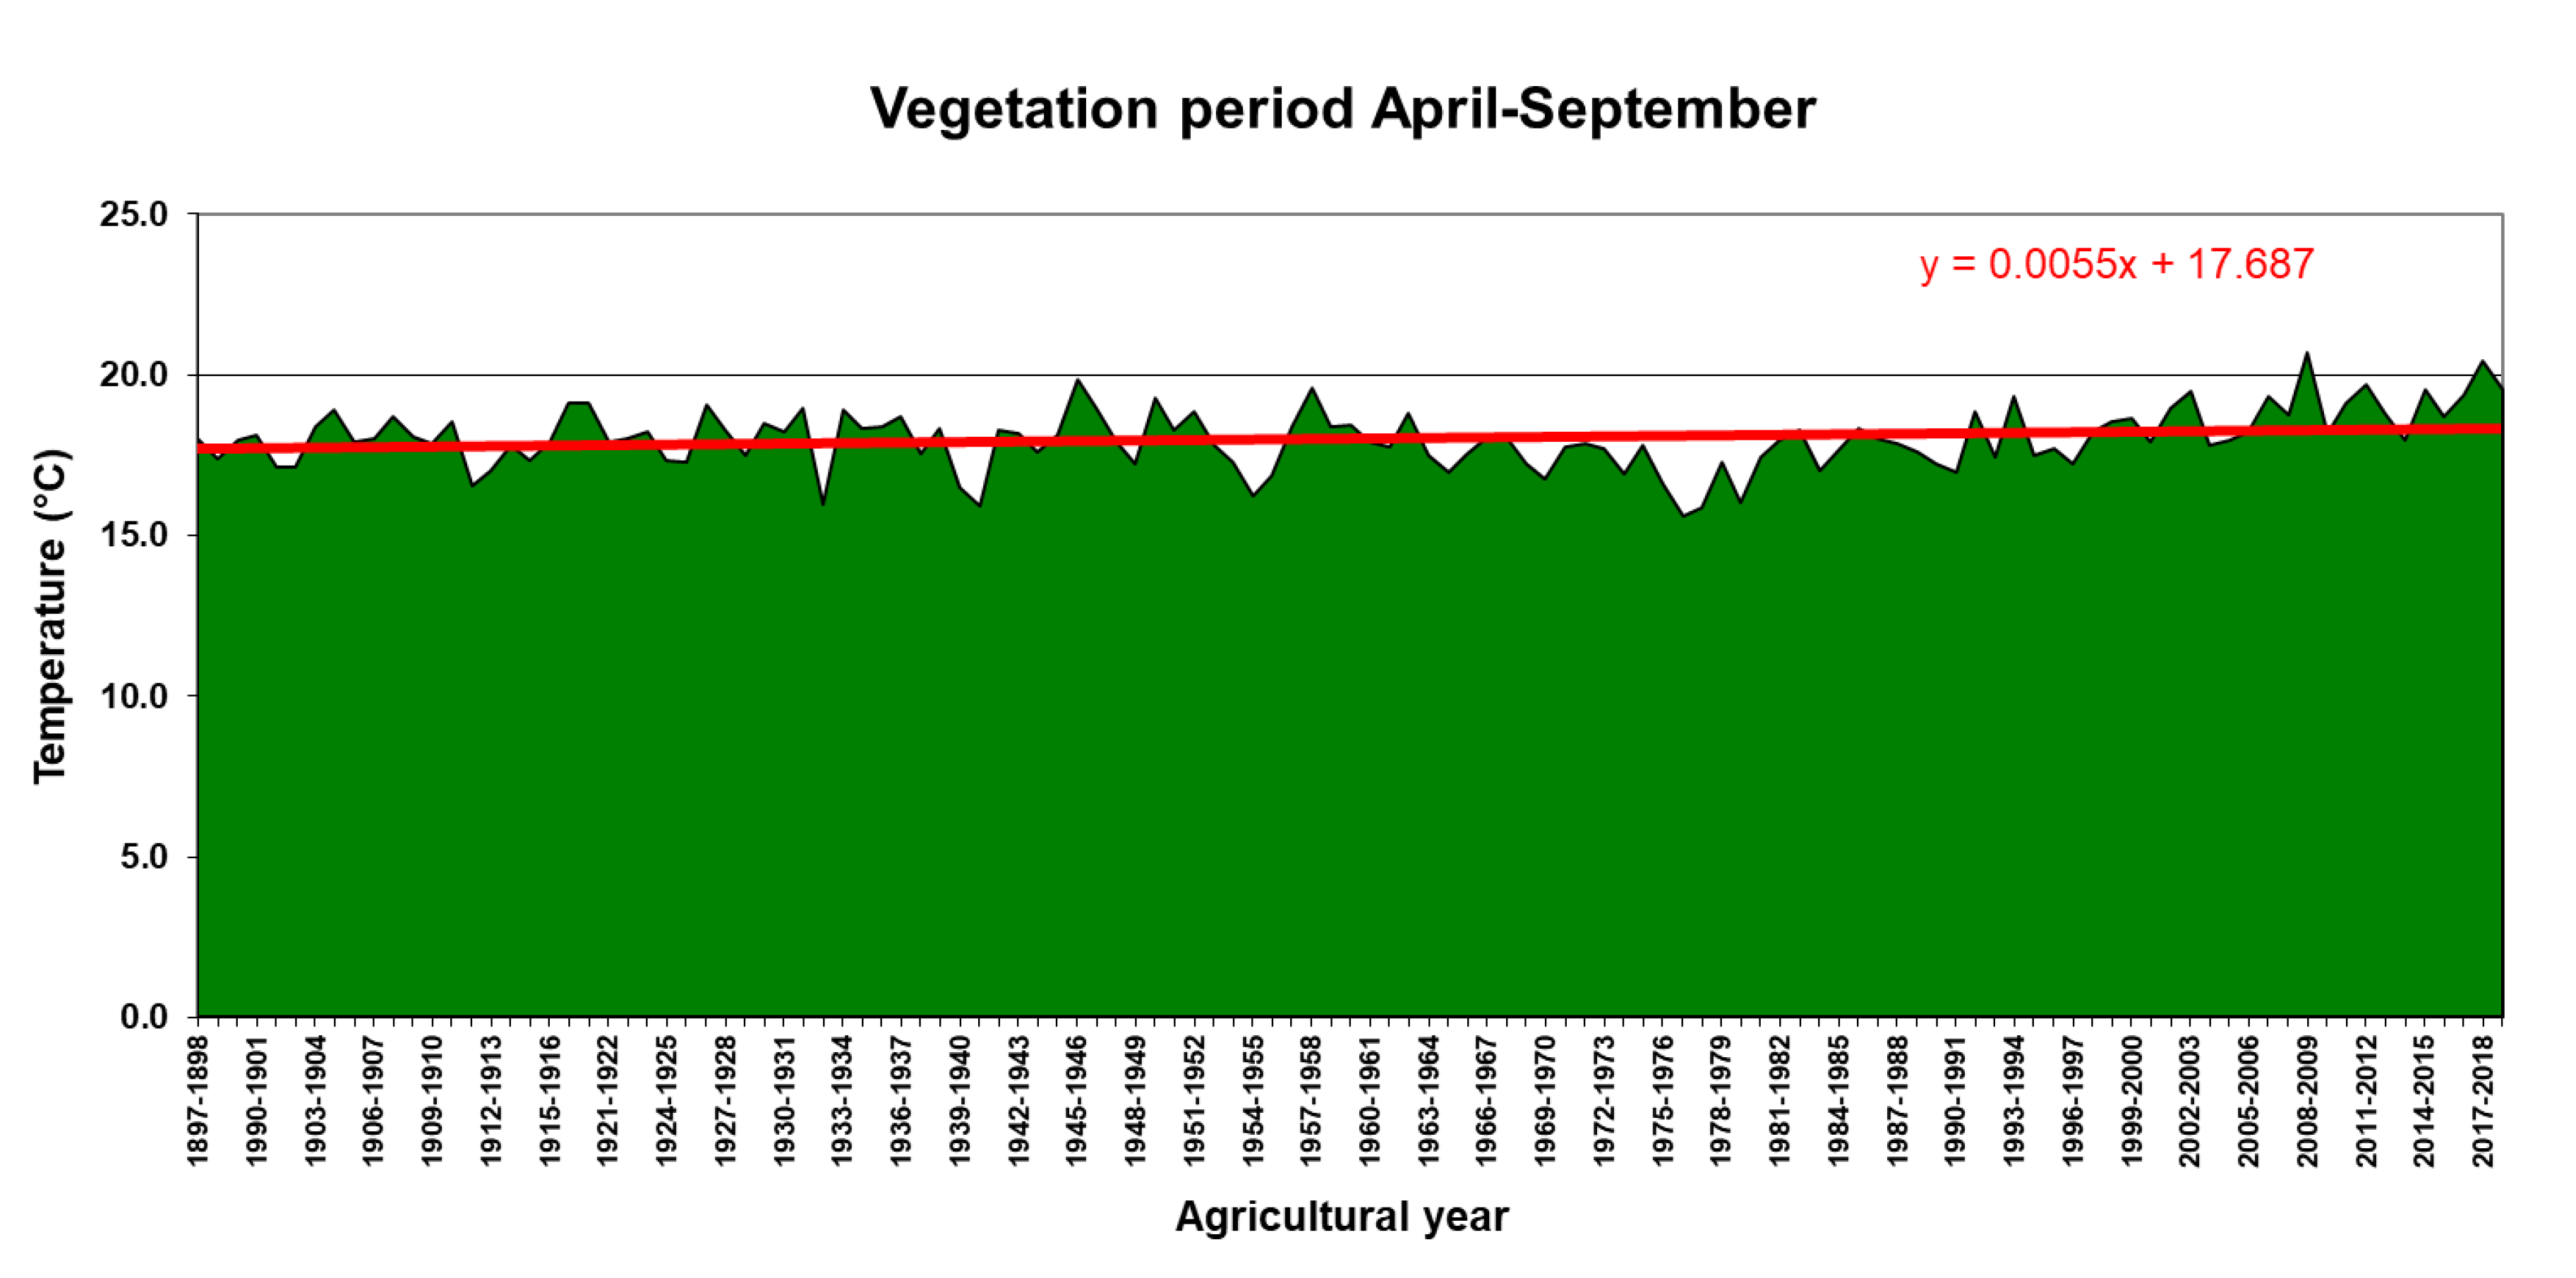
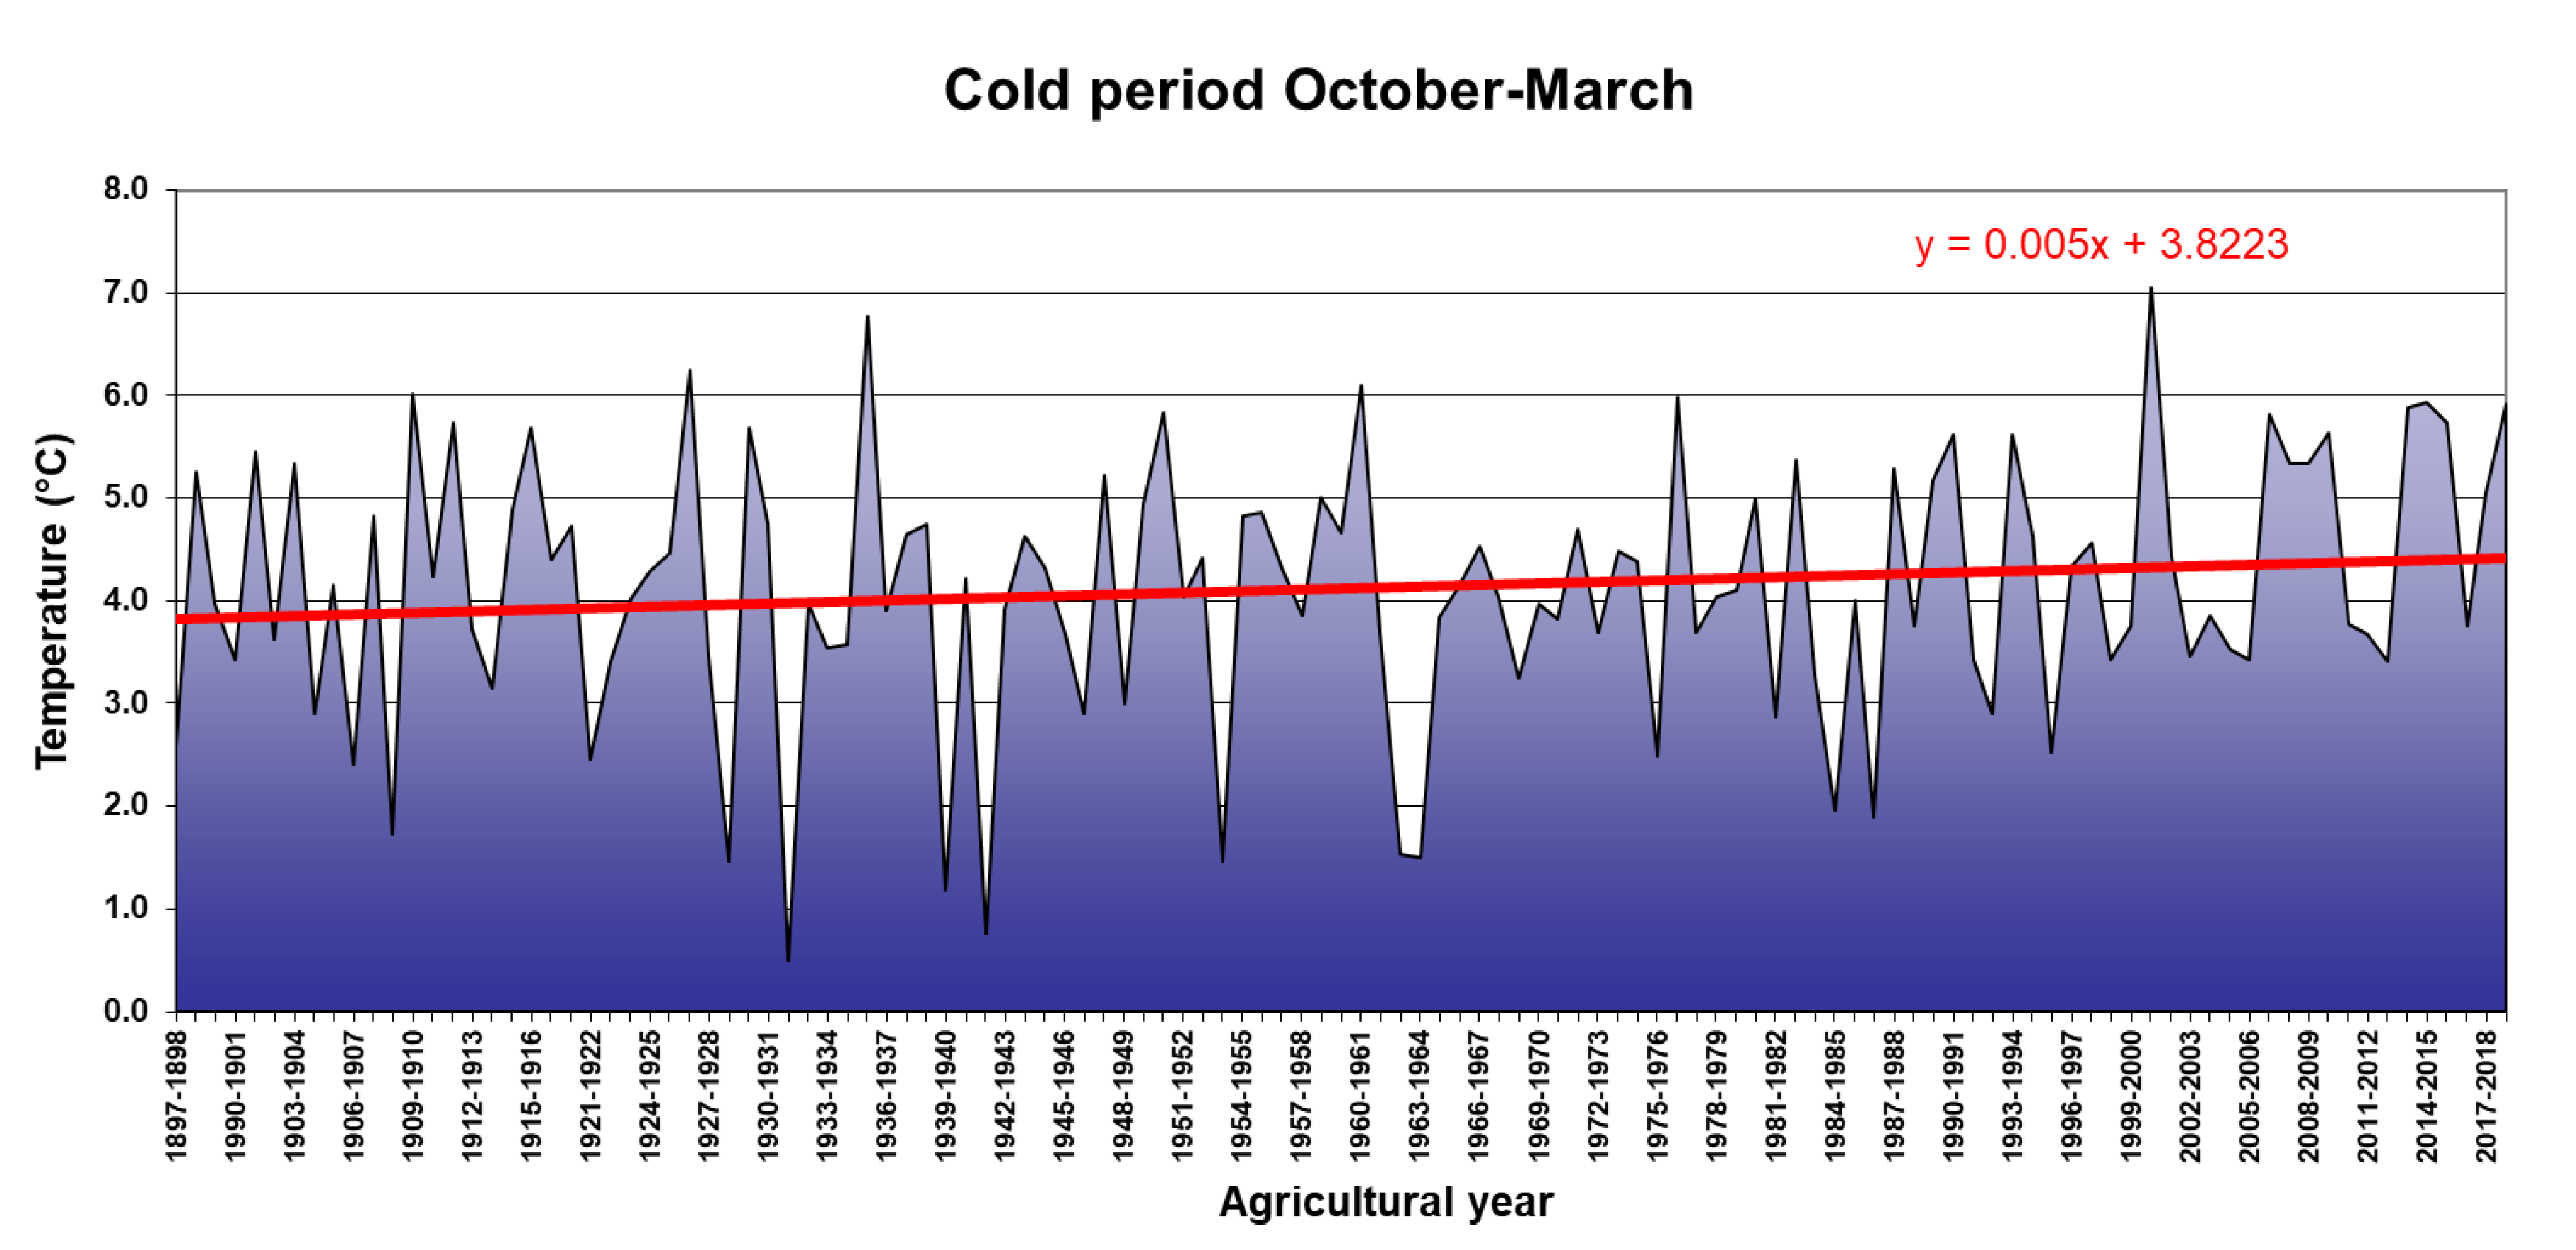
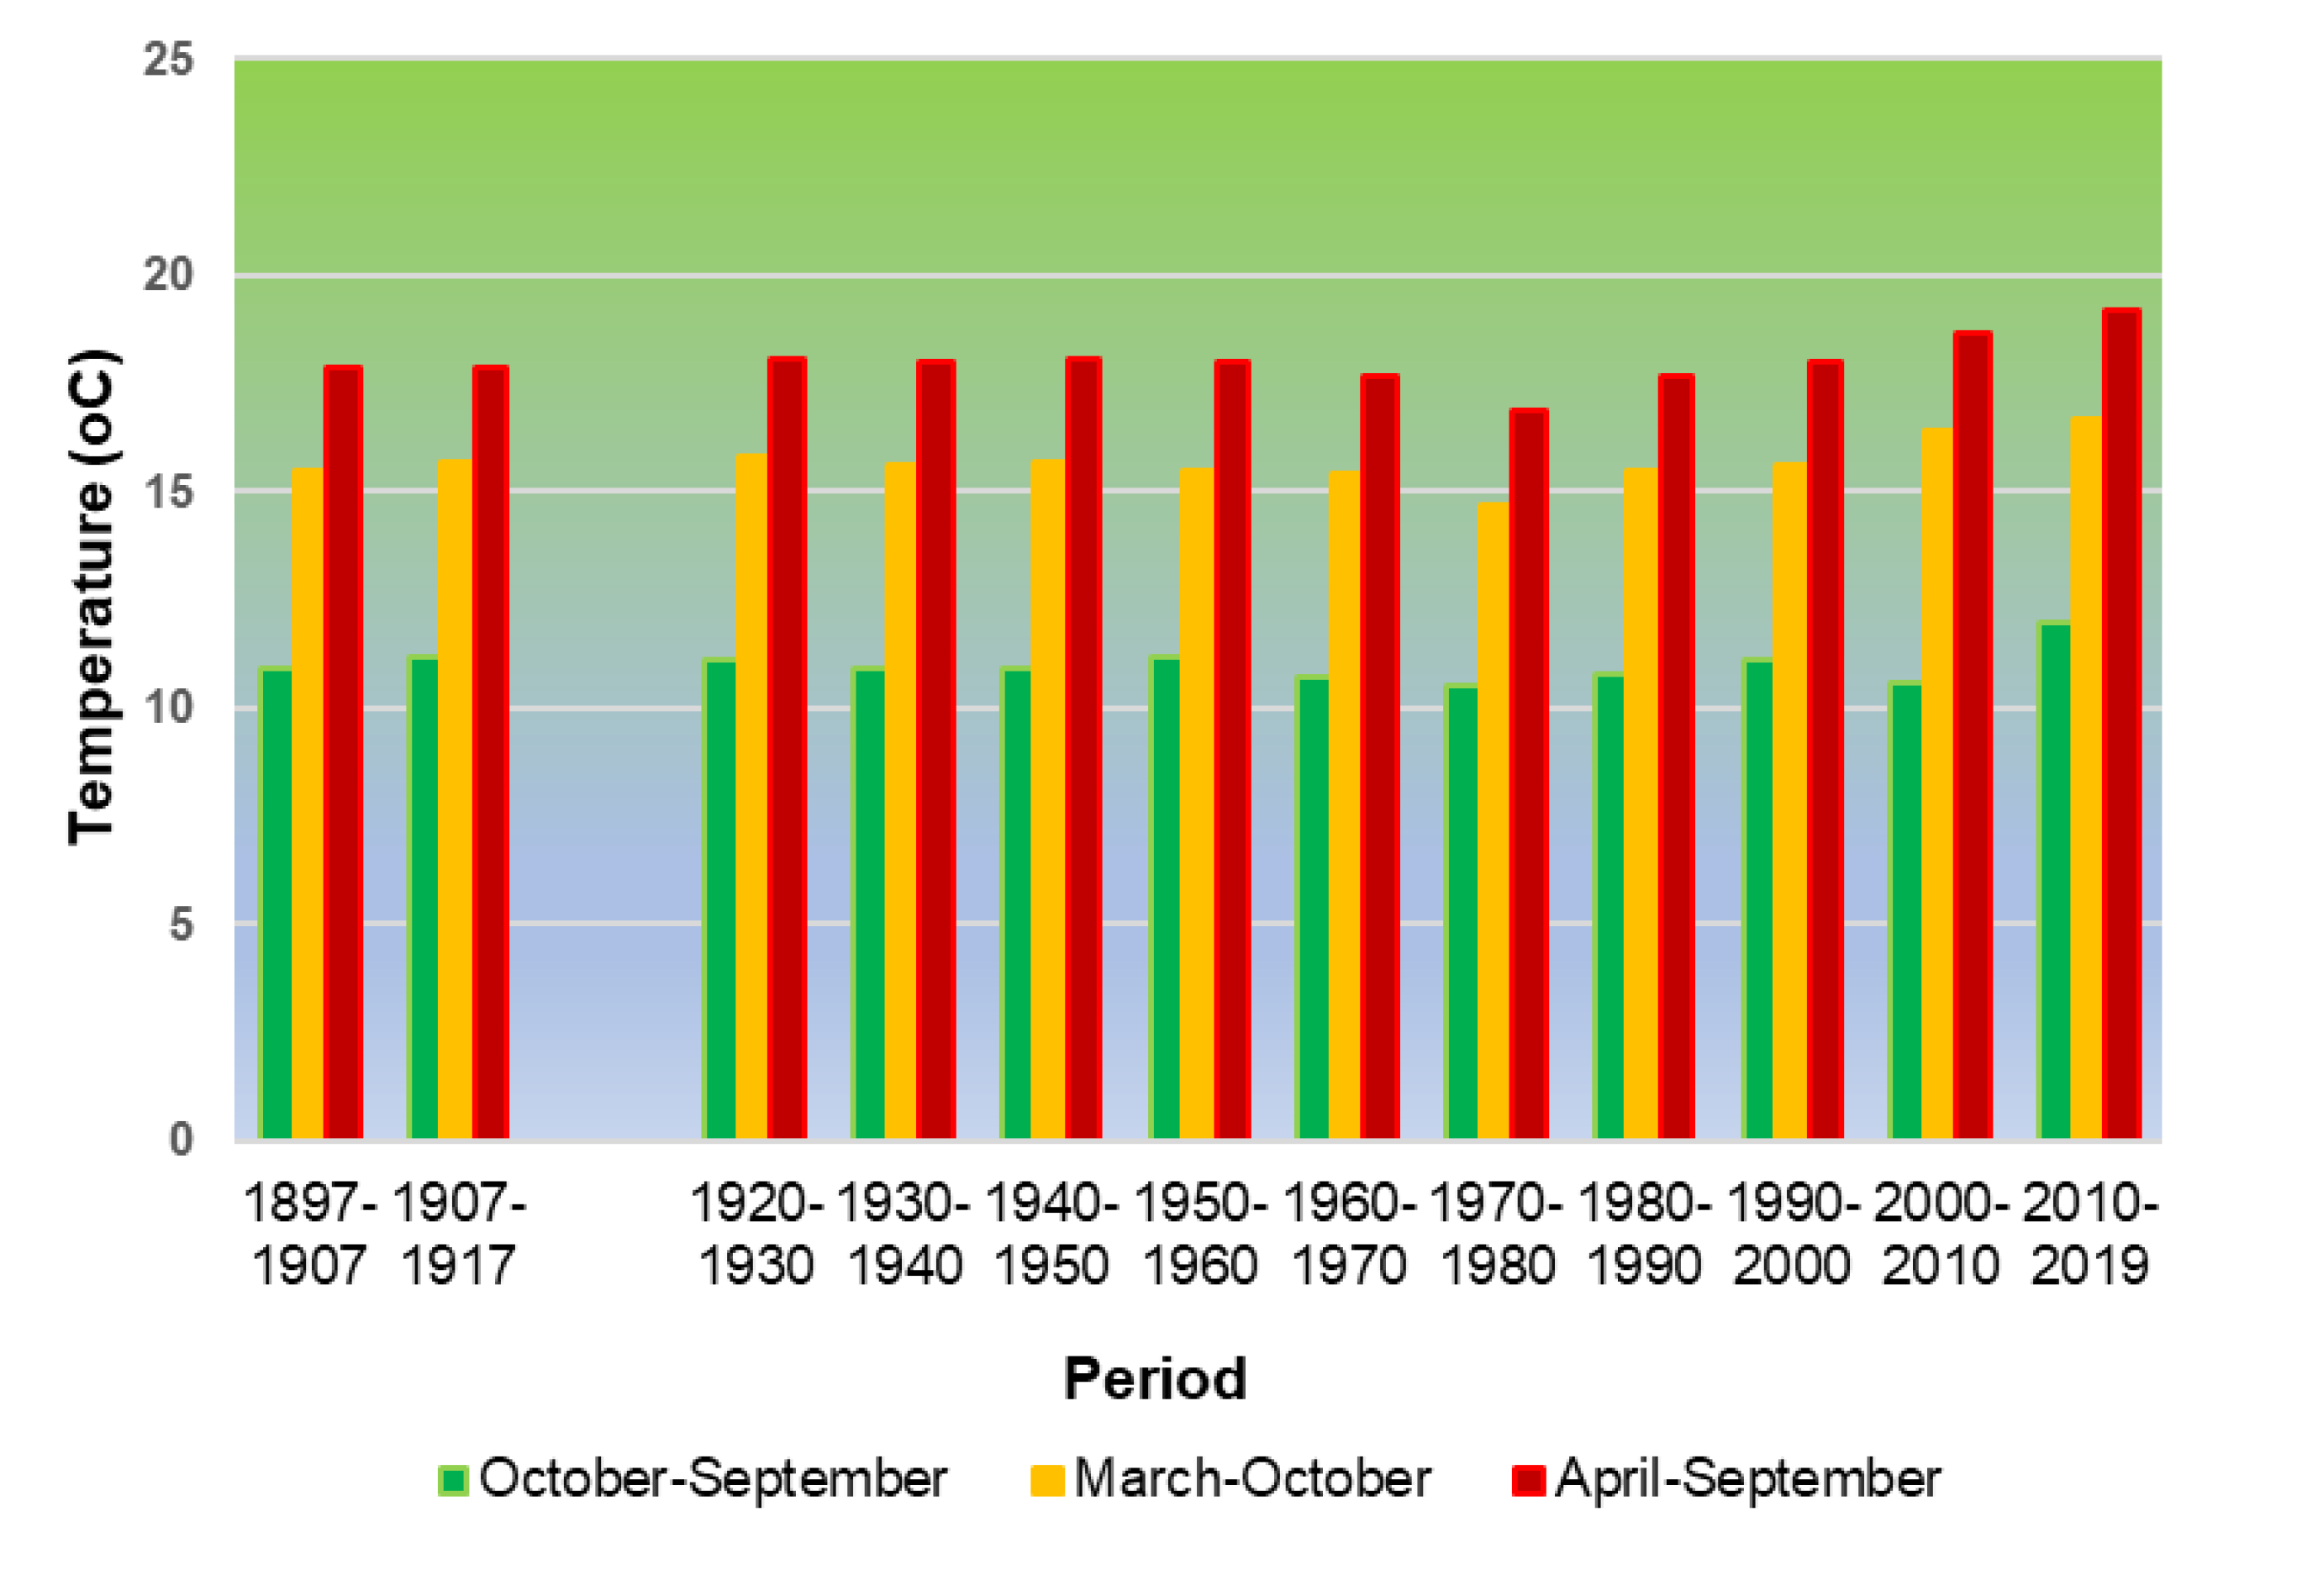
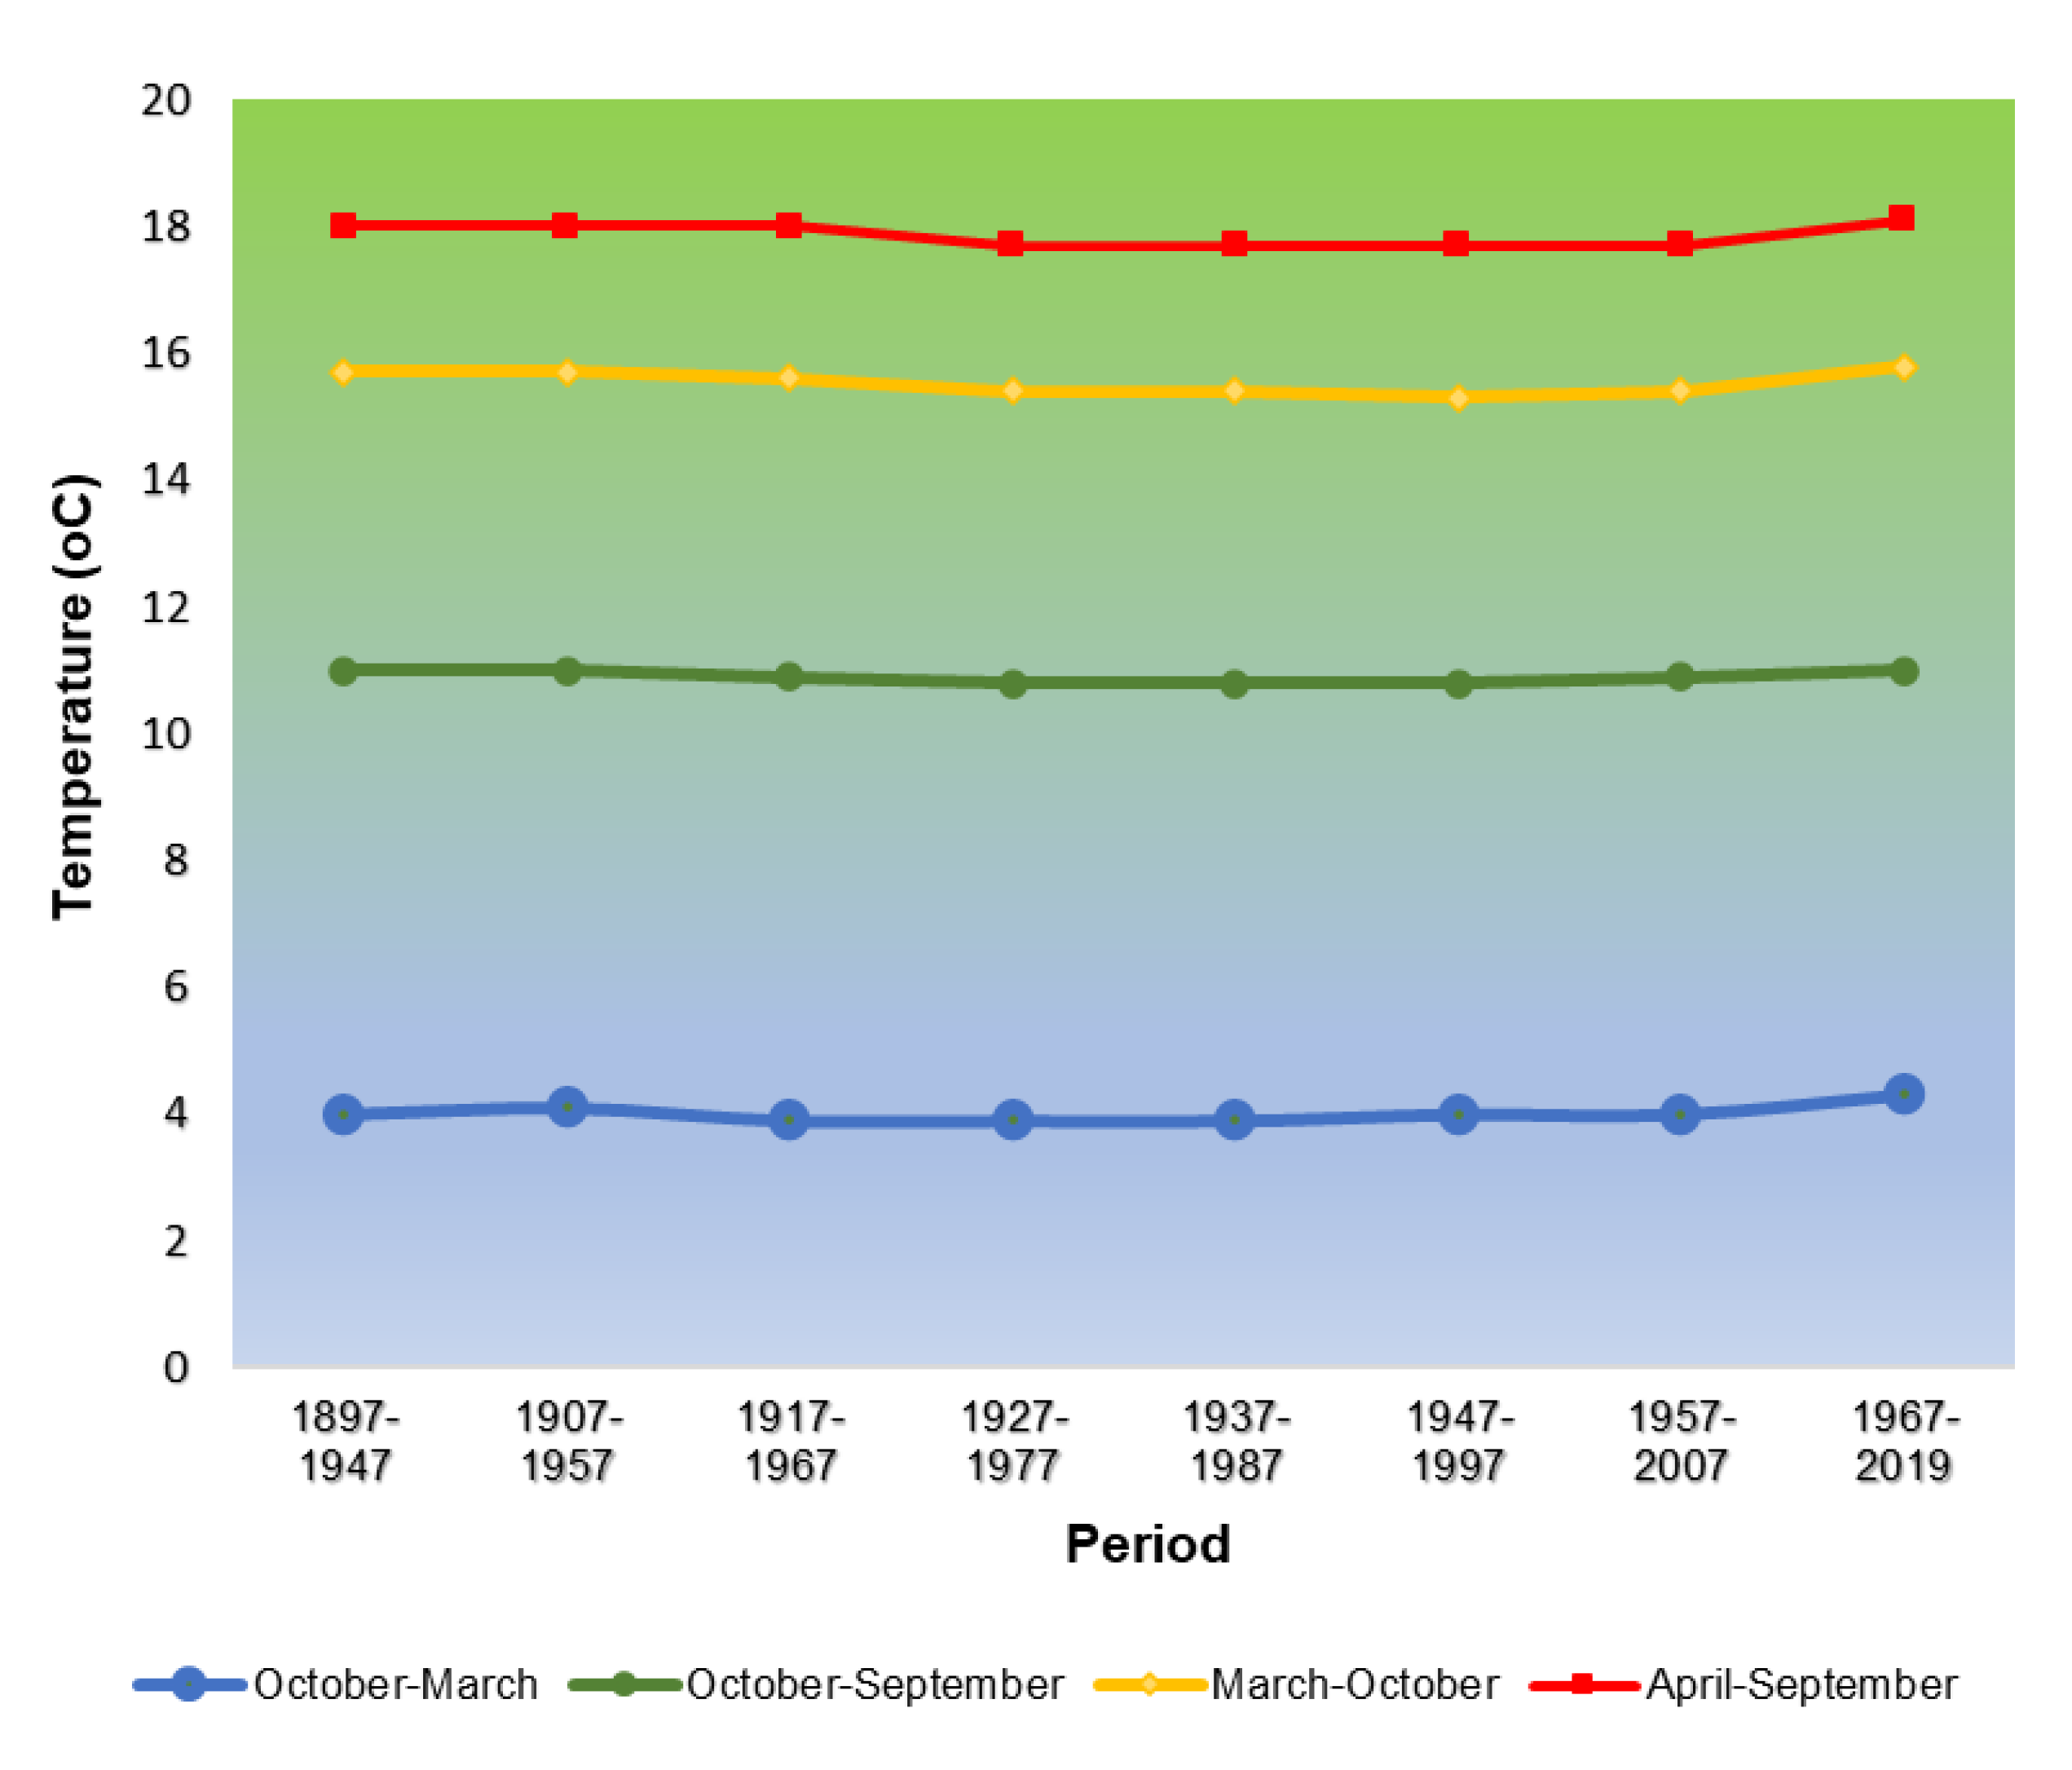
3.1. Evolution of the Thermal Regime

The study on the evolution of temperature was made on the data recorded at the Regional Meteorological Center Banat-Crisana for a period of 122 years, between 1897–2019, stating that due to the First World War records are missing between 1917–1920. Figure 2 shows the evolution of annual temperature in which shows a slight upward trend, especially in the last decade. It is observed that the annual temperature exceeds the temperatures recorded at the beginning of the 20th century, the heating trend in the Banat region being obvious. The lowest annual temperature during an agricultural year was recorded in 1939–1940, namely 8.8 °C. The annual maximum temperature was reached in the agricultural year 2008–2009 with 13 °C. At the beginning of the records, the annual temperature in 1897–1898 was 10.3 °C reaching the end of the records to be 12.7 °C, the same value in the agricultural years 2017–2018 and 2018–2019, respectively.
Although the values are oscillating, being warmer years followed by colder years, it is observed that the annual temperatures increase in the last decade, clearly highlighting the heating trend, a trend that has been recorded globally according to the latest data in the field.
Since the annual average does not provide detailed information on the thermal characterization, especially during the growing season of agricultural crops, a temperature distribution has also been carried out over the two growing periods: the cold period of the year (1 October–31 March) and the warm period which can also be translated into the active vegetation period (1 April–30 September).
Figure 3 shows that the average temperature during the vegetation period is slightly increasing, close to the annual trend, registering a minimum of 16 °C in the agricultural year 1932–1933 and a maximum of 20.7 °C in 2008–2009, being the year warmer recorded in the Banat Plain. If at the beginning of the recordings, the temperature during the vegetation period was 18 °C, it increased constantly, being in a continuous increase and without oscillations since 2006, reaching in the agricultural year 2018–2019 at 19.5 °C.
Unlike the evolution of the temperature throughout the agricultural year, even that of the vegetation period, the temperature in the cold period of the year (October–March) had a very strong oscillation as can be seen in Figure 4. The lowest value recorded in the 6 months of the conventional cold period was 0.5 °C in the agricultural year 1931–1932, and the maximum was reached in 2000–2001 with 7.1 °C. Even with an oscillating temperature record, there is a slight upward trend even in the cold period of the year, being 2.6 °C in 1897–1898 and reaching 5.9 in the agricultural year 2018–2019.
Due to the fact that the oscillations between the annual values were quite large and the tendency to change is not very representative, we resorted to representing the evolution of temperature by averages of 10 and 50 years, respectively.
The average temperature for decades was calculated for the following periods of the year: agricultural year (October–September), conventional warm period (April–September) and extended warm period (March–October).
The multiannual averages of 50 years, shifted by 10 years for the abovementioned intervals, were also calculated, to which is added the period October–March (conventional cold period).
From the evolution of temperatures over periods of 10 years (Figure 5) there is a sinusoidal oscillation that follows the same trend in the three periods considered: October–September (agricultural year), March–October (extended vegetation period) and April–September (conventional hot period). If, at the end of the 19th century, the average annual temperatures were at an average level, they increased in the decades between 1920 and 1960, after which there is a regression to the lowest value recorded in the 1970s and 1980s with a spectacular increase in recent years four decades, except for the decade 2000–2010 in the period October-September when it recorded 10.6 °C. The last decade records the highest temperatures in all the periods studied: 12.0 °C in October–September, 16.7 °C in March–October and 19.2 °C in April–September.
The average values for 50 years (Figure 6) are not as representative as those for decades and show very small variations, but with a clear upward trend, especially in the last 50 years. All the four analyzed periods have the same sinusoidal tendency, with the specification that in this case the high values are found in the interval 1897–1947, 1907–1957, and the maximum is reached in the last 50 years 1967–2019.
Analyzing the results obtained, both the annual evolution, the one for decades and the average for 50 years, we can conclude that in the Banat Plain the climate has undergone a change from a thermal point of view, in the sense of increasing it to historical maximum values. Temperature has a great influence on the water in the soil and especially on the accessibility of water for plants, given that temperatures are increasing more recently in the months when the water demand of plants is very high and high temperatures lead to evaporation of water, both from the soil and from the soil surface.

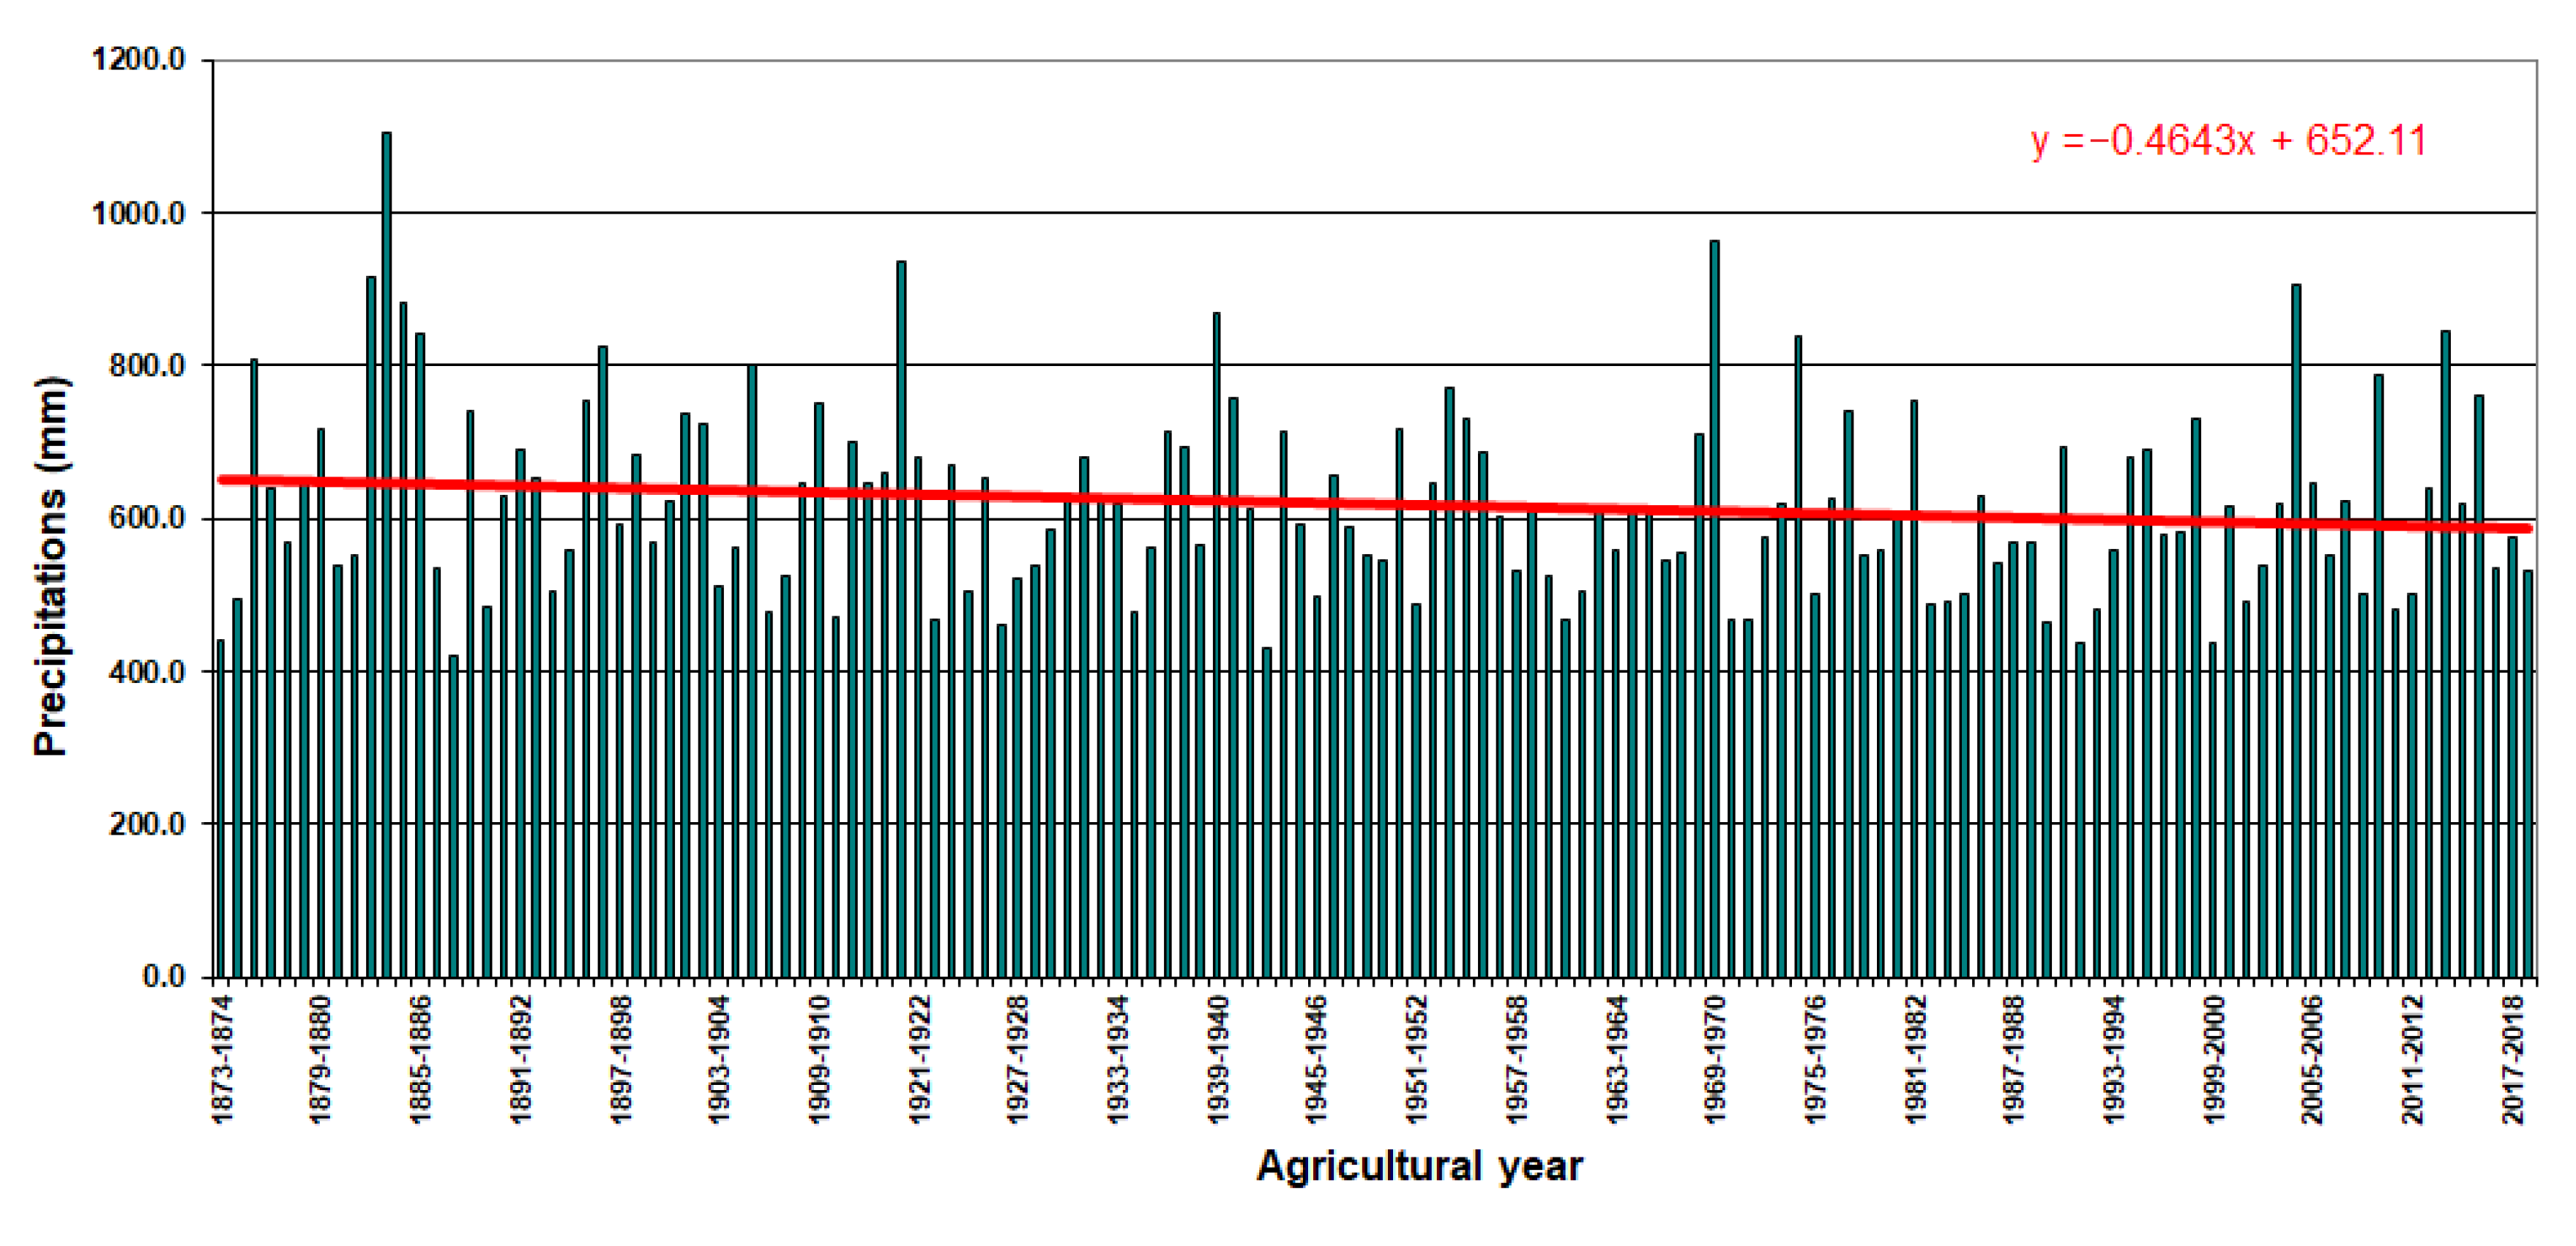
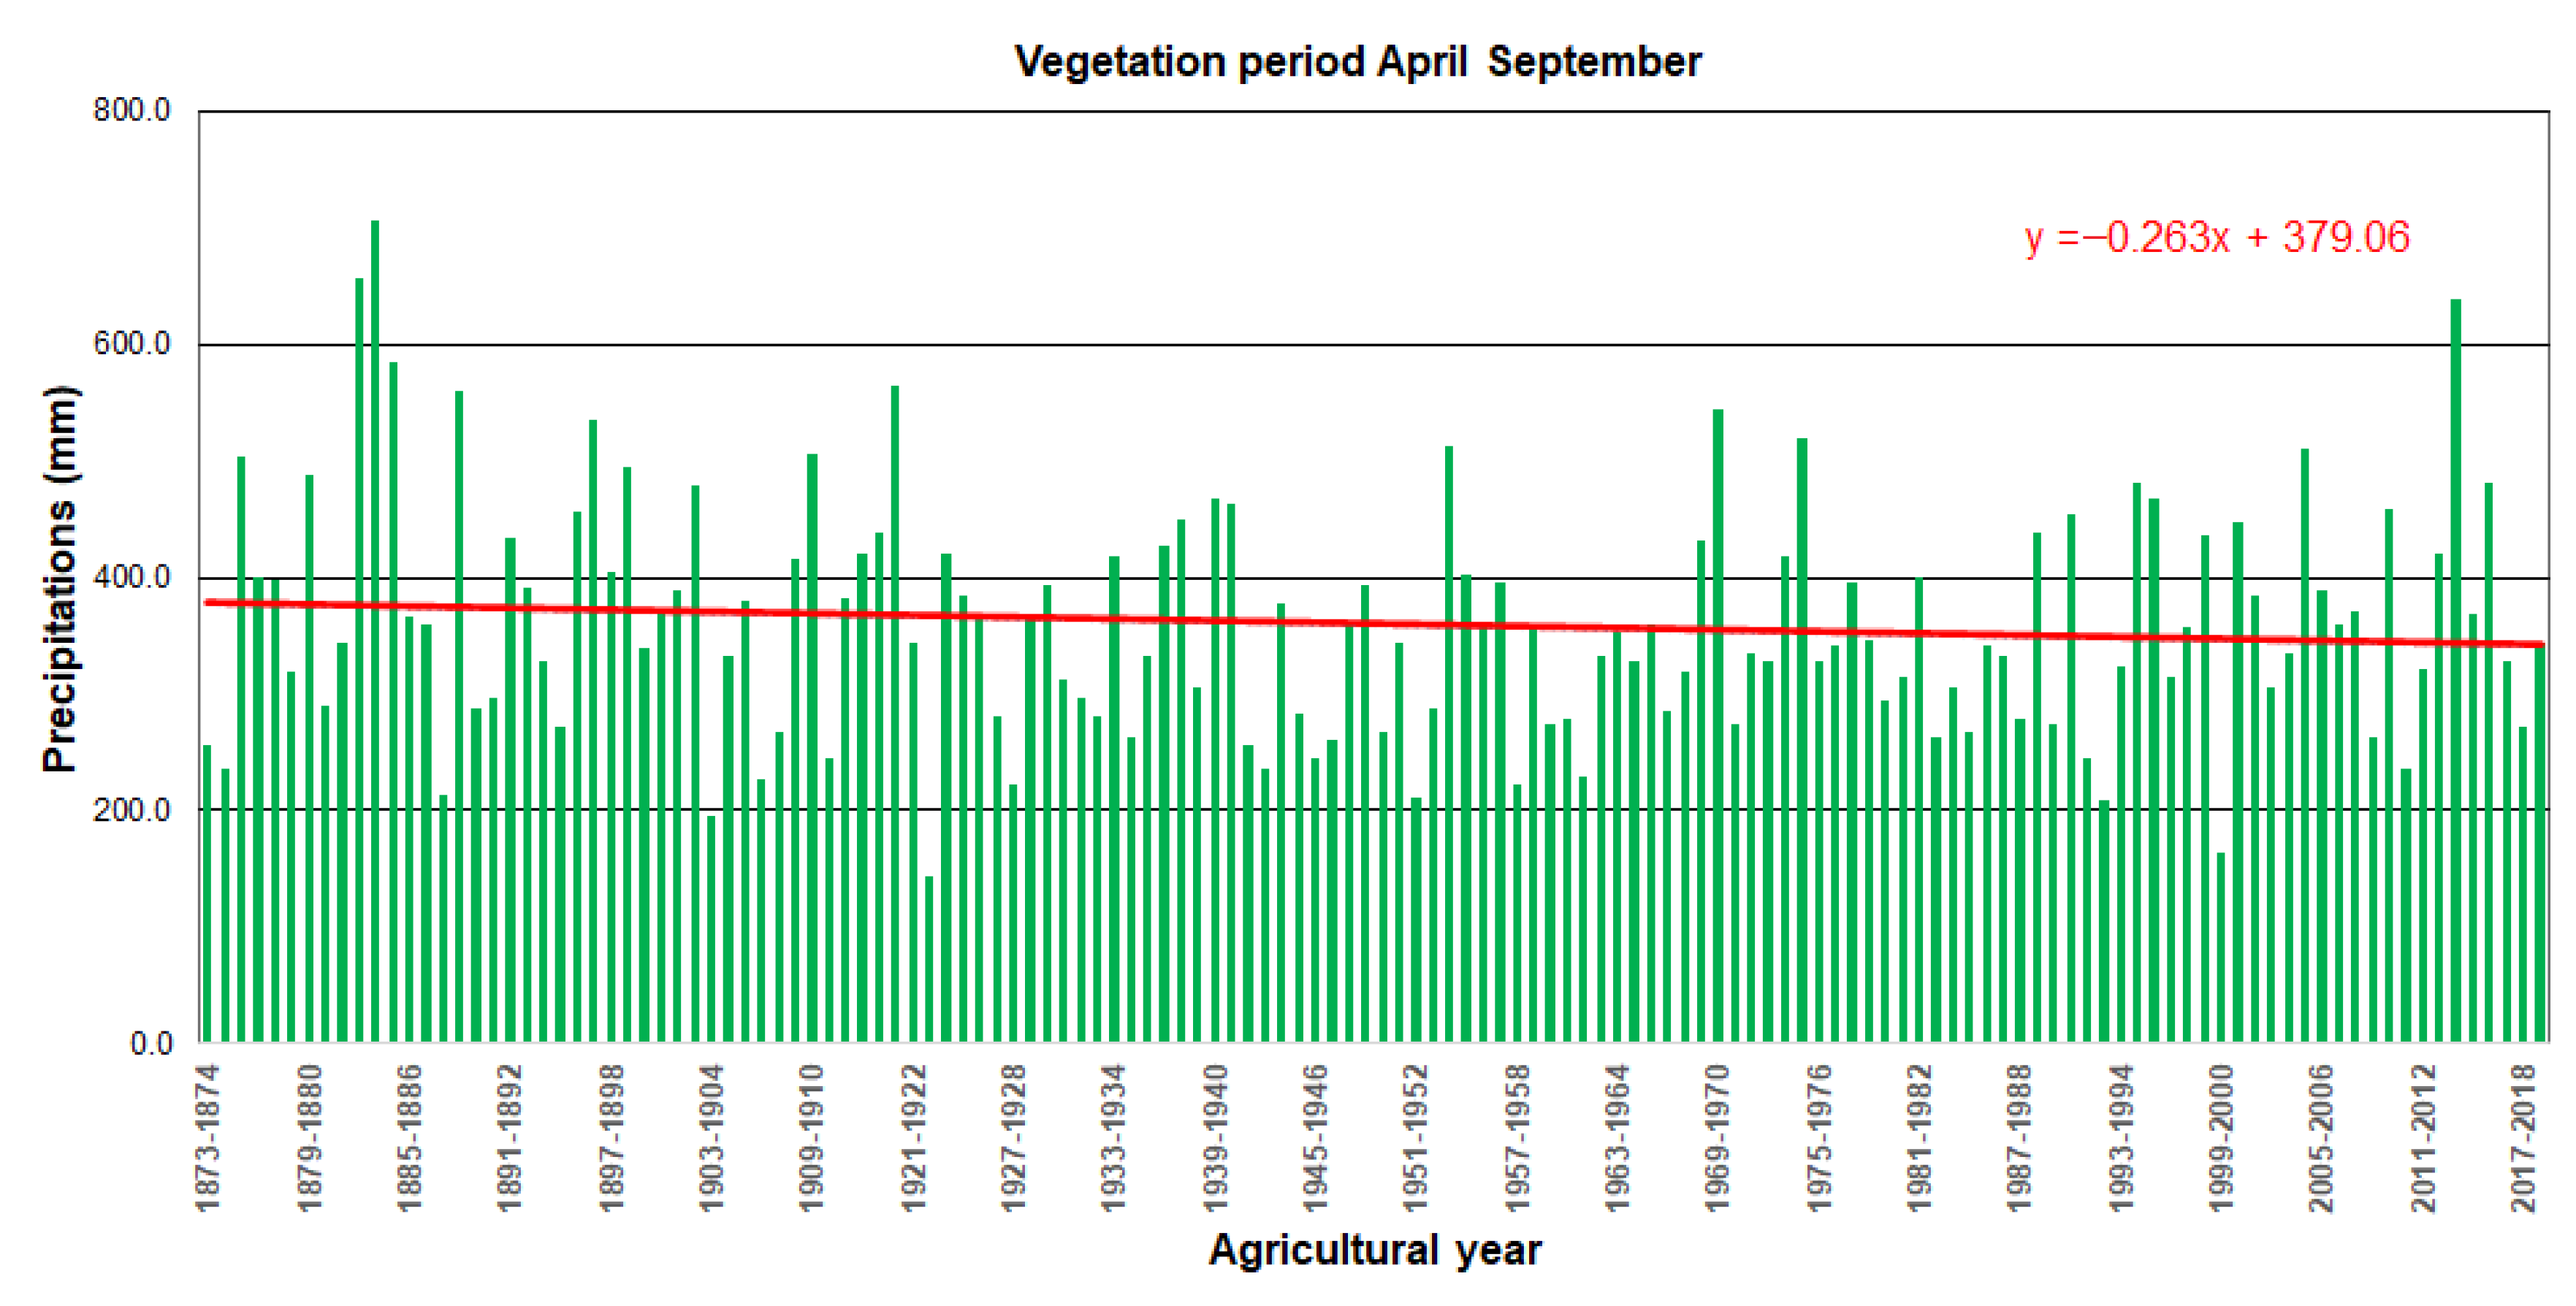
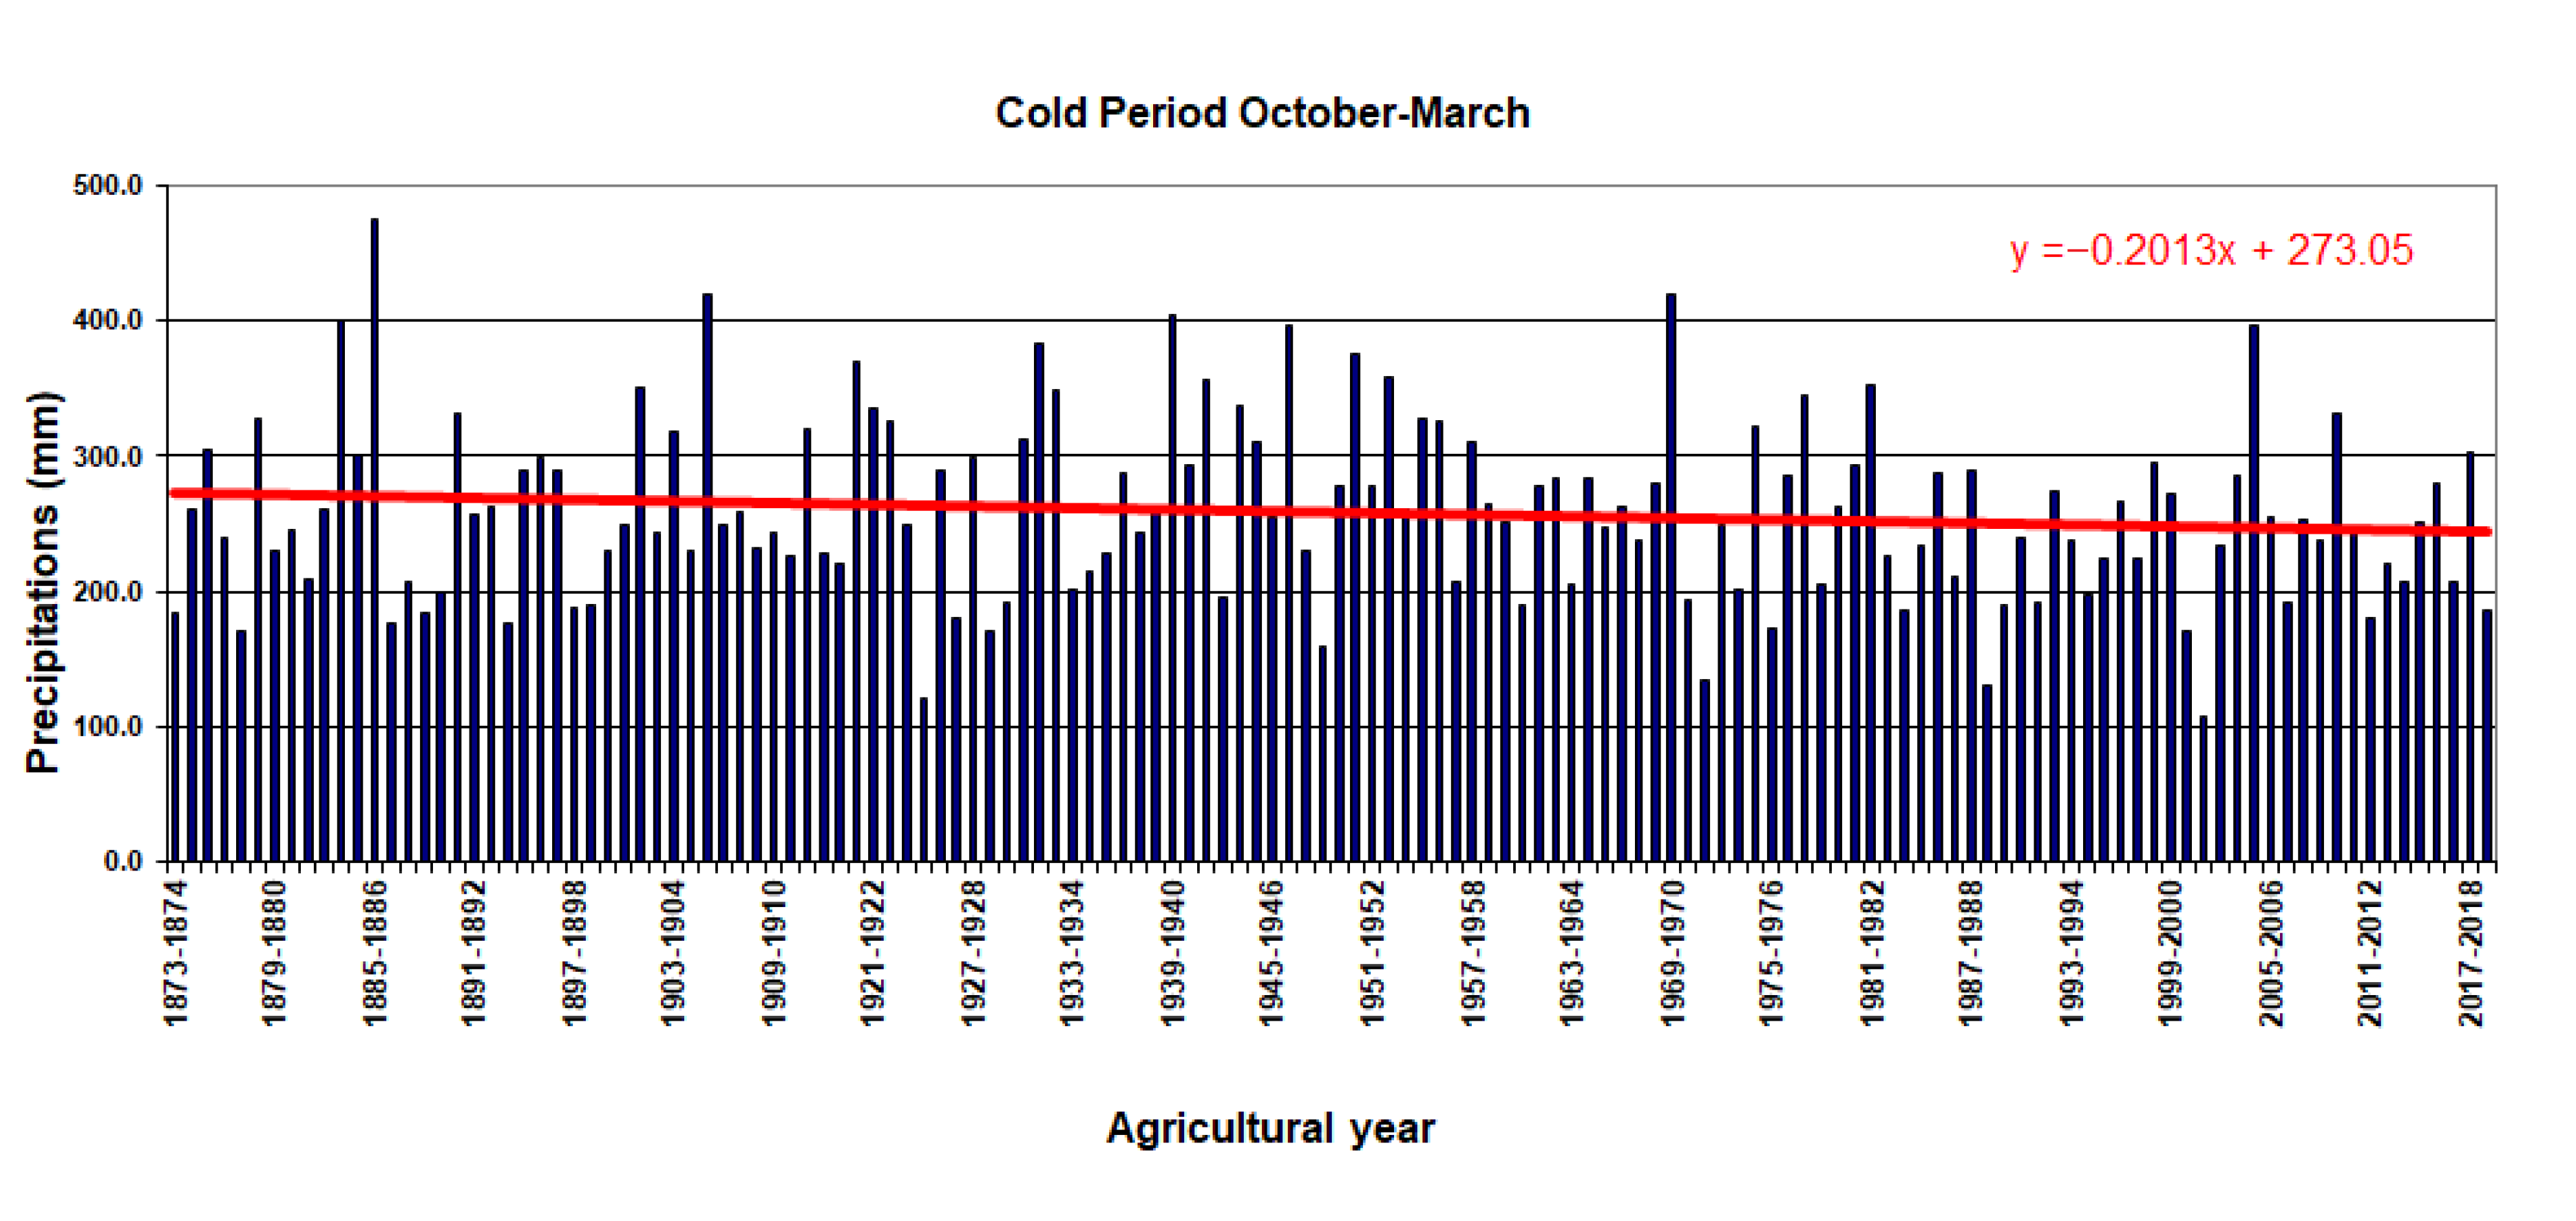
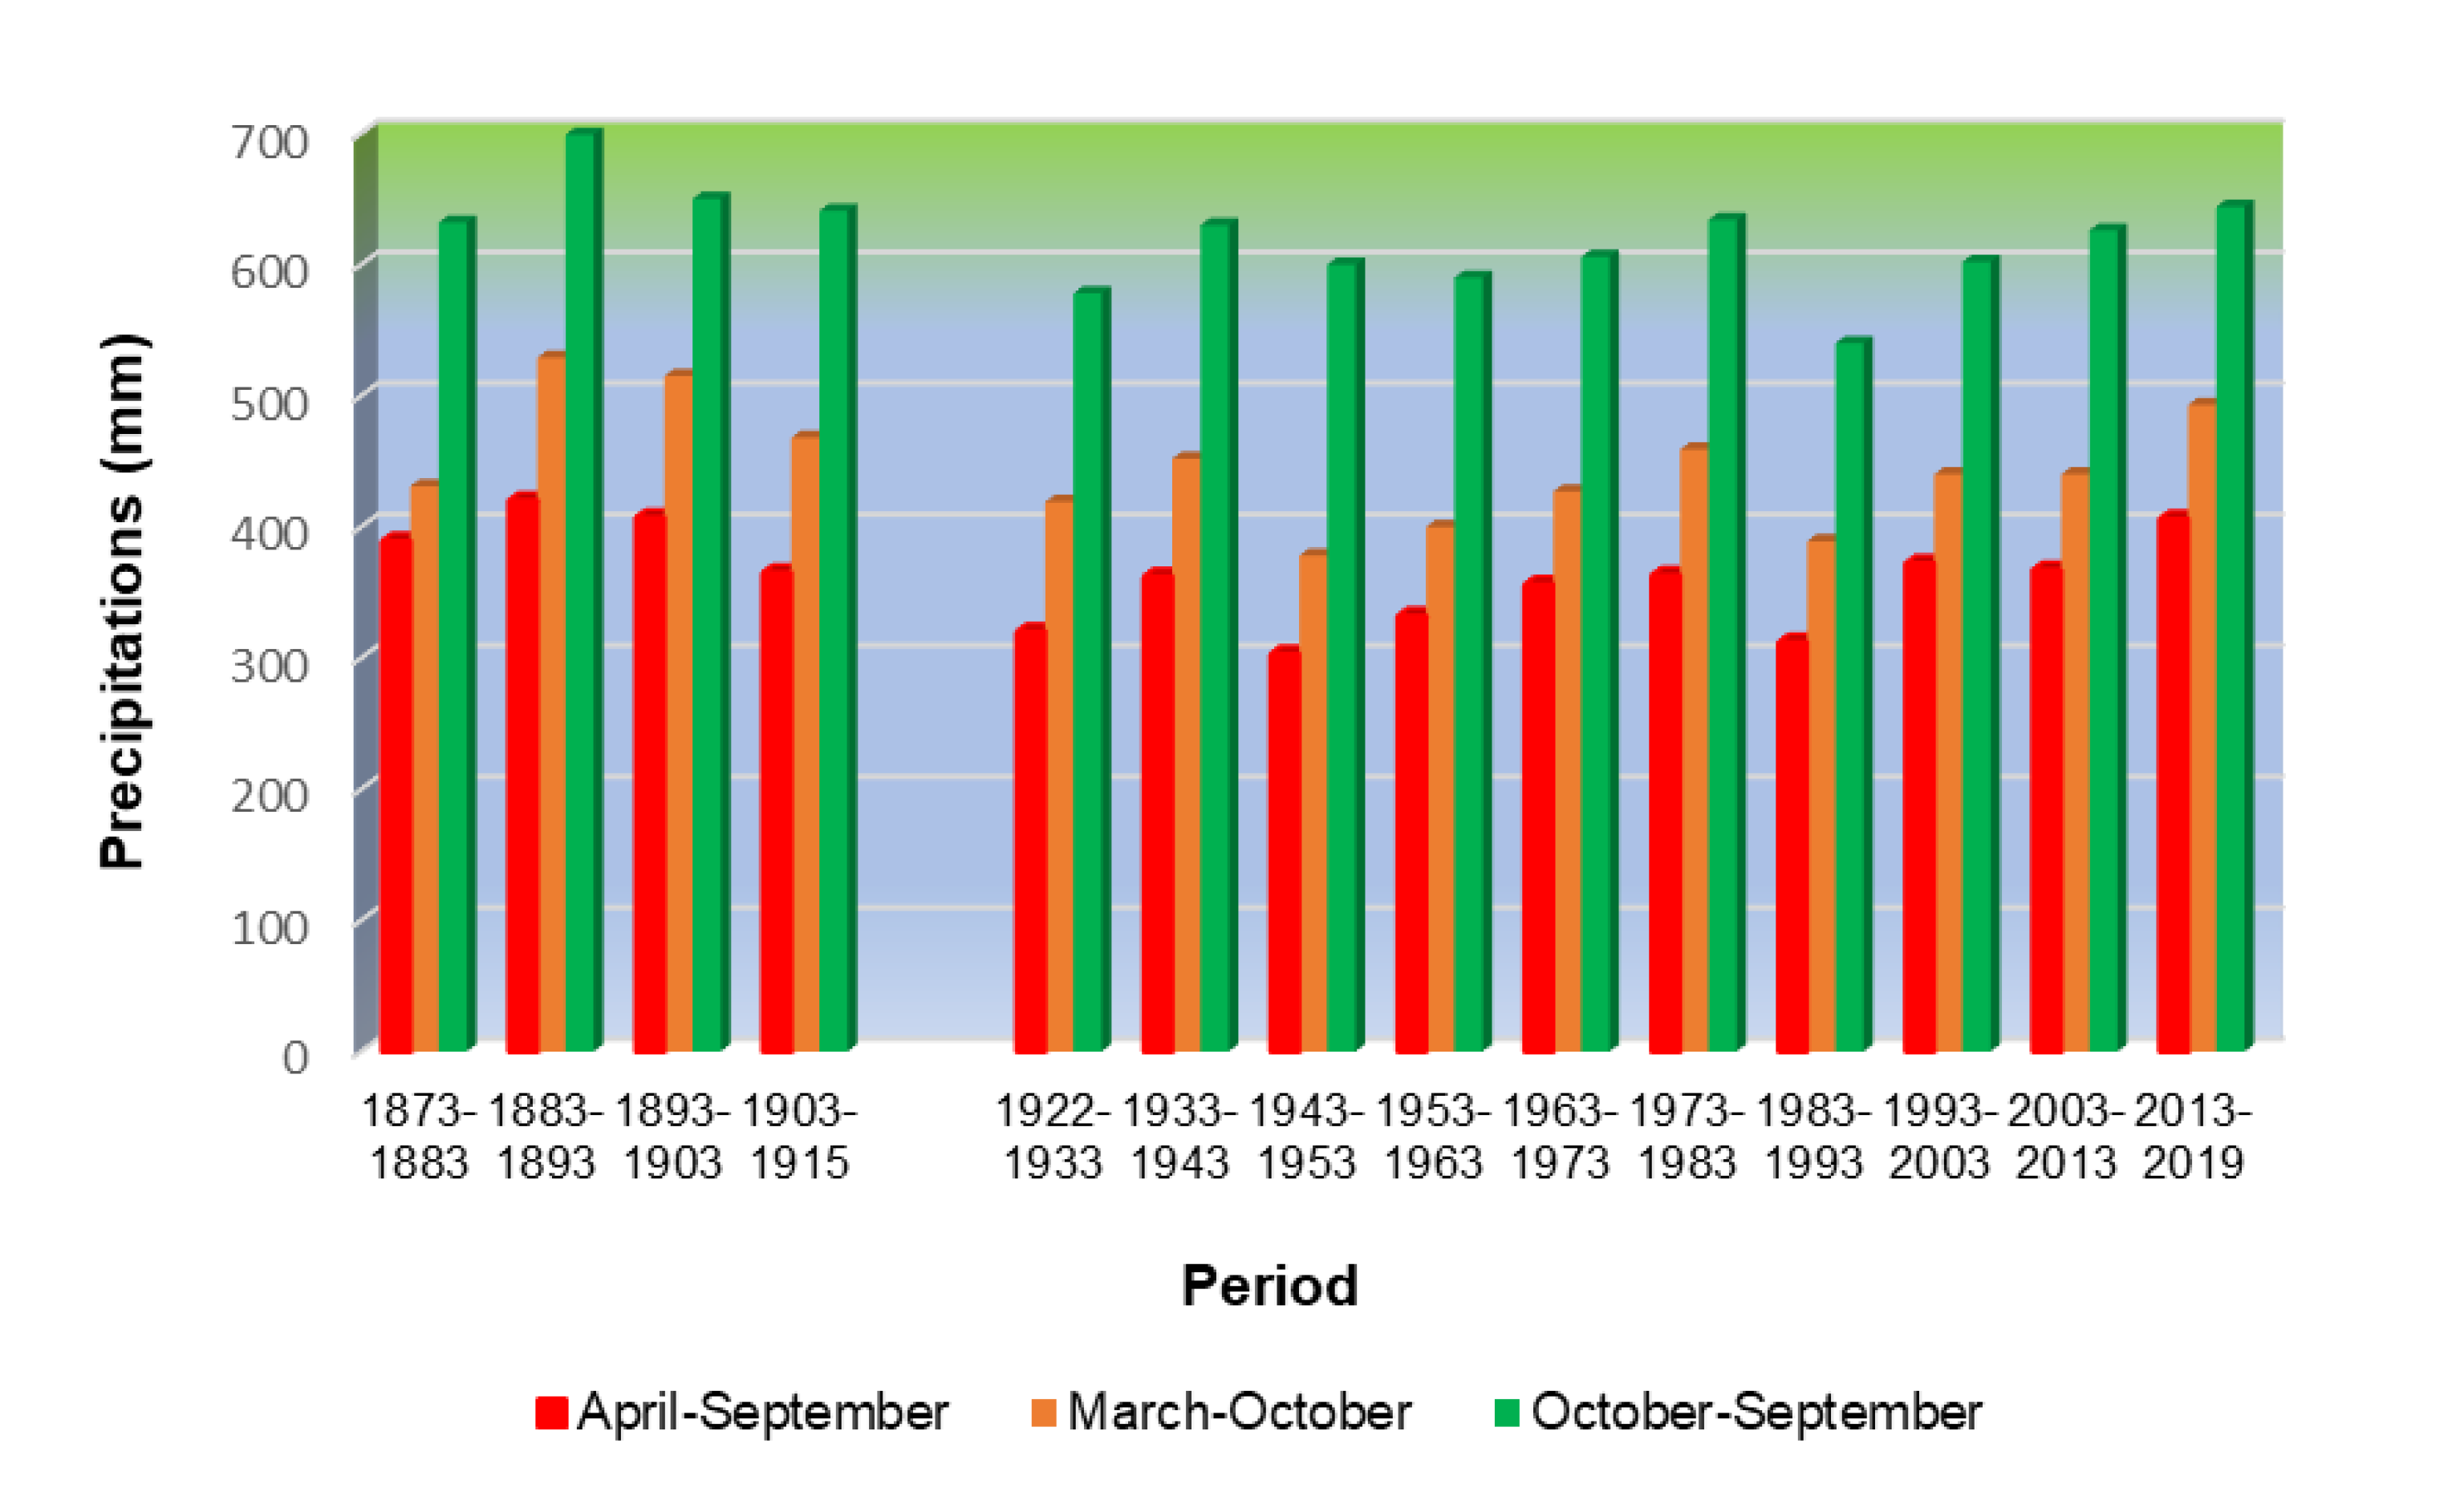
3.2. Evolution of the Rainfall Regime

In the context of the manifestation of global climate change that also affects Romania’s climate, it is necessary to study the quantitative variation of the rainfall regime in the Banat Plain, being a priority indicator of the climate.
The following analysis was of the evolution of rainfall at the Regional Meteorological Center Banat-Crisana over a period of 146 years. In this respect, the data recorded at the Regional Meteorological Center Banat-Crisana from 1873 to 2019 were used. Although information on the years 1916 to 1921 is missing, it was considered that a long range of data can bring us relevant conclusions on the evolution over time and the probable trend of precipitation.
Figure 7 shows the evolution of annual rainfall and a slight downward trend is observed, with the exception of 2004–2005 when the amount of rainfall fell was the highest from 1971 to 2019, being 906.7 mm.
The lowest amount of precipitation was recorded in 1887–1888 by 420 mm, followed by 1942–1943 when 430 mm was totaled and the largest quantity in 1883–1884 of 1106 mm. As with the evolution of temperature, it is observed that the years are not constant, being years with more abundant rainfall, followed by dry years. However, looking at the trend line, it is found that overall, rainfall is decreasing, especially in the last 3 years being 534, 575.1 and 531.2 mm, respectively.
Analyzing the distribution of precipitation during vegetation periods, it was noticed that in the warm period of the year (Figure 8) the decreasing tendency is higher than in the cold period. In the warm period of the year, the conventional period (April–September), the amount of precipitation is higher than in the cold period of the year. The largest amount fell in the warm period was 707 mm in 1883–1884, another maximum peak being recorded in the last decade, in 2013–2014 of 639.5 mm. The historical minimum was in the agricultural year 1922–1923 when the amount of precipitation that fell during the vegetation period was only 142.7 mm. In the last three years, the amount of precipitation has been decreasing, of 327.2, 272.1, and 344.8 mm, respectively. The analysis of precipitation during the warm period is very important because it is the period when the water demand of plants is highest, and in the conditions of aridization more accentuated in the global context, it overlaps with the lowering of the groundwater level in the Banat Plain due to the intense hydro-amelioration works in this area.
Figure 9 shows the amount of precipitation falling in the cold period of the year, the oscillating distribution is observed with a clearly decreasing trend. Unlike the vegetation period, in the cold period the precipitations are much lower, reaching a maximum of only 475 mm in the agricultural year 1885–1886. The lowest amount of precipitation was 108.4 mm in 2001–2002, and in 2004–2005 there was a higher amount of precipitation of 395.2 mm, being the highest amount from 1969–1970 when it was 418.4 mm. In the last decade, the amount of rainfall has been declining, with negative repercussions on the storage of water in the soil in the spring, when its humidity should be at field capacity.
Figure 10 shows the fluctuation of average precipitation values over periods of 10 years. There is a sinusoidal oscillation of precipitation over time, but with a visible downward trend, except for the last decade due to 2013–2014 when it was a maximum of 845.5 mm.
If for the decade 1983–1993 there was the lowest average rainfall value for an agricultural year (540 mm), in the last two decades this value has increased slightly, while remaining at a low level (644 mm) compared to the first values recorded at the end of the 19th century. The highest values were recorded for the decade 1883–1893, which may also be explained by the conditions under which these measurements were made. The same trends were maintained for the conventional warm period of the year (April–September) as well as the extended warm period (March–October).
The average annual value for 50 years (Figure 11), although oscillating, shows the downward trend for the agricultural year as well as the cold period of the year, attenuated only by the average value for 1933–1983 and 1953–2003. In the last 50 years, the amount of precipitation in the cold period shows a decrease (246.3 mm), having the lowest value of the average of 50 years calculated for the Banat Plain.
Between 1903 and 1973, the presence of a plateau (except for the October–March period) was noted in which the amount of precipitation remained low and constant.
In terms of the distribution of rainfall over the course of an agricultural year, in the last decade there has been an increase in the growing season (April–September), parallel to the decrease in the cold period (October–March). This has positive repercussions on the good development of agricultural crops, as the period during which the amount of rainfall is higher corresponds to the period during which plants have high water requirements. Additionally, reducing the amount of rainfall in winter leads to reduced excess moisture on agricultural land.
Analyzing the values obtained in the case of the distribution of precipitation, especially in the case of averages over 50 years, we can conclude that the rainfall falling in the Banat Plain over the course of an agricultural year is decreasing. In the cold period of the year, the downward trend is visible.

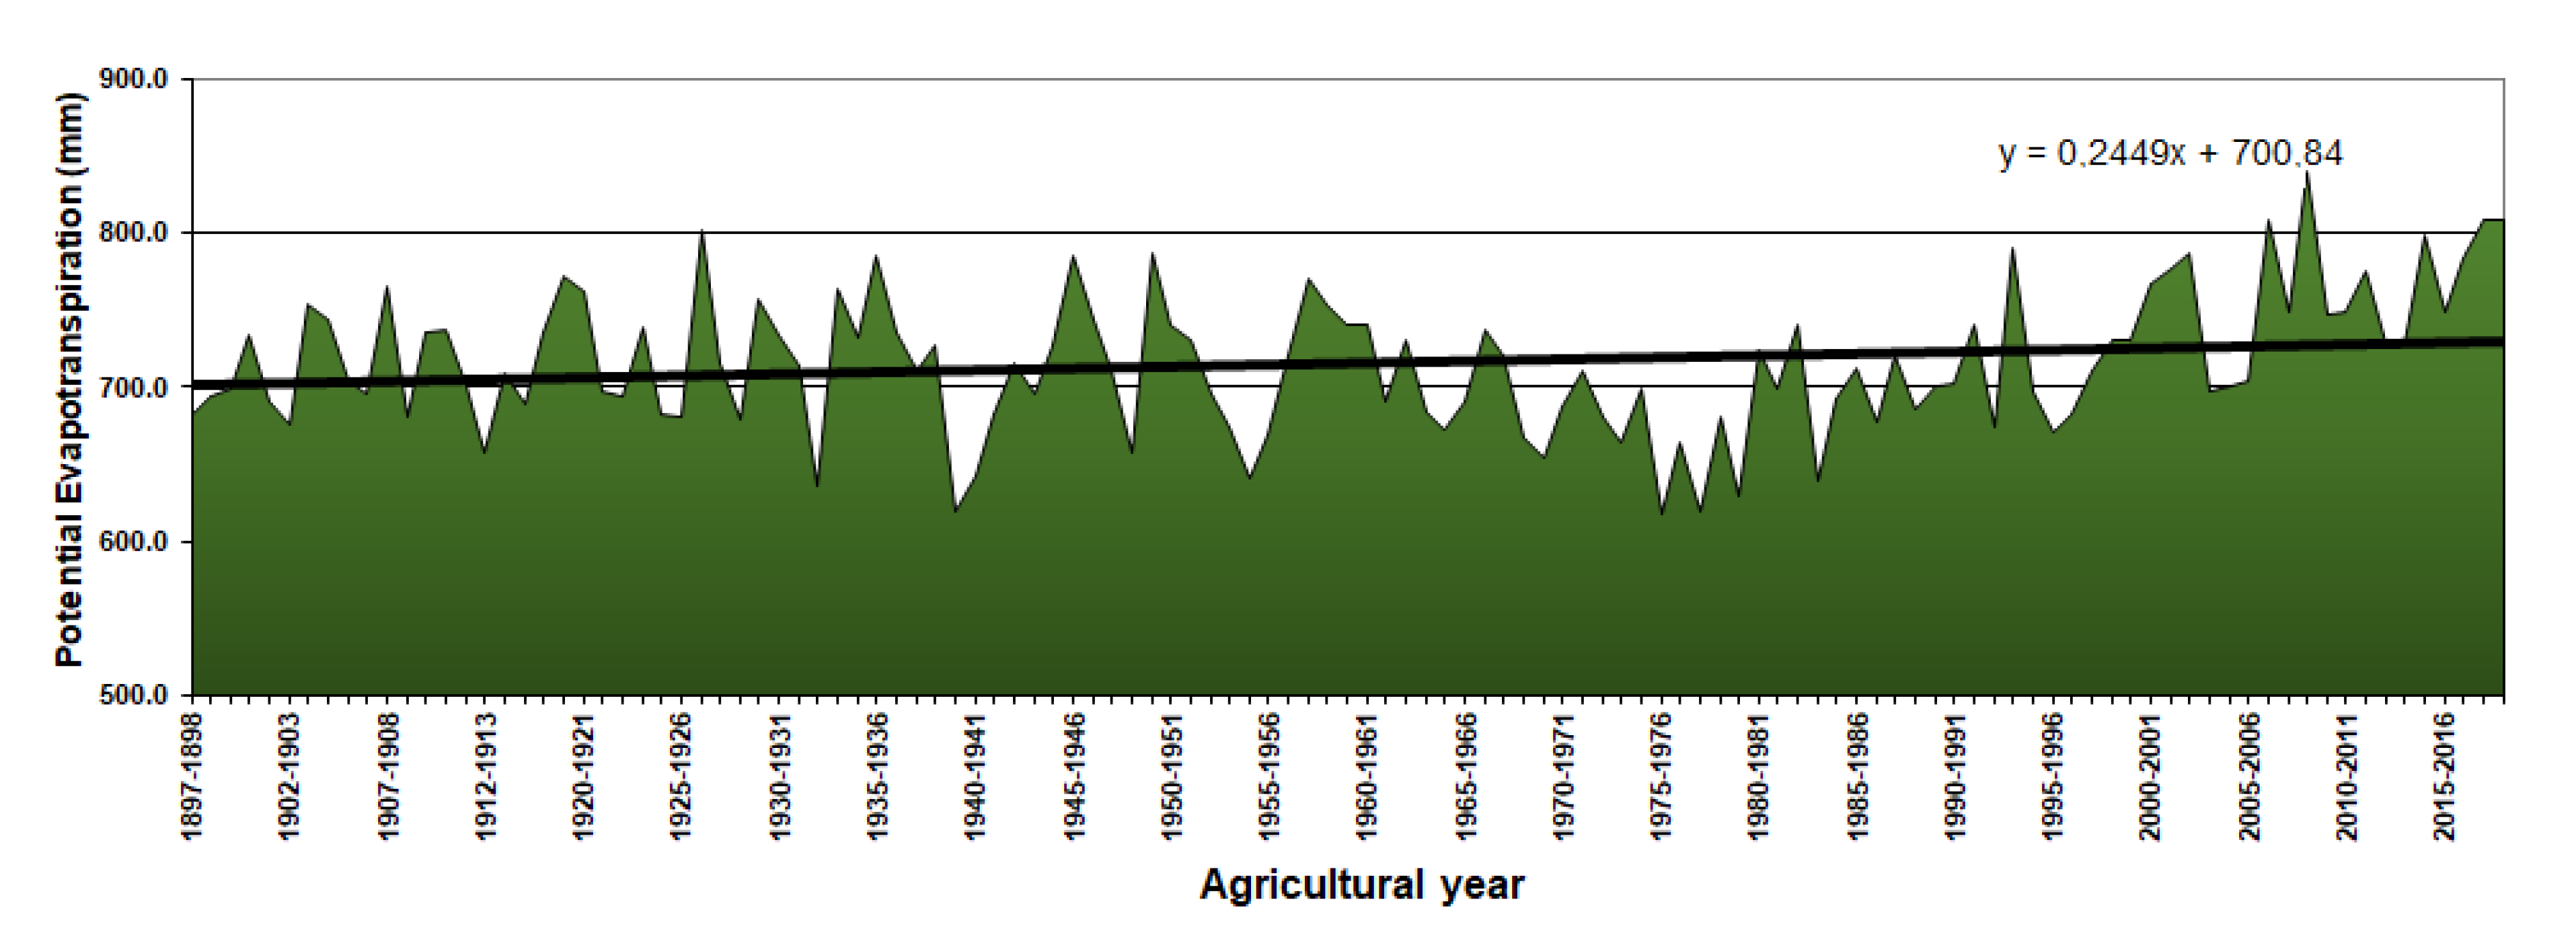
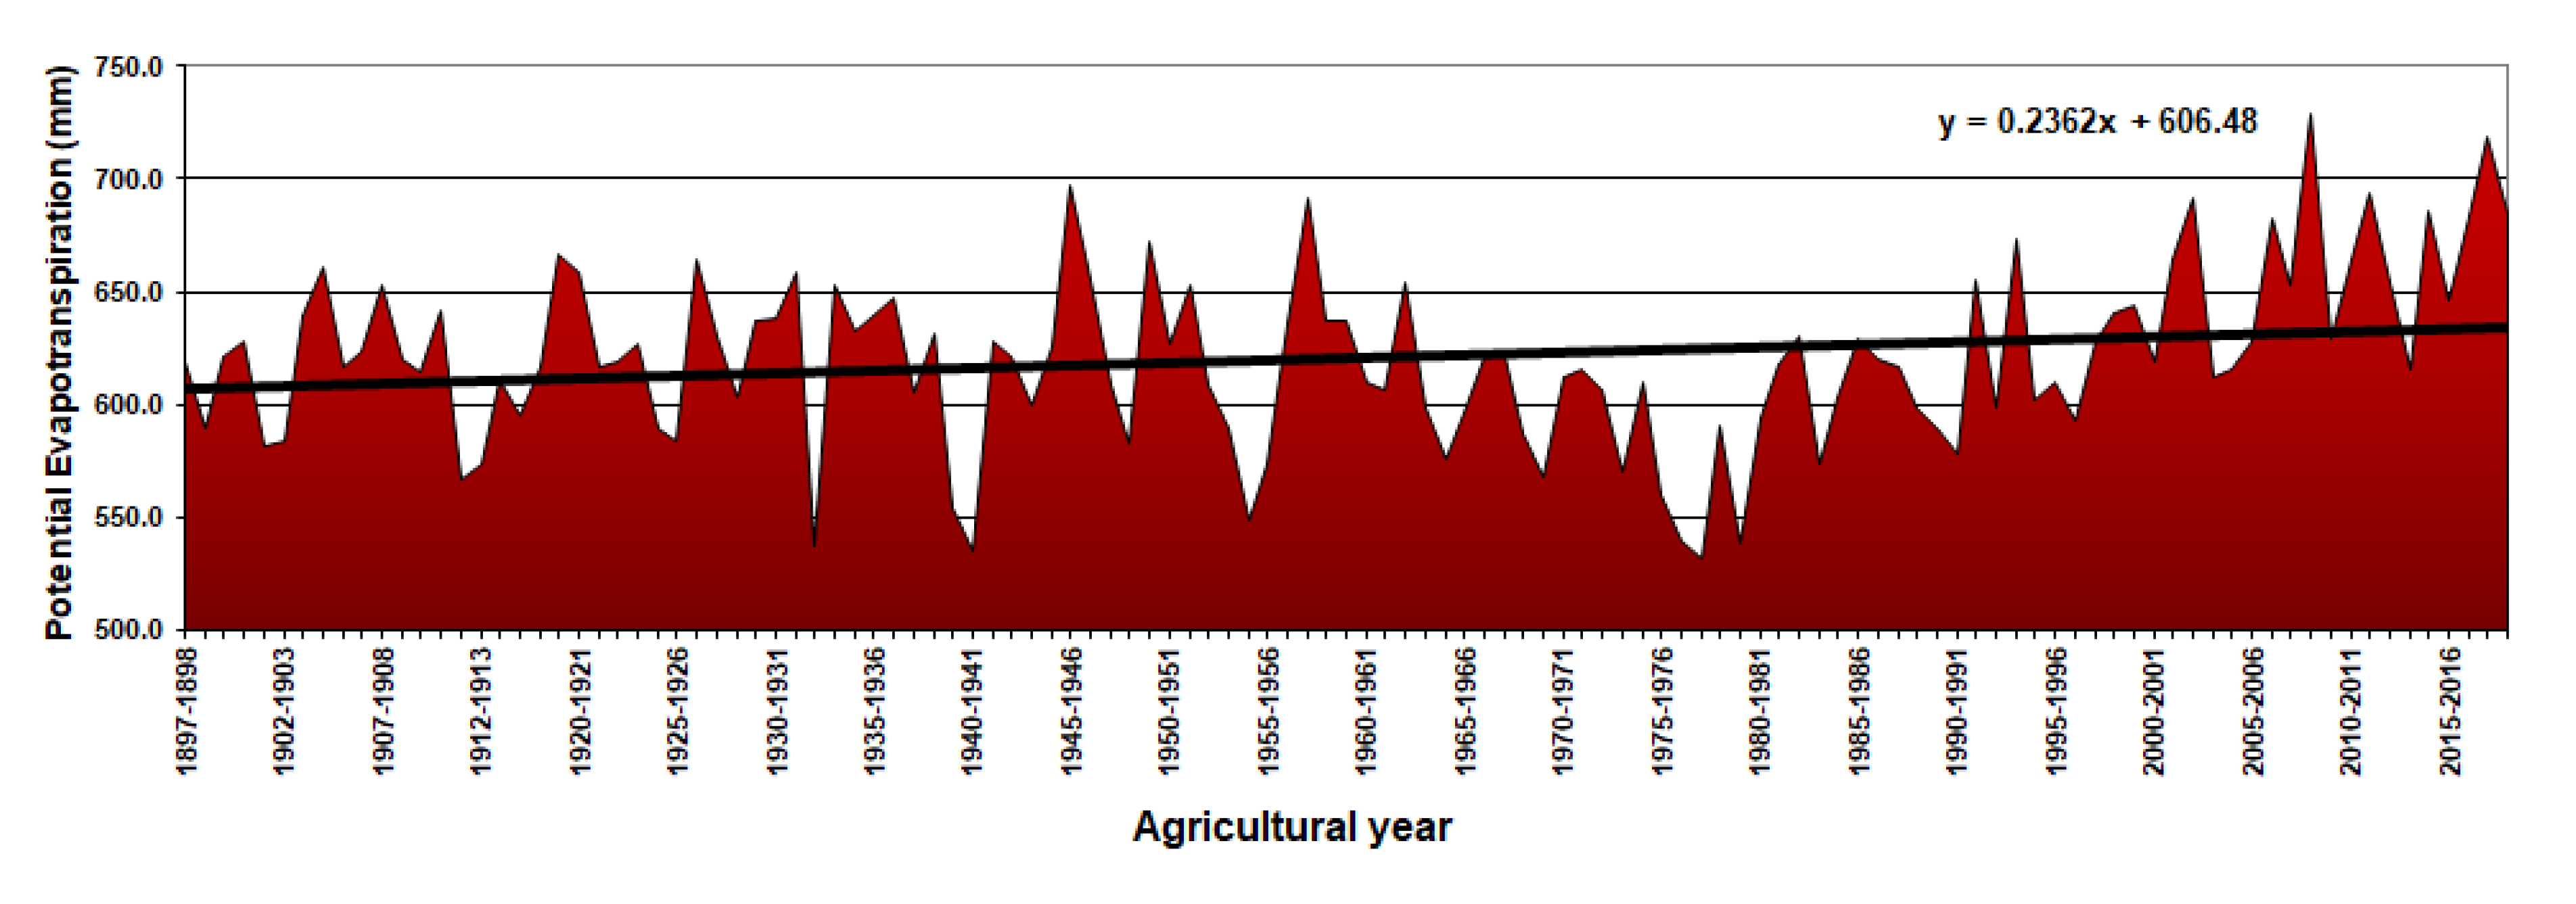
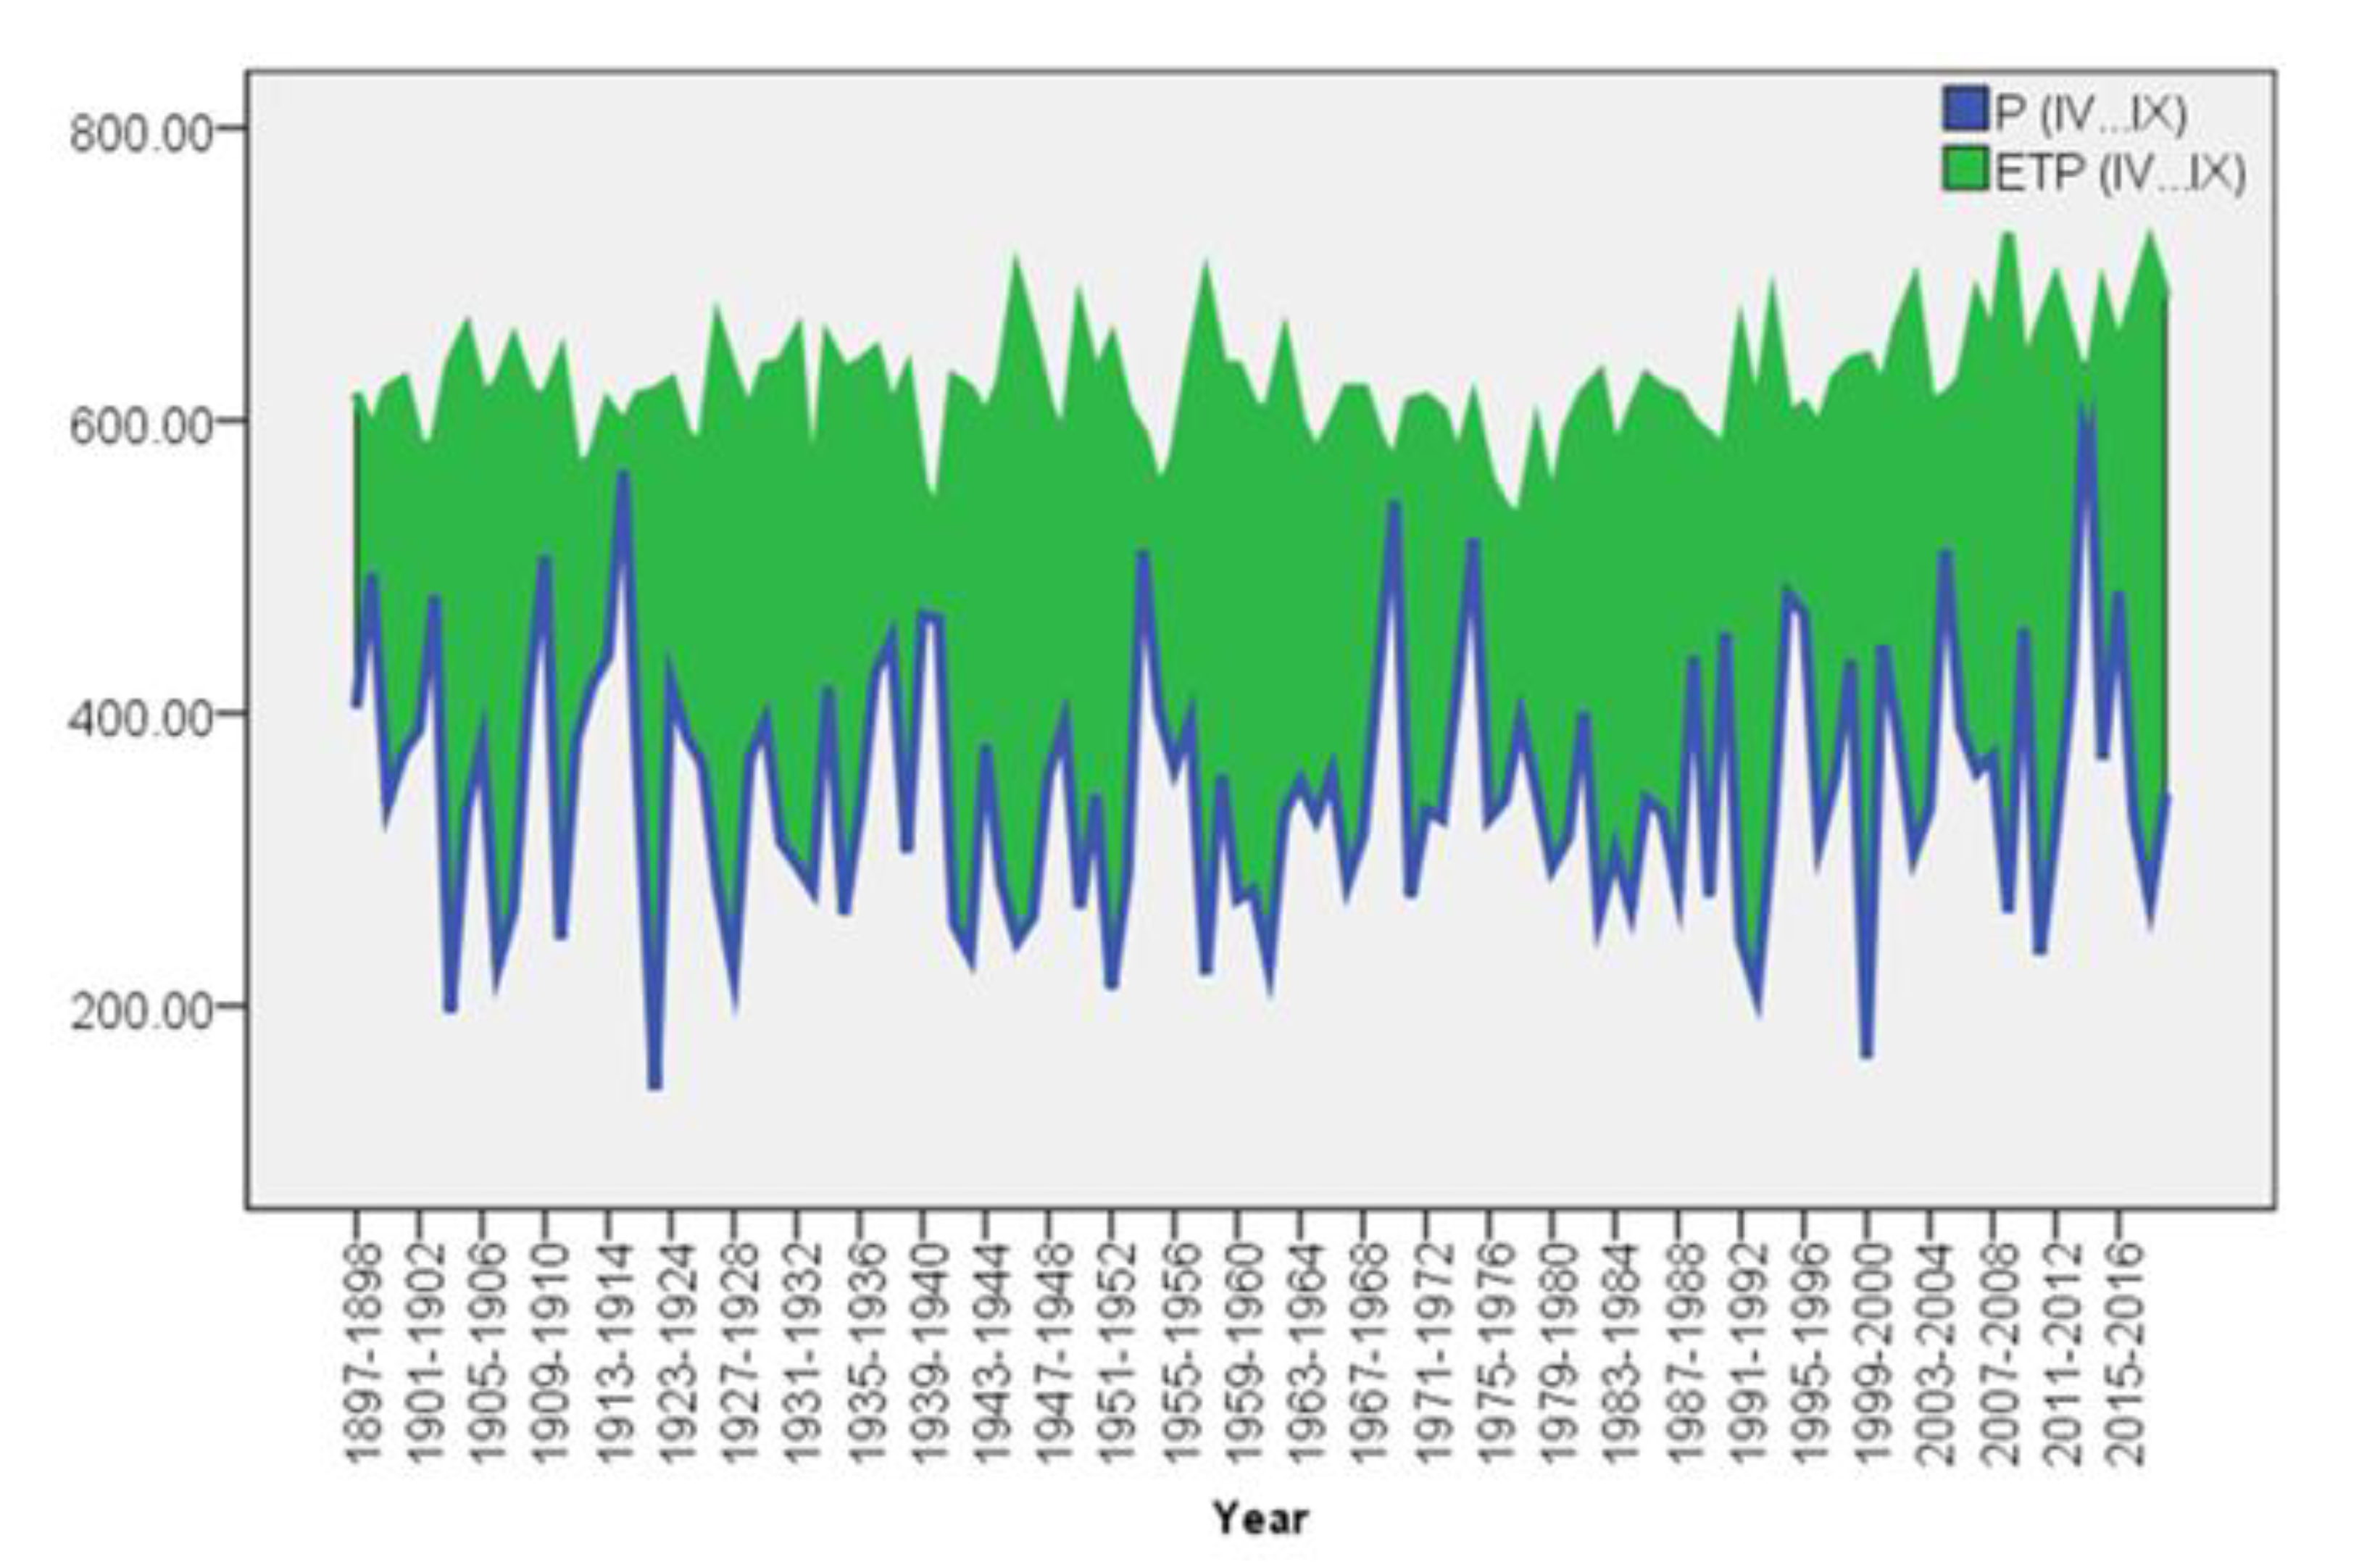
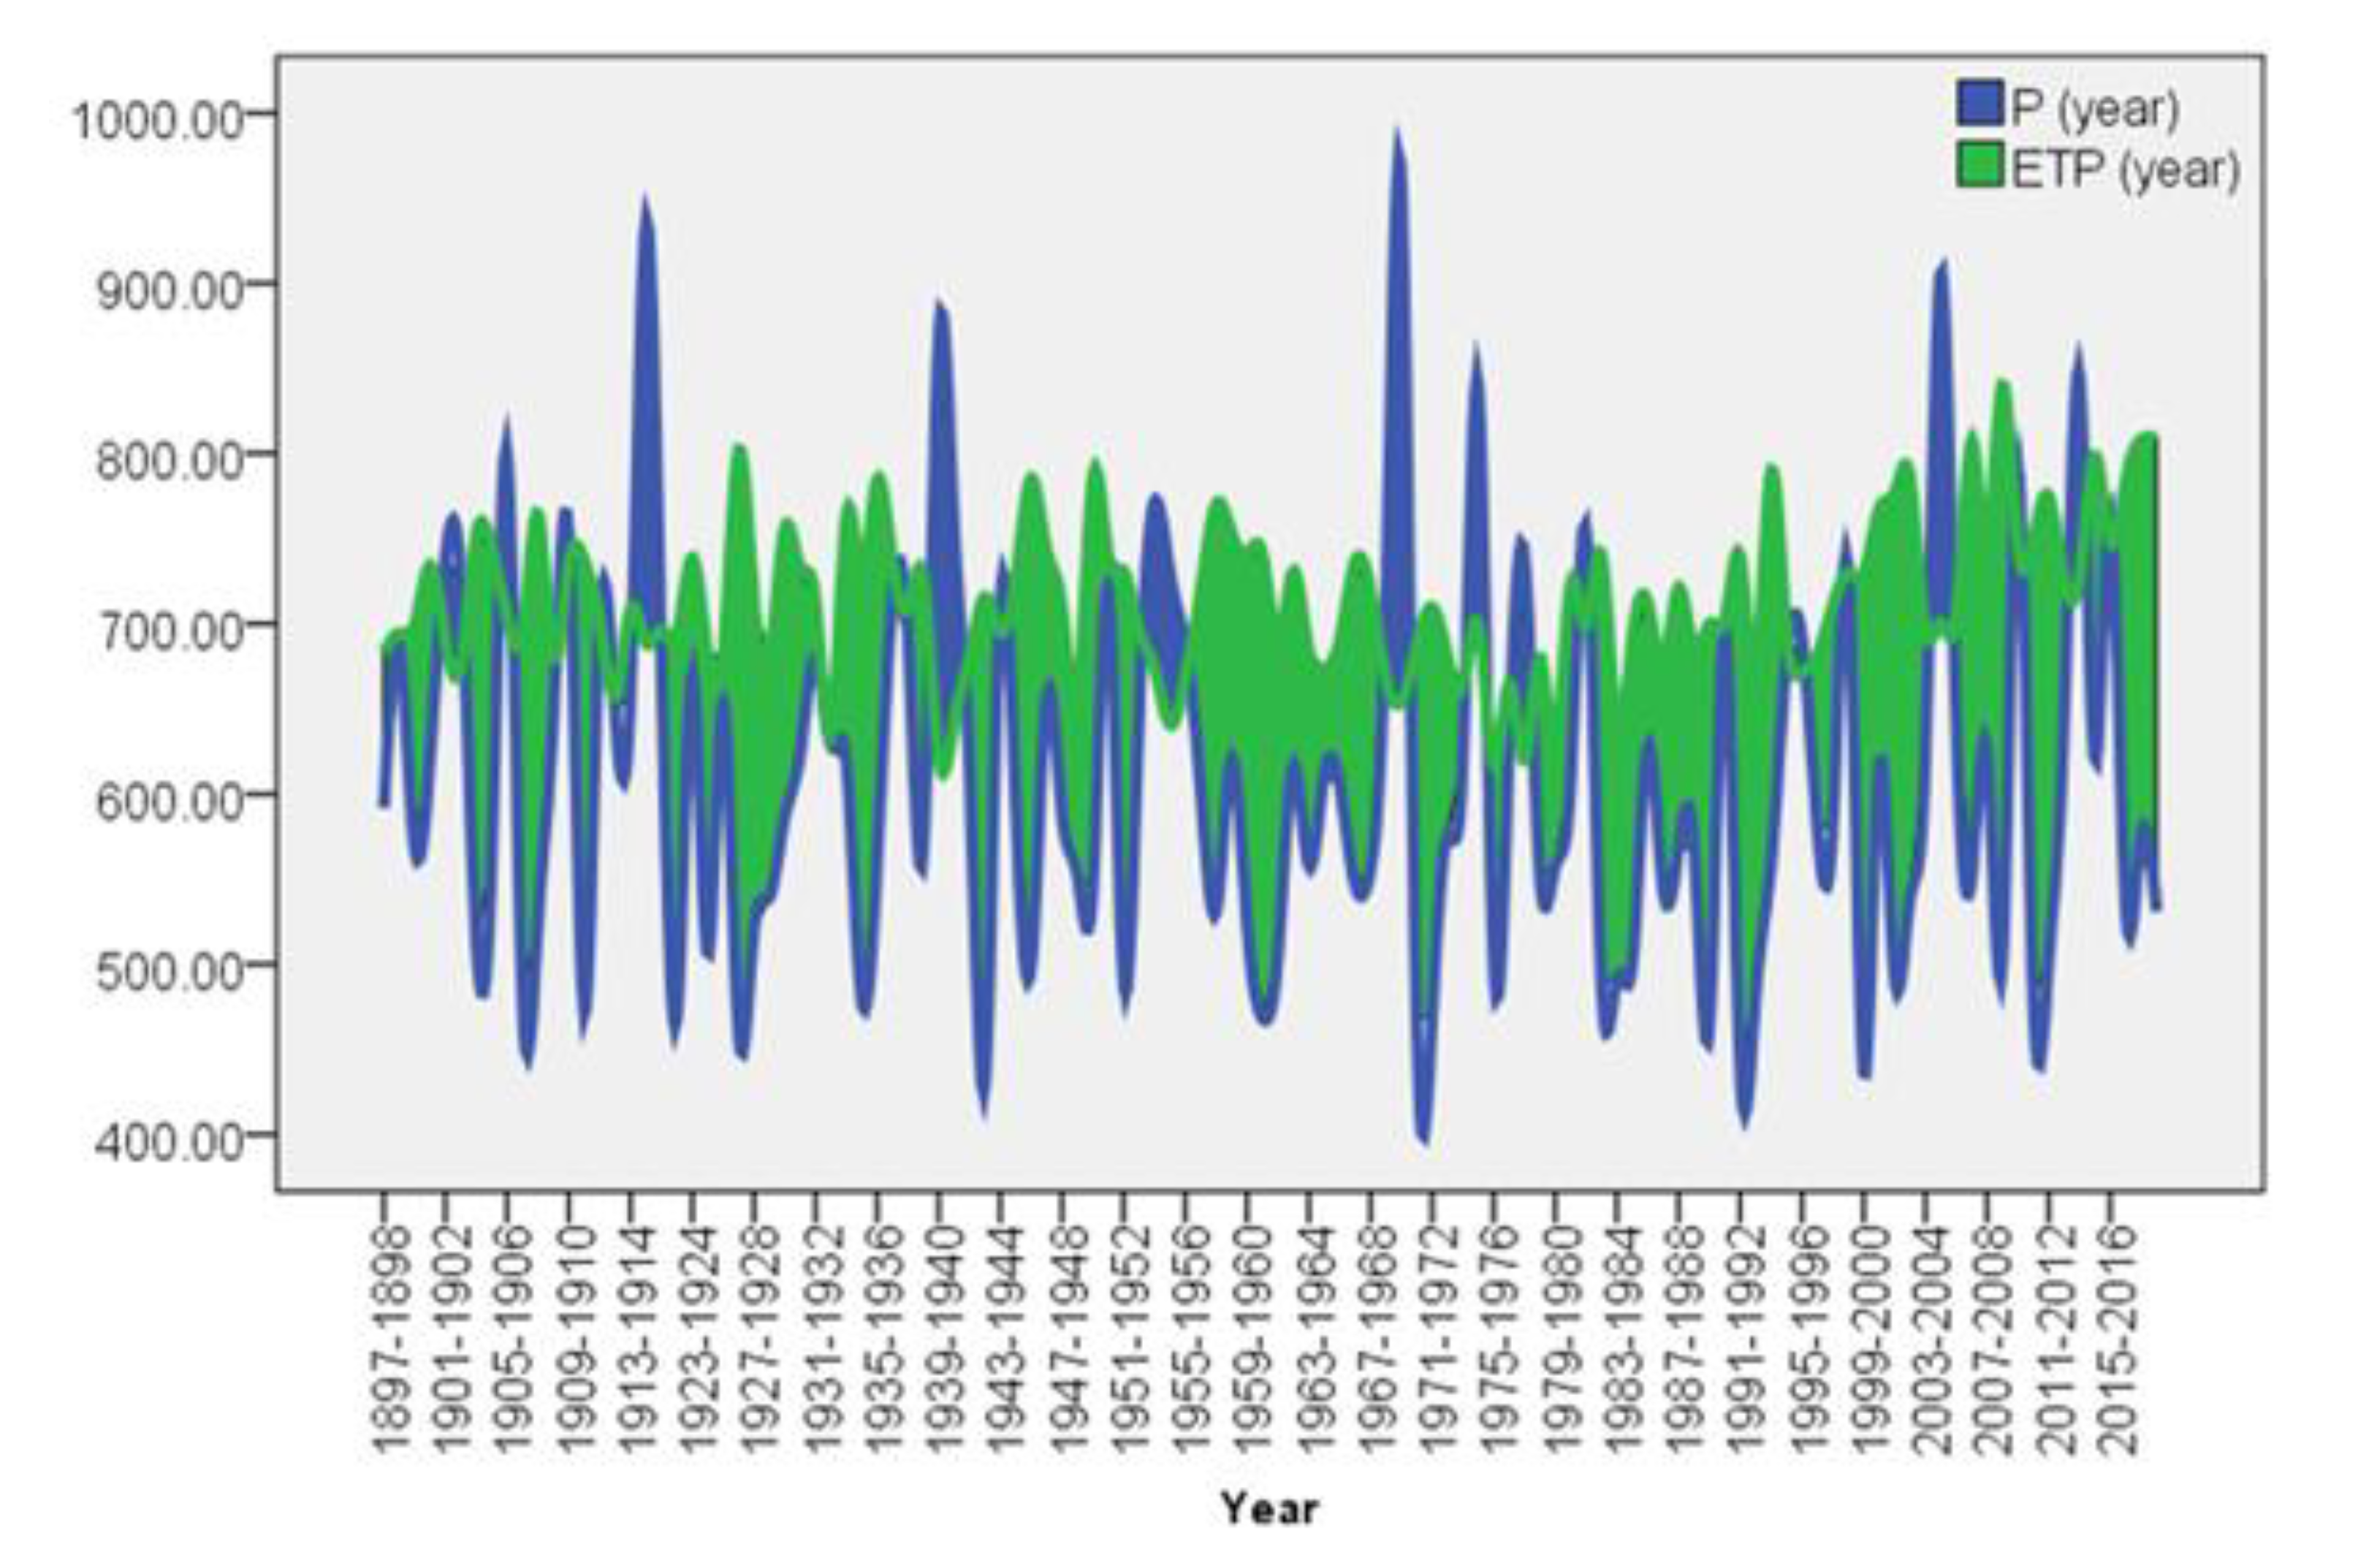
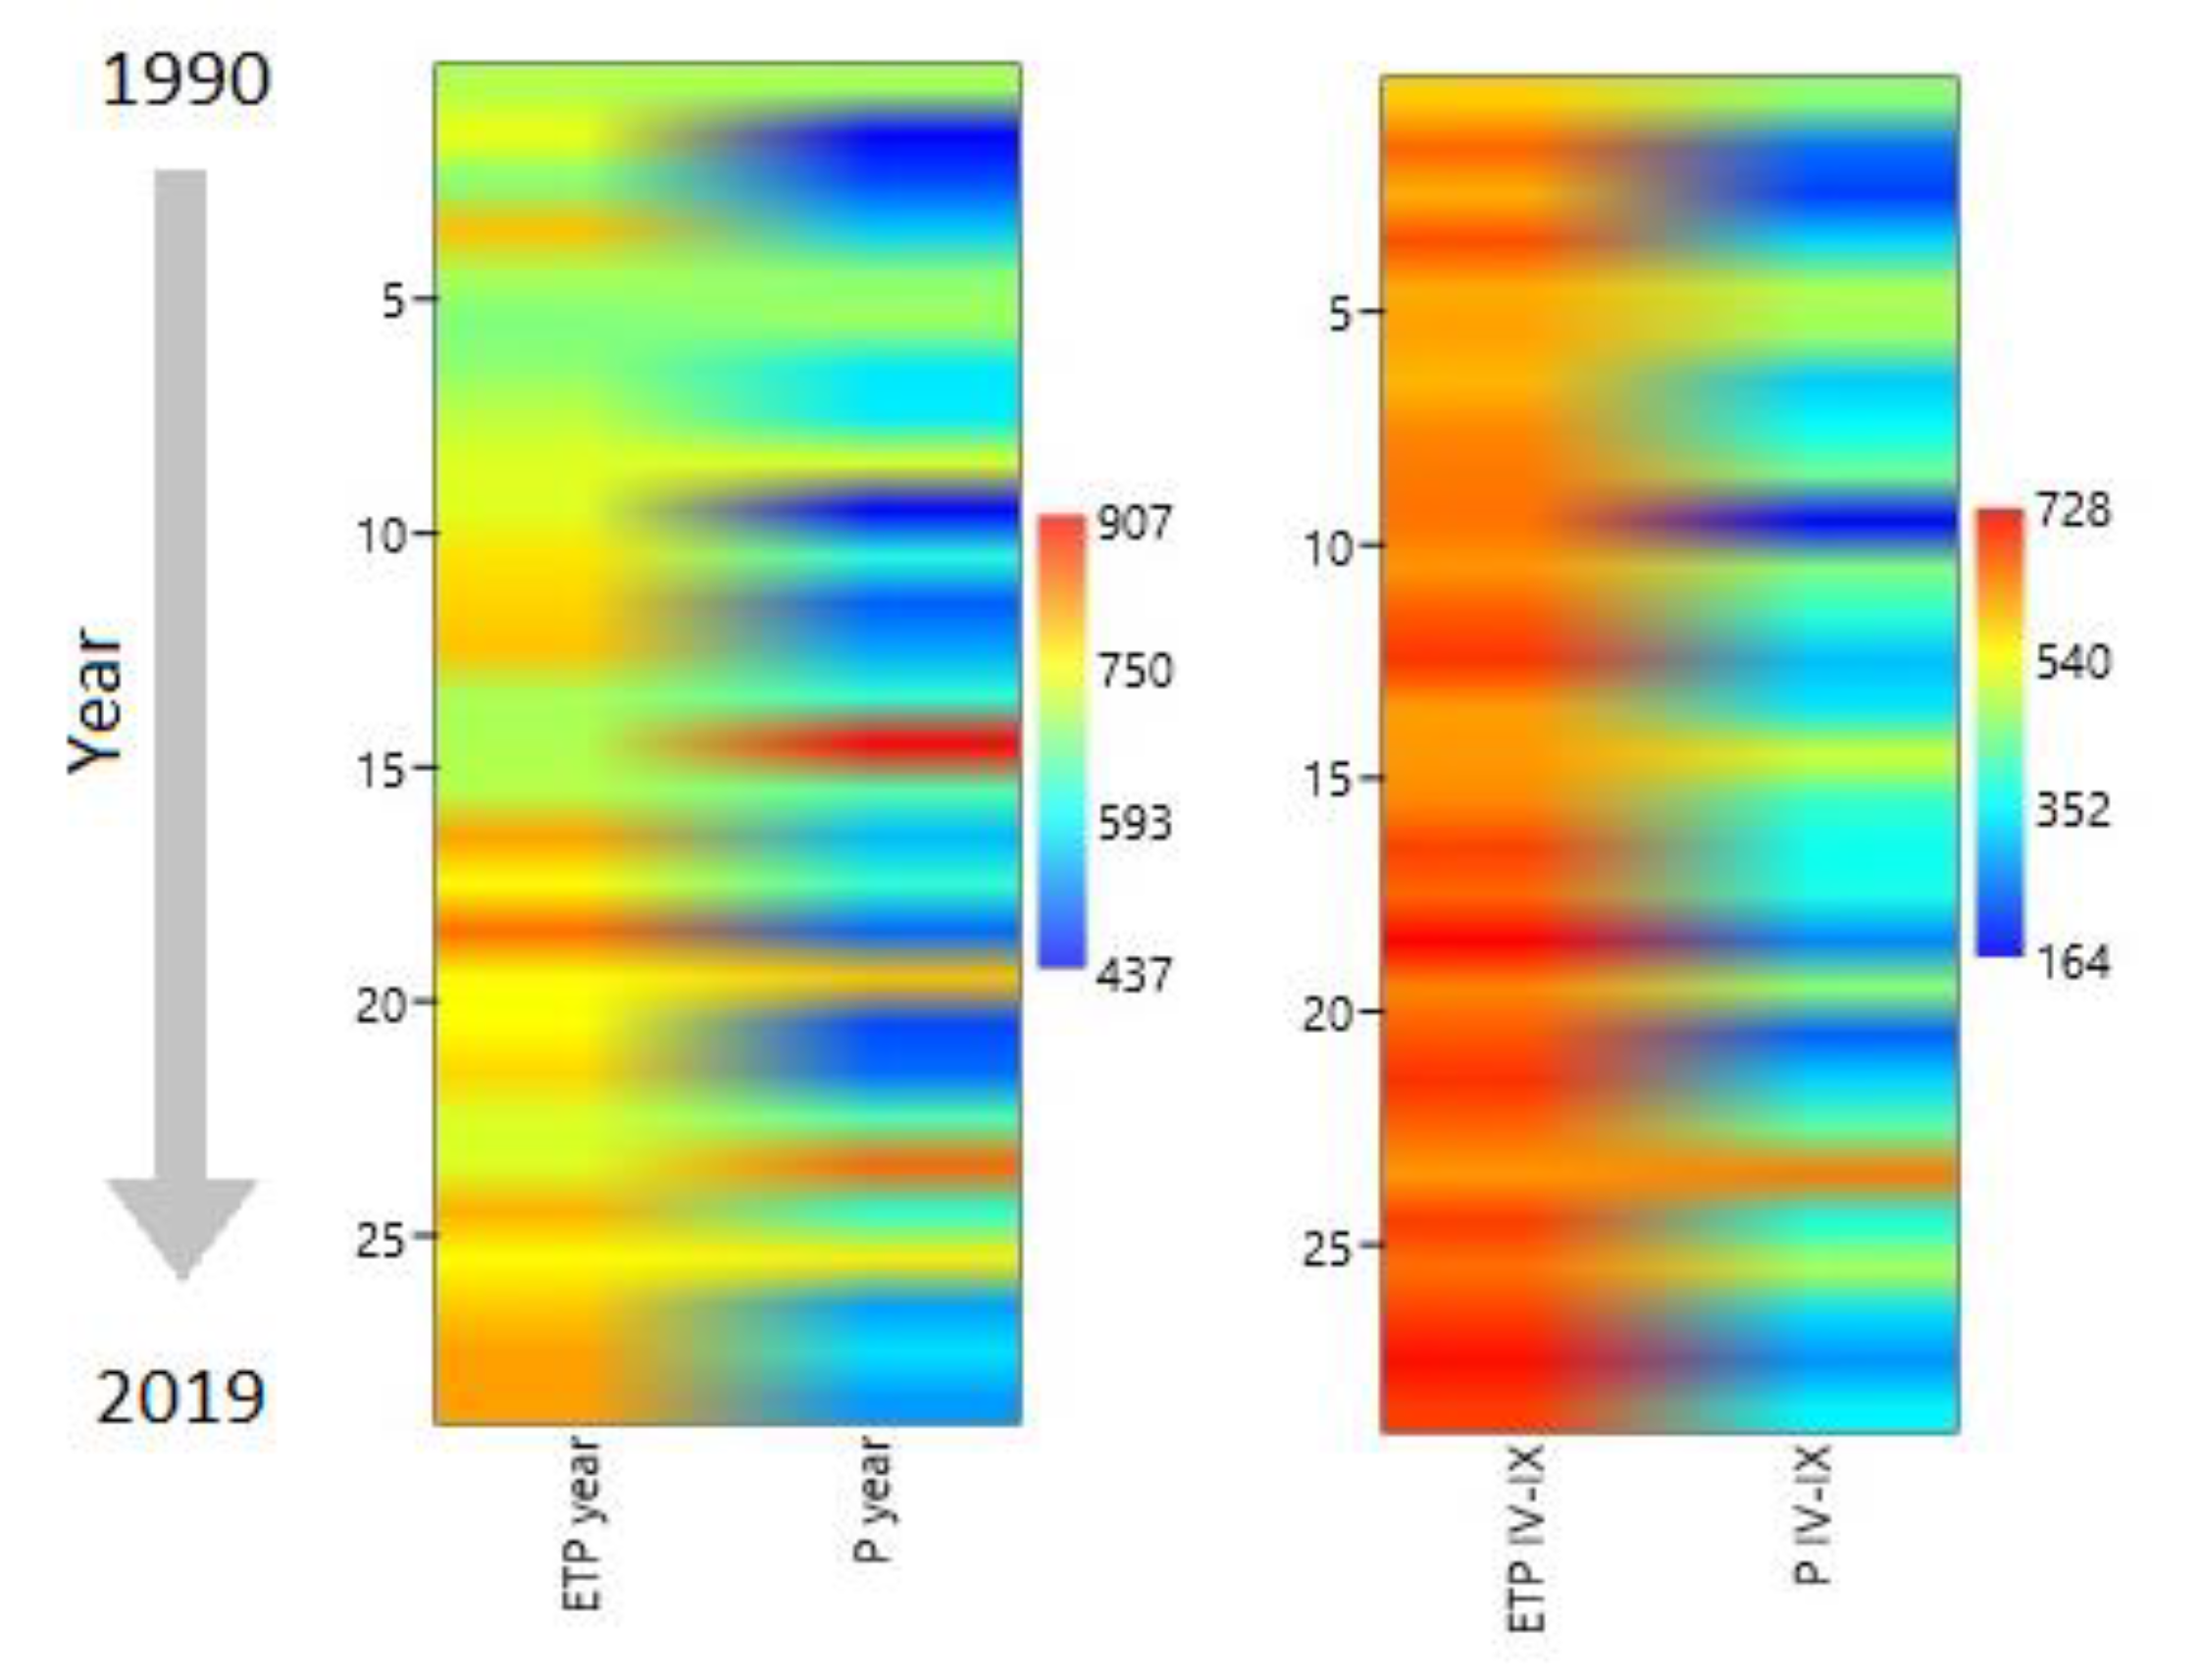
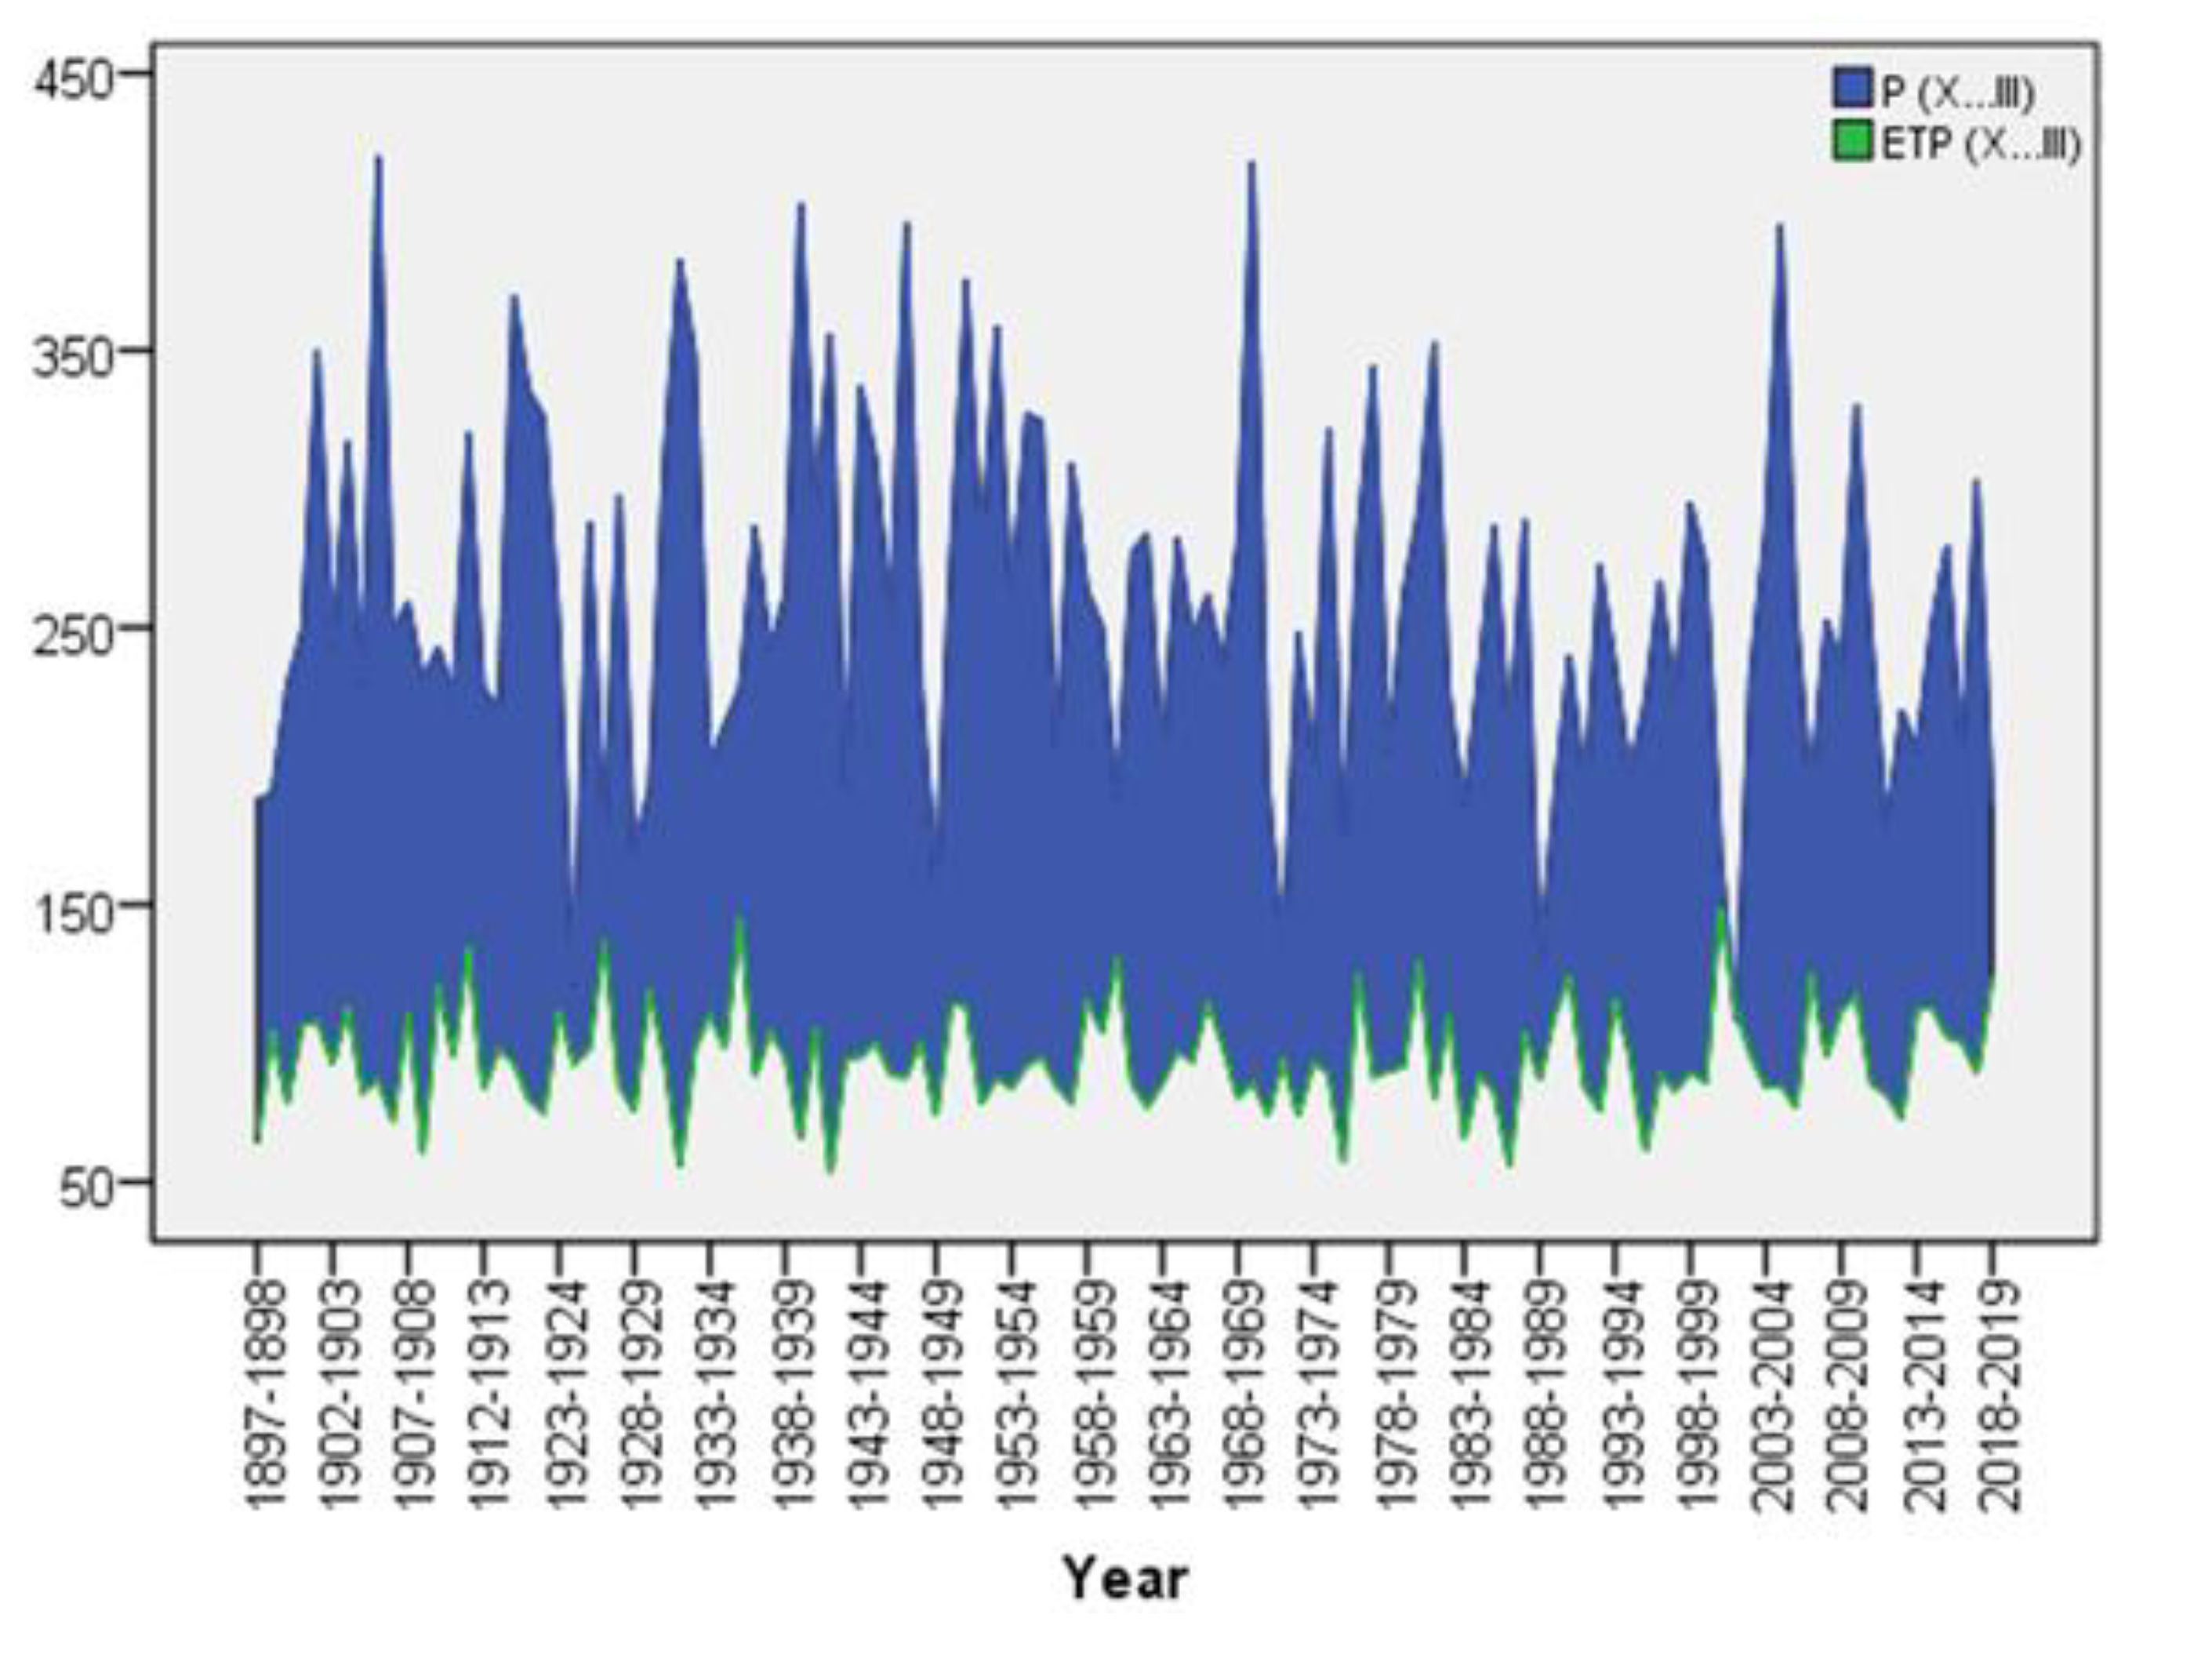
3.3. The Potential Evapotranspiration from the Banat Plain

In the calculation relations for determining the potential evapotranspiration, the monthly temperatures recorded at the Regional Meteorological Center Banat-Crisana between 1897 and 2019 were used. Being calculated with the monthly temperature, the potential evapotranspiration follows the same evolution as this one. The lowest value of evapotranspiration for the agricultural year was 617.4 mm in 1975–1976, and the maximum was 807.4 mm in the agricultural year 2006–2007 (Figure 12). It is noted that in the last decade we have the highest values of evapotranspiration, which denotes high water demands of plants, which could not be covered by rainfall, which are declining.
Regarding the potential evapotranspiration achieved during the vegetation period (Figure 13), there is also a growth trend, more pronounced than in the case of annual evapotranspiration. The lowest evapotranspiration value was 532 mm calculated for the agricultural year 1977–1978. The maximum during the vegetation period was reached in the agricultural year 2008–2009, when 728.3 mm were registered. Additionally, in the last three agricultural years, high values for PET of 683, 720 and 684 mm have occured. Only the potential evapotranspiration for the vegetation period was calculated, the one in the cold season not being interesting in terms of water consumption by plants.

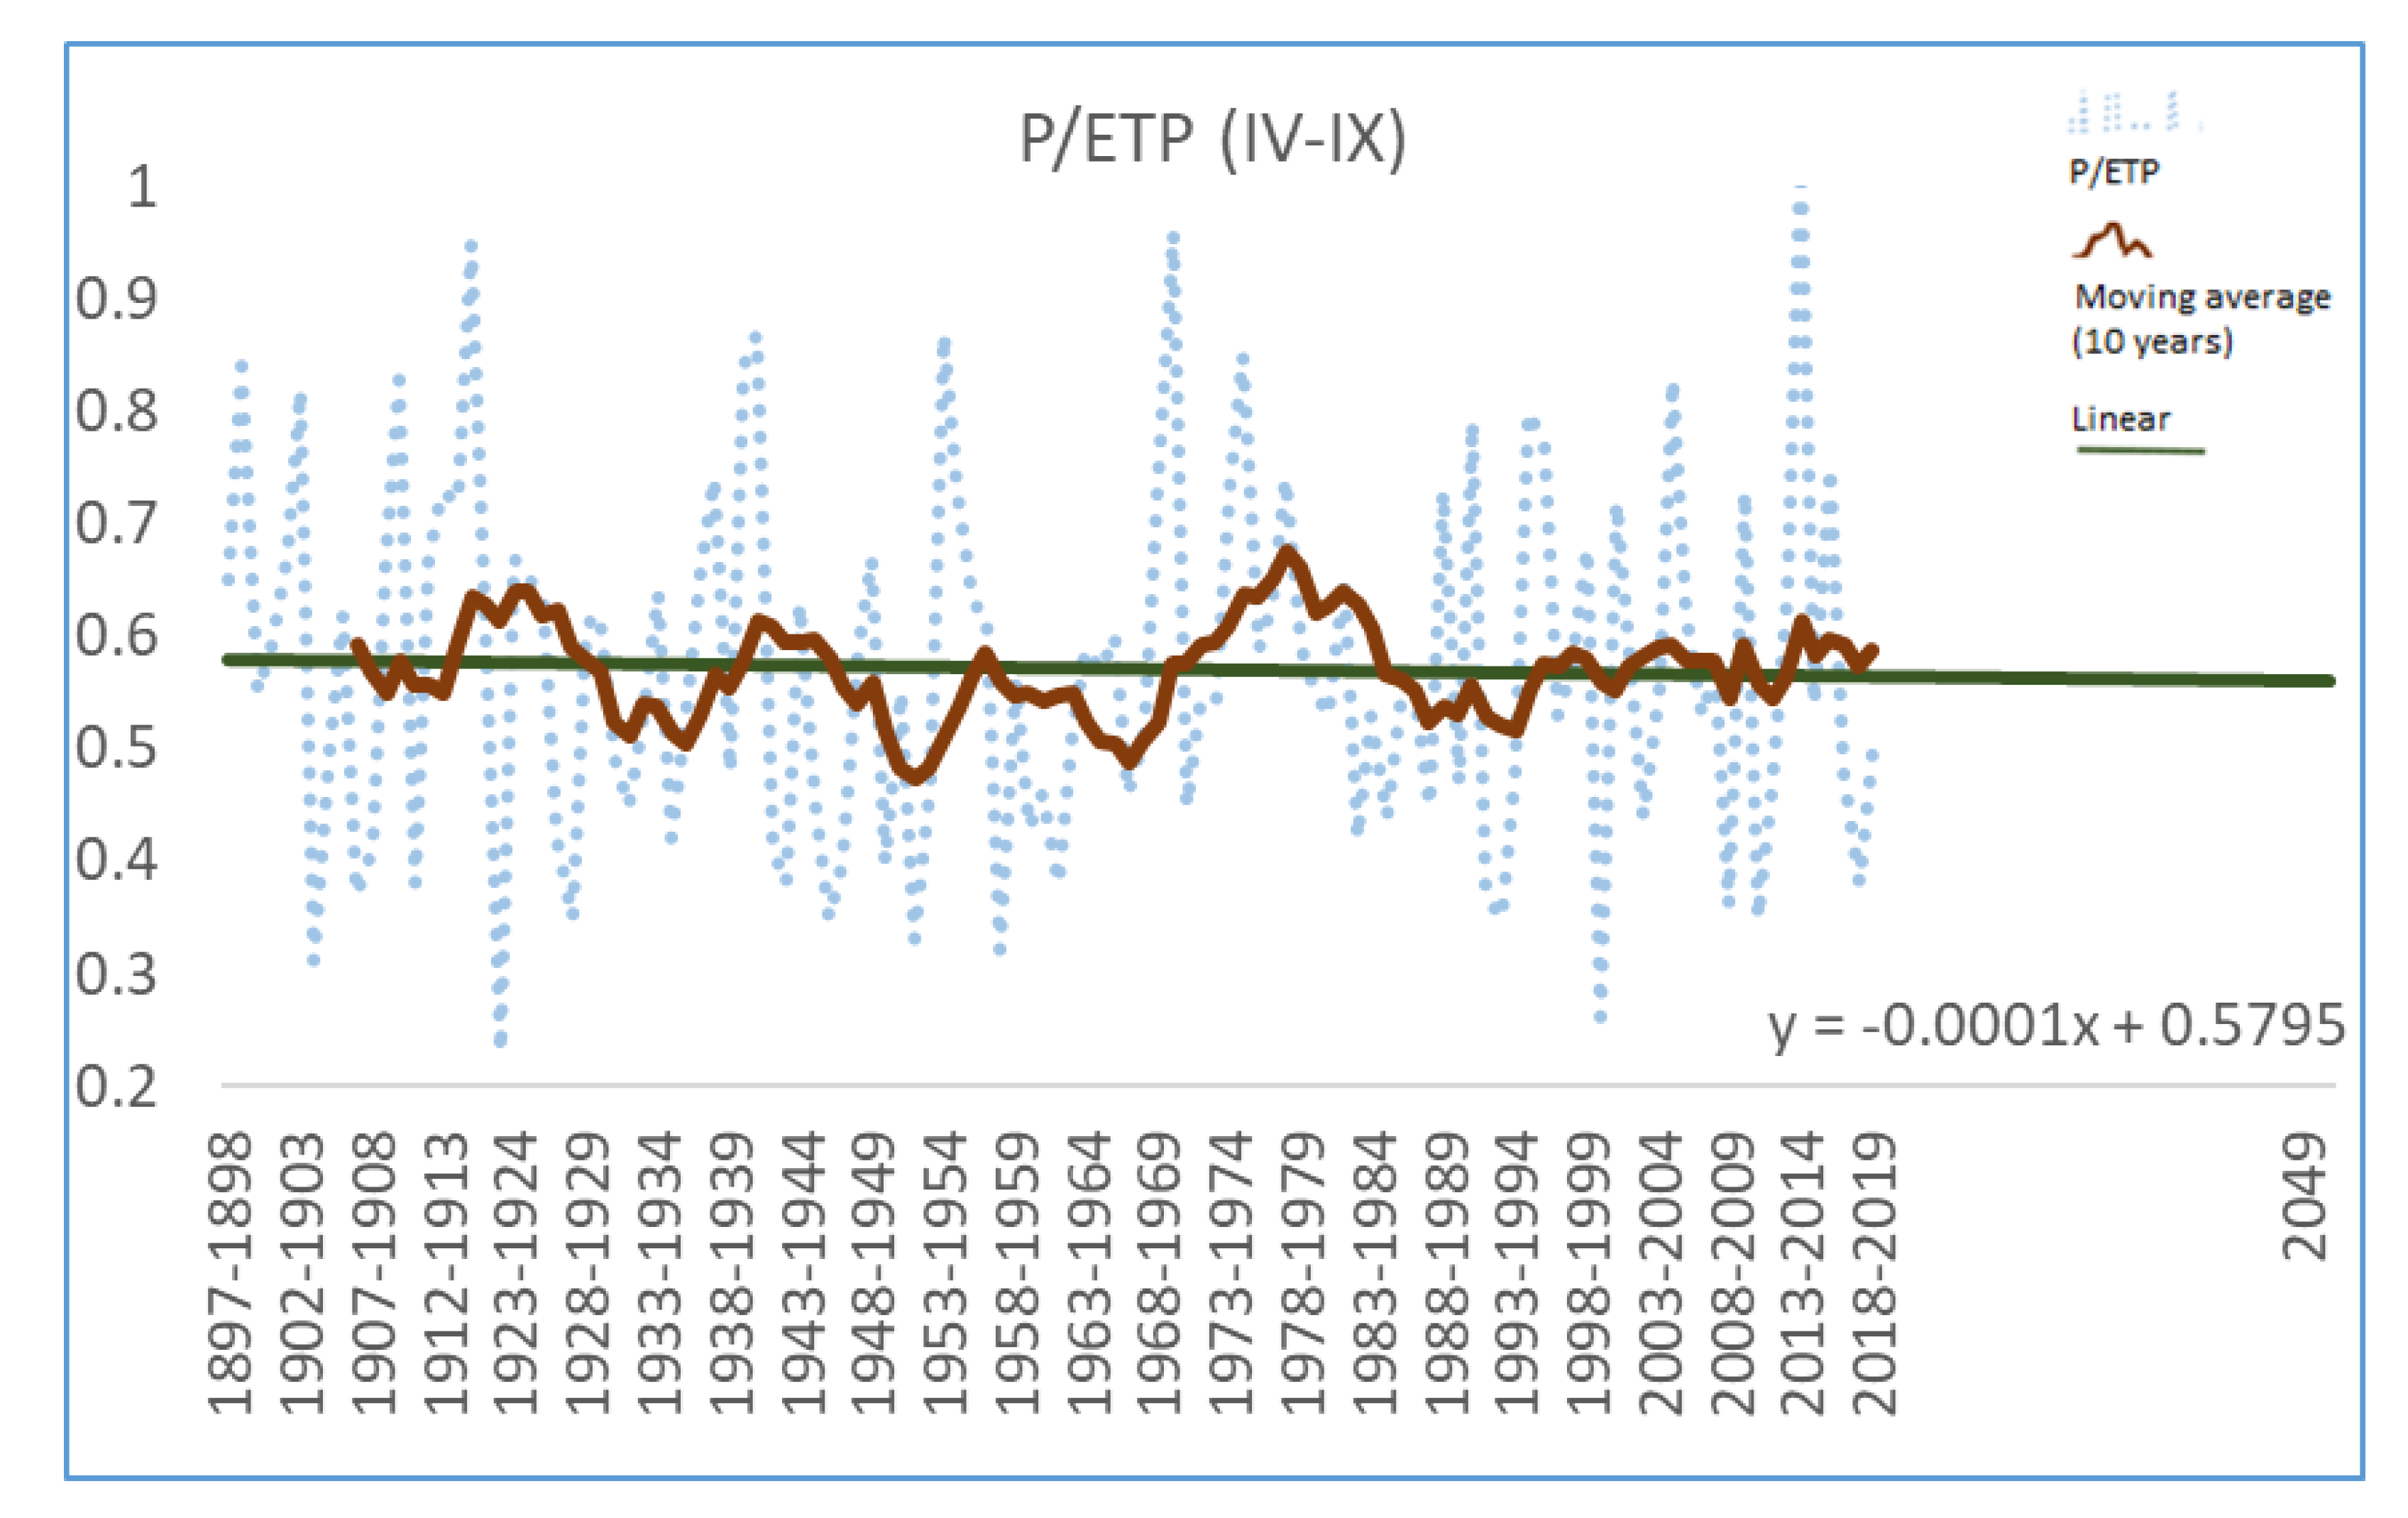
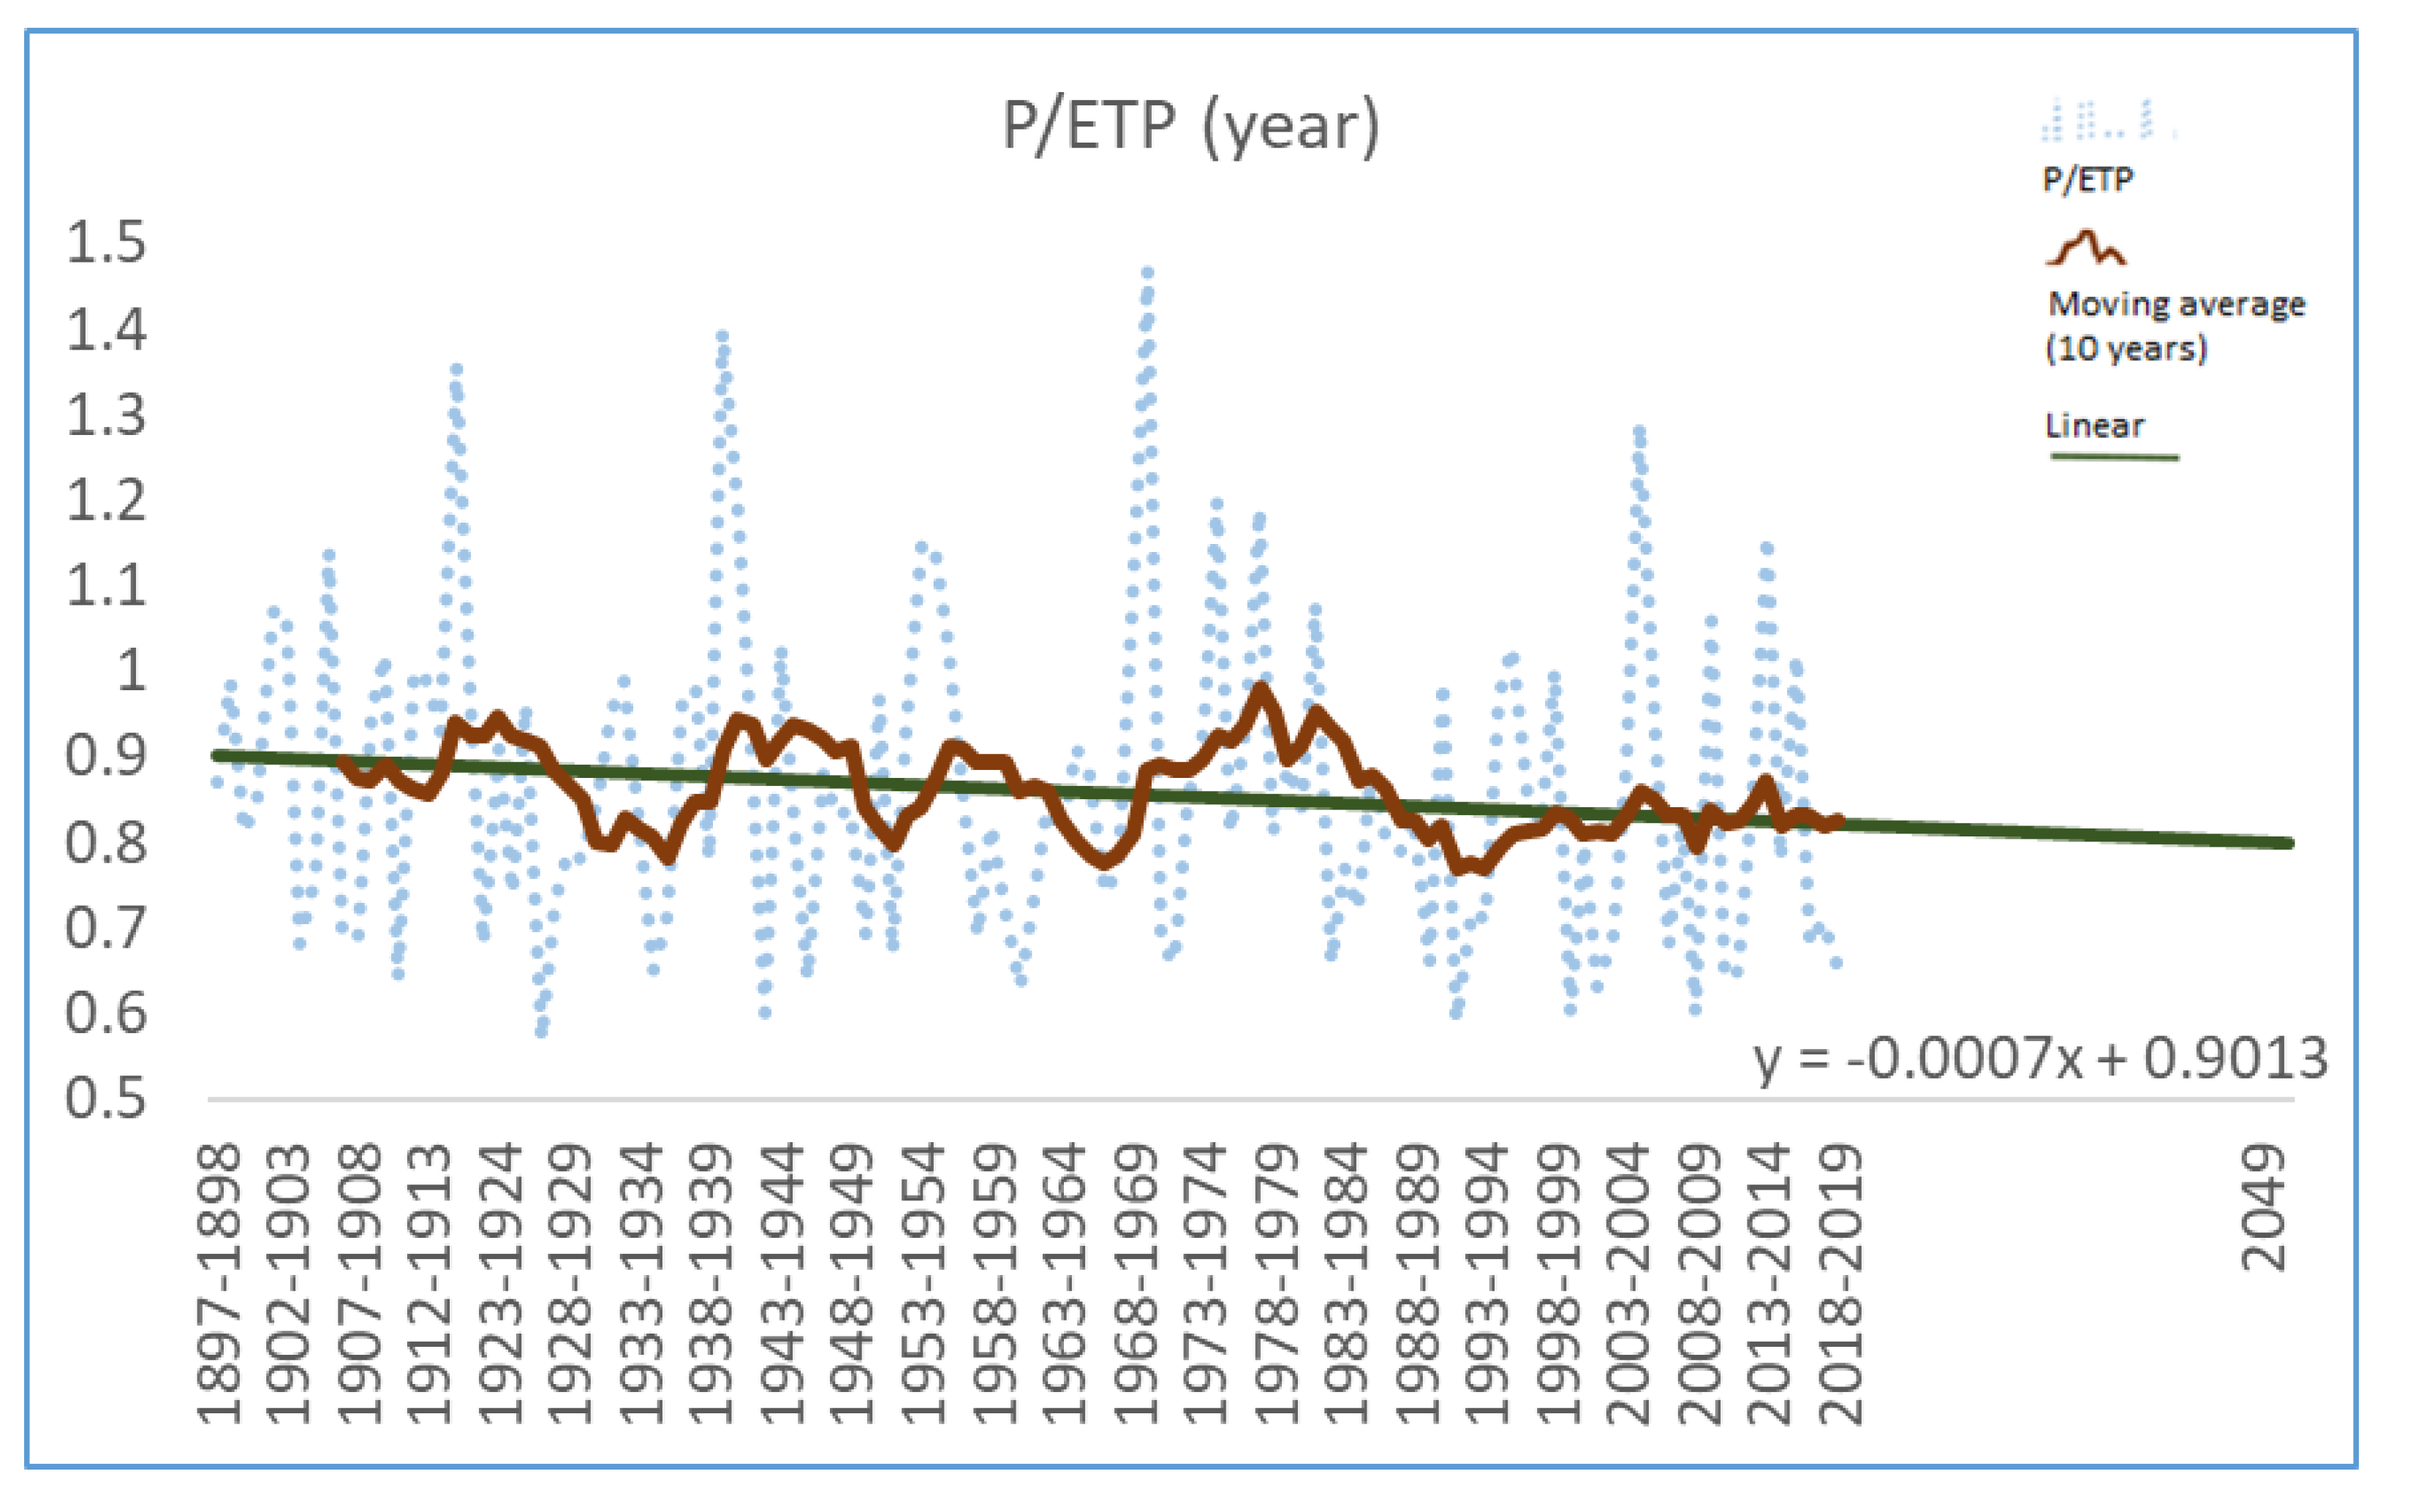
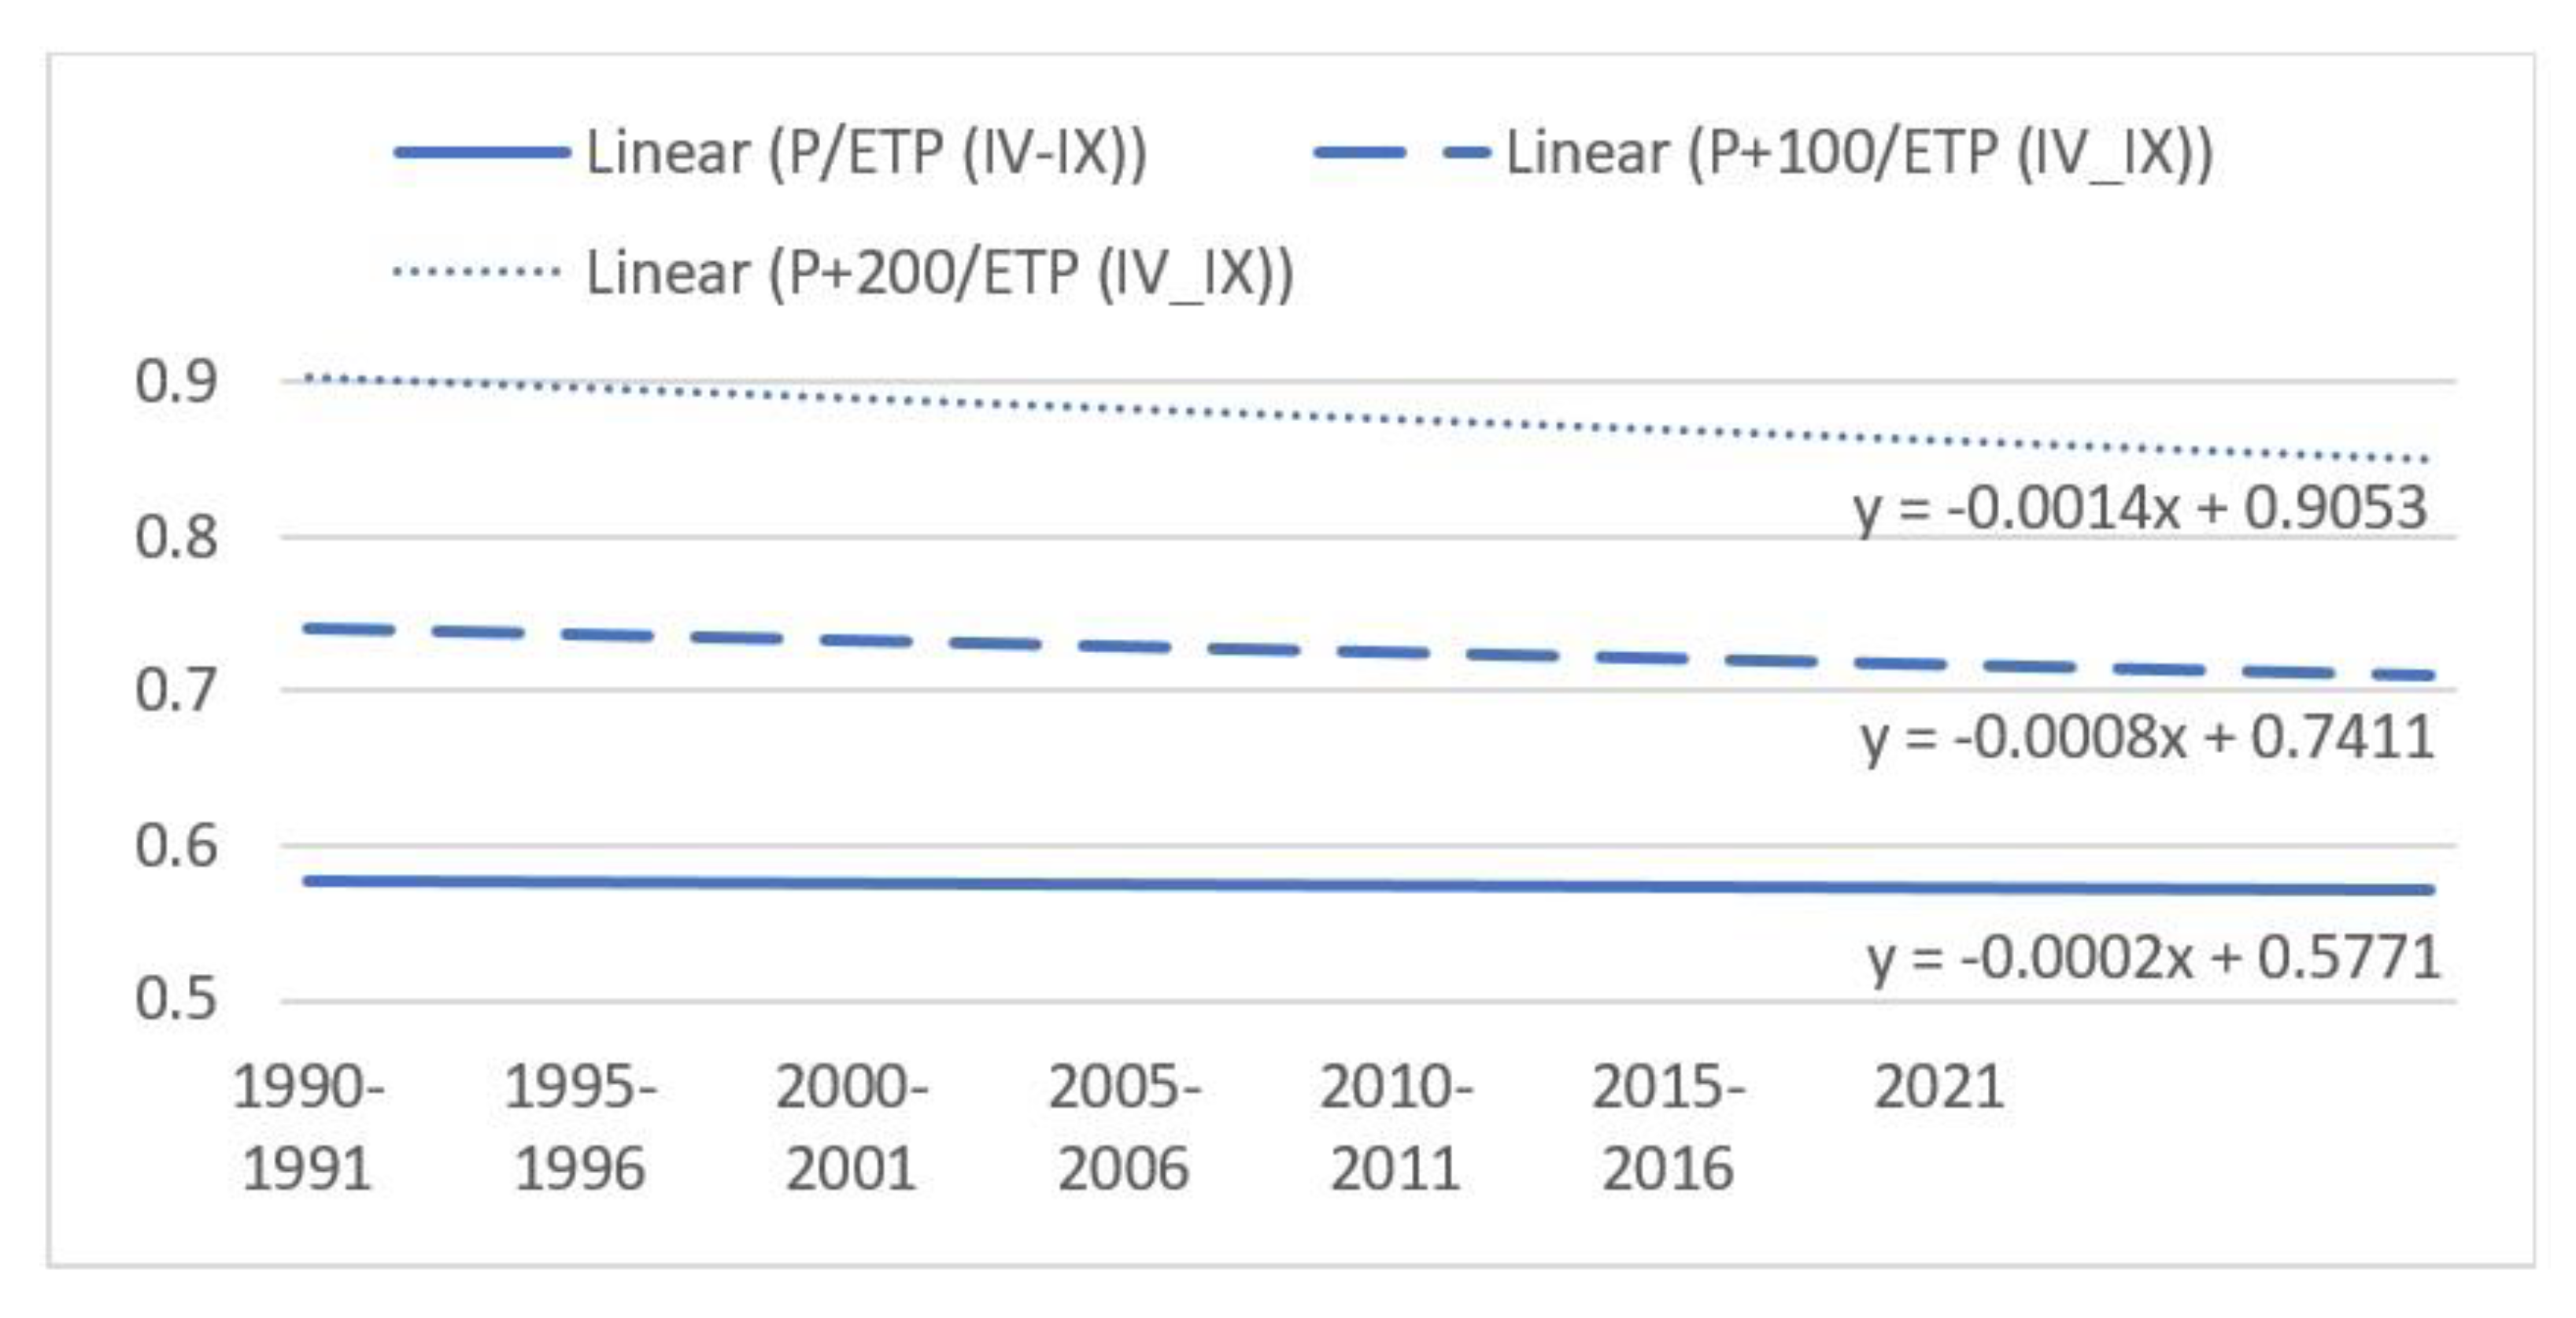
3.4. Water Accessibility for Plants

The level of precipitations, namely of the evapotranspiration, cumulated in the warm period of the year, has been presented by statistic indicators with comparative purpose (Table 1). We do refer here at the minimum and maximum values from the data series including the estimated values every year. The latter may be found in the columns Minimum and Maximum. It has also been calculated 95% confidence interval for mean for each individual time period. The boundaries of this mathematic interval, which frame the average of every individual time period are given by the columns Lower Bound and Upper Bound. The average values of evapotranspiration accumulated during the warm period of the year were about 617 mm during 1898–1950. In the period 1951–1989 it was about 602 mm reaching in the period close to the present, 1990–2019 to about 645 mm. For the entire time period, 95% confidence interval for mean, starts from the value of 335 mm and up to 368 mm. Moreover, One-Way ANOVA indicates that the differences noticed between the value groups determined by the three time intervals have statistical significance (F = 12.9, p < 0.001).
It was interesting to determine the periods in which these changes occur. The post hoc Tukey test was used for this purpose (Table 2). Thus, following the differences between the average values of evapotranspiration in the warm period of the year, it is found that the period 1951–1989 does not show significant differences compared to the period 1898–1950. Significant changes occur in the period 1990–2019 when higher differences are observed between the average values compared to the other two periods. Compared to the period 1951–1989, the average values of evapotranspiration increased by 43.3 mm (p < 0.001) and compared to the period 1898–1950 by 28.1 mm (p < 0.003).
However, the accumulated precipitation between April and September does not show significant changes during the three time periods studied. Thus, in the period 1898–1950, between April and September, an average of 350 mm of precipitation accumulated. In the period 1951–1989, the cumulative precipitations on average were about 342 mm and between 1990–2019 between April and September they accumulated on average about 365 mm. The differences are small, the One-Way ANOVA test does not show statistical significance.
During the whole period 1898–2019, the average value of cumulative evapotranspiration in the warm period of the year is on average 619.9 mm while the average value of accumulated precipitation in the warm period of the year is lower, being only 351.6 mm. This is confirmed using the paired samples test. Significant differences were obtained between the pair values, evapotranspiration-precipitation from the multiannual series, t = 26.6 with p < 0.001.
The high–low diagram indicates in the form of areas, the differences between evapotranspiration and precipitation, accumulated in the warm period of the year (Figure 14). It is visible that the values of evapotranspiration are higher than precipitation. Moreover, in 98.3% of the period under analysis, the P/ETP (IV–IX) ratio was subunit.
Similarly, analyzing the series of precipitation data and evapotranspiration, accumulated this time throughout the year, One-way ANOVA indicates significant differences between the time periods after which these data were grouped, only for evapotranspiration (F = 12.9, p < 0.001). Statistically significant differences were not indicated for the series of annual cumulative rainfalls grouped over the three time periods (Table 1).
The cumulative evapotranspiration throughout the year has a higher value in the period 1990–2019 and differs significantly compared to the period 1898–1950, the difference of the averages being 31.7 mm (p = 0.003). It also has a higher value compared to the period 1951–1989, the difference of the averages being in this situation of 50.2 mm (p < 0.001). Values are determined using the Tukey Post Hoc test. Table 2 shows that the difference between the average values of the periods 1898–1950 and 1951–1989 has no statistical significance regarding the evapotranspiration accumulated annually.
For the entire period 1898–2019, the average values of cumulative evapotranspiration throughout the year was 714.4 mm. At the same time, the average values of accumulated rainfall throughout the year were lower, only 610 mm. Differences between evapotranspiration-precipitation pair values are statistically confirmed using paired samples test, t = 8.5 with p < 0.001. The adjacent diagram (Figure 15) shows the differences between the two multiannual series.
Improving the indices that describe the water deficit is a very broad research topic, being developed different calculation methods. This is also due to the numerous methods of characterizing drought or aridity induced by multidisciplinary or particular requirements of different use [44,45,46,47]. Of note are the frequency of drought described by an index and its performance [48], the drought recognition index [49].
The relationship between precipitation and evapotranspiration is an effective indicator of the description of water deficit [50,51]. Arid areas are defined by the ratio of precipitation to potential evapotranspiration less than or equal to 0.2 and semi-arid areas with a ratio greater than 0.2 but less than or equal to 0.5 according to FAO-UNESCO [51,52].
Carrying out the report of the data from the statistical series of the accumulated precipitations in the warm period of the year, with the cumulative evapotranspiration during the same time period, for each year of the time period under analysis, the series marked P/ETP IV–IX was obtained. During the 116 years in which the statistical data were recorded, the average value of the P/ETP IV–IX ratio was 0.572 and the median value, very close, was 0.554. The most common value was about 0.5. The column in Table 3 indicates the cumulative percentage and percentage frequencies of the P/ETP IV–IX series values to the nearest decimal. It provides useful information on the frequency with which rainfall is lower than evapotranspiration. Thus, in the case of 58 years out of the 116 (50%) in which registrations were made, the P/ETP ratio IV–IX was lower or equal to 0.5. Thus, the evapotranspiration in those years, accumulated during the warm period of the year, was at least twice as high as the precipitation accumulated in the same periods of time.
Similarly, data on values accumulated throughout the year were analyzed (Table 3). Additionally, in the case of these values, the ratio between precipitation and evapotranspiration, P/ETP (year) has in approximately 70.7% of cases subunit values indicating the frequency of cases in which evapotranspiration exceeds precipitation. The average value for the entire period 1898–2019 is 0.860 and the median value is 0.835. No low values of this ratio were noticed, below 0.5. Overall, throughout the agricultural year, the situation is not as worrying as in the case of the growing season.
The last period of time studied, 1990–2019 has similar characteristics. Most often in the warm period of the year the values of cumulative evapotranspiration exceed precipitation (Figure 16). Cumulated for the whole year, approximately 72.4% of the P/ETP year values are subunit. A positive fact is that there are no values of the P/ETP year ratio less than or equal to 0.5. However, inconveniences occur during the warm period of the year. Of the 30 years to which we refer, in 15 of them the ratio between precipitation and evapotranspiration was less than or equal to 0.5.
Taking into account that both during the warm period of the year and throughout the year, most frequently, the cumulated values of the evapotranspiration overpass the precipitations cumulated values, there is the question of the water source. Conducted observations for statistic data series annually measured for cumulated values during the cold time of the year, between the months October (X) and March (III), point out the fact that in that period of the year, precipitations overpass the evapotranspiration (Figure 17). The differences are statistically significant, t = 50.0, p < 0.001, using paired samples t test. A frequency analysis has shown that in 99.1% of the years between 1898–2019, the report between precipitations and evapotranspiration during the cold time of the year, has been over unity. In 83% of the cases, it overpassed the value 2 and in 36% of the cases the precipitations volume was three times bigger than the cumulated evapotranspiration during the cold period of the year. Furthermore, the city of Timișoara is situated in the lower course of two important rivers being an important source of water supplied by the precipitations from the mountain area of the region. These things may explain the poise of the hydrological balance. However, fallen precipitations during the cold time of the year do not have a direct effect in the maintenance of traditional crops.
Performing a linear adjustment using the method of least squares for the series P/ETP (IV-IX) namely P/ETP (year) we do obtain the lines: y P / ETP   IV IX = 0.0001 x + 0.5795 (Figure 18) and y P / ETP   year = 0.0007 x + 0.9013 (Figure 19). Both lines have the direction approximately parallel to the abscissa axis, but slightly decreasing. Theoretically, at the horizon of 2050 if the trends determined by linear adjustment are maintained, the ratios between the cumulative values of precipitation with hot period evapotranspiration would reach values y P / ETP   IV IX | 2050 = 0.564 compared to the average value of the period 1898–2019 of 0.572. For the cumulative values for the whole year, compared to the average value of the period 1898–2019 which was 0.860, the estimated value is y P / ETP   year | 2050 = 0.798 .
The tendency of the report between precipitations and temperature is a slightly decreasing one, but still superior to the limit of 0.5 under which an area is described to be a semi-arid one or even arid. However, the high number of years in which evapotranspiration exceeds quantitative rainfall, which is in an unfavorable ratio, are the years in which considerable damage to agriculture occurs. It is understandable the need for concrete measures by regulating the water balance. Thus, precipitation variability and climate change must be addressed through efficient management of water resources in agriculture, namely, a better use of soil moisture reserves throughout the vegetation season, including the choice of sowing periods according to the degree of soils’ water supply, the application of agro technical measures to improve the soil structure and the improvement of the aero-hydric balance from the soil. At the beginning of the vegetation period, rainfall in large quantities in the cold period (the months October–March) allow the storage of water in the soil up to field capacity. The soils from the Banat Plain, especially those from the higher and better drained areas, are fertile soils, namely typical chernoziom and cambic ones, phreatic humid or gleying ones, with medium-fine texture. These soils are the most favorable ones because they have moderate amounts of water inaccessible to plants, accessible water retention capacity, medium or high capillary rise, high or medium permeability, good conditions for a water regime favorable to crops. To all these, one may add the high groundwater level in the Banat Plain, which is a water supply source of the plants. Groundwater in the Banat Plain is stored in alluvio permeable-proluvial deposits, and is presented as a horizon, generally a continuous one, with depths of 1–2 m on the widest surfaces, followed by those with 2–3 m depth. However, in order to maintain an optimal water regime, which does not cause hydrological stress to the plants, it is recommended to intervene with additional water supply through irrigation. Farmers in the area need to understand that for optimal and safe production they do not have to rely or to be dependent on the weather. This dependence increased considerably as a result of the degradation and non-functioning of the irrigation systems built during 1969–1989 and abandoned after leaving communism. Therefore, investments in the rehabilitation of the irrigation and equipment systems should be a priority investment in Romanian agriculture. It is necessary to determine technical solutions for water supply, labor costs, and profitable investments for farmers and sources for necessary funds.
In Figure 20 there are studied in this respect two scenarios compared to the present state of affairs (scenario 0). Thus, there is a question of supplementing by 100 mm (scenario 1), respectively, by 200 mm (scenario 2) the amount of water and of testing the value at which the ratio between the values supplemented together with precipitation and evapotranspiration tends in the warm period of the year. Using linear adjustment of the series defined this way, for the period 1990 to the present, scenario 1 indicates an evolution of the ratio at 0.71 over the next 5 years (2025), while scenario two indicates a ratio of 0.86.

4. Conclusions

Climate change in the Banat Plain was highlighted by studying the evolution of temperature and precipitation recorded at the Regional Meteorological Center Banat-Crisana, the station with the oldest records in western Romania. The temperature was recorded over a period of 122 years (1897–2019) and the study of its evolution showed that the temperature is increasing during the agricultural year (October–September), increasing from 10.3 °C in 1897–1898 and reaching the end of the records to be 12.7 °C, in the last two agricultural years. The same increasing evolution was registered during the vegetation period, increasing from 18 °C in the first year of registration reaching in the agricultural year 2018–2019 to 19.5 °C. From the representation of the temperature evolution by averages of 10 and 50 years, respectively, the same trend is observed in the three periods considered: October–September (agricultural year), March–October (extended vegetation period) and April–September (conventional warm period), namely a spectacular increase in the last four decades. The last decade records the highest temperatures in all the periods studied: 12.0 °C in October–September, 16.7 °C in March–October and 19.2 °C in April–September. Additionally, from the study of the average values for 50 years it was observed that the maximum is reached in the last 50 years 1967–2019.
The evolution of precipitations in the Banat Plain was followed for a period of 146 years (1873–2019) and it resulted that the years are not constant, being years with more abundant precipitations, followed by dry years. However, analyzing the trend line, it is found that overall, rainfall is declining, especially in the last 3 years being 534, 575.1 and 531.2 mm, respectively, compared to 1106 mm in 1883–1884. From the distribution of precipitation during vegetation periods, it was noticed that in the warm period of the year the decreasing trend is higher than in the cold period, which implies a water deficit, exactly when the plants have the maximum water consumption.
The potential annual evapotranspiration was calculated in the Banat Plain for a period of 122 years and a slight upward trend was observed. It was noted that in the last decade we have the highest values of evapotranspiration, which denotes high water demands of plants, which could not be covered by rainfall, these being declining. The potential evapotranspiration from the Banat Plain during the vegetation period is much more accentuated than the annual one.
The correlation between precipitation and potential evapotranspiration was determined to see if the water consumption of the plants is covered by precipitation. It turned out that in the case of 58 years out of the 116 (50%) in which registrations were made, the P/ETP ratio during the vegetation period was less than or equal to 0.5. Thus, the evapotranspiration in those years, accumulated during the warm period of the year, was at least twice as high as the precipitation accumulated in the same periods of time. From the study of the evolution trend of the ratio between precipitation and evapotranspiration until 2050 shows only a very slight decrease in evolution. However, the large number of years in which evapotranspiration quantitatively exceeds precipitation are the years when the water factor has negative influences on culture and sustainability in agriculture.
The climate of the Banat Plain has undergone major changes that have followed the evolution of global climate change, with an increase in temperature especially during the vegetation period of plants, while reducing rainfall and lowering the groundwater due to intense hydro-amelioration works begun in the 18th century, all this affecting the accessibility of water for agricultural crops. It is necessary to take measures to improve the water regime, respectively, the accessibility of plant water through irrigation or soil technologies that allow water retention in the soil.

Author Contributions

All authors have contributed to the study and writing of this research. L.S. conceptualization and drew the main conclusions; C.R. software and formal analysis; A.S. methodology; F.I., D.M., A.I., T.A. and I.R. analysed the data; R.P. writing—reviewing and editing. All authors have read and agreed to the published version of the manuscript.

Funding

The publication of this paper is supported through the project “Assuring Excellence in RDI Activities within the USAMVBT” Code 35PFE.

Acknowledgments

This paper is published within the project “Assuring Excellence in RDI Activities within the USAMVBT” Code 35PFE, submitted in Competition Program 1—Development of the National Research and Development System, subprogram 1.2—Institutional Performance, Institutional Development Projects—Excellence Funding Projects in RDI.

Conflicts of Interest

The authors declare no conflict of interest.

References

  1. Tadese, M.; Kumar, L.; Koech, R. Long-Term Variability in Potential Evapotranspiration, Water Availability and Drought under Climate Change Scenarios in the Awash River Basin, Ethiopia. Atmosphere 2020, 11, 883. [Google Scholar] [CrossRef]
  2. Mohammed, R.; Scholz, M. Climate Variability Impact on the Spatiotemporal Characteristics of Drought and Aridityin Arid and Semi-Arid Regions. Water Resour. Manag. 2019, 33, 5015–5033. [Google Scholar] [CrossRef] [Green Version]
  3. Khan, M.I.; Liu, D.; Fu, Q.; Dong, S.; Liaqat, U.W.; Faiz, M.A.; Hu, Y.; Saddique, Q. Recent Climate Trends and Drought Behavioral Assessment Based on Precipitation and Temperature Data Series in the Songhua River Basin of China. Water Resour. Manag. 2016, 30, 4839–4859. [Google Scholar] [CrossRef]
  4. Ziernicka-Wojtaszek, A.; Kopcińska, J. Variation in Atmospheric Precipitation in Poland in the Years 2001–2018. Atmosphere 2020, 11, 794. [Google Scholar] [CrossRef]
  5. Intergovernmental Panel on Climate Change. IPCC Fourth Assessment Report. Climate Change: Synthesis Report; Intergovernmental Panel on Climate Change: Geneva, Switzerland, 2007. [Google Scholar]
  6. Chen, H.; Guo, S.; Xu, C.-Y.; Singh, V.P. Historical temporal trends of hydro-climatic variables and runoff response to climate variability and their relevance in water resource management in the Hanjiang basin. J. Hydrol. 2007, 344, 171–184. [Google Scholar] [CrossRef]
  7. Kusangaya, S.; Warburton, M.L.; Van Garderen, E.A.; Jewitt, G.P.W. Impacts of climate change on water resources in southern Africa: A review. Phys. Chem. Earth Parts A/B/C 2014, 67, 47–54. [Google Scholar] [CrossRef]
  8. Devkota, L.P.; Gyawali, D.R. Impacts of climate change on hydrological regime and water resources management of the Koshi River Basin, Nepal. J. Hydrol. Reg. Stud. 2015, 4, 502–515. [Google Scholar] [CrossRef] [Green Version]
  9. Heil, K.; Lehner, A.; Schmidhalter, U. Influence of Climate Conditions on the Temporal Development of Wheat Yields in a Long-Term Experiment in an Area with Pleistocene Loess. Climate 2020, 8, 100. [Google Scholar] [CrossRef]
  10. Lüttger, A.B.; Feike, T. Development of heat and drought related extreme weather events and their effect on winter wheat yields in Germany. Theor. Appl. Clim. 2018, 132, 15–29. [Google Scholar] [CrossRef]
  11. Gornall, J.; Betts, R.; Burke, E.; Clark, R.; Camp, J.; Willett, K.; Wiltshire, A. Implications of climate change for agricultural productivity in the early twenty-first century. Philos. Trans. R. Soc. B Biol. Sci. 2010, 365, 2973–2989. [Google Scholar] [CrossRef]
  12. Dahal, V.; Gautam, S.; Bhattarai, R. Analysis of the Long-term Precipitation Trend in Illinois and Its Implications for Agricultural Production. Water 2018, 10, 433. [Google Scholar] [CrossRef] [Green Version]
  13. Rosenzweig, C.; Tubiello, F.N.; Goldberg, R.; Mills, E.; Bloomfield, J. Increased crop damage in the US from excess precipitation under climate change. Glob. Environ. Chang. 2002, 12, 197–202. [Google Scholar] [CrossRef] [Green Version]
  14. Foley, A. Uncertainty in regional climate modelling: A review. Prog. Phys. Geogr. Earth Environ. 2010, 34, 647–670. [Google Scholar] [CrossRef] [Green Version]
  15. Vetter, T.; Reinhardt, J.; Flörke, M.; Van Griensven, A.; Hattermann, F.; Huang, S.; Koch, H.; Pechlivanidis, I.G.; Plötner, S.; Seidou, O.; et al. Evaluation of sources of uncertainty in projected hydrological changes under climate change in 12 large-scale river basins. Clim. Chang. 2017, 141, 419–433. [Google Scholar] [CrossRef]
  16. Bhaskaran, B.; Ramachandran, A.; Jones, R.; Moufouma-Okia, W. Regional climate model applications on sub-regional scales over the Indian monsoon region: The role of domain size on downscaling uncertainty. J. Geophys. Res. Atmos. 2012, 117, 117. [Google Scholar] [CrossRef]
  17. Zeng, F.; Ma, M.; Di, D.-R.; Shi, W.-Y. Separating the Impacts of Climate Change and Human Activities on Runoff: A Review of Method and Application. Water 2020, 12, 2201. [Google Scholar] [CrossRef]
  18. Pachauri, R.K.; Allen, M.R.; Barros, V.R.; Broome, J.; Cramer, W.; Christ, R.; Church, J.A.; Clarke, L.; Dahe, Q.; Dasgupta, P. Contribution of Working Groups I, II and III to the fifth assessment report of the Intergovernmental Panel on Climate Change. In Climate Change 2014: Synthesis Report; IPCC: Geneva, Switzerland, 2014; ISBN 9291691437. [Google Scholar]
  19. Yang, T.; Wang, C.; Chen, Y.; Chen, X.; Yu, Z. Climate change and water storage variability over an arid endorheic region. J. Hydrol. 2015, 529, 330–339. [Google Scholar] [CrossRef]
  20. Zhou, J.; Wang, L.; Zhang, Y.; Guo, Y.; Li, X.; Liu, W. Exploring the water storage changes in the largest lake (Selin Co) over the Tibetan Plateau during 2003–2012 from a basin-wide hydrological modeling. Water Resour. Res. 2015, 51, 8060–8086. [Google Scholar] [CrossRef] [Green Version]
  21. Mojid, M.; Rannu, R.P.; Karim, N.N. Climate change impacts on reference crop evapotranspiration in North-West hydrological region of Bangladesh. Int. J. Clim. 2015, 35, 4041–4046. [Google Scholar] [CrossRef]
  22. Hess, T. Trends in reference evapo-transpiration in the North East Arid Zone of Nigeria, 1961–1991. J. Arid. Environ. 1998, 38, 99–115. [Google Scholar] [CrossRef]
  23. Hidalgo, H.G.; Cayan, D.R.; Dettinger, M.D. Sources of Variability of Evapotranspiration in California. J. Hydrometeorol. 2005, 6, 3–19. [Google Scholar] [CrossRef] [Green Version]
  24. Xu, C.-Y.; Gong, L.; Jiang, T.; Chen, D. Decreasing reference evapotranspiration in a warming climate—A case of Changjiang (Yangtze) River catchment during 1970–2000. Adv. Atmos. Sci. 2006, 23, 513–520. [Google Scholar] [CrossRef]
  25. Rolim, G.D.S.; Aparecido, L.E. Camargo, Köppen and Thornthwaite climate classification systems in defining climatical regions of the state of São Paulo, Brazil. Int. J. Clim. 2016, 36, 636–643. [Google Scholar] [CrossRef] [Green Version]
  26. Manabe, S.; Wetherald, R.T.; Milly, P.C.D.; Delworth, T.L.; Stouffer, R.J. Century-Scale Change in Water Availability: CO2-Quadrupling Experiment. Clim. Chang. 2004, 64, 59–76. [Google Scholar] [CrossRef]
  27. Zhang, Y.; Peña-Arancibia, J.L.; McVicar, T.R.; Chiew, F.H.S.; Vaze, J.; Liu, C.; Lu, X.; Zheng, H.; Wang, Y.-P.; Liu, Y.Y.; et al. Multi-decadal trends in global terrestrial evapotranspiration and its components. Sci. Rep. 2016, 6, 19124. [Google Scholar] [CrossRef] [PubMed] [Green Version]
  28. Yunusa, I.; Walker, R.; Lu, P. Evapotranspiration components from energy balance, sapflow and microlysimetry techniques for an irrigated vineyard in inland Australia. Agric. For. Meteorol. 2004, 127, 93–107. [Google Scholar] [CrossRef]
  29. McCabe, M.F.; Ershadi, A.; Jimenez, C.; Miralles, D.G.; Michel, D.; Wood, E.F. The GEWEX LandFlux project: Evaluation of model evaporation using tower-based and globally gridded forcing data. Geosci. Model Dev. 2016, 9, 283–305. [Google Scholar] [CrossRef] [Green Version]
  30. Tigkas, D.; Vangelis, H.; Tsakiris, G. Implementing Crop Evapotranspiration in RDI for Farm-Level Drought Evaluation and Adaptation under Climate Change Conditions. Water Resour. Manag. 2020, 1–15. [Google Scholar] [CrossRef]
  31. Kume, T.; Tanaka, N.; Kuraji, K.; Komatsu, H.; Yoshifuji, N.; Saitoh, T.M.; Suzuki, M.; Kumagai, T. Ten-year evapotranspiration estimates in a Bornean tropical rainforest. Agric. For. Meteorol. 2011, 151, 1183–1192. [Google Scholar] [CrossRef]
  32. Vernimmen, R.; Bruijnzeel, L.; Romdoni, A.; Proctor, J. Rainfall interception in three contrasting lowland rain forest types in Central Kalimantan, Indonesia. J. Hydrol. 2007, 340, 217–232. [Google Scholar] [CrossRef]
  33. Montazar, A.; Krueger, R.; Corwin, D.L.; Pourreza, A.; Little, C.; Rios, S.; Snyder, R.L. Determination of Actual Evapotranspiration and Crop Coefficients of California Date Palms Using the Residual of Energy Balance Approach. Water 2020, 12, 2253. [Google Scholar] [CrossRef]
  34. Allen, R.; Pruitt, W.O.; Wright, J.L.; Howell, T.A.; Ventura, F.; Snyder, R.; Itenfisu, D.; Steduto, P.; Berengena, J.; Yrisarry, J.B.; et al. A recommendation on standardized surface resistance for hourly calculation of reference ETo by the FAO56 Penman-Monteith method. Agric. Water Manag. 2006, 81, 1–22. [Google Scholar] [CrossRef]
  35. Payero, J.O.; Neale, C.M.U.; Wright, J.L.; Allen, R.G. Guidelines for validating Bowen ratio data. Trans. ASABE 2003, 46, 1051. [Google Scholar] [CrossRef]
  36. Farahani, H.J.; Howell, T.A.; Shuttleworth, W.J.; Bausch, W.C. Evapotranspiration: Progress in Measurement and Modeling in Agriculture. Trans. ASABE 2007, 50, 1627–1638. [Google Scholar] [CrossRef]
  37. Allen, R.G.; Pereira, L.S.; Howell, T.A.; Jensen, M.E. Evapotranspiration information reporting: I. Factors governing measurement accuracy. Agric. Water Manag. 2011, 98, 899–920. [Google Scholar] [CrossRef] [Green Version]
  38. Marino, G.; Zaccaria, D.; Snyder, R.L.; Lagos, O.; Lampinen, B.; Ferguson, L.; Grattan, S.R.; Little, C.; Shapiro, K.; Maskey, M.L.; et al. Actual Evapotranspiration and Tree Performance of Mature Micro-Irrigated Pistachio Orchards Grown on Saline-Sodic Soils in the San Joaquin Valley of California. Agric. 2019, 9, 76. [Google Scholar] [CrossRef] [Green Version]
  39. Bhantana, P.; Lazarovitch, N. Evapotranspiration, crop coefficient and growth of two young pomegranate (Punica granatum L.) varieties under salt stress. Agric. Water Manag. 2010, 97, 715–722. [Google Scholar] [CrossRef]
  40. Eurostat. Available online: https://ec.europa.eu/eurostat/web/gisco/geodata/reference-data/administrative-units-statistical-units/countries (accessed on 6 September 2020).
  41. European Environment Agency (EEA). Available online: https://www.eea.europa.eu/data-and-maps (accessed on 6 September 2020).
  42. Posea, G. Romanian Plains—Banato-Crişana Plain; Part IV, Banat Plain; Bucharest University Typography: Bucharest, Romania, 1992; pp. 32–67. [Google Scholar]
  43. Hammer, Ø. Manual Reference PAleontological Statistics Version 4.03. Available online: https://www.nhm.uio.no/english/research/infrastructure/past/downloads/past4manual.pdf (accessed on 1 September 2020).
  44. Niemeyer, S. New Drought Indexes. Options Mediterranean. Série A Séminaires Méditerranéens 2008, 80, 267–274. [Google Scholar]
  45. Lloyd-Hughes, B. The impracticality of a universal drought definition. Theor. Appl. Clim. 2014, 117, 607–611. [Google Scholar] [CrossRef] [Green Version]
  46. Aguilos, M.; Stahl, C.; Burban, B.; Hérault, B.; Courtois, E.; Coste, S.; Wagner, F.; Ziegler, C.; Takagi, K.; Bonal, D. Interannual and Seasonal Variations in Ecosystem Transpiration and Water Use Efficiency in a Tropical Rainforest. Forest 2019, 10, 14. [Google Scholar] [CrossRef] [Green Version]
  47. Boese, S.; Jung, M.; Carvalhais, N.; Reichstein, M. The importance of radiation for semiempirical water-use efficiency models. Biogeosciences 2017, 14, 3015–3026. [Google Scholar] [CrossRef] [Green Version]
  48. González, J.; Valdés, J.B. New drought frequency index: Definition and comparative performance analysis. Water Resour. Res. 2006, 42. [Google Scholar] [CrossRef]
  49. Tsakiris, G.; Pangalou, D.; Vangelis, H. Regional Drought Assessment Based on the Reconnaissance Drought Index (RDI). Water Resour. Manag. 2007, 21, 821–833. [Google Scholar] [CrossRef]
  50. Vicente-Serrano, S.M.; Beguería, S.; López-Moreno, J.I. A Multiscalar Drought Index Sensitive to Global Warming: The Standardized Precipitation Evapotranspiration Index. J. Clim. 2010, 23, 1696–1718. [Google Scholar] [CrossRef] [Green Version]
  51. Visitiu, O.-P.; Calcium, I.C.; Simota, C.C. Drought Intensity on Arable Land in Romania—Processes and Tendencies; The works of the Dimitrie Cantemir Geographic Seminary; Alexandru Ioan Cuza University Publishing House: Iași, Romania, 2016; Volume 42, pp. 67–80. [Google Scholar] [CrossRef]
  52. FAO Unesco. World of Desertification. Available online: http://www.fao.org/3/T0115E06.htm (accessed on 4 September 2020).
Figure 1. Study area, Banat Field [40,41].
Agriculture 10 00437 g001
Figure 2. Evolution of the annual temperature recorded in the Banat Plain, at the Regional Meteorological Center Banat-Crisana during the period 1897–2019.
Agriculture 10 00437 g002
Figure 3. Temperature evolution during vegetation period recorded in the Banat Plain, at the Regional Meteorological Center Banat-Crisana during the period 1897–2019.
Agriculture 10 00437 g003
Figure 4. Temperature evolution during the cold period of the year recorded in the Banat Plain, at the Regional Meteorological Center Banat-Crisana during the period 1897–2019.
Agriculture 10 00437 g004
Figure 5. The evolution of the temperature of 1897–2019 represented over periods of 10 years.
Agriculture 10 00437 g005
Figure 6. Temperature evolution of 1897-2019 represented over periods of 50 years.
Agriculture 10 00437 g006
Figure 7. Evolution of the annual rainfall fallen in the Banat Plain, recorded at the Regional Meteorological Center Banat-Crisana over a period of 146 years (1873–2019).
Agriculture 10 00437 g007
Figure 8. The evolution of rainfall during the warm period of the year in the Banat Plain over a period of 146 years (1873–2019).
Agriculture 10 00437 g008
Figure 9. The amount of precipitation fallen in the cold period of the year in the Banat Plain over a period of 146 years (1873–2019).
Agriculture 10 00437 g009
Figure 10. Dynamics of rainfall in the Banat Plain represented over periods of 10 years (1873–2019).
Agriculture 10 00437 g010
Figure 11. Evolution of rainfall in the Banat Plain represented over periods of 50 years (1873–2019).
Agriculture 10 00437 g011
Figure 12. Annual potential evapotranspiration calculated for the Banat Plain between 1897 and 2019.
Agriculture 10 00437 g012
Figure 13. Potential evapotranspiration in the hot season calculated for the Banat Plain between 1897–2019.
Agriculture 10 00437 g013
Figure 14. High–Low chart by difference area between cumulative values during the warm period of the year of precipitation (P IV-IX) and evapotranspiration (ETP IV-IX), expressed in mm, recorded annually at the Regional Meteorological Center Banat-Crisana, Romania, 1898–2019.
Agriculture 10 00437 g014
Figure 15. High–Low chart by difference area between the cumulative values throughout the year, of precipitation (P year) and evapotranspiration (ETP year), expressed in mm, registered annually at the Regional Meteorological Center Banat-Crisana, Romania, 1898–2019.
Agriculture 10 00437 g015
Figure 16. Positioning of evapotranspiration compared to temperature, according to the values recorded annually at the Regional Meteorological Center Banat-Crisana, Romania, 1990–2019.
Agriculture 10 00437 g016
Figure 17. High–Low chart by difference area between cumulative values during the cold period of the year, October (X) to March (III) of precipitation (P X-III) and evapotranspiration (ETP X-III), expressed in mm, recorded annually at the Regional Meteorological Center Banat-Crisana, Romania, 1898–2019.
Agriculture 10 00437 g017
Figure 18. The evolution of the ratio of the values of the accumulated precipitations in the warm period of the year, between April (IV) and September (IX), with the evapotranspiration, registered annually in Timișoara, Romania, P/ETP (IV-IX), 1898–2019.
Agriculture 10 00437 g018
Figure 19. Evolution of the ratio of precipitation values accumulated during the year, with evapotranspiration, registered annually in Timișoara, Romania (P/ETP year), 1898–2019.
Agriculture 10 00437 g019
Figure 20. Scenarios of evolution of the ratio of the values of the accumulated precipitations in the warm period of the year, with the evapotranspiration, registered annually in Timișoara, Romania, P/ETP (IV–IX), 1990–2019.
Agriculture 10 00437 g020
Table 1. Statistical indicators regarding the amount of precipitation (P IV…IX) and evapotranspiration (ETP IV…IX), cumulated in April (IV) to September (IX), respectively, relating to the amount of precipitation (P year) and evapotranspiration (ETP year) accumulated at full year level, recorded annually at the Regional Meteorological Center Banat-Crisana, Romania (expressed in mm).
Statistic SeriesTime Period (Years)MeanLower Bound of 95% Confidence Interval for MeanUpper Bound of 95% Confidence Interval for MeanMinimumMaximum
ETP (IV… IX)1898–1950617.7607.8661627.6998535.70696.60
1951–1989602.6591.6307613.5847532.00691.80
1990–2019645.9631.3340660.5727578.00728.30
1898–2019619.9612.8386627.0942532.00728.30
P (IV… IX)1898–1950350.5323.7589377.3773142.70565.00
1951–1989342.3317.4843367.1464212.20544.60
1990–2019365.4327.3502403.6098164.30639.50
1898–2019351.6335.2176368.0824142.70639.50
ETP (year)1898–1950712.5700.7053724.3330619.70801.40
1951–1989693.9681.7718706.1923617.40770.40
1990–2019744.2727.1872761.2595671.20840.20
1898–2019714.4706.2282722.7442617.40840.20
P (year)1898–1950618.8587.0006650.7484430.00935.00
1951–1989604.0568.3505639.8239468.00963.00
1990–2019603.8559.3991648.2542436.80906.70
1898–2019610.0589.5698630.4526430.00963.00
Table 2. Multiple comparisons using Tukey Post Hoc between the average values of the analyzed time periods for cumulative evapotranspiration values (ETP IV… IX) from April (IV) to September (IX), respectively, throughout the year (ETP year), registered annually at the Regional Meteorological Center Banat-Crisana, Romania (expressed in mm).
Statistics Series(I) Time Period(J) Time PeriodMean Difference (I–J)p (Sig.)
ETP (IV… IX)1898–19501951–198915.175290.120
1990–2019−28.17035 *0.003
1951–19891898–1950−15.175290.120
1990–2019−43.34564 *0.000
1990–20191898–195028.17035 *0.003
1951–198943.34564 *0.000
ETP (year)1898–19501951–198918.537100.096
1990–2019−31.70418 *0.003
1951–19891898–1950−18.537100.096
1990–2019−50.24128 *0.000
1990–20191898–195031.70418 *0.003
1951–198950.24128 *0.000
* The mean difference is significant at the 0.05 level (p (Sig.) < 0.05). Source: Calculations based on initial statistical data provided by the Regional Meteorological Center Banat-Crisana, Romania.
Table 3. Frequency of certain values regarding the ratio of accumulated precipitation in the warm period, between April and September (P/ETP IV_IX), respectively, throughout the year (P/ETP year), with evapotranspiration, recorded annually at the Regional Meteorological Center Banat-Crisana, Romania, 1898–2019.
Statistic SeriesFrequency
(Number of Years)
PercentageCumulative Percentage
P/ETP (IV_IX)
0.2010.90.9
0.503126.750.0
1.0021.7100.0
Total116100.0
P/ETP (year)
0.60119.59.5
1.001815.586.2
1.5010.9100.0
Total116100.0

