Article

Evaluating Multiple Allelic Combination to Determine Tiller Angle Variation in Rice

1
Plant Genomics and Breeding Institute, Seoul National University, Seoul 08826, Korea
2
Department of Plant Science, Research Institute for Agriculture and Life Sciences, Seoul National University, Seoul 08826, Korea
*
Author to whom correspondence should be addressed.
These authors contributed equally to this work.
Agriculture 2020, 10(10), 428; https://doi.org/10.3390/agriculture10100428
Submission received: 11 August 2020 / Revised: 21 September 2020 / Accepted: 22 September 2020 / Published: 25 September 2020
(This article belongs to the Special Issue Rice Breeding and Genetics)

Abstract

:
Tiller angle is an important influencing factor in rice plant architecture that affects planting density and yield per unit area. Molecular tools to predict tiller angle contribute to breeding programs, which aim at optimizing rice plant architecture. In this study, several single-nucleotide polymorphism (SNP) markers related to tiller angle were developed and used with a model population to define a linear regression model for the prediction of tiller angle in rice. The resulting linear regression model, consisting of eight SNP markers as independent variables, was assessed using an independent test population. Overall, the regression model achieved an adjusted R2 of 0.51 and exhibited consistent predictive accuracy with an R2 of 0.61. Three of the eight independent variables, namely, PIN2-1, LIC1-1, and TAC1, contributed substantially to the linear regression model. These three major effect markers were also major determinants of tiller angle in the independent test population. Allelic combinations of the three major effect markers modulated tiller angle in the range of 5.6–19°. The DNA markers and linear regression model developed in this study will facilitate rice breeding programs for improving plant architecture.

1. Introduction

Tiller angle is a major component of rice plant architecture and influences planting density, efficiency of photosynthesis, and ventilation in rice population, thus influencing the yield per unit area [1]. The extremely narrow rice plants capture the lights less efficiently and are also more susceptible to diseases as a result of higher humidity levels within the canopy. On the other hand, plants with narrow tiller angle can be planted at higher densities than plants with wider tiller angle, thus occupying less space and potentially increasing grain yield per unit area. Rice plants with extremely wide tiller angle are less susceptible to disease as a result of lower humidity within the canopy. While, at the population level, these plants have lower light interception efficiencies as a consequence of mutual shading, grain yield per unit area could be reduced [2,3,4]. Therefore, rice tiller angle is an important factor in maximizing grain yield.
Several causes hinder identifying genetic factor for optimal tiller angle. Rice tiller angle is a complex trait that could be influenced by environmental as well as genetic factors [1,5]. Furthermore, tiller angle varies with plant growth stage, and it is thus difficult to measure it to ensure accuracy and consistency of assessment [3,6,7]. In recent decades, many studies have been conducted to dissect the loci underlying tiller angle in rice, using various strategies such as transcriptome analysis [8], bi-parental mapping [3], genome wide association study (GWAS) [1,9], and genetic mapping of mutants [10,11,12,13,14,15,16]. Attempt has also been made to utilize the findings of these studies in rice molecular breeding programs for improving plant architecture [17]. However, these programs used only a single quantitative trait loci (QTL)/gene, constraining the potential modulation of tiller angle to a limited range. Simultaneous use of multiple QTLs/genes, for example, by combining a major QTL/gene with several minor QTLs/genes that individually explain relatively small proportions of phenotypic variation, may allow tiller angle to be modulated more precisely.
Here, we investigated phenotypic variation of tiller angle and sequence variants in tiller-angle-related QTLs/genes in diverse accessions. A multiple linear regression model to predict tiller angle was developed and verified using phenotype and genotype data. Furthermore, based on their relative importance in the linear regression model, major single nucleotide polymorphism (SNP) markers with large contributions to tiller angle were identified. The regression model and the major SNP markers developed in this study could be employed in breeding programs aimed at modulation of rice plant architecture.

2. Materials and Methods

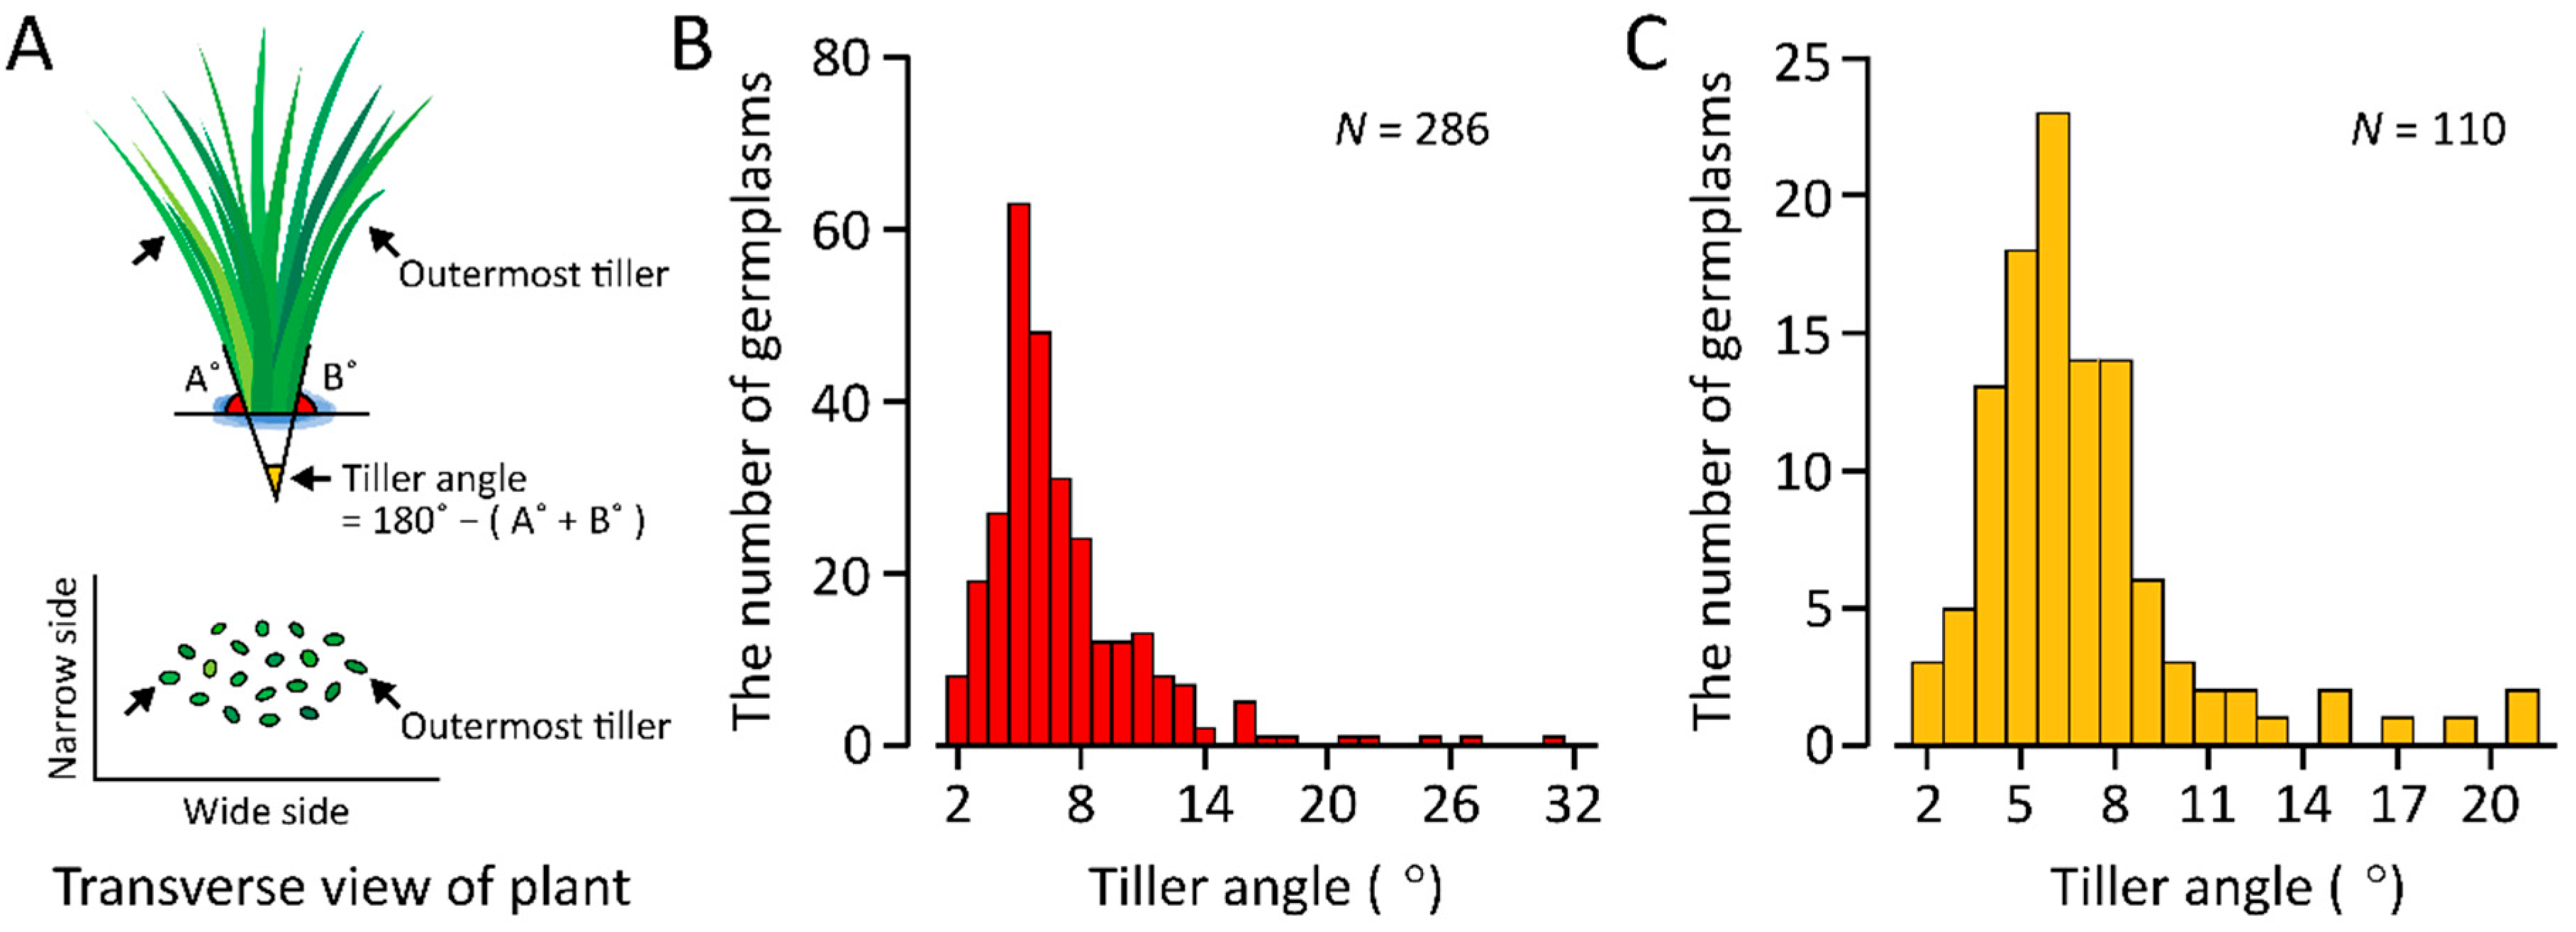
2.1. Plant Materials and Measurement of Tiller Angle

In total, 396 rice accessions were used in this study. Three-hundred-and-twenty-five accessions were maintained in Agricultural genetic resource center, Seoul National University (SNU), South Korea. Seventy-one accessions were provided from National Agrobiodiversity Center (NAC), Rural Development Administration (RDA), South Korea (Table S1). The accessions were divided into two populations: one population (N = 286) was used to develop the linear regression model, and the second population (N = 110) was used to test the model. Individual germplasms were assigned to the two populations by simple random sampling in a ratio of 7:3 (Table S1). All plants were grown in experimental field, Seoul National University, Suwon, South Korea. Thirty-day-old Seedlings after sowing were transplanted into the paddy field with the following condition: a plant per hill, 25 plants per row, a density of 15 cm × 30 cm, and three rows per accession. Tiller angle was measured from the mid-row without boarder rows and at first panicle emergence in 5–10 individual plants per accession. Tiller angle was determined by measuring the angles from the two outermost tillers to the ground, and subtracting the sum of these angles from 180° (Figure 1A) [18].

2.2. Development of Single-Nucleotide Polymorphism (SNP) Markers and PCR Condition

SNP markers were developed to discriminate alleles of several tiller angle-related QTLs/genes that were identified in previous studies [1,3,10,11,12,13,14,15,16,19]. For each target QTL/gene, SNPs causing an amino acid change or a splicing error were selected, with the exception of the SNP for AGPL3, which was in the 3’ UTR. In addition, lead SNPs that showed the most significant associations with tiller angle in a GWAS [1] were also selected for the development of SNP markers (Table S2). The positions and predictive effects of target SNPs were determined using the RiceVarMap database v1.0 [20]. Allele-specific markers were developed using BatchPrimer3 [21], and cleaved amplified polymorphic sequence (CAPS) and derived cleaved amplified polymorphic sequence (dCAPS) markers were designed using dCAPS Finder 2.0 [22]. PCR amplification was performed in 20 µL reaction mixtures containing 100 ng template DNA, 0.5 U Prime Taq polymerase (GeNet Bio, Nonsan, Korea), 1 × PCR buffer, 0.5 µM of each primer, and 0.5 mM dNTPs. Dimethylsulfoxide (DMSO) was added at 0–10% (v/v) to improve target amplification. The PCR thermal cycle was 94 °C for 5 min; 28 cycles of 94 °C for 30 s, optimum primer annealing temperature for 30 s, and 72 °C for 30 s; and final extension at 72 °C for 10 min. Primer sequences, PCR details, and restriction enzymes for each marker are detailed in Table S2.

2.3. Development of Linear Regression Equation Model and Statistical Analysis

Two different alleles discriminated by SNP markers were converted into binary values, 1 and 0 (Table S1). Linear regression equations were estimated using commonly occurring SNPs, excluding those with minor allele frequency (MAF) <0.05 to reduce false positives. Tiller angle data and binary data in the model population were used as dependent and independent variables for linear regression analysis, respectively. The best linear regression model was selected from all possible combinations of the independent variables using the best subsets approach based on adjusted R2. Relative importance of independent variables for linear regression model was calculated using lmg method within the ‘relaimpo’ package in R [23]. All statistical analysis was performed using R (version 3.5.3). Comparison between predicted tiller angle and observed tiller angle were performed using predict function of ‘stats’ package [24]. Alleles for narrow tiller angle (N-alleles) or wide tiller angle (W-alleles) were discriminated based on estimates in the multiple linear regression model (Table 1).

3. Results

3.1. Variation of Tiller Angle in Rice Germplasms

Tiller angle was assessed in a collection of 396 rice germplasms. The germplasm collection was randomly divided into two populations using a 7:3 ratio. The first population (N = 286) was the model population used for multiple linear regression modeling. The second population (N = 110) was used to test the model. Tiller angle was determined by measuring the angles from the two outermost tillers to the ground, and subtracting the sum of these angles from 180° (Figure 1A). Large variations in tiller angle were observed among germplasms, with angle ranges of 1.7–31.3° and 2–21° in the model and test populations, respectively. Although phenotypic variation in tiller angle was more pronounced in the model population, similar tiller angle median values (approximately 6.1°) and distributions were observed in the two populations. In both populations, tiller angle distribution was skewed towards the narrow tiller angle (Figure 1B,C).

3.2. Development of SNP Markers Associated with Tiller Angle

Attempts were made to develop SNP markers discriminating alleles of 24 tiller angle-related QTLs/genes: D3, D10, D17 [14], LA1 [10], LPA1 [13], ONAC106 [16], OsAGPL1, OsAGPL3 [15], OsLIC1 [11], OsPIN1 [19], OsPIN2 [12], TAC1 [3], D2, TAC3, qTA3, qTA4, qTA7a-1, qTA7a-2, qTA7b-1, qTA7b-2, qTA7h, qTA8a-1, qTA8a-2, and qTA8b [1]. Five CAPS, two dCAPS, and nine allele-specific markers showed efficient amplification, and the band pattern clearly discriminated between alleles without non-specific amplicons. Consequently, 16 SNP markers for nine genes (D3, D17, ONAC106, LA1, OsAGPL3, OsPIN2, OsLIC1, TAC1, and TAC3) and three QTLs (qTA7b-1, qTA8a-1, and qTA8a-2) were successfully developed and validated (Table S2). SNP markers were designed against polymorphic sites that caused amino acid changes (D3-1, D3-2, D17-1, D17-2, ONAC106, PIN2, LA1-1, LA1-2, LIC1-1, and LIC1-2) or a splicing error (TAC1), or against nucleotide variants which were significantly associated with tiller angle (qTA7b-1, qTA8a-1, qTA8a-2, and TAC3). The AGPL3 SNP marker was in the 3′ UTR of the AGPL3 gene (Table S2).

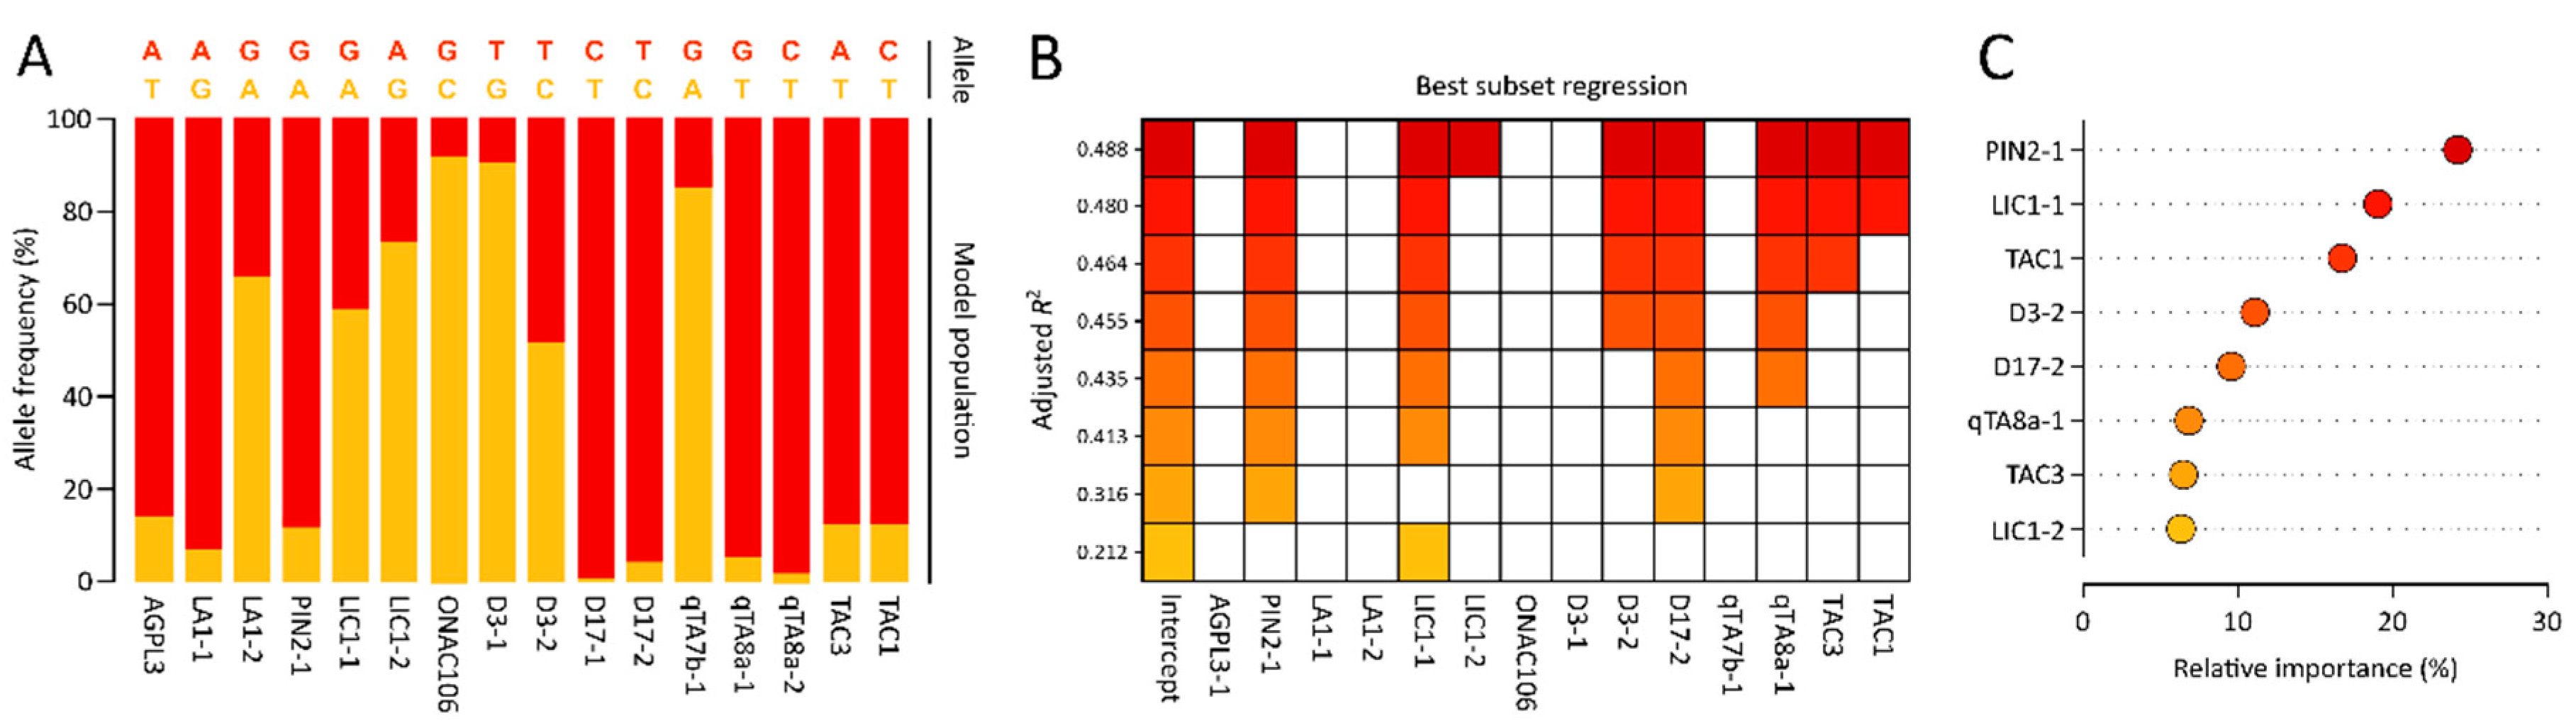
3.3. Development of a Multiple Linear Regression Model for Tiller Angle Using a Model Rice Population

SNP markers were used to assess allele frequencies in the model population (N = 286). Only SNP markers with MAF >0.05 were used for multiple linear regression modeling to reduce the risk of false positive errors. The MAFs of the D17-1 and qTA8a-2 markers were <0.05, thus these two markers were not used for the analysis. D17-1-T and qTA8a-2-T, the minor alleles, were found at frequencies of 2.6% and 3.5%, respectively (Figure 2A). To develop the multiple linear regression model for predicting tiller angle, genotype data were converted to binary values and used as independent variables, and tiller angle data values were used as dependent variables. Eight of the 14 markers (PIN2-1, LIC1-1, LIC1-2, D3-2, D17-2, qTA8a-1, TAC3, and TAC1) were selected as significant independent variables in the best linear regression model using the best subsets approach based on adjusted R2 (Figure 2B). The resulting model, which was estimated by the above-mentioned markers, was able to significantly predict tiller angle with an adjusted R2 value of 0.51 (Table 1). The value of relative importance was used to evaluate large contributing variables for the regression model, and PIN2-1 (24.2%), LIC1-1 (19%), and TAC1 (16.7%) markers exhibited the highest contributions (Figure 2C).

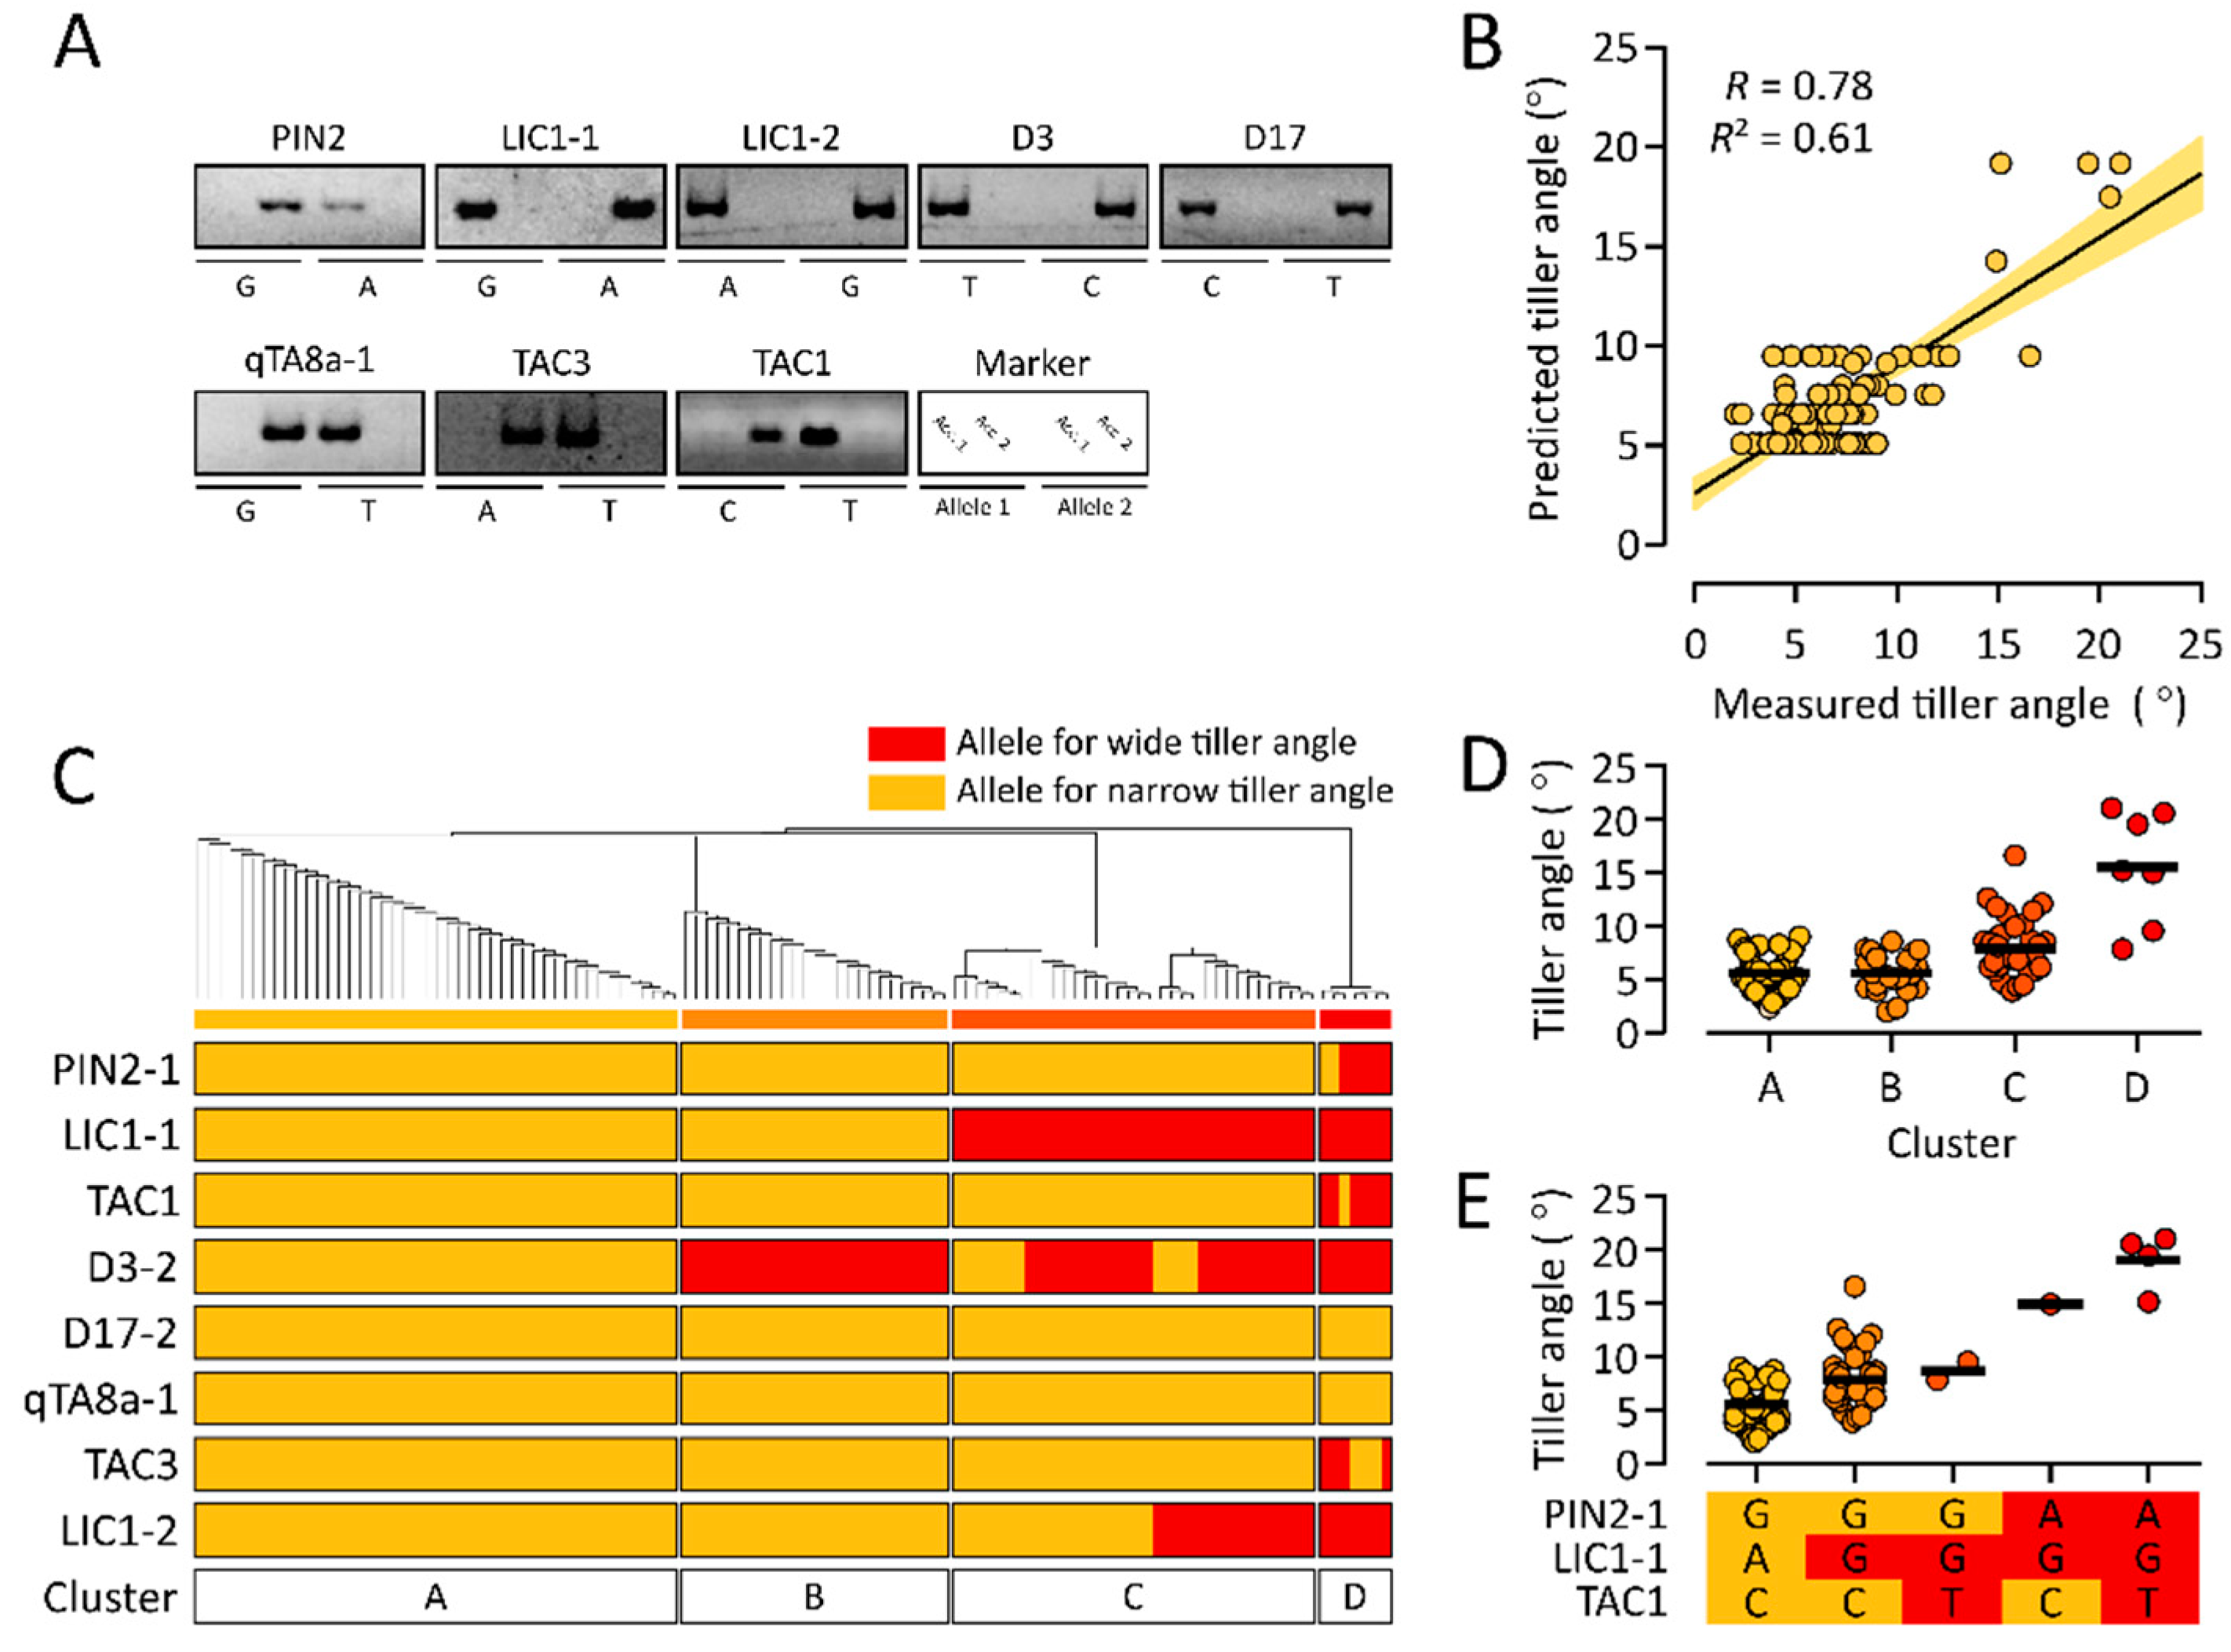
3.4. Test of a Multiple Linear Regression Model for Rice Tiller Angle Using a Test Population

Genotype data and tiller angle data from an independent test population (N = 110) were used to verify the prediction accuracy of the multiple linear regression model developed using a model population (N = 286). Genotype data was obtained using eight significant markers set (PIN2-1, LIC1-1, LIC1-2, D3-2, D17-2, qTA8a-1, TAC3, and TAC1; Figure 3A). Predicted tiller angle values were calculated by applying the model regression equation to genotype data. Correlation coefficient (R) and R2 were determined for the multiple linear regression model by comparing predicted and measured tiller angle values in the test population. The correlation coefficient and coefficient of determination for the regression model were 0.78 and 0.61, respectively, indicating that the model was consistently predictive for the tiller angle in the independent population (Figure 3B).

3.5. Allelic Combinations of Rice Tiller Angle-Related Markers in a Test Population

Eleven allelic combinations were identified in the rice test population from the eight SNP markers, from which their contribution for best linear regression model was verified. The D17-2-T and qTA8a-G alleles, for wide tiller angle, were fixed in all accessions (Figure 3C). Allelic combinations were grouped into four clusters using unweighted pair group method with arithmetic mean (UPGMA) clustering. Cluster A consisted of only N-alleles causing narrow tiller angle. Cluster B had the same allelic composition as cluster A, with the exception that cluster B had the W-allele causing wide tiller angle at marker D3-2 (Figure 3C). The W-alleles of LIC1-1, D3-2, and LIC1-2 were found in cluster C, and the average tiller angle in cluster C was wider for 2.3° than the average tiller angle in clusters A or B. The W-alleles of PIN2-1, TAC1, and TAC3 were only found in cluster D, and cluster C and D were differentiated by these three alleles. Cluster D exhibited the widest average tiller angle of 15.5° among the other clusters (Figure 3C,D). Five allelic combinations were identified for the three major contributors to the multiple linear regression model, PIN2-1, LIC1-1, and TAC1 (Figure 3E). As expected, these three major markers were consistently associated with large effects on tiller angle in the test population and the widest tiller angle was observed when all three markers harbored the W-allele (Figure 3E).

4. Discussion

Tiller angle, an important factor determining rice plant architecture, affects plant density, thus influencing the yield per unit area [1]. An optimum tiller angle is required to develop ideal plant architecture to enhance rice yield potential. Several studies have been conducted to identify genetic variants associated with tiller angle [1,9,25] and apply them in rice molecular breeding programs to improve plant architecture [17]. Use of a single QTL/gene in a breeding program has the potential to alter tiller angle only within the limited range governed by that QTL/gene. Simultaneous use of multiple QTLs/genes may allow tiller angle to be controlled with various angle ranges and greater precision. Here, we developed several DNA markers related to tiller angle in rice, and used these to develop a multiple linear regression model for predicting tiller angle. The resulting regression model and markers will provide useful molecular tools for breeding programs to improve rice plant architecture.
In total, 16 SNP markers for 12 QTLs/genes related to tiller angle were developed (Table S1). Eight of these markers, PIN2-1, LIC1-1, LIC1-2, D3-2, D17-2, qTA8a-1, TAC3, and TAC1, were selected as significant independent variables in a linear regression model specification to predict tiller angle (Figure 2B). Three of these markers, PIN2-1, LIC1, and TAC1, contributed substantially to the regression equation (Figure 2C). OsPIN2 encodes an auxin efflux transporter that affects tiller angle via control of indole acetic acid distribution [12]. OsLIC1 encodes a transcriptional activator with CCCH zinc finger protein functions. OsLIC1 contributes to modulation of plant architecture via negative regulation of the brassinosteroid response [11]. TAC1 controls asymmetrical growth of the tiller base and consequently affects tiller angle [3]. The PIN2-1 and LIC1 markers discriminate alleles of non-synonymous SNPs in the OsPIN2 and OsLIC1 genes, respectively. The TAC1 marker targets a SNP that causes a splicing error in the TAC1 gene. The PIN2-1, LIC1, and TAC1 markers each contributed >15% of relative importance in the multiple regression model (Figure 2C), indicating that the nucleotide variants targeted by these three markers were major determinants for tiller angle in rice.
Computational modeling of planting number per unit area and tiller angle suggested that alteration of approximately 2–3° in tiller angle allowed about 15% change in planting density [26], indicating that small changes in the tiller angle in individual plants could influence planting density at the population level. Five allelic combinations for the three major effect markers (PIN2-1, LIC1, and TAC1) were identified in the test population (Figure 3E). As expected, the combination of the three N-alleles produced the narrowest tiller angle, whereas the combination of the three W-alleles produced the widest tiller angle. Overall, the five allelic combinations of PIN2-1, LIC1, and TAC1 produced tiller angle in the 5.6–9° range (Figure 3E). This suggests that marker-assisted selection to produce a desired tiller angle is possible by using these three major effect markers. Furthermore, the tiller angle alteration that is achievable with these three markers is sufficient to influence planting density in rice.
In previous reports, five lead SNPs that were significantly associated with tiller angle explained 21.3–32% of phenotypic variance in 529 rice accessions [1]. Furthermore, 24–24.6% of phenotypic variance was explained by all significant SNPs for tiller angle in 469 indica accessions [9]. These results indicate that tiller angle is a complex trait that can be influenced by a range of factors, including genetic background and environment. In the present study, genotype and phenotype data from a model population were used to produce a multiple linear regression model with 0.51 of adjusted R2 (Table 1). The regression model was tested using an independent test population and exhibited a consistently meaningful coefficient of determination of 0.61 (Figure 3B). These results indicate that approximately 50% of the phenotypic variance in tiller angle could be explained by eight SNP markers used in the multiple linear regression model, and the estimated model was able to accurately predict tiller angle in rice.

5. Conclusions

In this study, eight useful markers related to tiller angle (PIN2-1, LIC1-1, LIC1-2, D3-2, D17-2, qTA8a-1, TAC3, and TAC1) were developed. The regression model, which was developed using markers, showed an adjusted R2 of 0.51 and exhibited predictive accuracy with an R2 of 0.61. In particular, three markers (PIN2-1, LIC1-1, and TAC1) were major determinants of tiller angle. Allelic combinations of the three major effect markers regulate tiller angle in the range of 5.6–19°. The SNP markers and linear regression model developed in this study could be used for Marker-assisted breeding programs to improve rice plant architecture.

Supplementary Materials

The following are available online at https://www.mdpi.com/2077-0472/10/10/428/s1, Table S1: Tiller angle and genotype data of all accessions in model and test population; Table S2: The information of SNP markers developed in this study.

Author Contributions

S.J. and Y.S.K. designed the experiment and prepared the manuscript. Y.S.K. conducted the field experiments and collected phenotype data. S.J. and Y.K.L. prepared genotype data. S.J. performed the statistical analysis. H.-J.K. participated in the supervision of the overall work and contributed to the finalization of the manuscript. All authors have read and agreed to the published version of the manuscript.

Funding

This study was supported by a grant from the Next-Generation BioGreen 21 Program (no. PJ013165) of the Rural Development Administration (RDA), South Korea.

Conflicts of Interest

The authors declare no conflict of interest.

References

  1. Dong, H.; Zhao, H.; Xie, W.; Han, Z.; Li, G.; Yao, W.; Bai, X.; Hu, Y.; Guo, Z.; Lu, K.; et al. A Novel Tiller Angle Gene, TAC3, together with TAC1 and D2 Largely Determine the Natural Variation of Tiller Angle in Rice Cultivars. PLoS Genet. 2016, 12, e1006412. [Google Scholar] [CrossRef] [PubMed] [Green Version]
  2. Xu, Y.; McCouch, S.R.; Shen, Z. Transgressive Segregation of Tiller Angle in Rice Caused by Complementary Gene Action. Crop Sci. 1998, 38. [Google Scholar] [CrossRef]
  3. Yu, B.; Lin, Z.; Li, H.; Li, X.; Li, J.; Wang, Y.; Zhang, X.; Zhu, Z.; Zhai, W.; Wang, X.; et al. TAC1, a major quantitative trait locus controlling tiller angle in rice. Plant J. 2007, 52, 891–898. [Google Scholar] [CrossRef] [PubMed]
  4. Zuo, S.; Zhang, Y.; Chen, Z.; Jiang, W.; Feng, M.; Pan, X. Improvement of Rice Resistance to Sheath Blight by Pyramiding QTLs Conditioning Disease Resistance and Tiller Angle. Rice Sci. 2014, 21, 318–326. [Google Scholar] [CrossRef]
  5. Dong, Y.; Lin, D.; Kamiuntent, H.; Cai, Q.; Tsuzuki, E. Molecular Genetic Mapping of QTLs for Tiller Angle in Rice (Oryza sativa L.). Jpn. J. Trop. Agric. 2004, 48, 228–234. [Google Scholar]
  6. Wu, Y.; Zhao, S.; Li, X.; Zhang, B.; Jiang, L.; Tang, Y.; Zhao, J.; Ma, X.; Cai, H.; Sun, C.; et al. Deletions linked to PROG1 gene participate in plant architecture domestication in Asian and African rice. Nat. Commun. 2018, 9, 4157. [Google Scholar] [CrossRef] [Green Version]
  7. Zhang, W.; Tan, L.; Sun, H.; Zhao, X.; Liu, F.; Cai, H.; Fu, Y.; Sun, X.; Gu, P.; Zhu, Z.; et al. Natural Variations at TIG1 Encoding a TCP Transcription Factor Contribute to Plant Architecture Domestication in Rice. Mol. Plant 2019, 12, 1075–1089. [Google Scholar] [CrossRef]
  8. Zhang, N.; Yu, H.; Yu, H.; Cai, Y.; Huang, L.; Xu, C.; Xiong, G.; Meng, X.; Wang, J.; Chen, H.; et al. A Core Regulatory Pathway Controlling Rice Tiller Angle Mediated by the LAZY1—Dependent Asymmetric Distribution of Auxin. Plant Cell 2018, 30, 1461–1475. [Google Scholar] [CrossRef] [Green Version]
  9. Lu, Q.; Zhang, M.; Niu, X.; Wang, S.; Xu, Q.; Feng, Y.; Wang, C.; Deng, H.; Yuan, X.; Yu, H.; et al. Genetic variation and association mapping for 12 agronomic traits in indica rice. BMC Genom. 2015, 16, 1067. [Google Scholar] [CrossRef] [Green Version]
  10. Li, P.; Wang, Y.; Qian, Q.; Fu, Z.; Wang, M.; Zeng, D.; Li, B.; Wang, X.; Li, J. LAZY1 controls rice shoot gravitropism through regulating polar auxin transport. Cell Res. 2007, 17, 402–410. [Google Scholar] [CrossRef] [Green Version]
  11. Wang, L.; Xu, Y.; Zhang, C.; Ma, Q.; Joo, S.-H.; Kim, S.-K.; Xu, Z.; Chong, K. OsLIC, a Novel CCCH-Type Zinc Finger Protein with Transcription Activation, Mediates Rice Architecture via Brassinosteroids Signaling. PLoS ONE 2008, 3, e3521. [Google Scholar] [CrossRef] [Green Version]
  12. Chen, Y.; Fan, X.; Song, W.; Zhang, Y.; Xu, G. Over-expression of OsPIN2 leads to increased tiller numbers, angle and shorter plant height through suppression of OsLAZY1: Auxin efflux transporter gene OsPIN2. Plant Biotechnol. J. 2012, 10, 139–149. [Google Scholar] [CrossRef] [PubMed]
  13. Wu, X.; Tang, D.; Li, M.; Wang, K.; Cheng, Z. Loose Plant Architecture1, an INDETERMINATE DOMAIN Protein Involved in Shoot Gravitropism, Regulates Plant Architecture in Rice. Plant Physiol. 2013, 161, 317–329. [Google Scholar] [CrossRef] [PubMed] [Green Version]
  14. Sang, D.; Chen, D.; Liu, G.; Liang, Y.; Huang, L.; Meng, X.; Chu, J.; Sun, X.; Dong, G.; Yuan, Y.; et al. Strigolactones regulate rice tiller angle by attenuating shoot gravitropism through inhibiting auxin biosynthesis. Proc. Natl. Acad. Sci. USA 2014, 111, 11199–11204. [Google Scholar] [CrossRef] [Green Version]
  15. Okamura, M.; Hirose, T.; Hashida, Y.; Ohsugi, R.; Aoki, N. Suppression of starch synthesis in rice stems splays tiller angle due to gravitropic insensitivity but does not affect yield. Funct. Plant. Biol. 2015, 42, 31. [Google Scholar] [CrossRef]
  16. Sakuraba, Y.; Piao, W.; Lim, J.-H.; Han, S.-H.; Kim, Y.-S.; An, G.; Paek, N.-C. Rice ONAC106 Inhibits Leaf Senescence and Increases Salt Tolerance and Tiller Angle. Plant. Cell Physiol. 2015, 56, 2325–2339. [Google Scholar] [CrossRef]
  17. Zeng, D.; Tian, Z.; Rao, Y.; Dong, G.; Yang, Y.; Huang, L.; Leng, Y.; Xu, J.; Sun, C.; Zhang, G.; et al. Rational design of high-yield and superior-quality rice. Nat. Plants 2017, 3, 1–5. [Google Scholar] [CrossRef] [PubMed]
  18. Koh, H.-J.; Won, Y.J.; Cha, K.W.; Lee, J.C.; Park, S.Z.; Heu, M.H. Inheritance of Tillering Angle in Rice. Korean J. Breed. 1997, 29, 431–435. [Google Scholar]
  19. Xu, M.; Zhu, L.; Shou, H.; Wu, P. A PIN1 Family Gene, OsPIN1, involved in Auxin-dependent Adventitious Root Emergence and Tillering in Rice. Plant Cell Physiol. 2005, 46, 1674–1681. [Google Scholar] [CrossRef] [PubMed]
  20. Zhao, H.; Yao, W.; Ouyang, Y.; Yang, W.; Wang, G.; Lian, X.; Xing, Y.; Chen, L.; Xie, W. RiceVarMap: A comprehensive database of rice genomic variations. Nucleic Acids Res. 2015, 43, D1018–D1022. [Google Scholar] [CrossRef] [PubMed]
  21. You, F.M.; Huo, N.; Gu, Y.Q.; Luo, M.-C.; Ma, Y.; Hane, D.; Lazo, G.R.; Dvorak, J.; Anderson, O.D. BatchPrimer3: A high throughput web application for PCR and sequencing primer design. BMC Bioinform. 2008, 9, 253. [Google Scholar] [CrossRef] [PubMed] [Green Version]
  22. Neff, M.M.; Turk, E.; Kalishman, M. Web-based primer design for single nucleotide polymorphism analysis. Trends Genet. 2002, 18, 613–615. [Google Scholar] [CrossRef]
  23. Groemping, U. Relative Importance for Linear Regression in R: The Package relaimpo. J. Stat. Softw. 2006, 17, 1–27. [Google Scholar] [CrossRef] [Green Version]
  24. R Core Team. R: A Language and Environment for Statistical Computing; R Foundation for Statistical Computing: Vienna, Austria, 2013. [Google Scholar]
  25. Wu, D.; Guo, Z.; Ye, J.; Feng, H.; Liu, J.; Chen, G.; Zheng, J.; Yan, D.; Yang, X.; Xiong, X.; et al. Combining high-throughput micro-CT-RGB phenotyping and genome-wide association study to dissect the genetic architecture of tiller growth in rice. J. Exp. Bot. 2018, 70, 545–561. [Google Scholar] [CrossRef] [PubMed] [Green Version]
  26. Huang, X.; Yang, S.; Gong, J.; Zhao, Q.; Feng, Q.; Zhan, Q.; Zhao, Y.; Li, W.; Cheng, B.; Xia, J.; et al. Genomic architecture of heterosis for yield traits in rice. Nature 2016, 537, 629–633. [Google Scholar] [CrossRef]
Figure 1. Phenotypic distribution of tiller angle in rice accessions. (A) Method for measuring tiller angle. (B) Tiller angle variation in model population (N = 286). (C) Tiller angle variation in test populations (N = 110).
Agriculture 10 00428 g001
Figure 2. SNP markers used for multiple linear regression to predict rice tiller angle. (A) Allele frequencies of 16 SNP markers related to rice tiller angle. The red and yellow color of bar graph are assigned to the allele types with the same color. (B) Model specification based on adjusted R2 of best subset regression. (C) Relative importance of independent variables in the multiple linear regression model. Relative importance means percent of variance explained by each independent variable in linear regression model.
Agriculture 10 00428 g002
Figure 3. Verification of the multiple linear regression model and allelic combinations in a test population. (A) Gel images of eight significant SNP markers as independent variables in multiple linear regression model. Presence or absence of band in each allele of the marker denotes the allele type of accessions. Acc.1 and Acc.2 indicate the accessions with different allele types. (B) Comparison of measured tiller angle with predicted tiller angle by the multiple linear regression model. (C) Allelic combinations for the eight significant SNP markers. Red and yellow bars represent alleles causing wide and narrow tiller angle, respectively. (D) Difference in tiller angle according to the cluster. (E) Difference in tiller angle according to the allelic combination of three major markers.
Agriculture 10 00428 g003
Table 1. Multiple linear regression model to predict tiller angle in rice.
QTL/GeneSNP MarkerBinary Code of AlleleEstimateStandard Deviationt-Value
10
OsPIN2PIN2-1G (N)A (W)−8.41.06−7.92 ***
OsLIC1LIC1-1G (W)A (N)2.930.55.82 ***
LIC1-2A (N)G (W)−1.960.66−2.97 ***
D3D3-2T (N)C (W)−1.50.37−4.09 ***
D17D17-2T (W)C (N)6.61.135.83 ***
qTA8aqTA8a-1G (W)T (N)4.641.084.31 ***
TAC3TAC3A (W)T (N)1.680.812.06 *
TAC1TAC1C (N)T (W)−3.240.91−3.58 ***
Intercept5.290.975.48 ***
Regression equationTiller angle = 5.29 − 8.4 (PIN2-1) + 2.93 (LIC1-1) − 1.96 (LIC1-2) − 1.5 (D3-2) + 6.6 (D17-2) + 4.64 (qTA8a-1) + 1.68 (TAC3) − 3.24 (TAC1)
R20.53
Adjusted R20.51
F-statistic36.92
p-value<0.001
N, allele for narrow tiller angle; W, allele for wide tiller angle; *, p ≤ 0.05; ***, p ≤ 0.001.

