ICU-Acquired Hypernatremia Is Associated with Persistent Inflammation, Immunosuppression and Catabolism Syndrome

 , , , ,
Abstract
:1. Introduction
2. Materials and Methods
3. Results
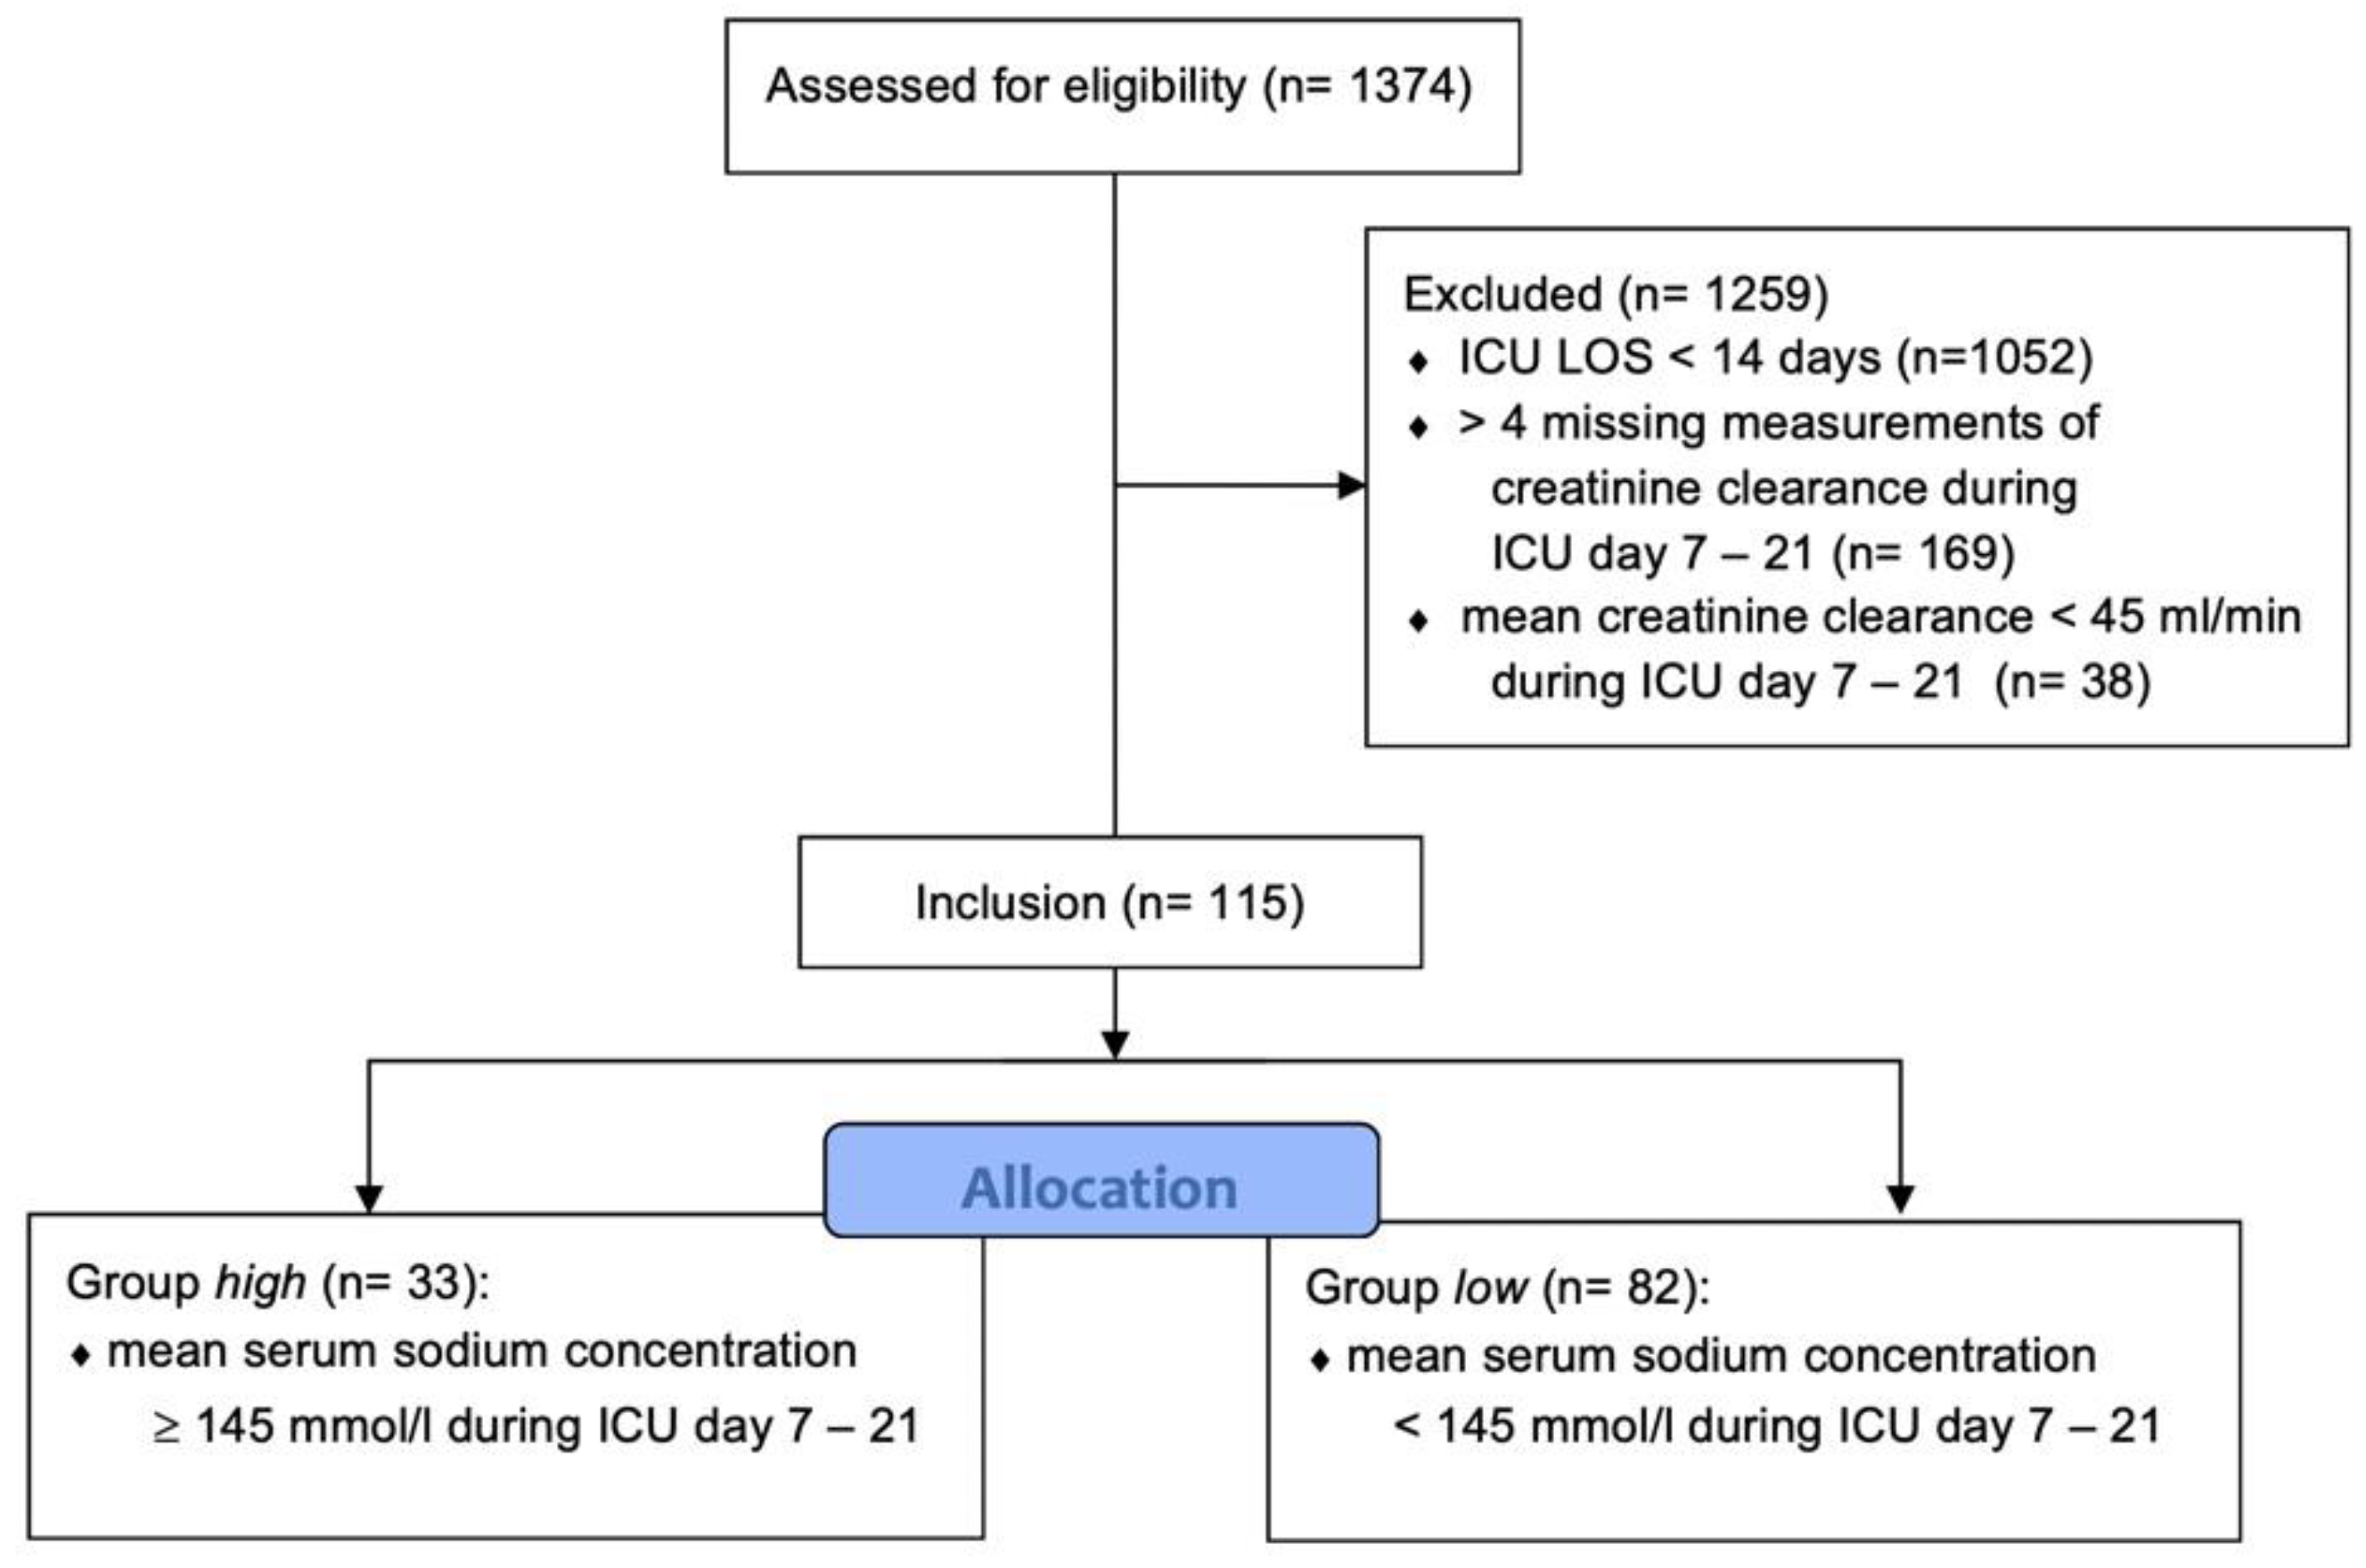
3.1. Demographics
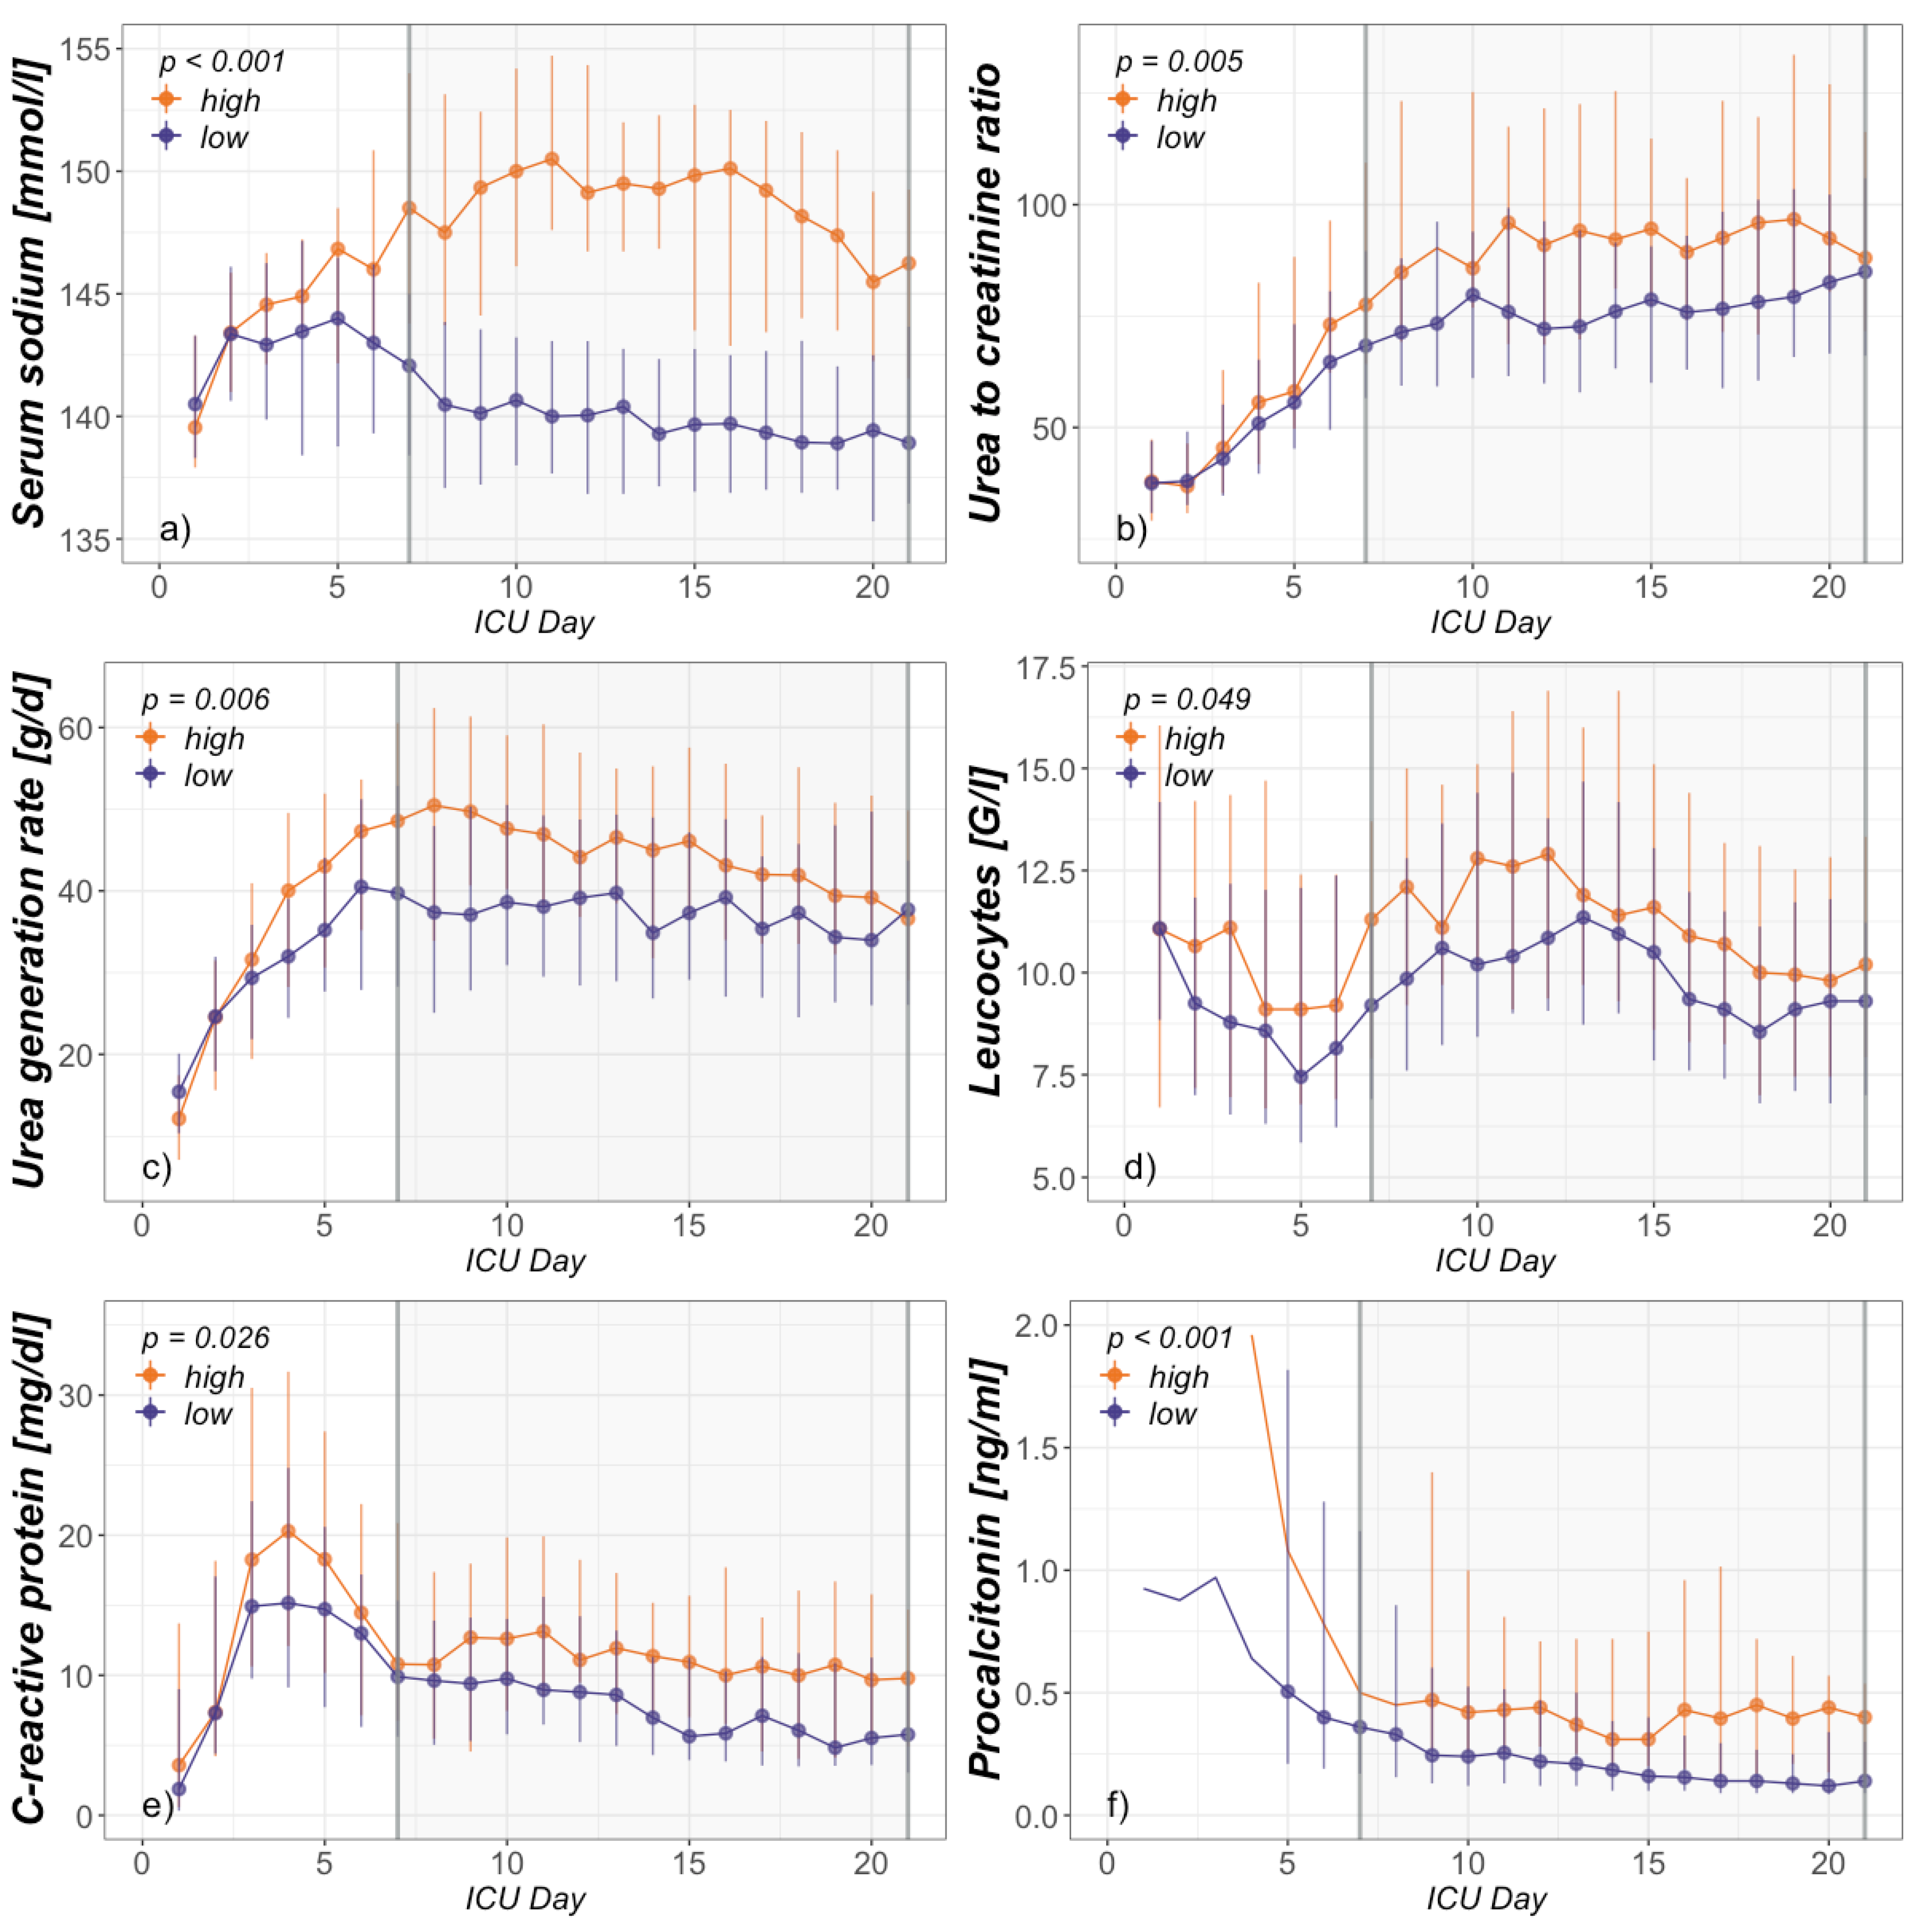
3.2. Association between Hypernatremia and PICS
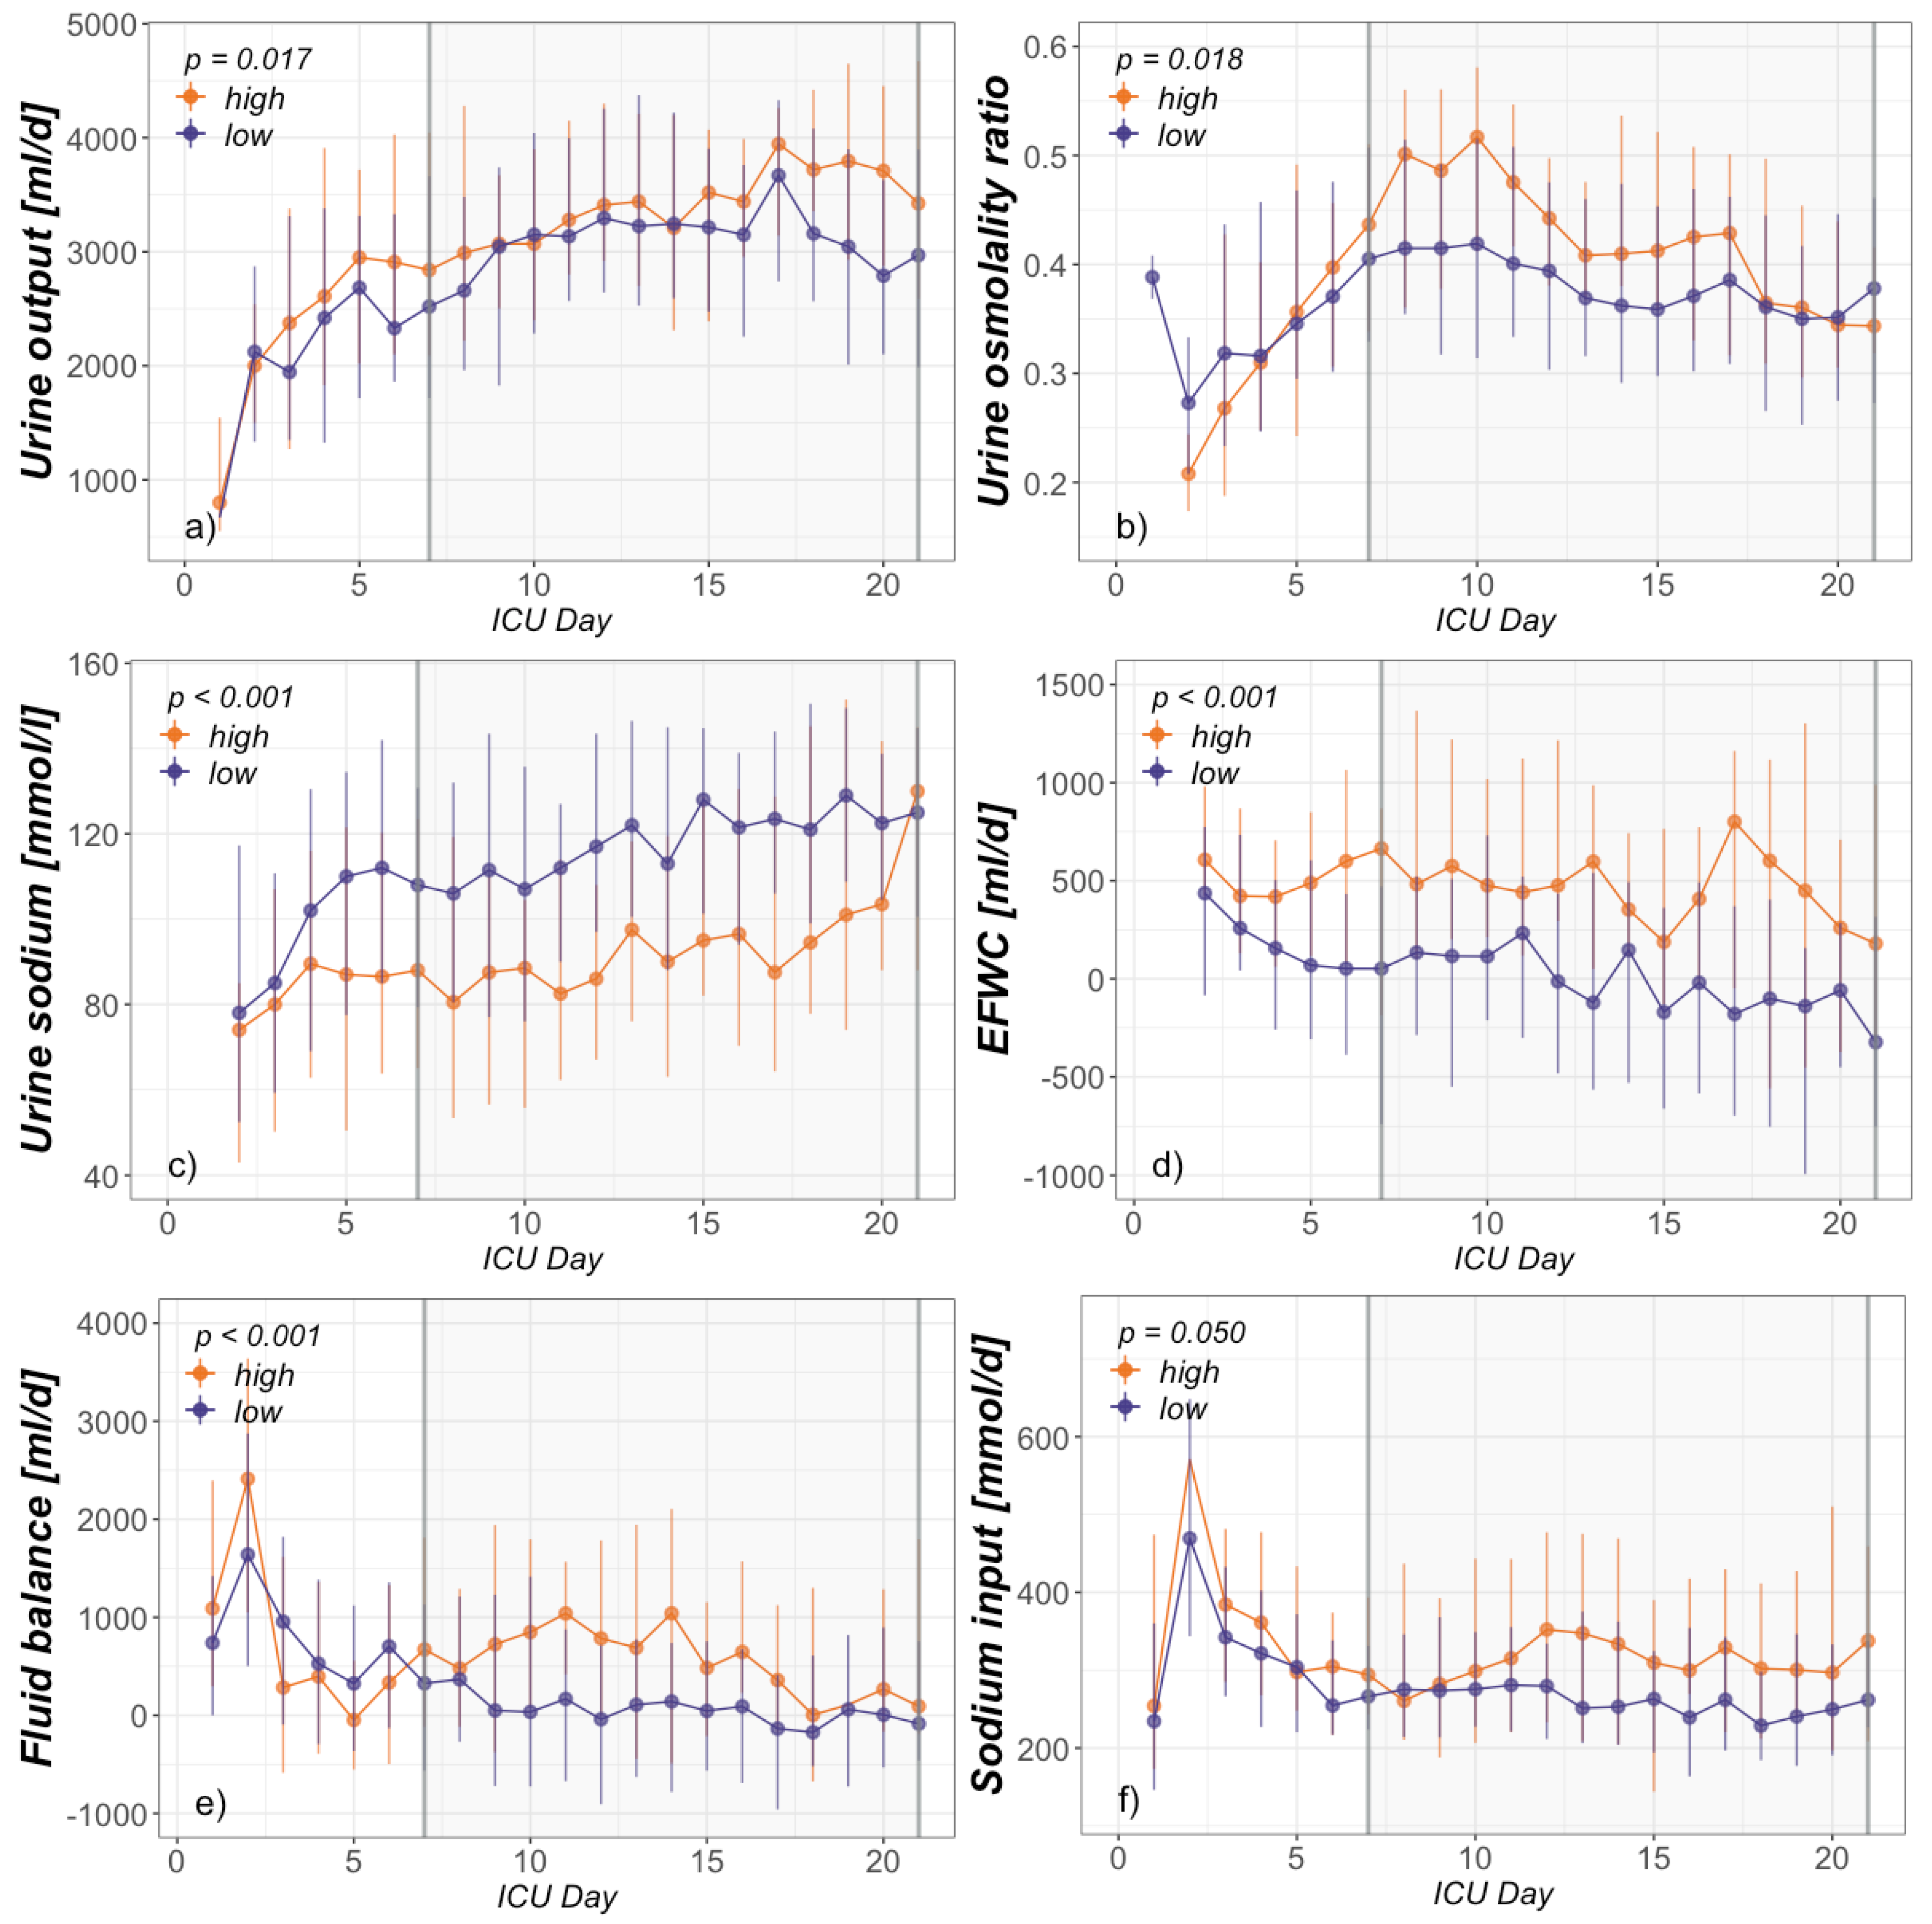
3.3. Assignable Causes for Hypernatremia
4. Discussion
4.1. Demographics
4.2. Association between Hypernatremia and PICS
4.3. Assignable Causes of Hypernatremia
4.4. Limitations
5. Conclusions
Author Contributions
Funding
Conflicts of Interest
Appendix A

References
- Lindner, G.; Funk, G.-C. Hypernatremia in critically ill patients. J. Crit. Care 2013, 28, 216.e11–216.e20. [Google Scholar] [CrossRef] [PubMed]
- Chang, L.; Harrington, D.W.; Mlikotic, A.; Swerdloff, R.S.; Wang, C. Unusual occurrence of extrapontine myelinolysis associated with acute severe hypernatraemia caused by central diabetes insipidus. Clin. Endocrinol. 2005, 63, 233–235. [Google Scholar] [CrossRef] [PubMed]
- Adrogué, H.J.; Madias, N.E. Hypernatremia. N. Engl. J. Med. 2000, 342, 1493–1499. [Google Scholar] [CrossRef] [PubMed]
- Denman, J.P. Hypernatraemia and rhabdomyolysis. Med. J. Aust. 2007, 187, 527–528. [Google Scholar] [CrossRef] [PubMed]
- Mastro-Martínez, I.; Montes-Arjona, A.M.; Escudero-Lirio, M.; Hernández-García, B.; Padial, J.F.-C. Severe rhabdomyolysis secondary to severe hypernatraemic dehydration. Rev. Chil. Pediatría 2015, 86, 279–282. [Google Scholar] [CrossRef] [Green Version]
- Komjati, M.; Kastner, G.; Waldhäusl, W.; Bratusch-Marrain, P. Effect of hyperosmolality on basal and hormone-stimulated hepatic glucose metabolism in vitro. Eur. J. Clin. Investig. 1989, 19, 128–134. [Google Scholar] [CrossRef]
- Komjati, M.; Kastner, G.; Waldhäusl, W.; Bratusch-Marrain, P. Detrimental effect of hyperosmolality on insulin-stimulated glucose metabolism in adipose and muscle tissue in vitro. Biochem. Med. Metab. Biol. 1988, 39, 312–318. [Google Scholar] [CrossRef]
- Lenz, K.; Gossinger, H.; Laggner, A.; Druml, W.; Grimm, G.; Schneeweiss, B. Influence of hypernatremic-hyperosmolar state on hemodynamics of patients with normal and depressed myocardial function. Crit. Care Med. 1986, 14, 913. [Google Scholar] [CrossRef]
- Lindner, G.; Funk, G.-C.; Schwarz, C.; Kneidinger, N.; Kaider, A.; Schneeweiss, B.; Kramer, L.; Druml, W. Hypernatremia in the critically ill is an independent risk factor for mortality. Am. J. Kidney Dis. 2007, 50, 952–957. [Google Scholar] [CrossRef]
- Funk, G.-C.; Lindner, G.; Druml, W.; Metnitz, B.; Schwarz, C.; Bauer, P.; Metnitz, P.G.H. Incidence and prognosis of dysnatremias present on ICU admission. Intensive Care Med. 2009, 36, 304–311. [Google Scholar] [CrossRef]
- Lindner, G.; Funk, G.-C.; Lassnigg, A.; Mouhieddine, M.; Ahmad, S.-A.; Schwarz, C.; Hiesmayr, M. Intensive care-acquired hypernatremia after major cardiothoracic surgery is associated with increased mortality. Intensive Care Med. 2010, 36, 1718–1723. [Google Scholar] [CrossRef] [PubMed]
- Darmon, M.; Timsit, J.-F.; Francais, A.; Nguile-Makao, M.; Adrie, C.; Cohen, Y.; Garrouste-Orgeas, M.; Goldgran-Toledano, D.; Dumenil, A.-S.; Jamali, S.; et al. Association between hypernatraemia acquired in the ICU and mortality: A cohort study. Nephrol. Dial. Transplant. 2010, 25, 2510–2515. [Google Scholar] [CrossRef] [PubMed]
- Sakr, Y.; Rother, S.; Ferreira, A.M.P.; Ewald, C.; Dünisch, P.; Riedemmann, N.; Reinhart, K. Fluctuations in serum sodium level are associated with an increased risk of death in surgical ICU patients. Crit. Care Med. 2013, 41, 133–142. [Google Scholar] [CrossRef] [PubMed] [Green Version]
- Stelfox, H.T.; Ahmed, S.B.; Khandwala, F.; Zygun, D.; Shahpori, R.; Laupland, K. The epidemiology of intensive care unit-acquired hyponatraemia and hypernatraemia in medical-surgical intensive care units. Crit. Care 2008, 12, R162. [Google Scholar] [CrossRef] [Green Version]
- Nicolini, E.A.; Nunes, R.S.; Santos, G.V.; da Silva, S.L.; Carreira, M.M.; Pellison, F.G.; Menegueti, M.G.; Auxiliadora-Martins, M.; Bellissimo-Rodrigues, F.; Feres, M.A.; et al. Could dysnatremias play a role as independent factors to predict mortality in surgical critically ill patients? Medicine 2017, 96, e6182. [Google Scholar] [CrossRef]
- Basile-Filho, A.; Menegueti, M.G.; Nicolini, E.A.; Lago, A.F.; Martinez, E.Z.; Auxiliadora-Martins, M. Are the dysnatremias a permanent threat to the critically ill patients? J. Clin. Med. Res. 2016, 8, 141–146. [Google Scholar] [CrossRef] [Green Version]
- Gentile, L.F.; Cuenca, A.G.; Efron, P.A.; Ang, D.; Bihorac, A.; McKinley, B.A.; Moldawer, L.L.; Moore, F.A. Persistent inflammation and immunosuppression. J. Trauma Acute Care Surg. 2012, 72, 1491–1501. [Google Scholar] [CrossRef] [Green Version]
- Mira, J.C.; Brakenridge, S.C.; Moldawer, L.L.; Moore, F.A. Persistent inflammation, immunosuppression and catabolism syndrome. Crit. Care Clin. 2017, 33, 245–258. [Google Scholar] [CrossRef]
- Efron, P.A.; Mohr, A.M.; Bihorac, A.; Horiguchi, H.; Hollen, M.K.; Segal, M.S.; Baker, H.V.; Leeuwenburgh, C.; Moldawer, L.L.; Moore, F.A.; et al. Persistent inflammation, immunosuppression, and catabolism and the development of chronic critical illness after surgery. Surgery 2018, 164, 178–184. [Google Scholar] [CrossRef]
- Hawkins, R.B.; Raymond, S.L.; Stortz, J.A.; Horiguchi, H.; Brakenridge, S.C.; Gardner, A.; Efron, P.A.; Bihorac, A.; Segal, M.; Moore, F.A.; et al. Chronic Critical illness and the persistent inflammation, immunosuppression, and catabolism syndrome. Front. Immunol. 2018, 9, 1511. [Google Scholar] [CrossRef]
- Hesselink, L.; Hoepelman, R.J.; Spijkerman, R.; de Groot, M.C.H.; van Wessem, K.J.P.; Koenderman, L.; Leenen, L.P.H.; Hietbrink, F. Persistent inflammation, immunosuppression and catabolism syndrome (PICS) after polytrauma: A rare syndrome with major consequences. J. Clin. Med. 2020, 9, 191. [Google Scholar] [CrossRef] [PubMed] [Green Version]
- Stortz, J.A.; Murphy, T.J.; Raymond, S.L.; Mira, J.C.; Ungaro, R.; Dirain, M.L.; Nacionales, D.C.; Loftus, T.J.; Wang, Z.; Ozrazgat-Baslanti, T.; et al. Evidence for persistent immune suppression in patients who develop chronic critical illness after sepsis. Shock 2018, 49, 249–258. [Google Scholar] [CrossRef] [PubMed]
- Rosenthal, M.D.; Moore, F.A. Persistent inflammatory, immunosuppressed, catabolic syndrome (PICS): A new phenotype of multiple organ failure. J. Adv. Nutr. Hum. Metab. 2015, 1. [Google Scholar] [CrossRef] [Green Version]
- Mira, J.C.; Cuschieri, J.; Ozrazgat-Baslanti, T.; Wang, Z.; Ghita, G.L.; Loftus, T.J.; Stortz, J.A.; Raymond, S.L.; Lanz, J.D.; Hennessy, L.V.; et al. The epidemiology of chronic critical illness after severe traumatic injury at two level—one trauma centers. Crit. Care Med. 2017, 45, 1989–1996. [Google Scholar] [CrossRef] [PubMed]
- Stortz, J.A.; Mira, J.C.; Raymond, S.L.; Loftus, T.J.; Ozrazgat-Baslanti, T.; Wang, Z.; Ghita, G.L.; Leeuwenburgh, C.; Segal, M.S.; Bihorac, A.; et al. Benchmarking clinical outcomes and the immunocatabolic phenotype of chronic critical illness after sepsis in surgical intensive care unit patients. J. Trauma Acute Care Surg. 2018, 84, 342–349. [Google Scholar] [CrossRef] [PubMed]
- Rugg, C.; Ströhle, M.; Schmid, S.; Kreutziger, J. The Link between hypermetabolism and hypernatremia in severely burned patients. Nutrients 2020, 12, 774. [Google Scholar] [CrossRef] [Green Version]
- Lindner, G.; Schwarz, C.; Funk, G.-C. Osmotic diuresis due to urea as the cause of hypernatraemia in critically ill patients. Nephrol. Dial. Transplant. 2012, 27, 962–967. [Google Scholar] [CrossRef] [Green Version]
- Distenhreft, J.I.Q.; Vianna, J.G.P.; Scopel, G.S.; Ramos, J.M.; Seguro, A.C.; Luchi, W.M. The role of urea-induced osmotic diuresis and hypernatremia in a critically ill patient: Case report and literature review. Braz. J. Nephrol. 2019. [Google Scholar] [CrossRef]
- Vadi, S.; Yim, K. Hypernatremia due to urea-induced osmotic diuresis: Physiology at the bedside. Indian J. Crit. Care Med. 2018, 22, 664–669. [Google Scholar] [CrossRef]
- Anderson, A.; Barrett, E.J. Severe hypernatremia from a urea-induced diuresis due to body protein wasting in an insulin-resistant type 2 diabetic patient. J. Clin. Endocrinol. Metab. 2013, 98, 1800–1802. [Google Scholar] [CrossRef] [Green Version]
- Bodonyi-Kovacs, G.; Lecker, S.H. Electrolyte-free water clearance: A key to the diagnosis of hypernatremia in resolving acute renal failure. Clin. Exp. Nephrol. 2008, 12, 74–78. [Google Scholar] [CrossRef]
- Berneis, K.; Ninnis, R.; Häussinger, D.; Keller, U. Effects of hyper- and hypoosmolality on whole body protein and glucose kinetics in humans. Am. J. Physiol. Endocrinol. Metab. 1999, 276, E188–E195. [Google Scholar] [CrossRef] [PubMed]
- Keller, U.; Szinnai, G.; Bilz, S.; Berneis, K. Effects of changes in hydration on protein, glucose and lipid metabolism in man: Impact on health. Eur. J. Clin. Nutr. 2003, 57, S69–S74. [Google Scholar] [CrossRef] [PubMed] [Green Version]
- Abolhassani, M.; Wertz, X.; Pooya, M.; Chaumet-Riffaud, P.; Guais, A.; Schwartz, L. Hyperosmolarity causes inflammation through the methylation of protein phosphatase 2A. Inflamm. Res. 2008, 57, 419–429. [Google Scholar] [CrossRef] [PubMed]
- Alberdi, M.; Iglesias, M.; Tejedor, S.; Merino, R.; López-Rodríguez, C.; Aramburu, J. Context-dependent regulation of Th17-associated genes and IFNγ expression by the transcription factor NFAT5. Immunol. Cell Biol. 2017, 95, 56–67. [Google Scholar] [CrossRef]
- Metnitz, P.G.; Moreno, R.P.; Almeida, E.; Jordan, B.; Bauer, P.; Campos, R.A.; Iapichino, G.; Edbrooke, D.; Capuzzo, M.; Le Gall, J.R. SAPS 3 Investigators. SAPS 3--From evaluation of the patient to evaluation of the intensive care unit. Part 1: Objectives, methods and cohort description. Intensive Care Med. 2005, 10, 1336–1344. [Google Scholar] [CrossRef] [Green Version]
- Moreno, R.P.; Metnitz, P.G.; Almeida, E.; Jordan, B.; Bauer, P.; Campos, R.A.; Iapichino, G.; Edbrooke, D.; Capuzzo, M.; Le Gall, J.R. SAPS 3 Investigators. SAPS 3--From evaluation of the patient to evaluation of the intensive care unit. Part 2: Development of a prognostic model for hospital mortality at ICU admission. Intensive Care Med. 2005, 10, 1345–1355. [Google Scholar] [CrossRef] [Green Version]
- Nguyen, M.K.; Kurtz, I. Derivation of a new formula for calculating urinary electrolyte-free water clearance based on the Edelman equation. Am. J. Physiol. Ren. Physiol. 2005, 288, F1–F7. [Google Scholar] [CrossRef] [Green Version]
- Haines, R.W.; Zolfaghari, P.; Wan, Y.; Pearse, R.M.; Puthucheary, Z.; Prowle, J.R. Elevated urea-to-creatinine ratio provides a biochemical signature of muscle catabolism and persistent critical illness after major trauma. Intensive Care Med. 2019, 1–14. [Google Scholar] [CrossRef]
- Noguchi, K.; Gel, Y.R.; Brunner, E.; Konietschke, F. nparLD: An R software package for the nonparametric analysis of longitudinal data in factorial experiments. J. Stat. Softw. 2012, 50. [Google Scholar] [CrossRef] [Green Version]
- Shirazy, M.; Omar, I.; Abduljabbar, D.; Bousselmi, K.; Alkhaja, M.; Chaari, A.; Kauts, V.; Hakim, K. Prevalence and prognostic impact of hypernatremia in sepsis and septic shock patients in the intensive care unit: A single centre experience. J. Crit. Care Med. 2020, 6, 52–58. [Google Scholar] [CrossRef] [PubMed] [Green Version]
- Nakamura, K.; Ogura, K.; Nakano, H.; Naraba, H.; Takahashi, Y.; Sonoo, T.; Hashimoto, H.; Morimura, N. C-reactive protein clustering to clarify persistent inflammation, immunosuppression and catabolism syndrome. Intensive Care Med. 2020, 1–7. [Google Scholar] [CrossRef] [PubMed]
- Cavaillon, J.-M.M.; Giamarellos-Bourboulis, E.J. Immunosuppression is inappropriately qualifying the immune status of septic and SIRS patients. Shock 2019, 52, 307–317. [Google Scholar] [CrossRef] [PubMed]
- Hülshoff, A.; Schricker, T.; Elgendy, H.; Hatzakorzian, R.; Lattermann, R. Albumin synthesis in surgical patients. Nutrition 2013, 29, 703–707. [Google Scholar] [CrossRef] [PubMed]
- Labgaa, I.; Joliat, G.-R.; Kefleyesus, A.; Mantziari, S.; Schäfer, M.; Demartines, N.; Hübner, M. Is postoperative decrease of serum albumin an early predictor of complications after major abdominal surgery? A prospective cohort study in a European centre. BMJ Open 2017, 7, e013966. [Google Scholar] [CrossRef] [PubMed] [Green Version]
- Gunst, J.; Kashani, K.B.; Hermans, G. The urea-creatinine ratio as a novel biomarker of critical illness-associated catabolism. Intensive Care Med. 2019, 1–3. [Google Scholar] [CrossRef] [Green Version]

| Formula | Units |
|---|---|
| [mL/d] | |
| [mL/d] | |
| [g/d] |
| Group | High (n = 33) Median (Q1–Q3) or n (%) | Low (n = 82) Median (Q1–Q3) or n (%) | p-Value |
|---|---|---|---|
| Age (years) | 62 (49–68) | 58 (44–69) | 0.481 |
| Gender | 0.672 | ||
| Female | 10 (30.3%) | 30 (36.6%) | |
| Male | 23 (69.7%) | 52 (63.4%) | |
| SAPS III * | 66 (56–76) | 69 (59–75) | 0.538 |
| Admission type | |||
| Elective surgery | 11 (33.3%) | 15 (18.3%) | 0.225 |
| Emergency Surgery | 5 (15.2%) | 7 (8.5%) | |
| Trauma | 10 (30.3%) | 42 (51.2%) | |
| Sepsis | 5 (15.2%) | 12 (14.6%) | |
| Other medical | 2 (6.1%) | 6 (7.3%) | |
| ICU + length of stay (days) | 23 (19–35) | 19 (16–26) | 0.030 |
| Outcome | |||
| Dead | 2 (6.1%) | 5 (6.1%) | 1.000 |
| Alive | 31 (93.9%) | 77 (93.9%) |
| Group | Total Pop. (n = 115) Median (Q1–Q3) | High (n = 33) Median (Q1–Q3) | Low (n = 82) Median (Q1–Q3) | p-Value |
|---|---|---|---|---|
| Leucocytes (G/L) | 10.4 (8.1–11.4) | 11.2 (8.6–14.9) | 10.0 (7.8–13) | 0.049 |
| Lymphocytes (G/L) * | 1.078 (0.859–1.605) | 0.933 (0.780–1.230) | 1.250 (0.940–1.718) | 0.080 |
| CRP (mg/dL) | 8.7 (4.7–14.2) | 11.1 (6.1–17.8) | 7.8 (4.4–13.1) | 0.026 |
| Procalcitonin (ng/mL) | 0.26 (0.13–0.60) | 0.42 (0.22–0.80) | 0.20 (0.10–0.45) | <0.001 |
| Albumin (g/dL) | 1.71 (1.55–2.00) | 1.72 (1.55–2.00) | 1.71 (1.55–1.99) | 0.962 |
| Urea-to-creatinine ratio | 79.6 (63.3–102.3) | 91.0 (72.5–124.1) | 75.3 (60.6–96.7) | 0.005 |
| Urea generation (g/d) | 39.7 (29.4–51.8) | 45.5 (35.5–57.7) | 37.4 (27.5–48.7) | 0.006 |
| Renal protein loss (g/d) | 118 (87–154) | 133 (101–174) | 111 (81–144) | 0.007 |
| Creatinine clearance (mL/min) | 105.7 (71.2–158.3) | 87.8 (62.2–127.3) | 116.0 (78.1–172.2) | 0.006 |
| Free water clearance (mL/d) | −2276 (−3362–−1345) | −2095 (−3038–−1323) | −2378 (−3543–−1357) | 0.161 |
| Fluid balance (mL/d) | 206 (−546–1096) | 671 (−189–1685) | 68 (−654–876) | <0.001 |
| Sodium intake (mmol/d) | 275 (205–382) | 333 (208–440) | 262 (205–352) | 0.050 |
| Serum sodium (mmol/L) | 142 (138–147) | 149 (144–153) | 140 (137–143) | <0.001 |
© 2020 by the authors. Licensee MDPI, Basel, Switzerland. This article is an open access article distributed under the terms and conditions of the Creative Commons Attribution (CC BY) license (http://creativecommons.org/licenses/by/4.0/).
Share and Cite
Rugg, C.; Ströhle, M.; Treml, B.; Bachler, M.; Schmid, S.; Kreutziger, J. ICU-Acquired Hypernatremia Is Associated with Persistent Inflammation, Immunosuppression and Catabolism Syndrome. J. Clin. Med. 2020, 9, 3017. https://doi.org/10.3390/jcm9093017
Rugg C, Ströhle M, Treml B, Bachler M, Schmid S, Kreutziger J. ICU-Acquired Hypernatremia Is Associated with Persistent Inflammation, Immunosuppression and Catabolism Syndrome. Journal of Clinical Medicine. 2020; 9(9):3017. https://doi.org/10.3390/jcm9093017
Chicago/Turabian StyleRugg, Christopher, Mathias Ströhle, Benedikt Treml, Mirjam Bachler, Stefan Schmid, and Janett Kreutziger. 2020. "ICU-Acquired Hypernatremia Is Associated with Persistent Inflammation, Immunosuppression and Catabolism Syndrome" Journal of Clinical Medicine 9, no. 9: 3017. https://doi.org/10.3390/jcm9093017
APA StyleRugg, C., Ströhle, M., Treml, B., Bachler, M., Schmid, S., & Kreutziger, J. (2020). ICU-Acquired Hypernatremia Is Associated with Persistent Inflammation, Immunosuppression and Catabolism Syndrome. Journal of Clinical Medicine, 9(9), 3017. https://doi.org/10.3390/jcm9093017