Diagnostic and Prognostic Value of Conventional Brain MRI in the Clinical Work-Up of Patients with Amyotrophic Lateral Sclerosis


Abstract
1. Introduction
2. Methods
2.1. Subjects
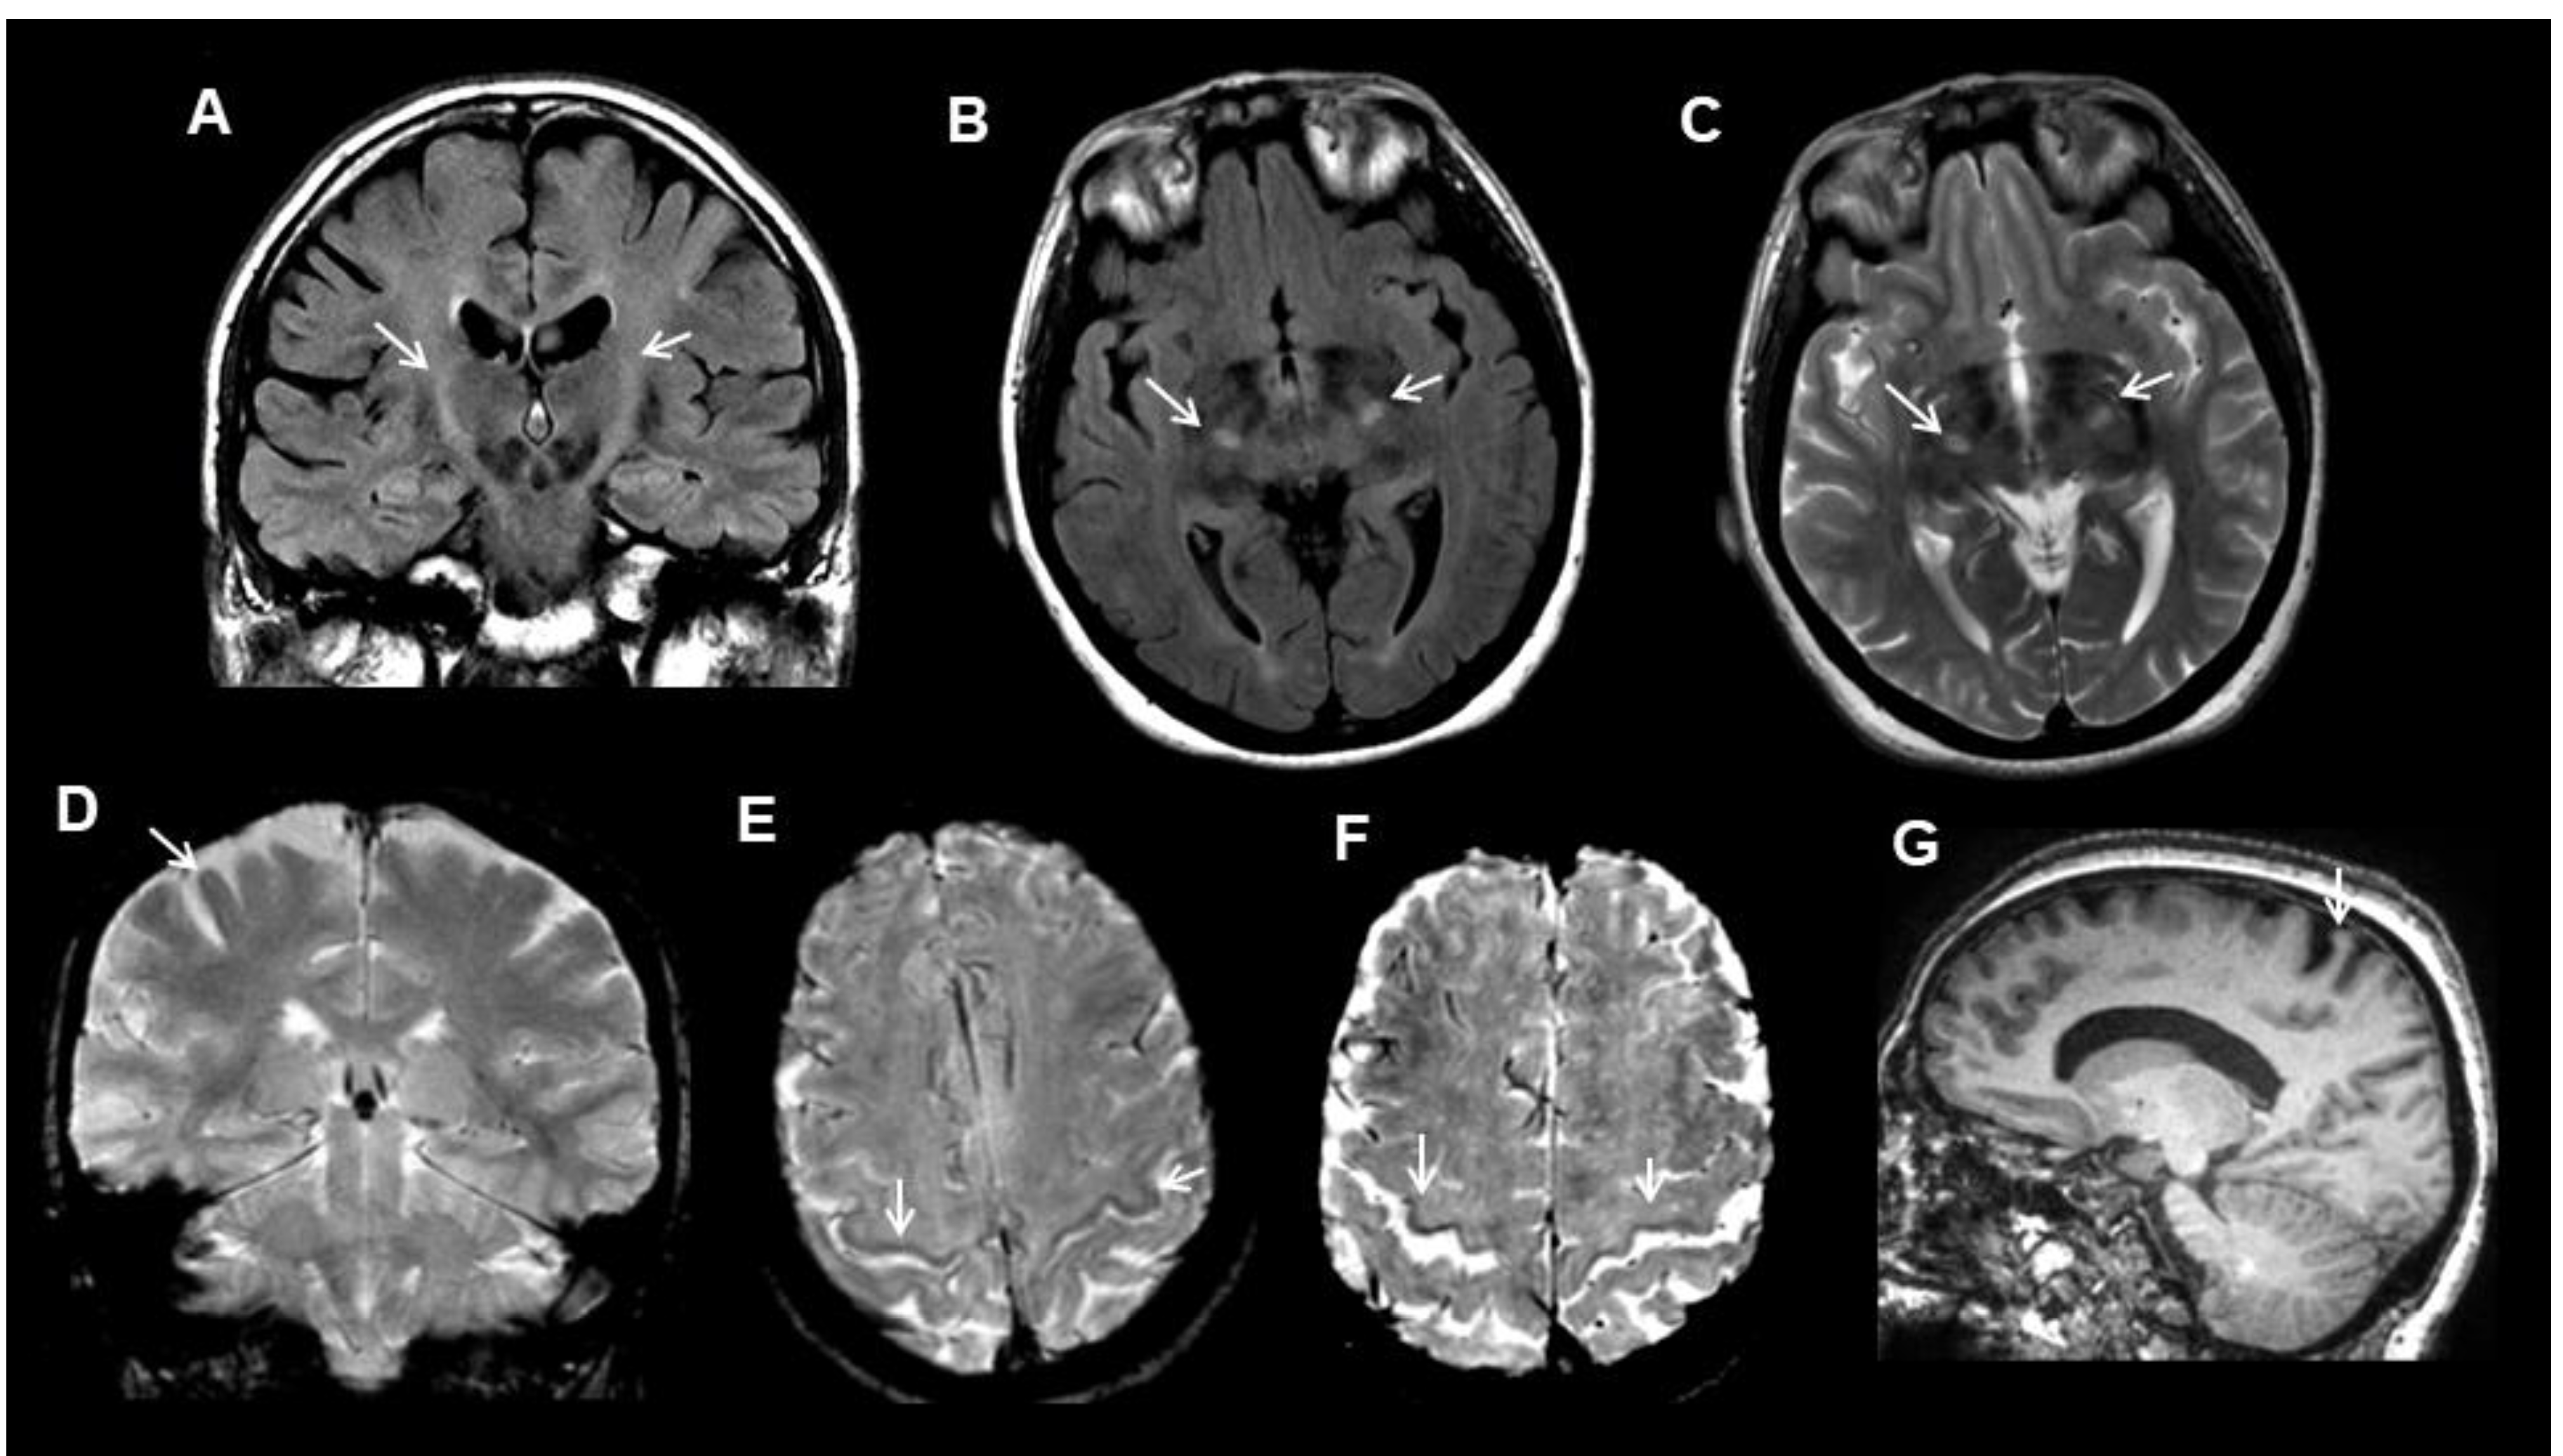
2.2. MRI Data
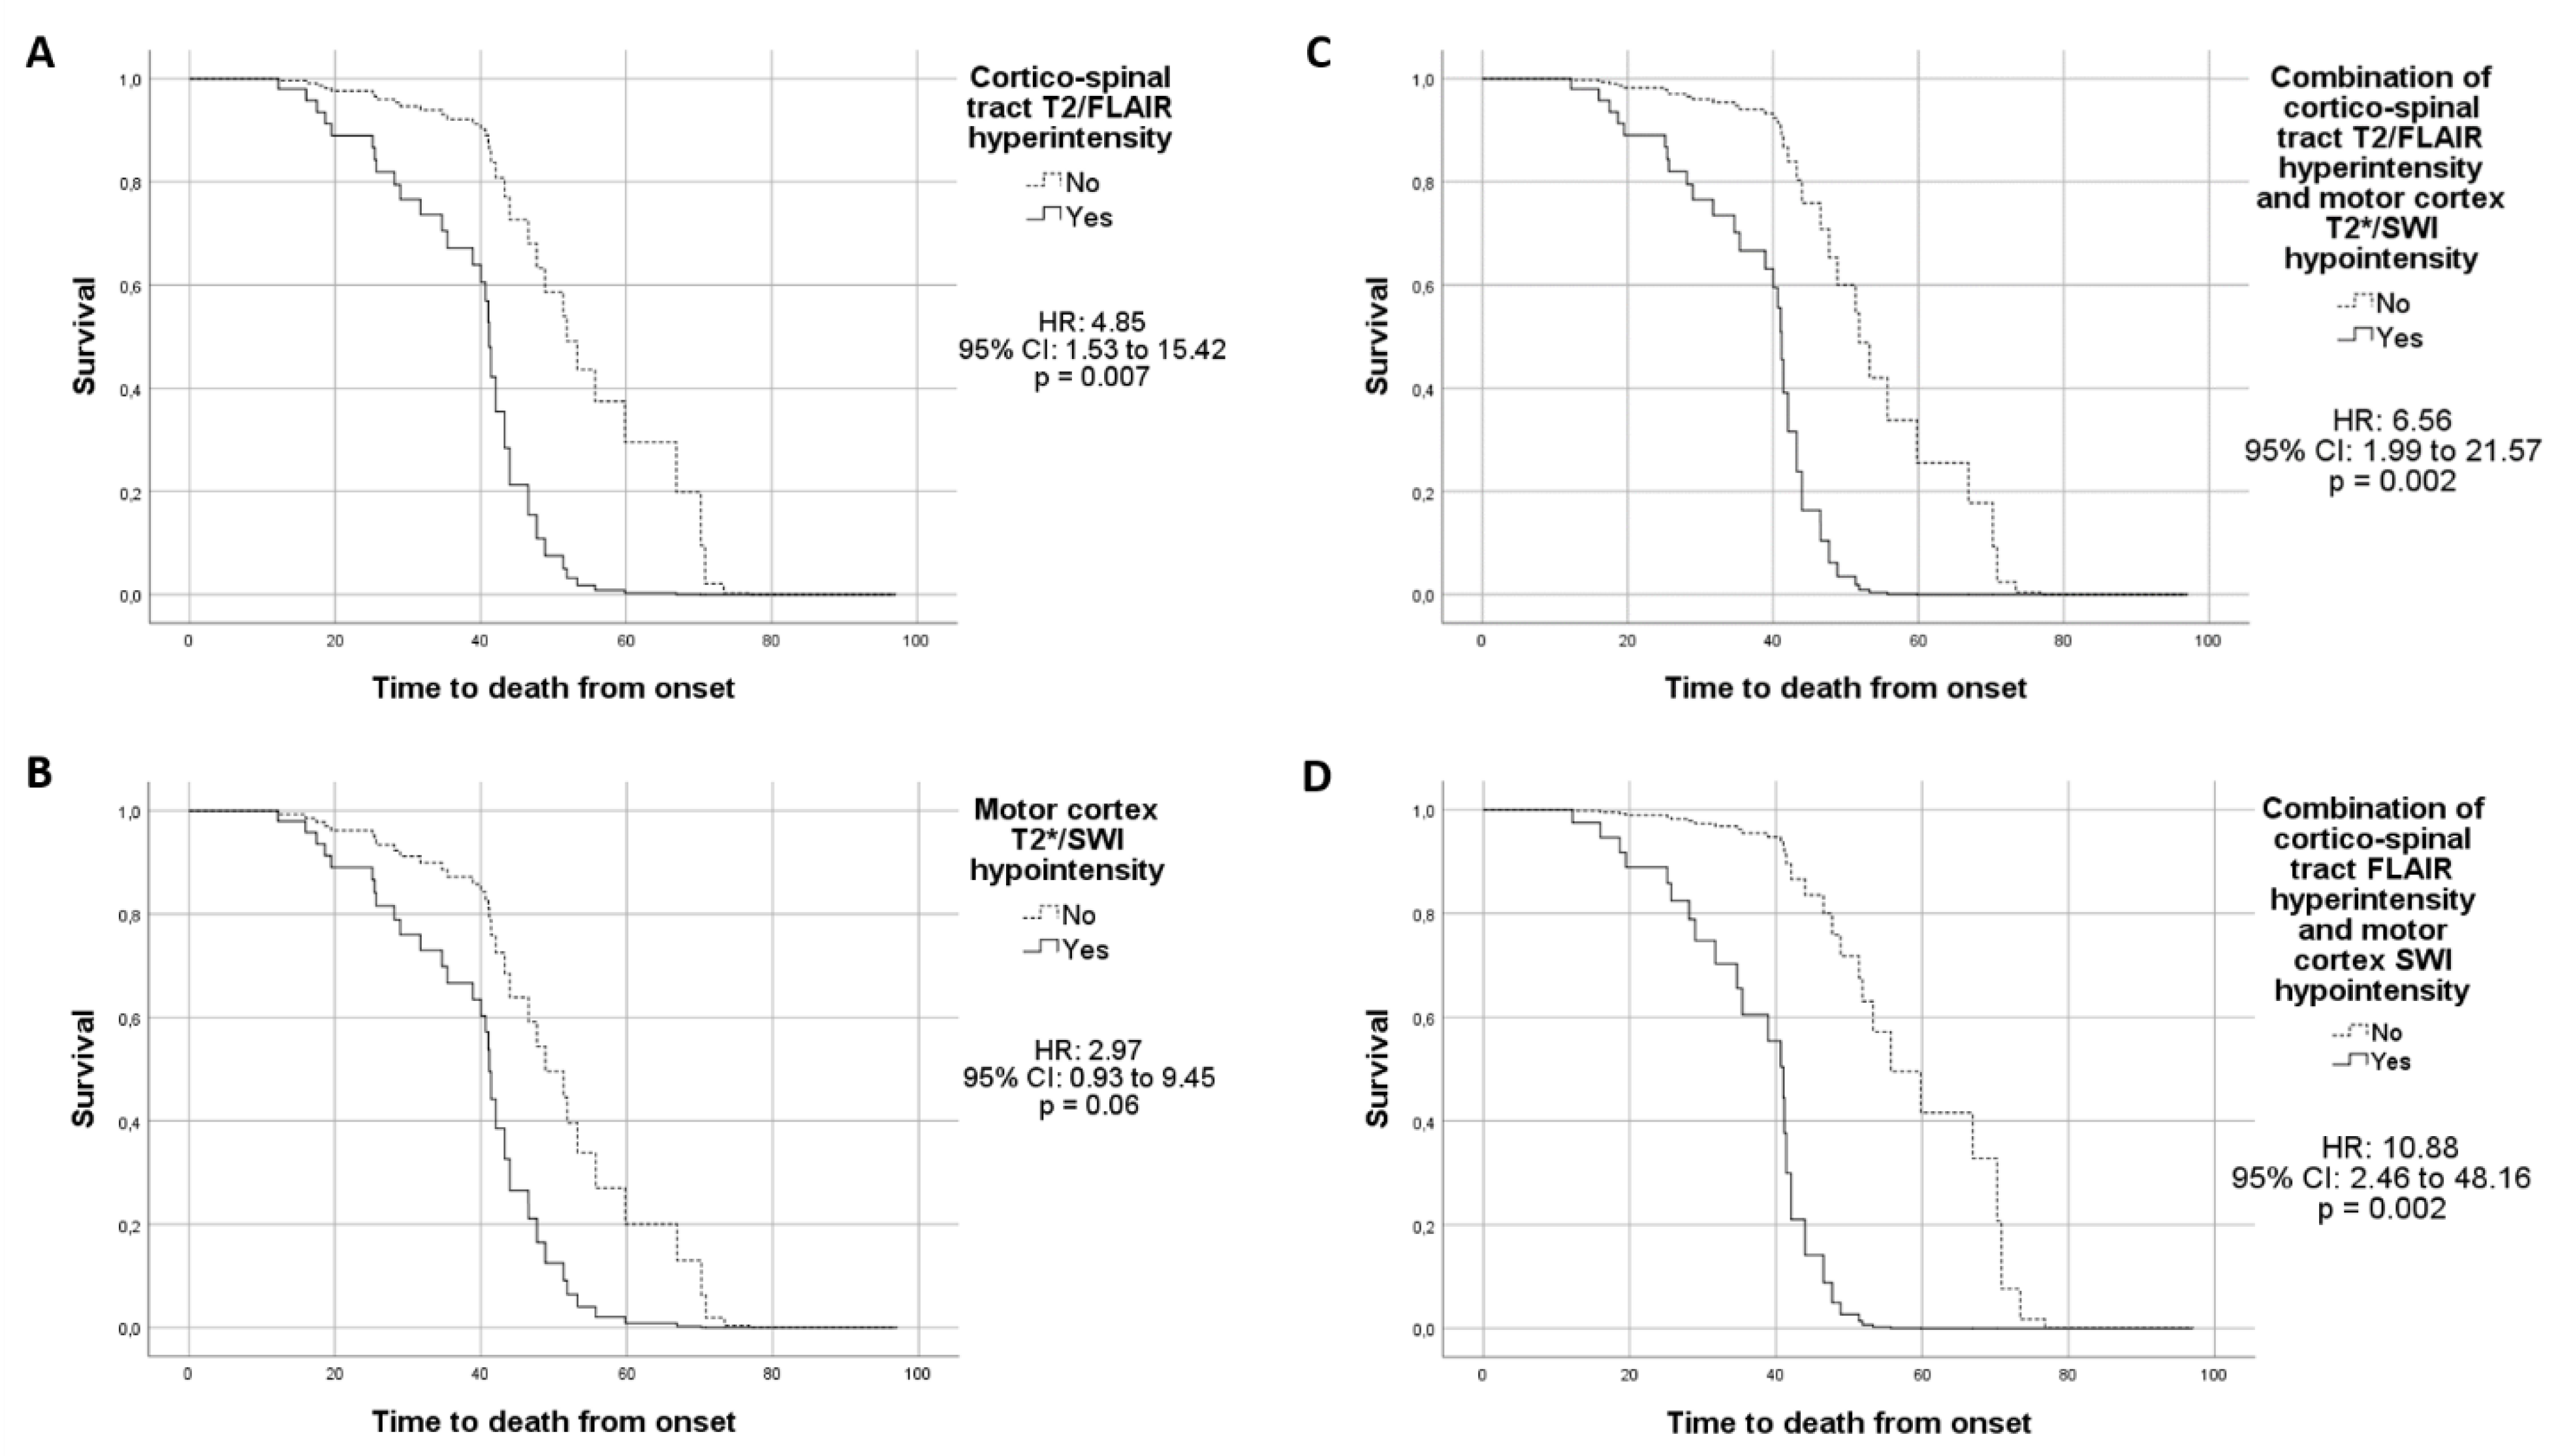
2.3. Statistical Analyses
3. Results
4. Discussion
Supplementary Materials
Author Contributions
Acknowledgments
Funding
Conflicts of Interest
References
- Logroscino, G.; Tortelli, R.; Rizzo, G.; Marin, B.; Preux, P.M.; Malaspina, A. Amyotrophic Lateral Sclerosis: An Aging Related Disease. Curr. Geriatr. Rep. 2015, 4, 142–153. [Google Scholar] [CrossRef]
- Brooks, B.R.; Miller, R.G.; Swash, M.; Munsat, T.L. World Federation of Neurology Research Group on Motor Neuron Diseases. El Escorial revisited: Revised criteria for the diagnosis of amyotrophic lateral sclerosis. Amyotroph. Lateral Scler. Other Mot. Neuron Disord. 2000, 1, 293–299. [Google Scholar] [CrossRef] [PubMed]
- Kiernan, M.C.; Vucic, S.; Cheah, B.C.; Turner, M.R.; Eisen, A.; Hardiman, O.; Burrell, J.R.; Zoing, M.C. Amyotrophic lateral sclerosis. Lancet 2011, 377, 942–955. [Google Scholar] [CrossRef]
- Mazón, M.; Vázquez Costa, J.F.; Ten-Esteve, A.; Martí-Bonmatí, L. Imaging Biomarkers for the Diagnosis and Prognosis of Neurodegenerative Diseases. The Example of Amyotrophic Lateral Sclerosis. Front. Neurosci. 2018, 12, 784. [Google Scholar]
- Agosta, F.; Spinelli, E.G.; Filippi, M. Neuroimaging in amyotrophic lateral sclerosis: Current and emerging uses. Expert. Rev. Neurother. 2018, 18, 395–406. [Google Scholar] [CrossRef] [PubMed]
- Chiò, A.; Calvo, A.; Moglia, C.; Mazzini, L.; Mora, G. PARALS study group. Phenotypic heterogeneity of amyotrophic lateral sclerosis: A population based study. J. Neurol. Neurosurg. Psychiatry. 2011, 82, 740–746. [Google Scholar]
- Al-Chalabi, A.; Hardiman, O.; Kiernan, M.C.; Chiò, A.; Rix-Brooks, B.; van den Berg, L.H. Amyotrophic lateral sclerosis: Moving towards a new classification system. Lancet Neurol. 2016, 15, 1182–1194. [Google Scholar] [CrossRef]
- Iwasaki, S.; Nakagawa, H.; Fukusumi, A.; Kichikawa, K.; Kitamura, K.; Otsuji, H.; Uchida, H.; Ohishi, H.; Yaguchi, K.; Sumie, H. Identification of pre- and postcentral gyri on CT and MR images on the basis of the medullary pattern of cerebral white matter. Radiology 1991, 179, 207–213. [Google Scholar] [CrossRef]
- Filippi, M.; Agosta, F.; Abrahams, S.; Fazekas, F.; Grosskreutz, J.; Kalra, S.; Kassubek, J.; Silani, V.; Turner, M.R.; Masdeu, J.C. European Federation of Neurological Societies. EFNS guidelines on the use of neuroimaging in the management of motor neuron diseases. Eur. J. Neurol. 2010, 17, 526-e20. [Google Scholar] [CrossRef]
- Huynh, W.; Simon, N.G.; Grosskreutz, J.; Turner, M.R.; Vucic, S.; Kiernan, M.C. Assessment of the upper motor neuron in amyotrophic lateral sclerosis. Clin. Neurophysiol. 2016, 127, 2643–2660. [Google Scholar] [CrossRef]
- Imon, Y.; Yamaguchi, S.; Yamamura, Y.; Tsuji, S.; Kajima, T.; Ito, K.; Nakamura, S. Low intensity areas observed on T2-weighted magnetic resonance imaging of the cerebral cortex in various neurological diseases. J. Neurol. Sci. 1995, 134 (Suppl. l), 27–32. [Google Scholar] [CrossRef]
- Sheelakumari, R.; Madhusoodanan, M.; Radhakrishnan, A.; Ranjith, G.; Thomas, B. A potential biomarker in amyotrophic lateral sclerosis: Can assessment of brain iron deposition with SWI and corticospinal tract degeneration with DTI help? Am. J. Neuroradiol. 2016, 37, 252–258. [Google Scholar] [CrossRef] [PubMed]
- Peretti-Viton, P.; Azulay, J.P.; Trefouret, S.; Brunel, H.; Daniel, C.; Viton, J.M.; Flori, A.; Salazard, B.; Pouget, J.; Serratrice, G.; et al. MRI of the intracranial corticospinal tracts in amyotrophic and primary lateral sclerosis. Neuroradiology 1999, 41, 744–749. [Google Scholar] [CrossRef] [PubMed]
- Agosta, F.; Chiò, A.; Cosottini, M.; De Stefano, N.; Falini, A.; Mascalchi, M.; Rocca, M.A.; Silani, V.; Tedeschi, G.; Filippi, M. The present and the future of neuroimaging in amyotrophic lateral sclerosis. AJNR Am. J. Neuroradiol. 2010, 31, 1769–1777. [Google Scholar] [CrossRef] [PubMed]
- Hecht, M.J.; Fellner, F.; Fellner, C.; Hilz, M.J.; Heuss, D.; Neundörfer, B. MRI-FLAIR images of the head show corticospinal tract alterations in ALS patients more frequently than T2-, T1- and proton-density-weighted images. J. Neurol. Sci. 2001, 186, 37–44. [Google Scholar] [CrossRef]
- Jin, J.; Hu, F.; Zhang, Q.; Jia, R.; Dang, J. Hyperintensity of the corticospinal tract on FLAIR: A simple and sensitive objective upper motor neuron degeneration marker in clinically verified amyotrophic lateral sclerosis. J. Neurol. Sci. 2016, 367, 177–183. [Google Scholar] [CrossRef]
- Yagishita, A.; Nakano, I.; Oda, M.; Hirano, A. Location of the corticospinal tract in the internal capsule at MR imaging. Radiology 1994, 191, 455–460. [Google Scholar] [CrossRef]
- Vázquez-Costa, J.F.; Mazón, M.; Carreres-Polo, J.; Hervás, D.; Pérez-Tur, J.; Martí-Bonmatí, L.; Sevilla, T. Brain signal intensity changes as biomarkers in amyotrophic lateral sclerosis. Acta Neurol. Scand. 2018, 137, 262–271. [Google Scholar] [CrossRef]
- Agosta, F.; Pagani, E.; Petrolini, M.; Sormani, M.P.; Caputo, D.; Perini, M.; Prelle, A.; Salvi, F.; Filippi, M. MRI predictors of long-term evolution in amyotrophic lateral sclerosis. Eur. J. Neurosci. 2010, 32, 1490–1496. [Google Scholar] [CrossRef]
- Wirth, A.M.; Johannesen, S.; Khomenko, A.; Baldaranov, D.; Bruun, T.H.; Wendl, C.; Schuierer, G.; Greenlee, M.W.; Bogdahn, U. Value of fluid-attenuated inversion recovery MRI data analyzed by the lesion segmentation toolbox in amyotrophic lateral sclerosis. J. Magn. Reson. Imaging 2019, 50, 552–559. [Google Scholar] [CrossRef] [PubMed]
- Kwan, J.Y.; Jeong, S.Y.; Van Gelderen, P.; Deng, H.X.; Quezado, M.M.; Danielian, L.E.; Butman, J.A.; Chen, L.; Bayat, E.; Russell, J.; et al. Iron accumulation in deep cortical layers accounts for MRI signal abnormalities inALS: Correlating 7 tesla MRI and pathology. PLoS ONE 2012, 7, e35241. [Google Scholar] [CrossRef] [PubMed]
- Oba, H.; Araki, T.; Ohtomo, K.; Monzawa, S.; Uchiyama, G.; Koizumi, K.; Nogata, Y.; Kachi, K.; Shiozawa, Z.; Kobayashi, M. Amyotrophic lateral sclerosis: T2 shortening in motor cortex at MR imaging. Radiology 1993, 189, 843–846. [Google Scholar] [CrossRef] [PubMed]
- Haacke, E.M.; Cheng, N.Y.; House, M.J.; Liu, Q.; Neelavalli, J.; Ogg, R.J.; Khan, A.; Ayaz, M.; Kirsch, W.; Obenaus, A. Imaging iron stores in the brain using magnetic resonance imaging. Magn. Reson. Imaging 2005, 23, 1–25. [Google Scholar] [CrossRef] [PubMed]
- Hecht, M.J.; Fellner, F.; Fellner, C.; Hilz, M.J.; Neundörfer, B.; Heuss, D. Hyperintense and hypointense MRI signals of the precentral gyrus and corticospinal tract in ALS: A follow-up examination including FLAIR images. J. Neurol. Sci. 2002, 199, 59–65. [Google Scholar] [CrossRef]
- Cosottini, M.; Donatelli, G.; Costagli, M.; Caldarazzo Ienco, E.; Frosini, D.; Pesaresi, I.; Biagi, L.; Siciliano, G.; Tosetti, M. High-Resolution 7T MR Imaging of the Motor Cortex in Amyotrophic Lateral Sclerosis. AJNR Am. J. Neuroradiol. 2016, 37, 455–461. [Google Scholar] [CrossRef]
- Ignjatović, A.; Stević, Z.; Lavrnić, S.; Daković, M.; Bačić, G. Brain iron MRI: A biomarker for amyotrophic lateral sclerosis. J. Magn. Reson. Imaging 2013, 38, 1472–1479. [Google Scholar] [CrossRef]
- Adachi, Y.; Sato, N.; Saito, Y.; Kimura, Y.; Nakata, Y.; Ito, K.; Kamiya, K.; Matsuda, H.; Tsukamoto, T.; Ogawa, M. Usefulness of SWI for the detection of iron in the motor cortex in amyotrophic lateral sclerosis. J. Neuroimaging 2015, 25, 443–451. [Google Scholar] [CrossRef]
- Kassubek, J.; Pagani, M. Imaging in amyotrophic lateral sclerosis: MRI and PET. Curr. Opin. Neurol. 2019, 32, 740–746. [Google Scholar] [CrossRef]


| Subjects | Tot | M/F | Age at MRI (y; Mean ± SD) | Age at Onset (y; Mean ± SD) | Disease Duration at the Time of MRI (m; Mean ± SD) | ALSFRS-R (Mean ± SD) | Phenotype at Onset | |||
|---|---|---|---|---|---|---|---|---|---|---|
| Prevalent UMN | Bulbar | Classic | Prevalent LMN | |||||||
| Patients * | 93 | 55/38 | 62.8 ± 10.1 | 60.8 ± 10.7 | 25 ± 31 | 40.4 ± 6.2 | 14 (15%) | 14 (15%) | 47 (50.5%) | 18 (19.5%) |
| Controls | 89 | 56/33 | 60.2 ± 9.5 | / | / | / | / | / | / | / |
| p = 0.6 (χ2-test) | p = 0.08 (t-test) | / | / | / | / | / | / | / | ||
| Corticospinal Tract FLAIR Hyperintensity | Corticospinal Tract T2 Hyperintensity | Motor Cortex SWI Hypointensity | Motor Cortex T2* Hypointensity | Selective Motor Cortex Atrophy | |
|---|---|---|---|---|---|
| Patients | 69/92 (75%) | 42/92 (46%) | 62/82 (76%) | 11/43 (26%) | 63/91 (69%) |
| Controls | 28/87 (32%) | 6/87 (7%) | 13/33 (39%) | 8/63 (13%) | 43/88 (49%) |
| χ2-test (corrected) | p < 0.0001 | p < 0.0001 | p = 0.0011 | n.s. | p = 0.027 |
| Corticospinal Tract FLAIR Hyperintensity | Corticospinal Tract T2 Hyperintensity | Motor Cortex SWI Hypointensity | Motor Cortex T2* Hypointensity | Selective Motor Cortex Atrophy | |
|---|---|---|---|---|---|
| Prevalent UMN | 9/13 (69%) | 4/13 (31%) | 7/12 (58%) | 3/6(50%) | 10/14 (71%) |
| Bulbar | 10/14 (71%) | 7/14 (50%) | 10/10 (100%) | 1/8 (13%) | 11/14 (79%) |
| Classic | 38/47 (81%) | 27/47 (57%) | 37/44 (84%) | 6/19 (32%) | 32/46 (70%) |
| Prevalent LMN | 12/18(67%) | 4/18 (22%) | 8/16 (50%) | 1/10 (10%) | 10/57 (59%) |
| χ2-test (corrected) | n.s. | n.s. | p = 0.03 * | n.s. | n.s. |
| Corticospinal Tract FLAIR Hyperintensity | Corticospinal Tract T2 Hyperintensity | Motor Cortex SWI Hypointensity | Selective Motor Cortex Atrophy | Both Motor Cortex SWI Hypointensity and Selective Motor Cortex Atrophy | Both Motor Cortex SWI Hypointensity and Corticospinal Tract T2 Hyperintensity | Both Corticospinal Tract FLAIR Hyperintensity and Selective Motor Cortex atrophy | Both Corticospinal Tract T2 Hyperintensity and Selective Motor Cortex Atrophy | Both Corticospinal Tract FLAIR Hyperintensity and Corticospinal Tract T2 Hyperintensity | Both Corticospinal Tract FLAIR Hyperintensity and Motor Cortex SWI Hypointensity | |
|---|---|---|---|---|---|---|---|---|---|---|
| SENS | 0.75 | 0.46 | 0.76 | 0.69 | 0.57 | 0.46 | 0.57 | 0.34 | 0.47 | 0.70 |
| SPEC | 0.68 | 0.93 | 0.61 | 0.51 | 0.73 | 0.97 | 0.80 | 0.95 | 0.93 | 0.81 |
| PPV | 0.71 | 0.88 | 0.83 | 0.59 | 0.84 | 0.97 | 0.75 | 0.89 | 0.88 | 0.90 |
| NPV | 0.72 | 0.62 | 0.50 | 0.62 | 0.41 | 0.41 | 0.64 | 0.58 | 0.62 | 0.51 |
| ACC | 0.72 | 0.69 | 0.71 | 0.60 | 0.61 | 0.60 | 0.68 | 0.64 | 0.69 | 0.73 |
© 2020 by the authors. Licensee MDPI, Basel, Switzerland. This article is an open access article distributed under the terms and conditions of the Creative Commons Attribution (CC BY) license (http://creativecommons.org/licenses/by/4.0/).
Share and Cite
Rizzo, G.; Marliani, A.F.; Battaglia, S.; Albini Riccioli, L.; De Pasqua, S.; Vacchiano, V.; Infante, R.; Avoni, P.; Donadio, V.; Passaretti, M.; et al. Diagnostic and Prognostic Value of Conventional Brain MRI in the Clinical Work-Up of Patients with Amyotrophic Lateral Sclerosis. J. Clin. Med. 2020, 9, 2538. https://doi.org/10.3390/jcm9082538
Rizzo G, Marliani AF, Battaglia S, Albini Riccioli L, De Pasqua S, Vacchiano V, Infante R, Avoni P, Donadio V, Passaretti M, et al. Diagnostic and Prognostic Value of Conventional Brain MRI in the Clinical Work-Up of Patients with Amyotrophic Lateral Sclerosis. Journal of Clinical Medicine. 2020; 9(8):2538. https://doi.org/10.3390/jcm9082538
Chicago/Turabian StyleRizzo, Giovanni, Anna Federica Marliani, Stella Battaglia, Luca Albini Riccioli, Silvia De Pasqua, Veria Vacchiano, Rossella Infante, Patrizia Avoni, Vincenzo Donadio, Massimiliano Passaretti, and et al. 2020. "Diagnostic and Prognostic Value of Conventional Brain MRI in the Clinical Work-Up of Patients with Amyotrophic Lateral Sclerosis" Journal of Clinical Medicine 9, no. 8: 2538. https://doi.org/10.3390/jcm9082538
APA StyleRizzo, G., Marliani, A. F., Battaglia, S., Albini Riccioli, L., De Pasqua, S., Vacchiano, V., Infante, R., Avoni, P., Donadio, V., Passaretti, M., Bartolomei, I., Salvi, F., Liguori, R., & on behalf of the BoReALS group. (2020). Diagnostic and Prognostic Value of Conventional Brain MRI in the Clinical Work-Up of Patients with Amyotrophic Lateral Sclerosis. Journal of Clinical Medicine, 9(8), 2538. https://doi.org/10.3390/jcm9082538