Abstract
While there is clear evidence that severe maternal morbidity (SMM) contributes significantly to poor maternal health outcomes, limited data exist on its impact on perinatal outcomes. We undertook a systematic review and meta-analysis to ascertain the association between SMM and adverse perinatal outcomes in high-income countries (HICs). We searched for full-text publications in PubMed, Embase, Cumulative Index of Nursing and Allied Health Literature (CINAHL), and Scopus databases. Studies that reported data on the association of SMM and adverse perinatal outcomes, either as a composite or individual outcome, were included. Two authors independently assessed study eligibility, extracted data, and performed quality assessment using the Newcastle–Ottawa Scale. We used random-effects modelling to calculate odds ratios (ORs) with 95% confidence intervals. We also assessed the risk of publication bias and statistical heterogeneity using funnel plots and Higgins I2, respectively. We defined sub-groups of SMM as hemorrhagic disorders, hypertensive disorders, cardiovascular disorders, hepatic disorders, renal disorders, and thromboembolic disorders. Adverse perinatal outcome was defined as preterm birth (before 37 weeks gestation), small for gestational age (SGA) (birth weight (BW) < 10th centile for gestation), low birthweight (LBW) (BW < 2.5 kg), Apgar score < 7 at 5 min, neonatal intensive care unit (NICU) admission, stillbirth and perinatal death (stillbirth and neonatal deaths up to 28 days). A total of 35 studies consisting of 38,909,426 women were included in the final analysis. SMMs associated with obstetric hemorrhage (OR 3.42, 95% CI: 2.55–4.58), severe hypertensive disorders (OR 6.79, 95% CI: 6.06–7.60), hepatic (OR 3.19, 95% CI: 2.46–4.13) and thromboembolic disorders (OR 2.40, 95% CI: 1.67–3.46) were significantly associated with preterm birth. SMMs from hypertensive disorders (OR 2.86, 95% CI: 2.51–3.25) or thromboembolic disorders (OR 1.48, 95% CI: 1.09–1.99) were associated with greater odds of having SGA infant. Women with severe hemorrhage had increased odds of LBW infant (OR 2.31, 95% CI: 1.57–3.40). SMMs from obstetric hemorrhage (OR 4.16, 95% CI: 2.54–6.81) or hypertensive disorders (OR 4.61, 95% CI: 1.17–18.20) were associated with an increased odds of low 5-min Apgar score and NICU admission (Severe obstetric hemorrhage: OR 3.34, 95% CI: 2.26–4.94 and hypertensive disorders: OR 3.63, 95% CI: 2.63–5.02, respectively). Overall, women with SMM were 4 times more likely to experience stillbirth (OR 3.98, 95% CI: 3.12–7.60) compared to those without SMM with cardiovascular disease (OR 15.2, 95% CI: 1.29–180.60) and thromboembolic disorders (OR 9.43, 95% CI: 4.38–20.29) conferring greatest risk of this complication. The odds of neonatal death were significantly higher in women with SMM (OR 3.98, 95% CI: 2.44–6.47), with those experiencing hemorrhagic (OR 7.33, 95% CI: 3.06–17.53) and hypertensive complications (OR 3.0, 95% CI: 1.78–5.07) at highest risk. Overall, SMM was also associated with higher odds of perinatal death (OR 4.74, 95% CI: 2.47–9.12) mainly driven by the increased risk in women experiencing severe obstetric hemorrhage (OR 6.18, 95% CI: 2.55–14.96). Our results highlight the importance of mitigating the impact of SMM not only to improve maternal health but also to ameliorate its consequences on perinatal outcomes.
1. Introduction
Maternal health is a key determinant of perinatal outcomes and an important indicator of a nation’s overall socioeconomic progress [1]. However, despite consistent and significant improvements in maternal health over the last century, there remains considerable global inequity in obstetric and neonatal health outcomes. Furthermore, although precipitous declines in maternal mortality rates have occurred in many countries, rates of severe maternal morbidity (SMM) have not shown similar improvements and are increasing in some regions, mainly because of high rates of pre-existing co-morbidities, including diabetes and obesity [2]. The causes of maternal morbidity are varied, complex and inter-related. The Maternal Morbidity Working Group led by the World Health Organization (WHO, Geneva, Switzerland) broadly defines it as “any health condition attributed to and/or aggravated by pregnancy and childbirth that has a negative impact on the woman’s wellbeing” [1] and has included this definition into the International Classification of Diseases—11 [3]. In contrast, SMM is usually defined as a “near miss” episode characterized as the near death of a woman surviving pregnancy, or a childbirth-related complication, or within 42 days of the termination of pregnancy [4,5]. The true global burden of SMM is not known and thus poorly understood, primarily because of the lack of a standardized definition as well as, crucially, inconsistent recording and reporting of this outcome [1,6,7,8].
Whilst maternal and perinatal mortality and morbidity are major health issues in low- and middle-income countries, even high-income countries (HICs) are not immune from this issue. In one North American study [9], SMM was approximately 50 times more frequent than maternal mortality, with massive post-partum hemorrhage and complications relating to hypertensive disease in pregnancy common antecedents of severe morbidity [9,10].
Surprisingly, the reduction in maternal mortality rates in HICs is associated with a paradoxical increase in the incidence of SMM which is driven by a combination of factors, including more advanced maternal age at first pregnancy, obesity, chronic medical co-morbidities, and rising rates of operative birth, particularly caesarean section [11]. SMM is now increasingly recognized as an important obstetric care quality indicator for which WHO recommends that HICs should have appropriate surveillance measures in order to identify trends and system failures. SMM is also an important risk factor for adverse perinatal outcomes [10,11,12], although precise estimates of the magnitude of its contributory risks are unclear, despite both sharing many similar causative pathways [13,14]. Against this background, the aim of this systematic review and meta-analysis was to detail the impact of SMM on perinatal outcomes in HICs.
2. Materials and Methods
This systematic review and meta-analysis was registered with the International Prospective Register of Systematic Reviews (PROSPERO) (ID: CRD42019130933) and conducted in accordance with a previously published protocol [15]. We searched PubMed, Embase, Cumulative Index of Nursing and Allied Health Literature (CINAHL), and Scopus using different combinations of key terms and search strategies with no restriction by year of publication (Supplementary File 1). The reference lists of included studies were then checked to identify any additional relevant articles. We included only studies published in English, conducted in HICs and meeting the following criteria: (1) original studies of any design, (2) conducted on women with singleton pregnancies > 20 week’s gestation, (3) presented data/results on the association between SMM (as defined by the WHO maternal near-miss criteria) and adverse perinatal outcomes (either as a composite or by individual outcome) and reported sufficient information to calculate risk estimates. The World Bank’s definition of HICs was used [16]. We excluded studies of women with multiple pregnancy, pregnancies ending before 20 weeks of gestation, systematic reviews, case series/reports, conference papers/abstracts, proceedings, editorial reviews, letter of communications, commentaries, studies with a small sample size (n < 10) and qualitative studies.
Two reviewers independently assessed the eligibility of studies using the Population/participants, Interventions, Comparisons, Outcomes, and Study design (PICOS) framework [17]. The first reviewer (T.S.M) screened all citations by title, abstract and full text. A second reviewer (J.T) independently reviewed the titles, abstracts, and full text of the screened publications for eligibility. Disagreements on the screening and inclusion of studies were discussed and resolved by consensus with the assistance of a third reviewer (S.K). Findings are reported in accordance with the Preferred Reporting Items for Systematic Reviews and Meta-Analyses (PRISMA) guidelines [18].
The methodological quality of the included studies was assessed using the Newcastle–Ottawa scale (NOS) [19]. This tool consists of three domains: selection of study participants, comparability of study groups and reporting and determination of outcomes. Each study was graded out of nine points (separately for case-control and cohort studies) as per the NOS coding manual and summarized in three categories as good (if total score ≥ 7), fair (if total score 5–6) or poor (if total score < 5). Studies were deemed to be at high risk of bias if the NOS score was ≤ 6 [20].
Two authors (T.S.M. and J.T.) extracted study characteristics, the definition of SMM used in the study, details of adverse perinatal outcomes and other key study findings. We defined sub-groups of SMM as hemorrhagic disorders (postpartum hemorrhage, antepartum hemorrhage, bleeding of unknown origin, abnormally invasive placenta, uterine rupture and hysterectomy), hypertensive disorders (severe gestational hypertension, severe preeclampsia, eclampsia and hemolysis, elevated liver enzymes and low platelets (HELLP) syndrome), cardiovascular disorders (ischemic or hemorrhagic stroke, cardiac arrhythmia, peripartum cardiomyopathy and cardiac arrest), hepatic disorders, renal disorders and thromboembolic disorders (amniotic fluid embolism, pulmonary embolism, or deep venous thrombosis). We defined adverse perinatal outcome as: preterm birth (before 37 weeks gestation), small for gestational age (SGA) (birth weight (BW) < 10th centile for gestation), low birthweight (LBW) (BW < 2.5 kg), Apgar score < 7 at 5 min, neonatal intensive care unit (NICU) admission, stillbirth and perinatal death (stillbirth and neonatal deaths up to 28 days).
Statistical Analysis
We used Review Manager Software (RevMan; Version 5.3. Copenhagen: The Nordic Cochrane Centre, The Cochrane Collaboration, 2014) for data entry and statistical analysis. Heterogeneity between studies was assessed using Higgins I2 statistics and considered high if I2 ≥ 50% [21]. Because of the heterogeneity of maternal conditions contributing to SMM, as well as the variability within and between studies, we used the random-effects Mantel–Haenszel method to calculate study-specific and pooled odds ratios (ORs) with 95% confidence intervals. As far as possible, we categorized SMM according to the most likely underlying etiology—hemorrhagic, hypertensive, cardiovascular, hepatic, renal or thromboembolic disorders. The effect of publication bias was assessed using funnel plots. Sub-group analyses were performed according to the presumed etiology of SMM. Sensitivity analyses were performed by sequentially removing studies at high risk of bias to evaluate the impact of SMM on different adverse perinatal outcomes.
3. Results
3.1. Literature Search and Study Selection
The process of study screening, selection and reasons for exclusion are shown in Figure 1. Of the 18,434 studies identified by the initial search, 11,196 (after removing duplicates) were screened by title and 5181 were selected for further abstract screening. Of these, 35 original studies (containing a total of 38,909,426 participants) were eligible for full-text review and used for the final analysis (Table 1).
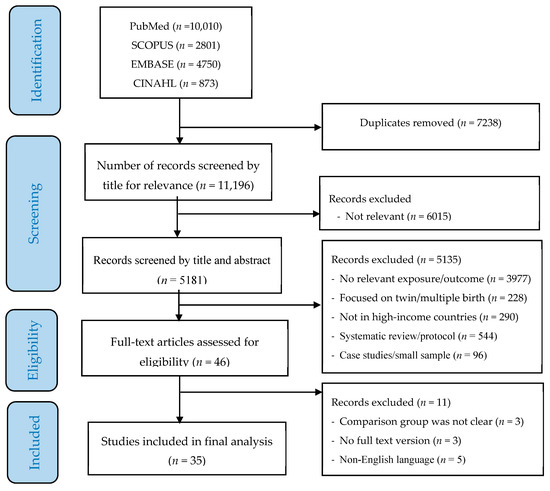
Figure 1.
PRISMA flow diagram of screening and selection process.

Table 1.
Publications included in the systematic review.
3.2. Characteristics of Included Studies and Risk of Bias
The characteristics of all included studies and their overall quality score are summarized in Table 2. Of the 35 studies, 26 [22,23,24,25,26,27,28,29,30,31,32,33,34,35,36,37,38,39,40,41,42,43,44,45,46,47] were population-based cohort studies, 8 were case-control studies [48,49,50,51,52,53,54,55] and 1 study [56] was a cross-sectional study. Fifteen studies were conducted in North America [22,27,28,29,30,33,34,35,39,45,47,50,54,55,56], four each in Australia [23,38,40,42] and Israel [24,41,43,44], three in Canada [31,36,37], two each in Finland [48,51], Sweden [32,46] and the United Kingdom [25,49] and one each in the Netherlands [26], South Korea [53] and Taiwan [52].
Table 2.
Detailed characteristics of included studies and quality rating.
The methodological quality of the studies were rated as: good (21 studies) [23,24,25,26,27,28,34,35,36,37,38,39,40,44,48,49,50,51,52,55,56], fair (11 studies) [22,29,30,31,32,33,42,43,45,46,54] and poor (3 studies) [41,47,53]. Five studies had a NOS score < 6 [22,29,41,47,53] and were deemed to have high risk of bias. Most of the included studies scored high in the participant selection and outcome assessment categories, while most of the variability between studies was in the comparability category shown in Table 2. The pooled global effect, citations and Higgins I2 values for each sub-group of SMM and adverse perinatal outcomes are shown in Table 3.
Table 3.
Adverse perinatal outcomes, number of reports from studies, effect estimate, citations, and heterogeneity.
3.3. Meta-Analysis: Effect of SMM on Adverse Perinatal Outcomes
3.3.1. Preterm Birth
This outcome was reported in 20 studies [22,23,24,25,26,27,29,31,32,34,37,38,40,42,46,47,49,51,52,54]. Overall, women who had SMM were three times more likely to experience preterm birth (OR 3.11; 95% CI: 2.56–3.78). However, the risk of preterm birth was variably influenced depending on the underlying etiology of SMM (Chi2 = 110.58, p < 0.0001, I2 = 95.50%). Obstetric hemorrhage (OR 3.42, 95% CI: 2.55–4.58), hypertensive (OR 6.79, 95% CI: 6.06–7.60), hepatic (OR 3.19, 95% CI: 2.46–4.13) and thromboembolic disorders (OR 2.40, 95% CI: 1.67–3.46) were all associated with increased odds of preterm birth. There was, however, no significant association between SMM and preterm birth for cardiovascular disorders (Figure 2).
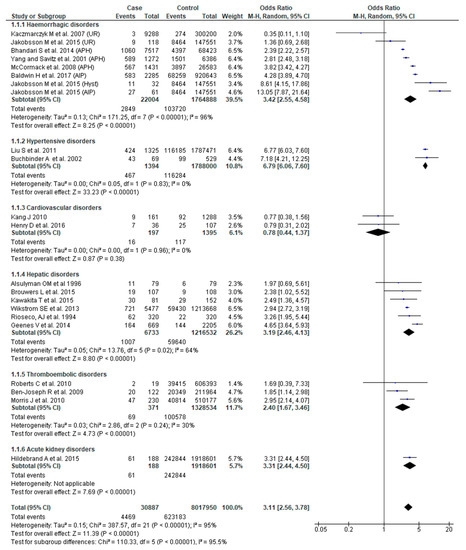
Figure 2.
Forest plot of studies assessing association of Severe maternal morbidity (SMM) and preterm birth.
3.3.2. Small for Gestational Age Infant
SGA as an outcome was reported in 18 studies [22,23,24,26,27,29,30,31,37,40,44,46,47,48,49,50,52,54]. Although the pooled effect of SMM for SGA was not significant (OR 1.33, 95% CI: 0.98–1.81), women who had SMM associated with hypertensive disorders (OR 2.86, 95% CI: 2.51–3.25) or thromboembolic disorders (OR 1.48, 95% CI: 1.09–1.99) had greater odds of having a SGA infant. The effect of SMM on SGA also showed significant sub-group differences (Chi2 = 65.16, p < 0.0001, I2 = 92.30%) (Figure 3).
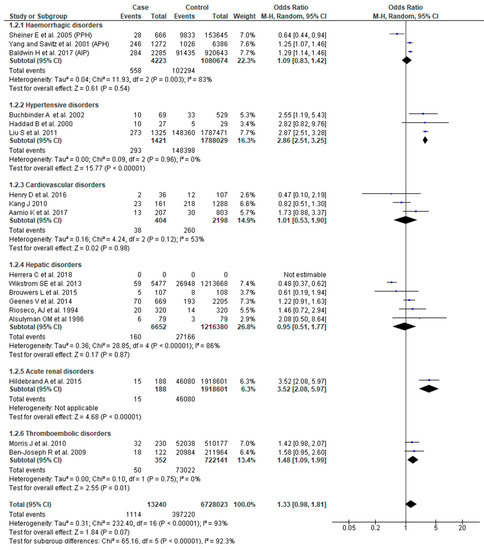
Figure 3.
Forest plot of studies assessing association between SMM and infants being small for gestational age.
3.3.3. Low Birth Weight
The association between SMM and LBW was assessed in 11 studies [23,31,34,38,41,43,44,48,51,52,55]. There was substantial heterogeneity in the results. The pooled effect demonstrated higher odds of LBW in women with SMM (OR 2.20, 95% CI: 1.56–3.09), with only severe hemorrhage exhibiting increased odds of this outcome (OR 2.31, 95% CI: 1.57–3.40) (Figure 4).
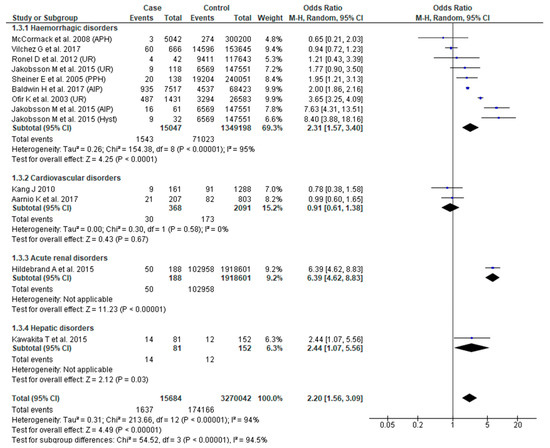
Figure 4.
Forest plot of studies assessing association between Severe maternal morbidity (SMM) and low birth weight.
3.3.4. Five-Minute Apgar Score < 7
Fifteen studies [23,24,28,29,38,41,43,44,45,46,48,49,51,53,54] reported this outcome. Pooled analysis showed higher odds of low 5-min Apgar score (OR 3.66, 95% CI: 2.41–5.56), albeit with considerable study variability (Chi2 = 228.26; I2 = 93%). Based on sub-group analysis, severe obstetric hemorrhage (OR 4.16, 95% CI: 2.54–6.81) and hypertensive disorders (OR 4.61, 95% CI: 1.17–18.20) were associated with increased odds of low 5-min Apgar score (Figure 5).
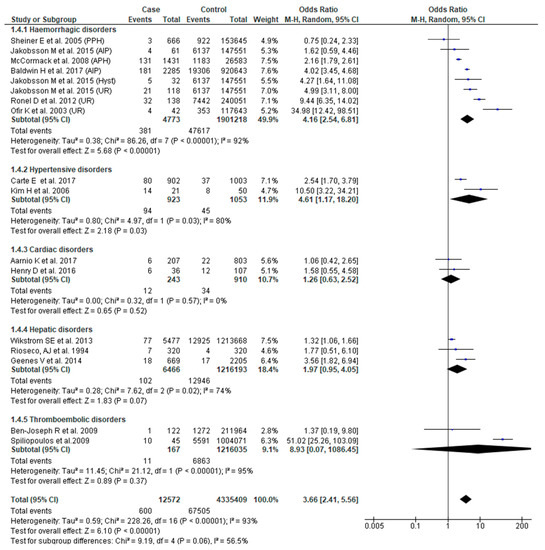
Figure 5.
Forest plot of studies assessing association between SMM and 5-min Apgar score < 7.
3.3.5. Admission to Neonatal Intensive Care Unit
The association between SMM and NICU admission was reported in 14 studies [23,25,26,27,28,29,34,37,38,45,49,51,53,55]. SMM was associated with increased odds of admission to NICU (OR 3.22, 95% CI: 2.45–4.25). There was, however, significant heterogeneity (Chi2 = 340.61; I2 = 97%) and sub-group differences (Chi2 = 30.30, I2 = 86.80%) within the eligible studies. Severe obstetric hemorrhage (OR 3.34, 95% CI: 2.26–4.94), hypertensive (OR 3.63, 95% CI: 2.63–5.02) and hepatic disorders (OR 1.89, 95% CI: 1.11–3.20) were associated with increased odds of NICU admission (Figure 6).
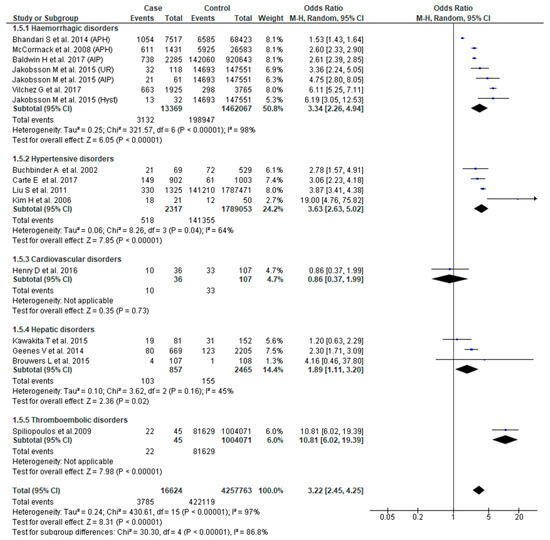
Figure 6.
Forest plot of studies assessing association between Severe maternal morbidity (SMM) and neonatal intensive care unit (NICU) admission.
3.3.6. Stillbirth
Eighteen studies [22,23,25,27,29,31,33,34,37,38,40,42,46,49,51,53,54,56] reported the association between SMM and stillbirth. Women with SMM were about five times more likely to experience stillbirth (OR 4.87, 95% CI: 2.63–9.01) compared to those without SMM. Those with cardiovascular disease (OR 15.24, 95% CI: 1.29–180.60) or acute renal (OR 15.16, 95% CI: 4.41–52.12) or thromboembolic disorders (OR 5.07, 95% CI: 3.12–8.24) had significantly higher odds of this complication (Figure 7).
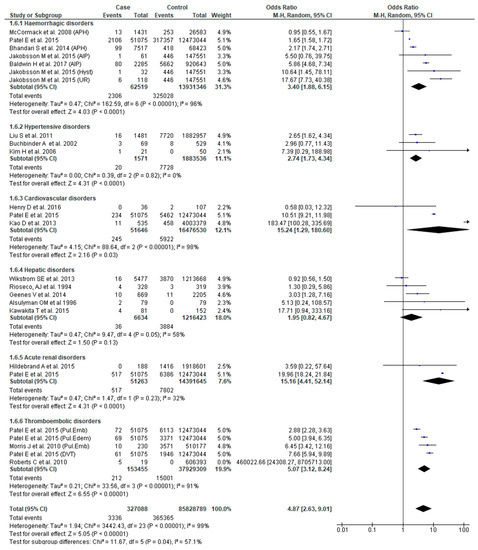
Figure 7.
Forest plot of studies assessing association between Severe maternal morbidity (SMM) and stillbirth.
3.3.7. Neonatal Death
Thirteen studies [23,25,27,28,31,32,37,38,46,50,51,53,54] reported this outcome. The odds of neonatal death were significantly higher in women with SMM (OR 4.02, 95% CI: 2.45–6.59). There was, however, significant study variability (Chi2 = 125.28; I2 = 89%). We also found that the odds of this adverse outcome were greater in women with hemorrhagic (OR 7.33, 95% CI: 3.06–17.53) and hypertensive disorders (OR 3.00, 95% CI: 1.78–5.07). The overall test of sub-group difference was also significant with substantial heterogeneity (Chi2 = 15.33, p = 0.002, I2 = 80.4%) (Figure 8).
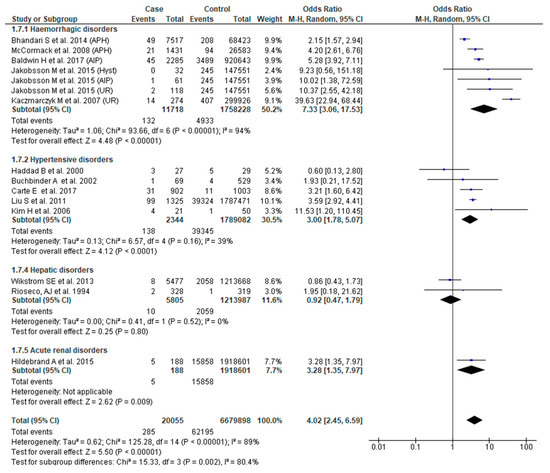
Figure 8.
Forest plot of studies assessing association between Severe maternal morbidity (SMM) and neonatal death.
3.3.8. Perinatal Death
Ten studies [24,26,31,38,41,43,44,48,51,54] reported perinatal death. SMM was associated with higher odds of perinatal death (OR 4.74, 95% CI: 2.47–9.12). There was, however, significant sub-group difference (Chi2 = 10.16, p = 0.04, I2 = 60.60%), as well as substantial heterogeneity (Chi2 = 1.04; Chi2 = 98.75, p < 0.0001); I2 = 89%). Sub-group analysis confirmed that only obstetric hemorrhage was associated with greater odds of perinatal death (OR 6.18, 95% CI: 2.55–14.96) (Figure 9).
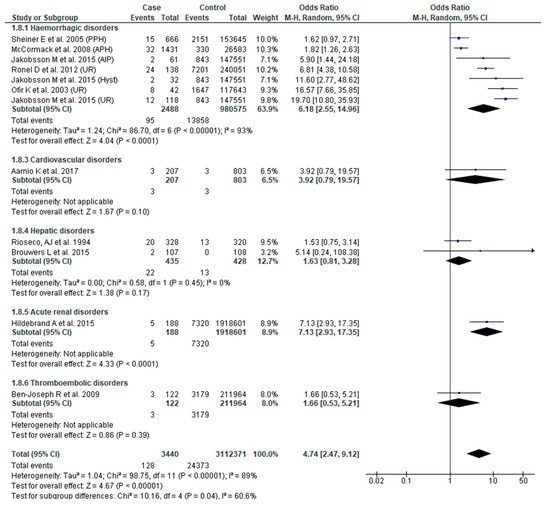
Figure 9.
Forest plot of studies assessing association between Severe maternal morbidity (SMM) and perinatal death.
4. Discussion
The results of this systematic review and meta-analysis clearly show the strong and consistent association between SMM and adverse perinatal outcomes in women with singleton pregnancies in HICs. We found that women who experienced SMM were at significantly greater risk for preterm birth, SGA and LBW infants, low 5-min Apgar score, NICU admission, stillbirth, neonatal death, and overall perinatal death. Although we were unable to compare SMM by country due to the heterogeneity of definitions for SMM, our results are in concordance with other data showing that the association between SMM and adverse perinatal outcome does not appear to be influenced by differences in healthcare systems in these countries [11]. Our results highlight the crucial importance of mitigating SMM through high quality care given its impact not only on maternal health but also its consequences on perinatal outcomes.
Our findings related to the compelling relationship between SMM and stillbirth (OR 4.87, 95% CI: 2.63–9.01) are consistent with another large study from North America [57] which showed that SMM was associated with a significantly higher odds of stillbirth after 23 weeks’ gestation (aOR 7.05, 95% CI: 6.27–7.93), particularly among women with other co-morbidities. There is also evidence that SMM is an independent risk factor for infant mortality (RR 1.39, 95% CI: 1.14–1.70) in very preterm infants, particularly in the first year of life [58].
Our broader results are consistent with other evidence [11] linking maternal morbidity and reproductive outcomes [59], thus highlighting the crucial importance of primary prevention and reducing the burden of SMM to mitigating the burden of SNM [2,60] and its associated consequences [10,12]. It is an imperative that transcends the socioeconomic status of a country. Whilst in many cases, SMM can rapidly develop and escalate, it is vital that healthcare professionals are aware of risk factors that predispose to poor outcomes, particularly in susceptible women. The perinatal risks we highlight are likely to be even more marked and impactful in low- and middle-income countries, and efforts should continue for effective surveillance of SMM rates as a measure of maternal health and perinatal outcome regardless of a nation’s socioeconomic development status. Our results highlight specific perinatal risks associated with a variety of maternal obstetric complications causing SMM and should be of benefit for clinicians. Indeed, there is evidence that almost 40% of cases of SMM are preventable [11].
To ascertain the impact of SMM, robust and ascertainable data are required. The WHO [11] and the American College of Obstetricians and Gynecologists [61] recommend careful surveillance using real-time data, which are sometimes lacking, even in HICs. However, despite these recommendations, there remains uncertainty as to the optimum surrogate indicators for SMM. Some HICs [62,63] have maternity outcome surveillance systems which use regular data updates to identify trends and adverse outcomes associated with SMM. However, although there is acknowledgement of rising rates of SMM [60] and the limitations of current surveillance systems [64], only a few HICs have instituted specific monitoring systems for SMM [62,63]. Developing a universally accepted classification system for SMM [61,65,66,67,68,69] would help in the standardized collection and reporting of important clinical data. In Europe, using hospital discharge data from eight countries, Chantry et al. found that diagnosis codes indicating obstetric hemorrhage, hysterectomy and red cell transfusion were all good candidates for the surveillance of maternal morbidity [70].
Strengths and Limitations
One of the limitations of this review is the use of the WHO near miss criteria to define SMM, as these criteria are not consistently used by all HICs. Furthermore, we limited our analysis to only women with singleton pregnancies, cognizant that multiple pregnancy is an additional risk factor for adverse outcomes. Although the WHO near miss definition is widely accepted, not all HICs use this definition. The EURO-PERISTAT collaboration of 15 European countries defined SMM as a composite of the rates of eclampsia, hysterectomy for postpartum hemorrhage, ICU admission, blood transfusion, and uterine artery embolization [66], whilst the French EPIMOMS study group recommended 17 indicators (some which overlap with the EURO-PERISTAT indicators) specifically for use in HICs [65]. In the United States, a broadly similar list of 18 indicators is used [67,69].
In our systematic review, five studies were at high risk of publication bias, mainly because of a lack of confounder adjustment and comparison group ascertainment [22,29,41,47,53]. We also observed evidence of funnel plot asymmetry in some of the funnel plots. Interpretation of possible publication bias using funnel plots should take into account that funnel plots are crude and subjective [71], and are inaccurate measures [72] of publication bias, where its asymmetry does not necessarily indicate publication bias, and give misleading interpretations [73]. Our sensitivity analyses also demonstrate that the results were not significantly influenced by studies with high a risk of publication bias. We were unable to perform subgroup analysis based on study designs because of data limitations. Additionally, we chose to use odds ratios for our analyses, which may not always reflect the true risks at the population level. However, Viera et al., recommends that either odds ratios or relative risks are equally reliable when assessing rare events such as adverse perinatal outcomes [74].
Sample size variation between studies (64 women [50] to 12,524,119 women [56]) and study design, the use of heterogeneous SMM definitions, differences in participant characteristics and sampling procedures would also have introduced high heterogeneity into our analysis. However, our use of random-effects modeling [75] as well as the use of components within a widely accepted and standard SMM definition mitigates this limitation.
5. Conclusions
This systematic review and meta-analysis provide data demonstrating the robust association between SMM and adverse perinatal outcomes as well as highlighting specific maternal conditions that are risk factors for SMM and adverse perinatal outcomes. Our results also highlight an obvious research gap and emphasize the need for ongoing surveillance in all countries, regardless of socio-economic development status.
Supplementary Materials
The following are available online at https://www.mdpi.com/2077-0383/9/7/2035/s1.
Author Contributions
Conceptualization and methodology: T.S.M. and S.K., Development of search strategy, study screening, data extraction, study quality assessment: T.S.M., and J.M.T., Data Analysis and first draft: T.S.M., Revision of final manuscript: J.F., C.F. and S.K. All authors have read and agreed to the final version of the manuscript.
Funding
This research received no external funding.
Acknowledgments
The authors acknowledge research support from the Mater Foundation and University of Queensland.
Conflicts of Interest
The authors declare no conflict of interest.
References
- Firoz, T.; Chou, R.; Von Dadelszen, P.; Agrawal, P.; Vanderkruik, R.; Tunçalp, Ö.; Magee, L.A.; Broek, N.R.V.D.; Say, L. Measuring maternal health: Focus on maternal morbidity. Bull. World Health Organ. 2013, 91, 794–796. [Google Scholar] [CrossRef] [PubMed]
- Hogan, M.C.; Foreman, K.J.; Naghavi, M.; Ahn, S.Y.; Wang, M.; Makela, S.M.; Lopez, A.; Lozano, R.; Murray, C.J. Maternal mortality for 181 countries, 1980–2008: A systematic analysis of progress towards Millennium Development Goal 5. Lancet 2010, 375, 1609–1623. [Google Scholar] [CrossRef]
- World Health Organization (WHO). ICD-11 for Mortality and Morbidity Statistics (2018); WHO: Geneva, Switzerland, 2018. [Google Scholar]
- Say, L.; Souza, J.P.; Pattinson, R.C. Maternal near miss–Towards a standard tool for monitoring quality of maternal health care. Best Pract. Res. Clin. Obstet. Gynaecol. 2009, 23, 287–296. [Google Scholar] [CrossRef] [PubMed]
- World Health Organization (WHO). Evaluating the Quality of Care for Severe Pregnancy Complications: The WHO Near-Miss Approach for Maternal Health; WHO: Geneva, Switzerland, 2011. [Google Scholar]
- Wahlberg, Å.; Rööst, M.; Haglund, B.; Högberg, U.; Essén, B. Increased risk of severe maternal morbidity (near-miss) among immigrant women in Sweden: A population register-based study. BJOG Int. J. Obstet. Gynaecol. 2013, 120, 1605–1612. [Google Scholar] [CrossRef] [PubMed]
- Say, L.; Pattinson, R.C.; Gülmezoglu, A.M. WHO systematic review of maternal morbidity and mortality: The prevalence of severe acute maternal morbidity (near miss). Reprod. Health 2004, 1. [Google Scholar] [CrossRef]
- Kushwah, B.; Singh, A.; Natung, P. Analysis of various criteria for identification of severe acute maternal morbidity in a rural tertiary health care centre: A prospective one year study. Int. J. Med. Sci. Public Health 2014, 3, 330. [Google Scholar] [CrossRef]
- Creanga, A.A.; Berg, C.J.; Ko, J.Y.; Farr, S.L.; Tong, V.T.; Bruce, F.C.; Callaghan, W.M. Maternal Mortality and Morbidity in the United States: Where Are We Now? J. Women’s Health 2014, 23, 3–9. [Google Scholar] [CrossRef]
- Callaghan, W.M.; Creanga, A.A.; Kuklina, E.V. Severe Maternal Morbidity Among Delivery and Postpartum Hospitalizations in the United States. Obstet. Gynecol. 2012, 120, 1029–1036. [Google Scholar] [CrossRef]
- Geller, S.; Koch, A.R.; Garland, C.E.; Macdonald, E.J.; Storey, F.; Lawton, B. A global view of severe maternal morbidity: Moving beyond maternal mortality. Reprod. Health 2018, 15, 98. [Google Scholar] [CrossRef]
- Geller, S.; Rosenberg, D.; Cox, S.M.; Brown, M.L.; Simonson, L.; Driscoll, C.A.; Kilpatrick, S.J. The continuum of maternal morbidity and mortality: Factors associated with severity. Am. J. Obstet. Gynecol. 2004, 191, 939–944. [Google Scholar] [CrossRef]
- Pires-Menard, A.; Flatley, C.; Kumar, S. Severe neonatal outcomes associated with emergency cesarean section at term. J. Matern. Fetal Neonatal Med. 2019, 1–5. [Google Scholar] [CrossRef] [PubMed]
- Kean, N.; Turner, J.M.; ClinEpi, C.F.M.; Kumar, S. Maternal age potentiates the impact of operative birth on serious neonatal outcomes. J. Matern. Fetal Neonatal Med. 2018, 33, 1–201. [Google Scholar] [CrossRef] [PubMed]
- Mengistu, T.S.; Turner, J.; Flatley, C.; Fox, J.; Kumar, S. Impact of severe maternal morbidity on adverse perinatal outcomes in high-income countries: Systematic review and meta-analysis protocol. BMJ Open 2019, 9, e027100. [Google Scholar] [CrossRef] [PubMed]
- World Bank. New Country Classifications by Income Level: 2017–2018; World Bank: Washington, DC, USA, 2017. [Google Scholar]
- Methley, A.M.; Campbell, S.; Chew-Graham, C.; McNally, R.; Cheraghi-Sohi, S. PICO, PICOS and SPIDER: A comparison study of specificity and sensitivity in three search tools for qualitative systematic reviews. BMC Health Serv. Res. 2014, 14, 579. [Google Scholar] [CrossRef] [PubMed]
- Moher, D.; Liberati, A.; Tetzlaff, J.; Altman, U.G. Preferred Reporting Items for Systematic Reviews and Meta-Analyses: The PRISMA Statement. PLoS Med. 2009, 6, e1000097. [Google Scholar] [CrossRef]
- Wells, G.; Shea, B.; O’connell, D.L.; Peterson, J.; Losos, M.; Tugwell, P.; Ga, S.W.; Zello, G.A.; Petersen, J.; Wells, G.A.; et al. The Newcastle-Ottawa Scale (NOS) for Assessing the Quality of Nonrandomised Studies in Meta-Analyses; Ottawa Hospital Research Institute: Ottawa, ON, Canada, 2009. [Google Scholar]
- McPheeters, M.L.; Kripalani, S.; Peterson, N.B.; Idowu, R.T.; Jerome, R.N.; Potter, S.A.; Andrews, J.C. Closing the Quality Gap: Revisiting the State of the Science (Vol. 3: Quality Improvement Interventions To Address Health Disparities); Agency for Healthcare Research and Quality: Rockville, MD, USA, August 2012; (Evidence Reports/Technology Assessments, No. 208.3.) Appendix G, Thresholds for Quality Assessment; Available online: https://www.ncbi.nlm.nih.gov/books/NBK107322/ (accessed on 1 August 2019).
- Higgins, J.P.T.; Thompson, S.G.; Deeks, J.; Altman, U.G. Measuring inconsistency in meta-analyses. BMJ Br. Med. J. 2003, 327, 557–560. [Google Scholar] [CrossRef]
- Alsulyman, O.M.; Ouzounian, J.G.; Ames-Castro, M.; Goodwin, T. Intrahepatic cholestasis of pregnancy: Perinatal outcome associated with expectant management. Am. J. Obstet. Gynecol. 1996, 175, 957–960. [Google Scholar] [CrossRef]
- Baldwin, H.J.; Patterson, J.A.; Nippita, T.A.C.; Torvaldsen, S.; Ibiebele, I.; Simpson, J.M.; Ford, J. Maternal and neonatal outcomes following abnormally invasive placenta: A population-based record linkage study. Acta Obstet. Gynecol. Scand. 2017, 96, 1373–1381. [Google Scholar] [CrossRef]
- Beniluz, R.; Levy, A.; Wiznitzer, A.; Mazor, M.; Holcberg, G.; Sheiner, E. 499: Pregnancy outcome of patients following deep venous thrombosis. Am. J. Obstet. Gynecol. 2008, 199, S147. [Google Scholar] [CrossRef]
- Bhandari, S.; Raja, E.; Shetty, A.; Bhattacharya, S. Maternal and perinatal consequences of antepartum haemorrhage of unknown origin. BJOG Int. J. Obstet. Gynaecol. 2013, 121, 44–52. [Google Scholar] [CrossRef]
- Brouwers, L.; Koster, M.P.; Page-Christiaens, G.C.; Kemperman, H.; Boon, J.; Evers, I.M.; Bogte, A.; Oudijk, M.A. Intrahepatic cholestasis of pregnancy: Maternal and fetal outcomes associated with elevated bile acid levels. Am. J. Obstet. Gynecol. 2015, 212, 100.e1–100.e7. [Google Scholar] [CrossRef] [PubMed]
- Buchbinder, A.; Sibai, B.M.; Caritis, S.; MacPherson, C.; Hauth, J.; Lindheimer, M.D.; Klebanoff, M.; VanDorsten, P.; Landon, M.; Paul, R.; et al. Adverse perinatal outcomes are significantly higher in severe gestational hypertension than in mild preeclampsia. Am. J. Obstet. Gynecol. 2002, 186, 66–71. [Google Scholar] [CrossRef] [PubMed]
- Carter, E.B.; Conner, S.N.; Cahill, A.G.; Rampersad, R.; Macones, G.A.; Tuuli, M.G. Impact of fetal growth on pregnancy outcomes in women with severe preeclampsia. Pregnancy Hypertens. 2017, 8, 21–25. [Google Scholar] [CrossRef] [PubMed]
- Henry, D.; Harris, I.; Bosco, V.; Killion, M.; Thiet, M.-P.; Bianco, K. Maternal Arrhythmia and Perinatal Outcomes. Obstet. Gynecol. 2014, 123, 56. [Google Scholar] [CrossRef][Green Version]
- Herrera, C.A.; Manuck, T.A.; Stoddard, G.J.; Varner, M.W.; Esplin, S.; Clark, E.A.S.; Silver, R.; Eller, A.G. Perinatal outcomes associated with intrahepatic cholestasis of pregnancy. J. Matern. Fetal Neonatal Med. 2017, 31, 1913–1920. [Google Scholar] [CrossRef]
- Hildebrand, A.M.; Liu, K.; Shariff, S.Z.; Ray, J.G.; Sontrop, J.M.; Clark, W.F.; Hladunewich, M.A.; Garg, A.X. Characteristics and Outcomes of AKI Treated with Dialysis during Pregnancy and the Postpartum Period. J. Am. Soc. Nephrol. 2015, 26, 3085–3091. [Google Scholar] [CrossRef]
- Kaczmarczyk, M.; Sparen, P.; Terry, P.; Cnattingius, S. Risk factors for uterine rupture and neonatal consequences of uterine rupture: A population-based study of successive pregnancies in Sweden. BJOG Int. J. Obstet. Gynaecol. 2007, 114, 1208–1214. [Google Scholar] [CrossRef]
- Kao, D.P.; Hsich, E.; Lindenfeld, J. Characteristics, Adverse Events, and Racial Differences Among Delivering Mothers with Peripartum Cardiomyopathy. JACC Heart Fail. 2013, 1, 409–416. [Google Scholar] [CrossRef]
- Kawakita, T.; Parikh, L.; Reddy, U.; Ramsey, P.; Jelin, A.; Smith, S.; Iqbal, S. 592: Predictors of adverse neonatal outcomes in intrahepatic cholestasis of pregnancy. Am. J. Obstet. Gynecol. 2015, 212, S295. [Google Scholar] [CrossRef][Green Version]
- Kramer, M.S.; Abenhaim, H.; Dahhou, M.; Rouleau, J.; Berg, C. Incidence, Risk Factors, and Consequences of Amniotic Fluid Embolism. Paediatr. Périnat. Epidemiol. 2013, 27, 436–441. [Google Scholar] [CrossRef]
- Kramer, M.S.; Rouleau, J.; Liu, S.; Bartholomew, S.; Joseph, K. Amniotic fluid embolism: Incidence, risk factors, and impact on perinatal outcome. Int. J. Obstet. Gynaecol. 2012, 119, 874–879. [Google Scholar] [CrossRef] [PubMed]
- Liu, S.; Joseph, K.; Liston, R.M.; Bartholomew, S.; Walker, M.; León, J.A.; Kirby, R.S.; Sauve, R.; Kramer, M. Incidence, risk factors, and associated complications of eclampsia. Obstet. Gynecol. 2011, 118, 987–994. [Google Scholar] [CrossRef] [PubMed]
- McCormack, R.A.; Doherty, D.A.; Magann, E.F.; Hutchinson, M.; Newnham, J.P. Antepartum bleeding of unknown origin in the second half of pregnancy and pregnancy outcomes. BJOG Int. J. Obstet. Gynaecol. 2008, 115, 1451–1457. [Google Scholar] [CrossRef]
- McPherson, J.A.; Harper, L.M.; Odibo, A.O.; Roehl, K.A.; Cahill, A.G. Maternal seizure disorder and risk of adverse pregnancy outcomes. Am. J. Obstet. Gynecol. 2013, 208, 378.e1–378.e5. [Google Scholar] [CrossRef]
- Morris, J.M.; Algert, C.; Roberts, C.L. Incidence and risk factors for pulmonary embolism in the postpartum period. J. Thromb. Haemost. 2010, 8, 998–1003. [Google Scholar] [CrossRef] [PubMed]
- Ofir, K.; Sheiner, E.; Levy, A.; Katz, M.; Mazor, M. Uterine rupture: Risk factors and pregnancy outcome. Am. J. Obstet. Gynecol. 2003, 189, 1042–1046. [Google Scholar] [CrossRef]
- Roberts, C.L.; Algert, C.S.; Knight, M.; Morris, J.M. Amniotic fluid embolism in an Australian population-Based cohort. BJOG Int. J. Obstet. Gynecol. 2010, 117, 1417–1421. [Google Scholar] [CrossRef]
- Ronel, D.; Wiznitzer, A.; Sergienko, R.; Zlotnik, A.; Sheiner, E. Trends, risk factors and pregnancy outcome in women with uterine rupture. Arch. Gynecol. Obstet. 2011, 285, 317–321. [Google Scholar] [CrossRef]
- Sheiner, E.; Sarid, L.; Levy, A.; Seidman, D.S.; Hallak, M. Obstetric risk factors and outcome of pregnancies complicated with early postpartum hemorrhage: A population-Based study. J. Matern. Fetal Neonatal Med. 2005, 18, 149–154. [Google Scholar] [CrossRef]
- Spiliopoulos, M.; Puri, I.; Jain, N.J.; Kruse, L.; Mastrogiannis, D.; Dandolu, V. Amniotic fluid embolism-Risk factors, maternal and neonatal outcomes. J. Matern. Fetal Neonatal Med. 2009, 22, 439–444. [Google Scholar] [CrossRef]
- Shemer, E.W.; Marschall, H.; Ludvigsson, J.F.; Stephansson, O. Intrahepatic cholestasis of pregnancy and associated adverse pregnancy and fetal outcomes: A 12-year population-based cohort study. Int. J. Obstet. Gynaecol. 2013, 120, 717–723. [Google Scholar] [CrossRef] [PubMed]
- Yang, J.; Savitz, D.A. The effect of vaginal bleeding during pregnancy on preterm and small-for-Gestational-age births: US National Maternal and Infant Health Survey, 1988. Paediatr. Périnat. Epidemiol. 2001, 15, 34–39. [Google Scholar] [CrossRef] [PubMed]
- Aarnio, K.; Gissler, M.; Grittner, U.; Siegerink, B.; Kaste, M.; Tatlisumak, T.; Tikkanen, M.; Putaala, J. Outcome of pregnancies and deliveries before and after ischaemic stroke. Eur. Stroke J. 2017, 2, 346–355. [Google Scholar] [CrossRef]
- Geenes, V.; Chappell, L.C.; Seed, P.T.; Steer, P.J.; Knight, M.; Williamson, C. Association of Severe Intrahepatic Cholestasis of Pregnancy With Adverse Pregnancy Outcomes: A Prospective Population-Based Case-Control Study. Hepatology 2014, 59, 1482–1491. [Google Scholar] [CrossRef] [PubMed]
- Haddad, B.; Barton, J.R.; Livingston, J.C.; Chahine, R.; Sibai, B.M. HELLP (hemolysis, elevated liver enzymes, and low platelet count) syndrome versus severe preeclampsia: Onset at <or =28.0 weeks’ gestation. Am. J. Obstet. Gynecol. 2000, 183, 1475–1479. [Google Scholar] [PubMed]
- Jakobsson, M.; Tapper, A.-M.; Palomäki, O.; Ojala, K.; Pallasmaa, N.; Ordén, M.-R.; Gissler, M. Neonatal outcomes after the obstetric near-Miss events uterine rupture, abnormally invasive placenta and emergency peripartum hysterectomy—Prospective data from the 2009–2011 Finnish NOSS study. Acta Obstet. Gynecol. Scand. 2015, 94, 1387–1394. [Google Scholar] [CrossRef] [PubMed]
- Kang, J.-H.; Lin, H.-C. Stroke during pregnancy: No increased risk of preterm delivery and low birth weight, a nationwide case-controlled study. J. Neurol. Neurosurg. Psychiatry 2010, 81, 1211–1214. [Google Scholar] [CrossRef]
- Kim, H.Y.; Sohn, Y.S.; Lim, J.H.; Kim, E.H.; Kwon, J.Y.; Park, Y.W.; Kim, Y.-H. Neonatal Outcome after Preterm Delivery in HELLP Syndrome. Yonsei Med. J. 2006, 47, 393–398. [Google Scholar] [CrossRef]
- Rioseco, A.J.; Ivankovic, M.B.; Manzur, A.; Hamed, F.; Kato, S.R.; Parer, J.T.; Germain, A.M. Intrahepatic cholestasis of pregnancy: A retrospective case-control study of perinatal outcome. Am. J. Obstet. Gynecol. 1994, 170, 890–895. [Google Scholar] [CrossRef]
- Vilchez, G.; Dai, J.; Kumar, K.; Lagos, M.; Sokol, R.J. Contemporary analysis of maternal and neonatal morbidity after uterine rupture: A nationwide population-based study. J. Obstet. Gynaecol. Res. 2017, 43, 834–838. [Google Scholar] [CrossRef]
- Patel, E.M.; Goodnight, W.H.; James, A.H.; Grotegut, C. Temporal trends in maternal medical conditions and stillbirth. Am. J. Obstet. Gynecol. 2015, 212, 673.e1–673.e11. [Google Scholar] [CrossRef] [PubMed]
- Lewkowitz, A.K.; Rosenbloom, J.I.; López, J.D.; Keller, M.; Macones, G.A.; Olsen, M.A.; Cahill, A.G. Association Between Stillbirth at 23 Weeks of Gestation or Greater and Severe Maternal Morbidity. Obstet. Gynecol. 2019, 134, 964–973. [Google Scholar] [CrossRef]
- Zeitlin, J.; Egorova, N.N.; Janevic, T.; Hebert, P.L.; Lebreton, E.; Balbierz, A.; Howell, E.A. The Impact of Severe Maternal Morbidity on Very Preterm Infant Outcomes. J. Pediatr. 2019, 215, 56–63.e1. [Google Scholar] [CrossRef] [PubMed]
- Bhutta, Z.A.; Salam, R.A.; Blanc, A.; Donnay, F. Linkages Among Reproductive Health, Maternal Health, and Perinatal Outcomes. Semin. Perinatol. 2010, 34, 434–445. [Google Scholar] [CrossRef] [PubMed]
- Koch, A.R.; Roesch, P.T.; Garland, C.; Geller, S. Implementing Statewide Severe Maternal Morbidity Review. J. Public Health Manag. Pract. 2018, 24. [Google Scholar] [CrossRef] [PubMed]
- Kilpatrick, S.K.; Ecker, J.L. Severe maternal morbidity: Screening and review. Am. J. Obstet. Gynecol. 2016, 215, B17–B22. [Google Scholar] [CrossRef]
- Knight, M. The UK Obstetric Surveillance System. Obstet. Gynaecol. Reprod. Med. 2008, 18, 199–200. [Google Scholar] [CrossRef]
- Halliday, L.E.; Peek, M.J.; Ellwood, D.A.; Homer, C.; Knight, M.; McLintock, C.; Jackson-Pulver, L.; Sullivan, E.A. The Australasian Maternity Outcomes Surveillance System: An evaluation of stakeholder engagement, usefulness, simplicity, acceptability, data quality and stability. Aust. N. Z. J. Obstet. Gynaecol. 2013, 53, 152–157. [Google Scholar] [CrossRef]
- Pollock, W.; Sullivan, E.A.; Nelson, S.; King, J. Capacity to monitor severe maternal morbidity in Australia. Aust. N. Z. J. Obstet. Gynaecol. 2008, 48, 17–25. [Google Scholar] [CrossRef]
- Deneux-Tharaux, C.; Bouvier-Colle, M.-H. 585: Severe acute maternal morbidity in France: The epimoms population-based study. Am. J. Obstet. Gynecol. 2017, 216, S345–S346. [Google Scholar] [CrossRef]
- Bouvier-Colle, M.; Mohangoo, A.; Gissler, M.; Novak-Antolic, Z.; Vutuc, C.; Szamotulska, K.; Zeitlin, J. What about the mothers? An analysis of maternal mortality and morbidity in perinatal health surveillance systems in Europe. BJOG Int. J. Obstet. Gynaecol. 2012, 119, 880–890. [Google Scholar] [CrossRef]
- Creanga, A.A.; Berg, C.J.; Syverson, C.; Seed, K.; Bruce, F.C.; Callaghan, W.M. Race, Ethnicity, and Nativity Differentials in Pregnancy-Related Mortality in the United States. Obstet. Gynecol. 2012, 120, 261–268. [Google Scholar] [CrossRef] [PubMed]
- Roberts, C.L.; Cameron, C.A.; Bell, J.C.; Algert, C.; Morris, J.M. Measuring Maternal Morbidity in Routinely Collected Health Data. Med. Care 2008, 46, 786–794. [Google Scholar] [CrossRef] [PubMed]
- Centers for Disease Control and Prevention. “Severe maternal morbidity indicators and corresponding ICD codes during delivery hospitalizations. Division of Reproductive Health”. National Center for Chronic Disease Prevention and Health Promotion. Available online: https://www.cdc.gov/reproductivehealth/maternalinfanthealth/smm/severe-morbidity-ICD.htm (accessed on 27 December 2019).
- Chantry, A.A.; Berrut, S.; Donati, S.; Gissler, M.; Goldacre, R.; Knight, M.; Maraschini, A.; Monteath, K.; Morris, A.; Teixeira, C.; et al. Monitoring severe acute maternal morbidity across Europe: A feasibility study. Paediatr. Périnat. Epidemiol. 2020, 4, 416–426. [Google Scholar] [CrossRef] [PubMed]
- Murad, M.H.; Chu, H.; Lin, L.; Wang, Z. The effect of publication bias magnitude and direction on the certainty in evidence. BMJ Evid. Based Med. 2018, 23, 84–86. [Google Scholar] [CrossRef]
- Hunter, J.P.; Saratzis, A.; Sutton, A.J.; Boucher, R.H.; Sayers, R.D.; Bown, M.J. In meta-Analyses of proportion studies, funnel plots were found to be an inaccurate method of assessing publication bias. J. Clin. Epidemiol. 2014, 67, 897–903. [Google Scholar] [CrossRef]
- Simmonds, M. Quantifying the risk of error when interpreting funnel plots. Syst. Rev. 2015, 4, 24. [Google Scholar] [CrossRef]
- Viera, A.J. Odds Ratios and Risk Ratios: What’s the Difference and Why Does It Matter? South. Med. J. 2008, 101, 730–734. [Google Scholar] [CrossRef]
- Chess, L.E.; Gagnier, J.J. Applicable or non-applicable: Investigations of clinical heterogeneity in systematic reviews. BMC Med. Res. Methodol. 2016, 16, 19. [Google Scholar] [CrossRef]
© 2020 by the authors. Licensee MDPI, Basel, Switzerland. This article is an open access article distributed under the terms and conditions of the Creative Commons Attribution (CC BY) license (http://creativecommons.org/licenses/by/4.0/).