Multimodal Imaging in the Management of Choroidal Neovascularization Secondary to Central Serous Chorioretinopathy

 , , , and
Abstract
1. Introduction
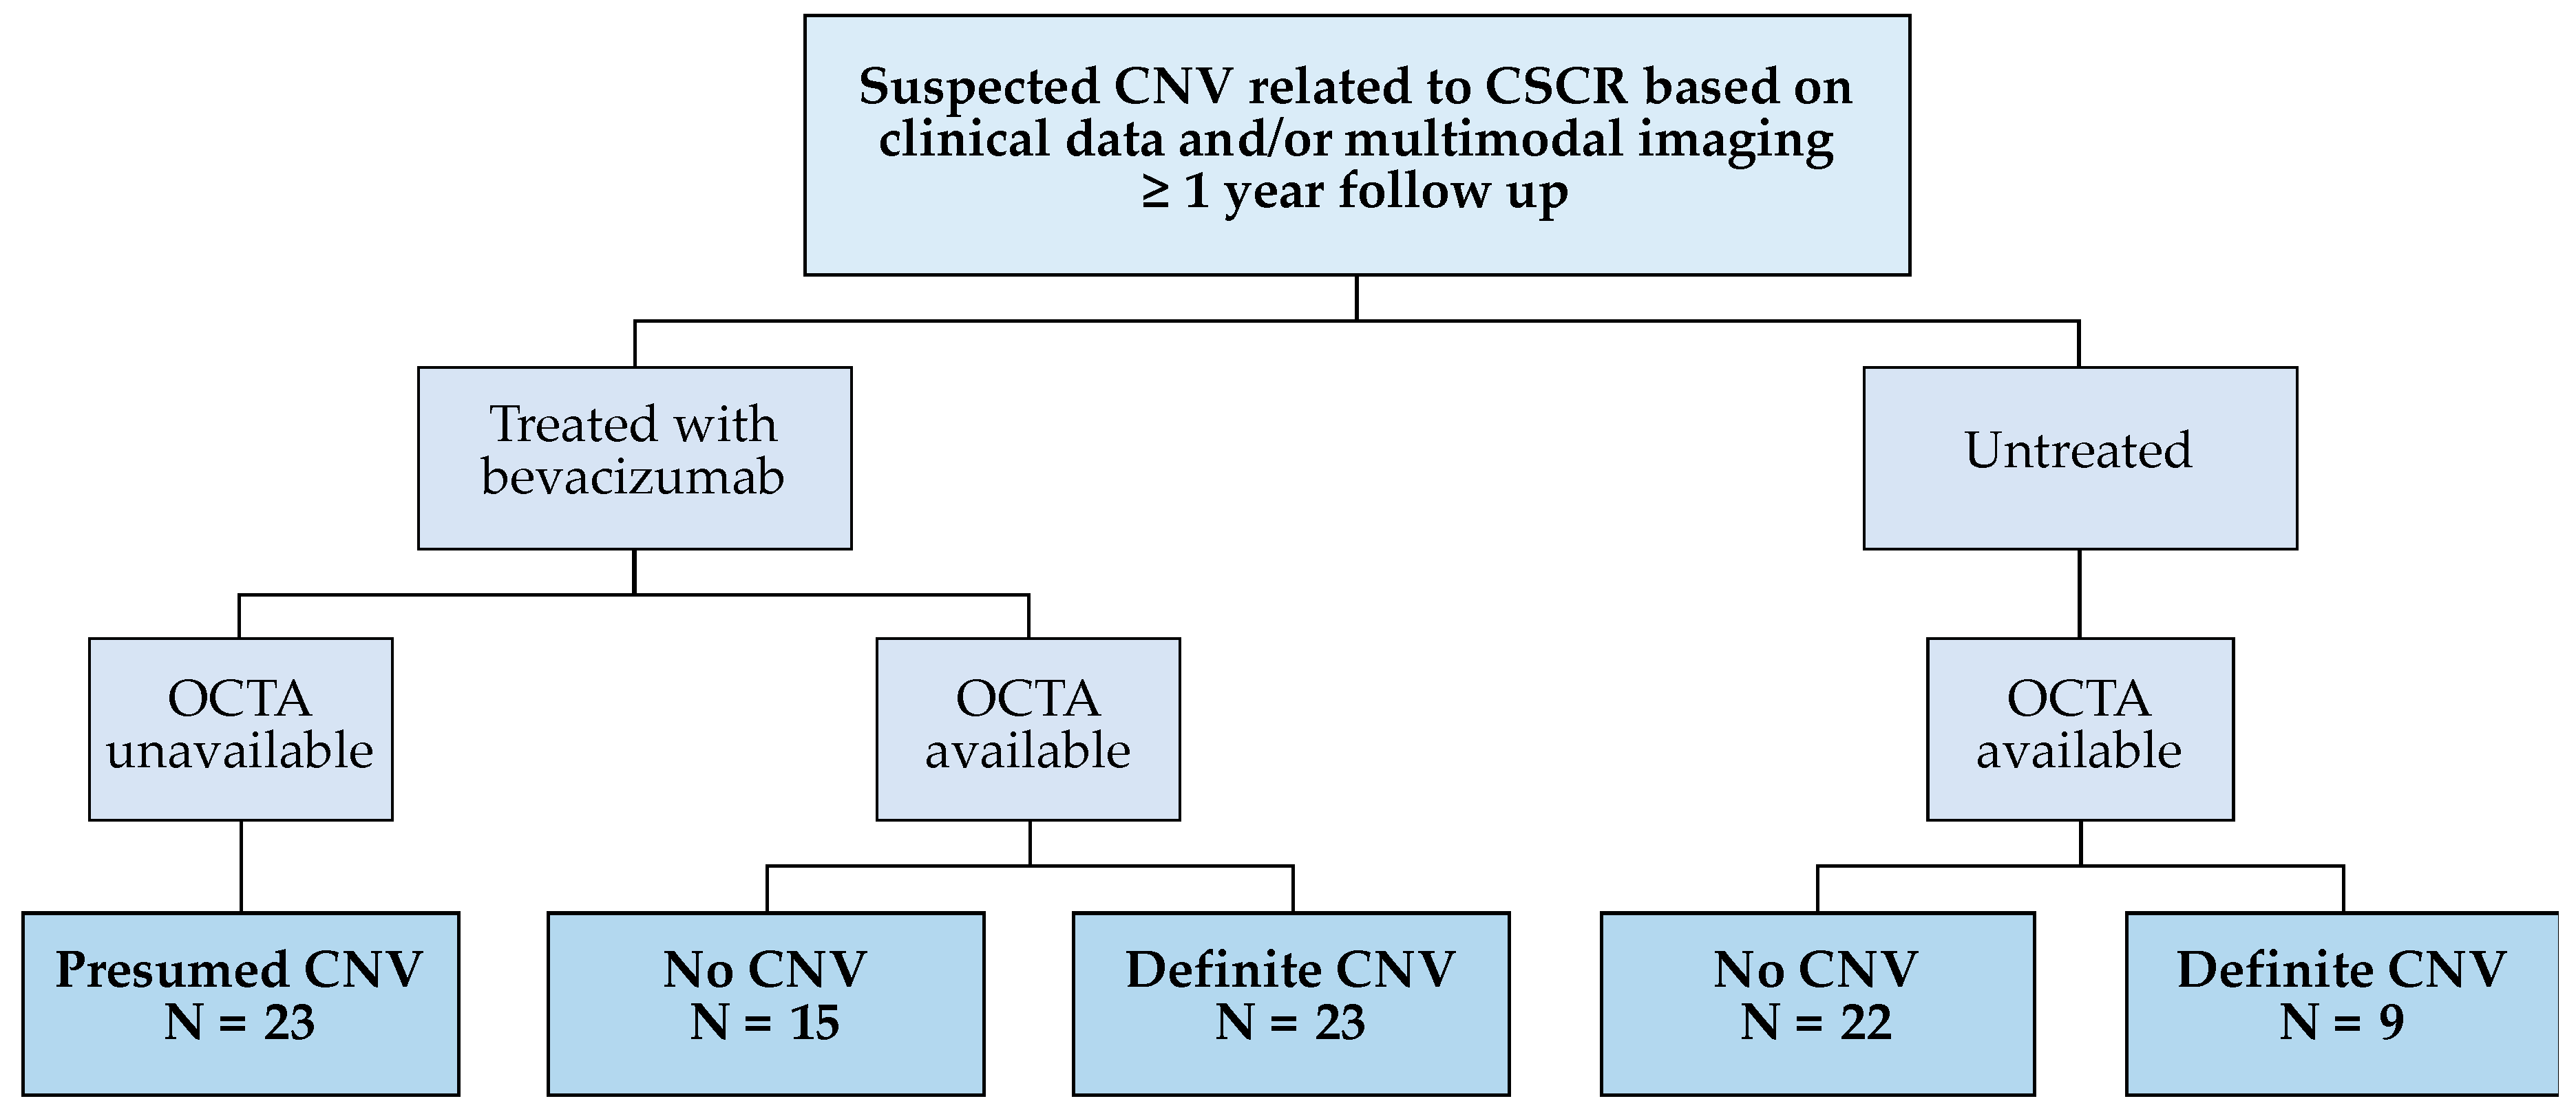
2. Methods
2.1. Study Participants and Clinical Data
2.2. Multimodal Imaging
2.3. Statistical Analysis
3. Results
3.1. Participant Demographics and Clinical Data
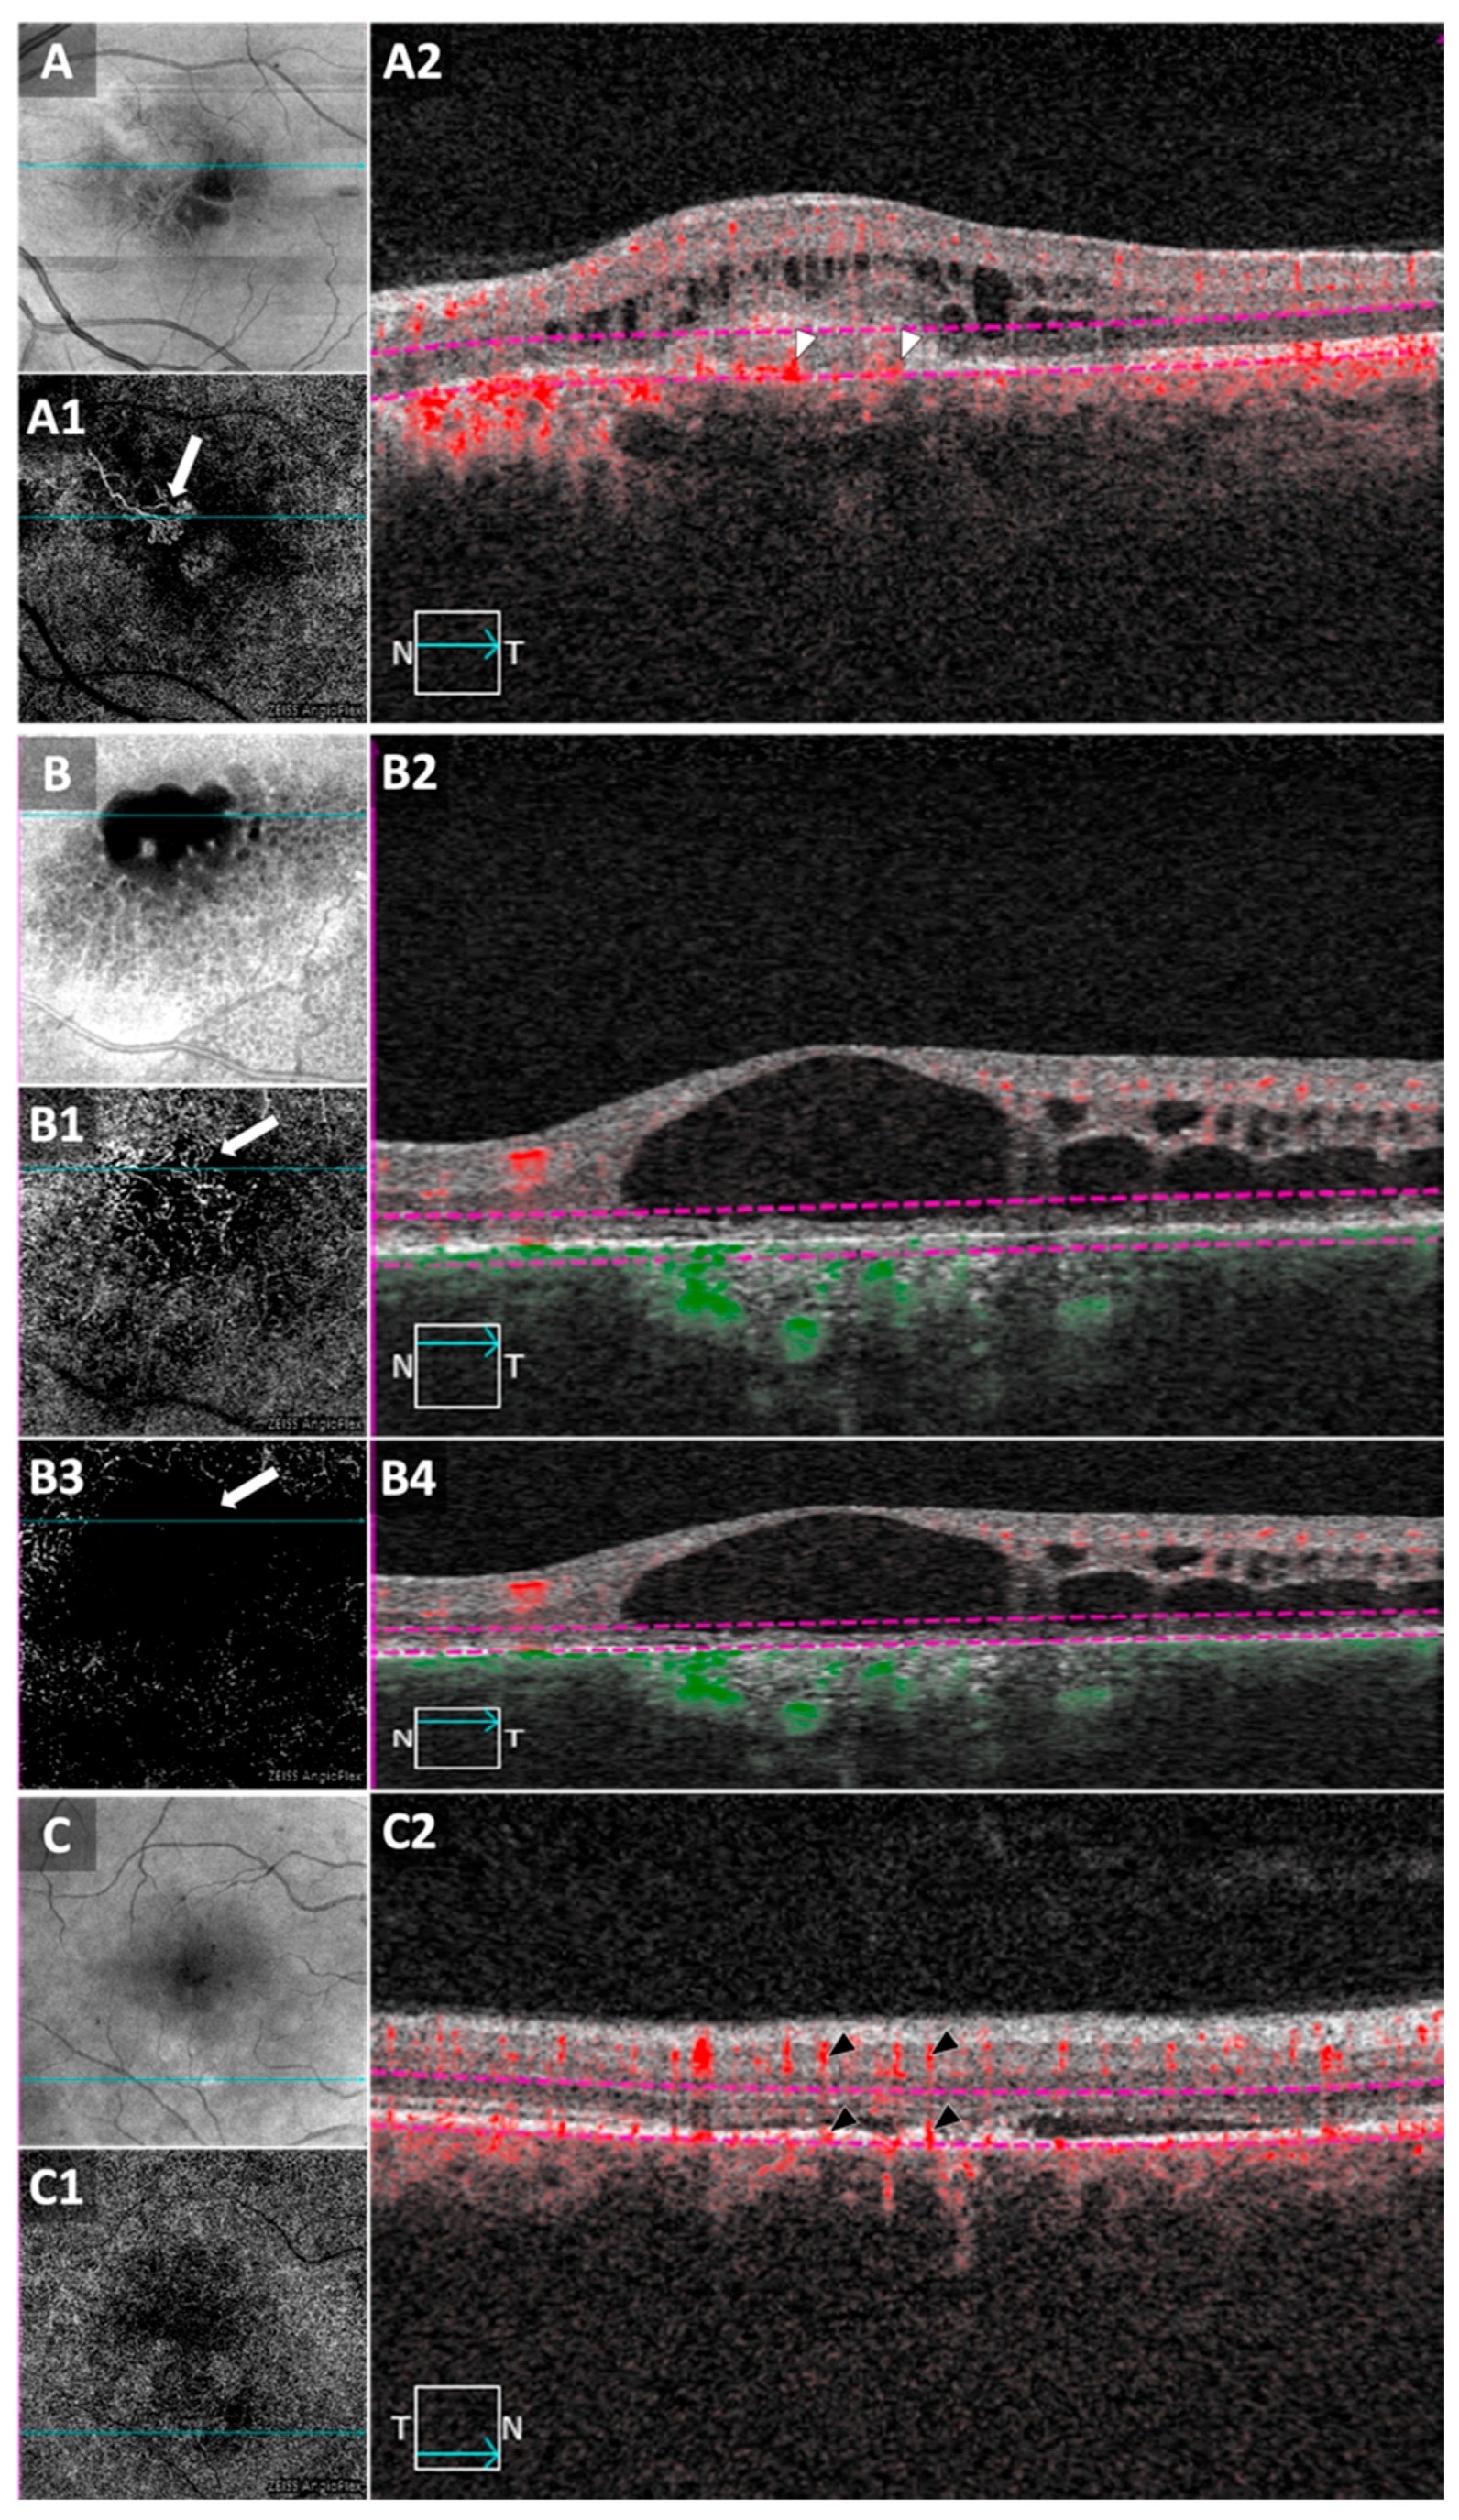
3.2. Inter-Grader Reliability of OCT, FA and OCTA
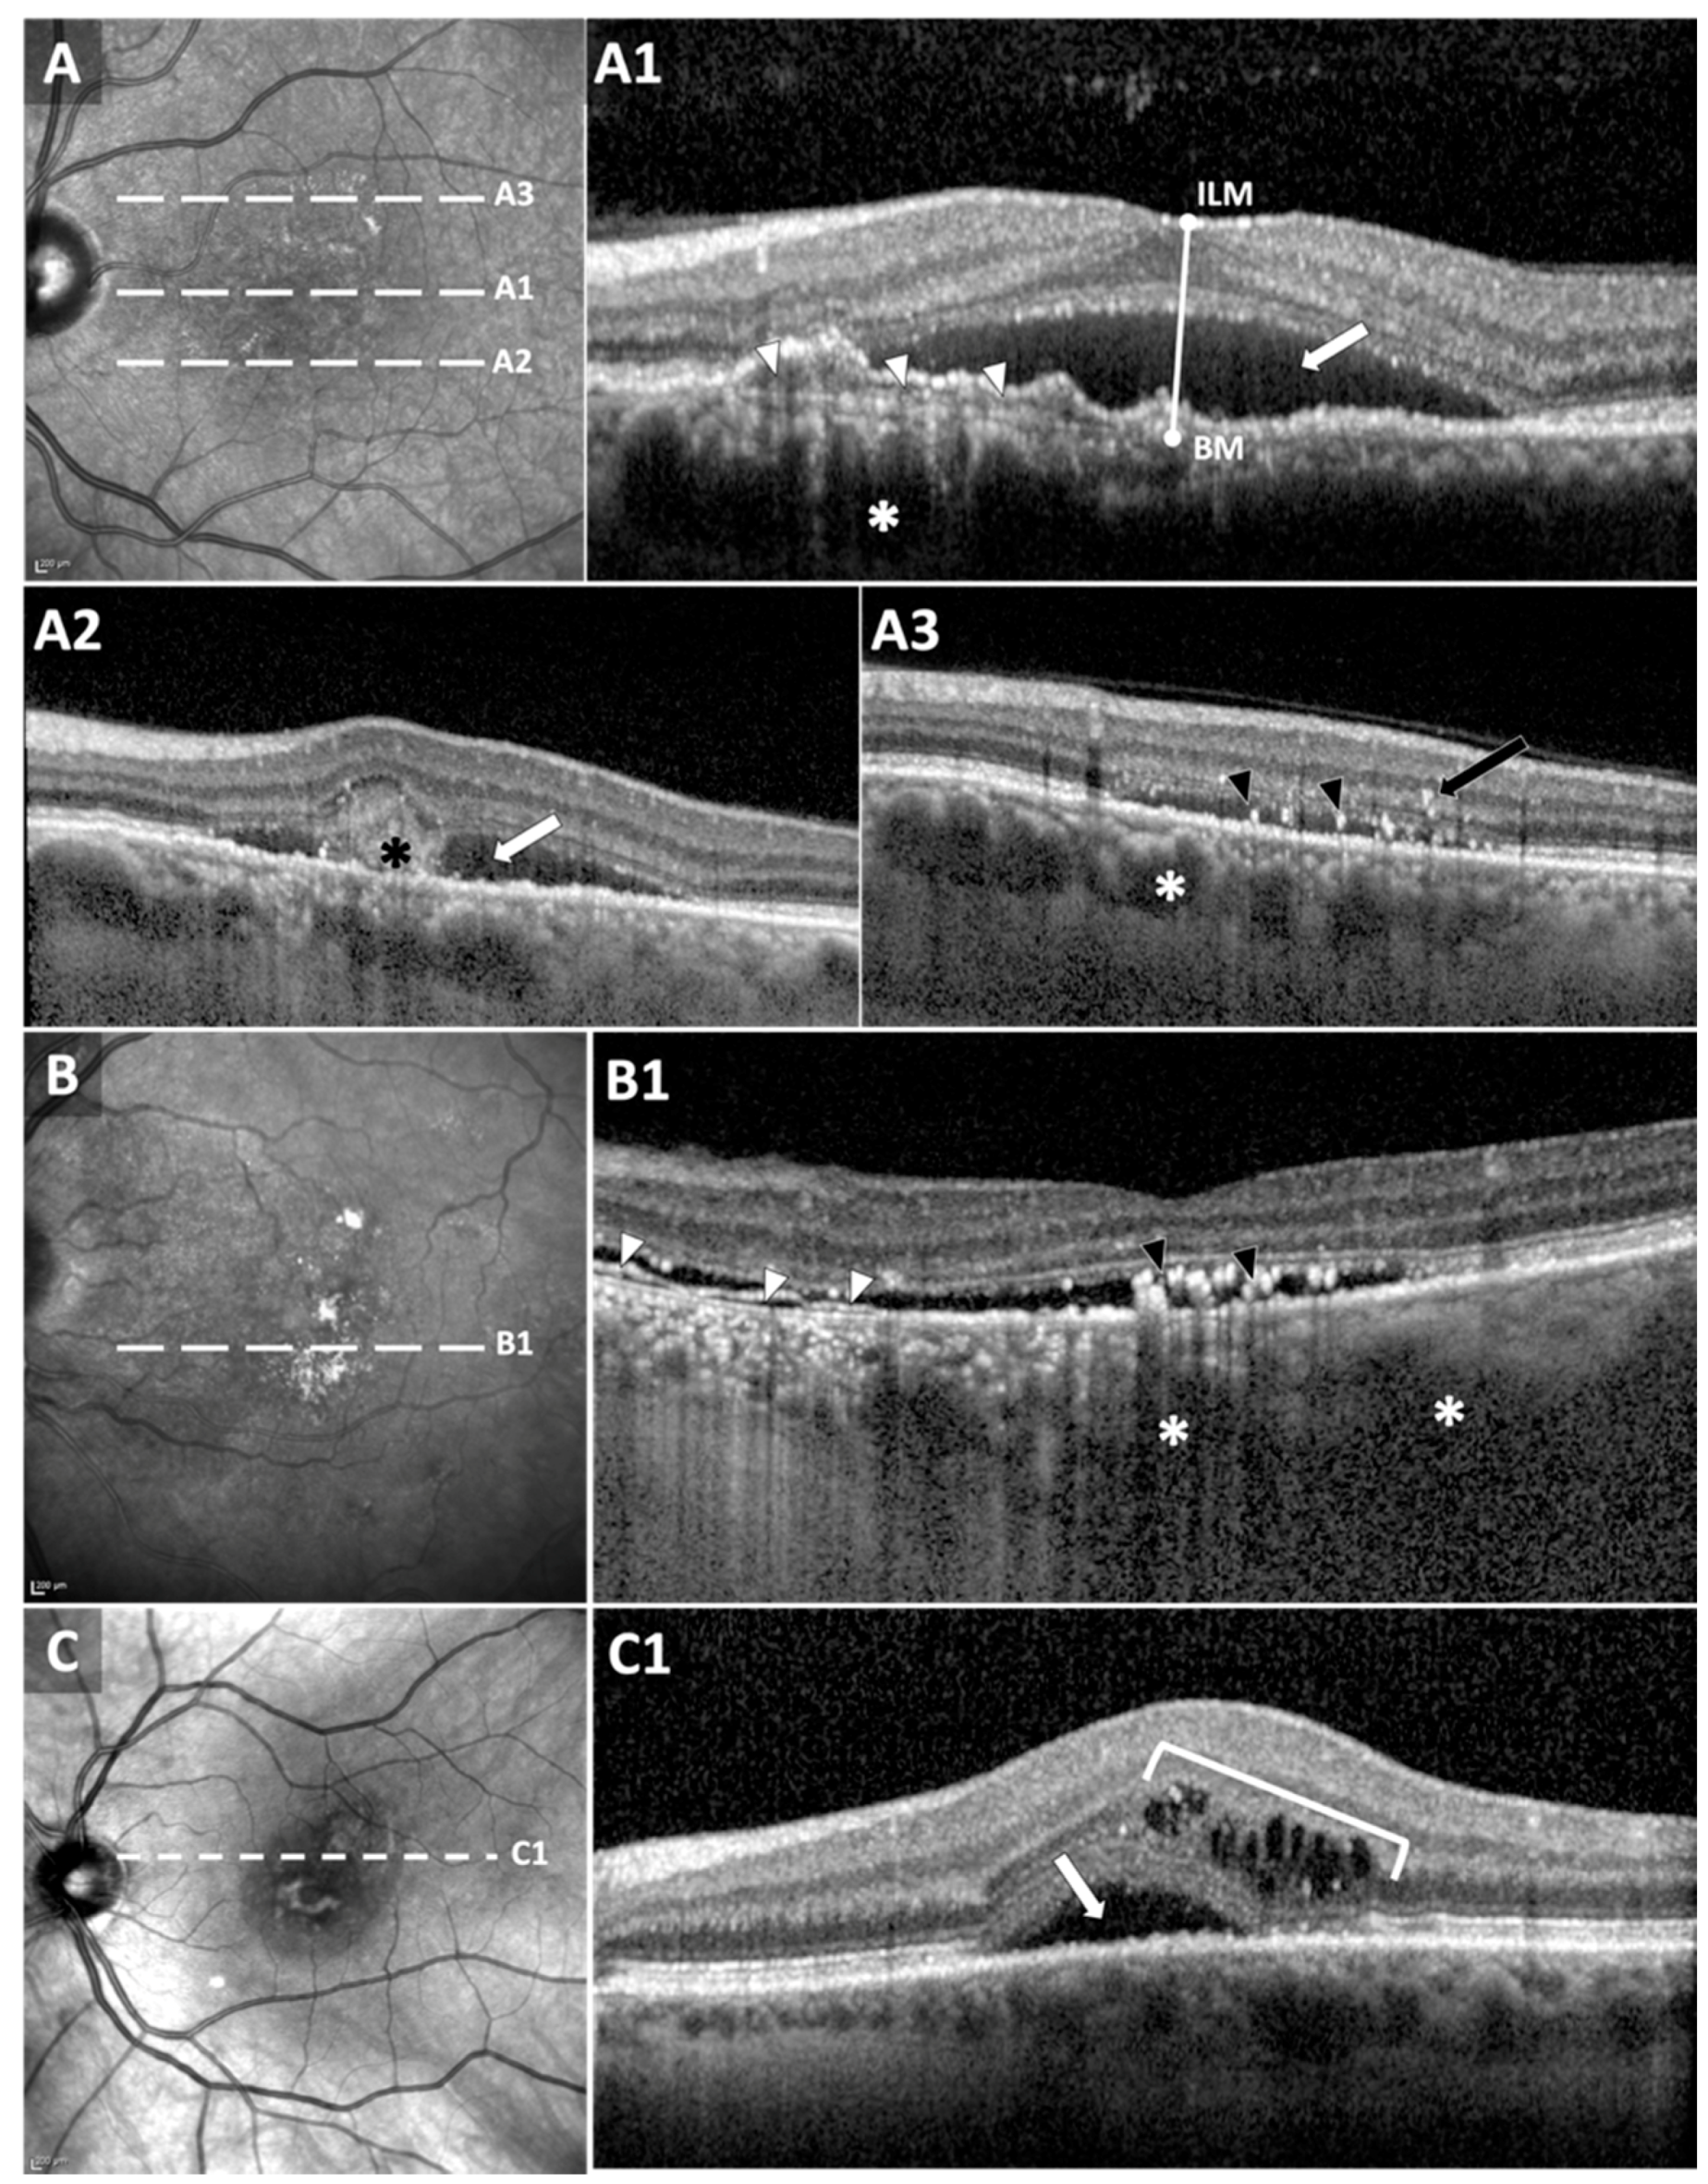
3.3. OCT Biomarkers Predicting Presence of CNV
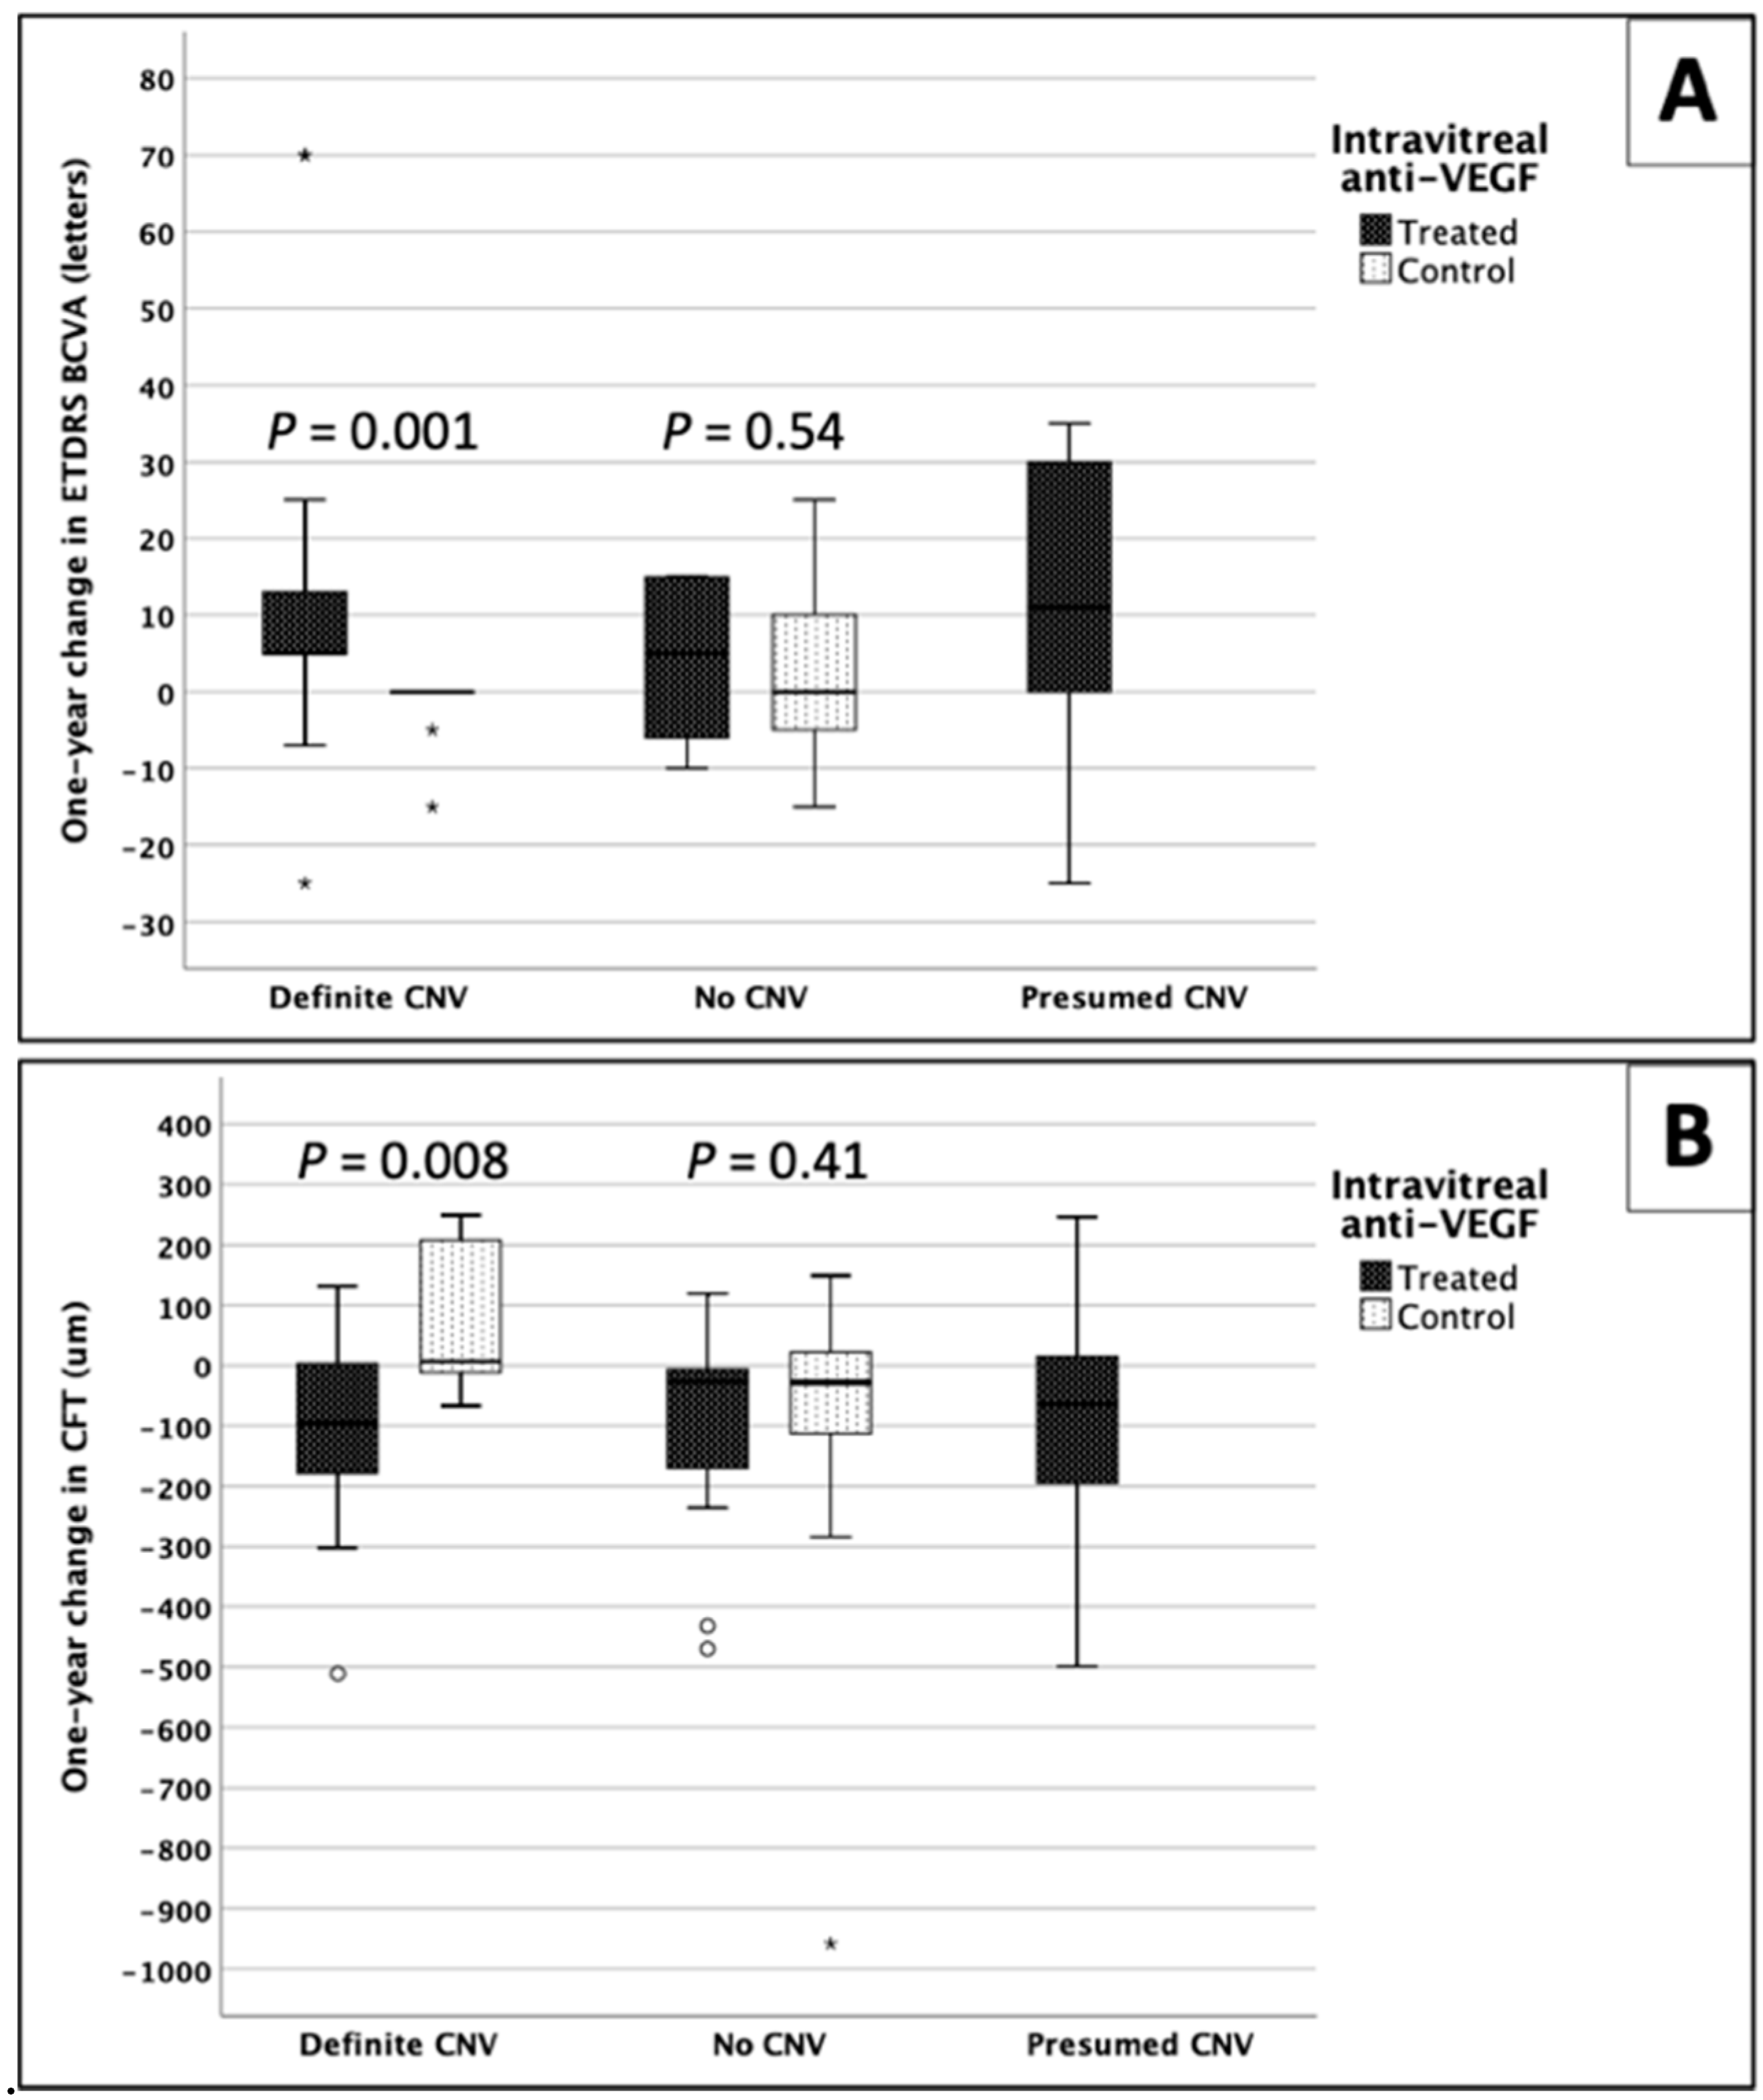
3.4. One-Year Changes in VA and CFT within Groups
3.5. Comparison between Groups
3.6. Predictive Factors of Response to Anti-VEGF Treatment
4. Discussion
Author Contributions
Funding
Acknowledgments
Conflicts of Interest
References
- van Rijssen, T.J.; van Dijk, E.H.C.; Yzer, S.; Ohno-Matsui, K.; Keunen, J.E.E.; Schlingemann, R.O.; Sivaprasad, S.; Querques, G.; Downes, S.M.; Fauser, S.; et al. Central serous chorioretinopathy: Towards an evidence-based treatment guideline. Prog. Retin. Eye Res. 2019, 73, 100770. [Google Scholar] [CrossRef] [PubMed]
- Gass, J.D. Pathogenesis of disciform detachment of the neuroepithelium. Am. J. Ophthalmol. 1967, 63, S1–S139. [Google Scholar]
- Wang, M.; Munch, I.C.; Hasler, P.W.; Prunte, C.; Larsen, M. Central serous chorioretinopathy. Acta Ophthalmol. 2008, 86, 126–145. [Google Scholar] [CrossRef]
- Klein, M.L.; Van Buskirk, E.M.; Friedman, E.; Gragoudas, E.; Chandra, S. Experience with nontreatment of central serous choroidopathy. Arch. Ophthalmol. 1974, 91, 247–250. [Google Scholar] [CrossRef]
- Castro-Correia, J.; Coutinho, M.F.; Rosas, V.; Maia, J. Long-term follow-up of central serous retinopathy in 150 patients. Doc. Ophthalmol. 1992, 81, 379–386. [Google Scholar] [CrossRef] [PubMed]
- Cheung, C.M.G.; Lee, W.K.; Koizumi, H.; Dansingani, K.; Lai, T.Y.Y.; Freund, K.B. Pachychoroid disease. Eye 2019, 33, 14–33. [Google Scholar] [CrossRef] [PubMed]
- Mohabati, D.; van Rijssen, T.J.; van Dijk, E.H.; Luyten, G.P.; Missotten, T.O.; Hoyng, C.B.; Yzer, S.; Boon, C.J. Clinical characteristics and long-term visual outcome of severe phenotypes of chronic central serous chorioretinopathy. Clin. Ophthalmol. 2018, 12, 1061–1070. [Google Scholar] [CrossRef] [PubMed]
- Fung, A.T.; Yannuzzi, L.A.; Freund, K.B. Type 1 (sub-retinal pigment epithelial) neovascularization in central serous chorioretinopathy masquerading as neovascular age-related macular degeneration. Retina 2012, 32, 1829–1837. [Google Scholar] [CrossRef]
- Spaide, R.F.; Campeas, L.; Haas, A.; Yannuzzi, L.A.; Fisher, Y.L.; Guyer, D.R.; Slakter, J.S.; Sorenson, J.A.; Orlock, D.A. Central serous chorioretinopathy in younger and older adults. Ophthalmology 1996, 103, 2070–2079. [Google Scholar] [CrossRef]
- Loo, R.H.; Scott, I.U.; Flynn, H.W., Jr.; Gass, J.D.; Murray, T.G.; Lewis, M.L.; Rosenfeld, P.J.; Smiddy, W.E. Factors associated with reduced visual acuity during long-term follow-up of patients with idiopathic central serous chorioretinopathy. Retina 2002, 22, 19–24. [Google Scholar] [CrossRef]
- Lim, L.S.; Mitchell, P.; Seddon, J.M.; Holz, F.G.; Wong, T.Y. Age-related macular degeneration. Lancet 2012, 379, 1728–1738. [Google Scholar] [CrossRef]
- Grossniklaus, H.E.; Green, W.R. Choroidal neovascularization. Am. J. Ophthalmol. 2004, 137, 496–503. [Google Scholar] [CrossRef] [PubMed]
- Yoshida, T.; Ohno-Matsui, K.; Yasuzumi, K.; Kojima, A.; Shimada, N.; Futagami, S.; Tokoro, T.; Mochizuki, M. Myopic choroidal neovascularization: A 10-year follow-up. Ophthalmology 2003, 110, 1297–1305. [Google Scholar] [CrossRef]
- Lai, T.Y.Y.; Staurenghi, G.; Lanzetta, P.; Holz, F.G.; Melissa Liew, S.H.; Desset-Brethes, S.; Staines, H.; Hykin, P.G.; FRCOphth, on behalf of the MINERVA study group. Efficacy and safety of ranibizumab for the treatment of choroidal neovascularization due to uncommon cause: Twelve-month results of the minerva study. Retina 2018, 38, 1464–1477. [Google Scholar] [CrossRef]
- Chan, W.M.; Lai, T.Y.; Liu, D.T.; Lam, D.S. Intravitreal bevacizumab (avastin) for choroidal neovascularization secondary to central serous chorioretinopathy, secondary to punctate inner choroidopathy, or of idiopathic origin. Am. J. Ophthalmol. 2007, 143, 977–983. [Google Scholar] [CrossRef]
- Peiretti, E.; Ferrara, D.C.; Caminiti, G.; Mura, M.; Hughes, J. Choroidal Neovascularization in Caucasian Patients with Longstanding Central Serous Chorioretinopathy. Retina 2015, 35, 1360–1367. [Google Scholar] [CrossRef]
- Hagag, A.M.; Gao, S.S.; Jia, Y.; Huang, D. Optical Coherence Tomography Angiography: Technical Principles and Clinical Applications in Ophthalmology. Taiwan J. Ophthalmol. 2017, 7, 115. [Google Scholar]
- Amoaku, W.M.; Chakravarthy, U.; Gale, R.; Gavin, M.; Ghanchi, F.; Gibson, J.; Harding, S.; Johnston, R.L.; Kelly, S.P.; Lotery, A.; et al. Defining response to anti-VEGF therapies in neovascular AMD. Eye 2015, 29, 1397–1398. [Google Scholar] [CrossRef]
- Massey, F.J. The Kolmogorov-Smirnov Test for Goodness of Fit. J. Am. Stat. Assoc. 1951, 46, 68–78. [Google Scholar] [CrossRef]
- Sharpe, D. Chi-Square Test is Statistically Significant: Now What? Pract. Assess. Res. Eval. 2015, 20, 8. [Google Scholar]
- Holm, S. A Simple Sequentially Rejective Multiple Test Procedure. Scand. J. Stat. 1979, 6, 65–70. [Google Scholar]
- Teussink, M.M.; Breukink, M.B.; van Grinsven, M.J.; Hoyng, C.B.; Klevering, B.J.; Boon, C.J.; de Jong, E.K.; Theelen, T. OCT Angiography Compared to Fluorescein and Indocyanine Green Angiography in Chronic Central Serous Chorioretinopathy. Investig. Ophthalmol. Vis. Sci. 2015, 56, 5229–5237. [Google Scholar] [CrossRef] [PubMed]
- Bonini Filho, M.A.; de Carlo, T.E.; Ferrara, D.; Adhi, M.; Baumal, C.R.; Witkin, A.J.; Reichel, E.; Duker, J.S.; Waheed, N.K. Association of Choroidal Neovascularization and Central Serous Chorioretinopathy With Optical Coherence Tomography Angiography. JAMA Ophthalmol. 2015, 133, 899–906. [Google Scholar] [CrossRef] [PubMed]
- Dansingani, K.K.; Balaratnasingam, C.; Klufas, M.A.; Sarraf, D.; Freund, K.B. Optical Coherence Tomography Angiography of Shallow Irregular Pigment Epithelial Detachments In Pachychoroid Spectrum Disease. Am. J. Ophthalmol. 2015, 160, 1243–1254. [Google Scholar] [CrossRef]
- Spaide, R.F.; Fujimoto, J.G.; Waheed, N.K. Image Artifacts in Optical Coherence Tomography Angiography. Retina 2015, 35, 2163–2180. [Google Scholar] [CrossRef]
- Chhablani, J.; Mandadi, S.K.R. Commentary: Double-layer sign” on spectral domain optical coherence tomography in pachychoroid spectrum disease. Indian J. Ophthalmol. 2019, 67, 171. [Google Scholar] [CrossRef]
- Lee, G.I.; Kim, A.Y.; Kang, S.W.; Cho, S.C.; Park, K.H.; Kim, S.J.; Kim, K.T. Risk Factors and Outcomes of Choroidal Neovascularization Secondary to Central Serous Chorioretinopathy. Sci. Rep. 2019, 9, 3927. [Google Scholar] [CrossRef]
- Hwang, H.; Kim, J.Y.; Kim, K.T.; Chae, J.B.; Kim, D.Y. Flat irregular pigment epithelium detachment in central serous chorioretinopathy: A form of pachychoroid neovasculopathy? Retina 2019. [Google Scholar] [CrossRef]
- Shi, Y.; Motulsky, E.H.; Goldhardt, R.; Zohar, Y.; Thulliez, M.; Feuer, W.; Gregori, G.; Rosenfeld, P.J. Predictive Value of the OCT Double-Layer Sign for Identifying Subclinical Neovascularization in Age-Related Macular Degeneration. Ophthalmol. Retina 2019, 3, 211–219. [Google Scholar] [CrossRef]
- Narita, C.; Wu, Z.; Rosenfeld, P.J.; Yang, J.; Lyu, C.; Caruso, E.; McGuinness, M.; Guymer, R.H. Structural OCT Signs Suggestive of Subclinical Nonexudative Macular Neovascularization in Eyes with Large Drusen. Ophthalmology 2020, 127, 637–647. [Google Scholar] [CrossRef]
- Sheth, J.; Anantharaman, G.; Chandra, S.; Sivaprasad, S. “Double-layer sign” on spectral domain optical coherence tomography in pachychoroid spectrum disease. Indian J. Ophthalmol. 2018, 66, 1796–1801. [Google Scholar] [CrossRef] [PubMed]
- Liu, T.; Lin, W.; Zhou, S.; Meng, X. Optical coherence tomography angiography of flat irregular pigment epithelial detachments in central serous chorioretinopathy. Br. J. Ophthalmol. 2020. [Google Scholar] [CrossRef] [PubMed]
- Sahoo, N.K.; Govindhari, V.; Bedi, R.; Goud, A.; Singh, R.; Wu, L.; Chhablani, J. Subretinal hyperreflective material in central serous chorioretinopathy. Indian J. Ophthalmol. 2020, 68, 126–129. [Google Scholar] [CrossRef] [PubMed]
- Dansingani, K.K.; Tan, A.C.; Gilani, F.; Phasukkijwatana, N.; Novais, E.; Querques, L.; Waheed, N.K.; Duker, J.S.; Querques, G.; Yannuzzi, L.A.; et al. Subretinal Hyperreflective Material Imaged With Optical Coherence Tomography Angiography. Am. J. Ophthalmol. 2016, 169, 235–248. [Google Scholar] [CrossRef]
- Pokroy, R.; Mimouni, M.; Barayev, E.; Segev, F.; Geffen, N.; Nemet, A.Y.; Segal, O. Prognostic Value of Subretinal Hyperreflective Material in Neovascular Age-Related Macular Degeneration Treated with Bevacizumab. Retina 2018, 38, 1485–1491. [Google Scholar] [CrossRef]
- Shah, V.P.; Shah, S.A.; Mrejen, S.; Freund, K.B. Subretinal hyperreflective exudation associated with neovascular age-related macular degeneration. Retina 2014, 34, 1281–1288. [Google Scholar] [CrossRef]
- McClintic, S.M.; Gao, S.; Wang, J.; Hagag, A.; Lauer, A.K.; Flaxel, C.J.; Bhavsar, K.; Hwang, T.S.; Huang, D.; Jia, Y.; et al. Quantitative Evaluation of Choroidal Neovascularization under Pro Re Nata Anti-Vascular Endothelial Growth Factor Therapy with OCT Angiography. Ophthalmol. Retina 2018. [Google Scholar] [CrossRef]
- Gemenetzi, M.; De Salvo, G.; Lotery, A.J. Central serous chorioretinopathy: An update on pathogenesis and treatment. Eye 2010, 24, 1743–1756. [Google Scholar] [CrossRef]
- Lotery, A.; Sivaprasad, S.; O’Connell, A.; Harris, R.A.; Culliford, L.; Ellis, L.; Cree, A.; Madhusudhan, S.; Behar-Cohen, F.; Chakravarthy, U.; et al. Eplerenone for chronic central serous chorioretinopathy in patients with active, previously untreated disease for more than 4 months (VICI): A randomised, double-blind, placebo-controlled trial. Lancet 2020, 395, 294–303. [Google Scholar] [CrossRef]


| Bevacizumab-Treated | Non-Treated | ||||
|---|---|---|---|---|---|
| Definite CNV | No CNV | Presumed CNV | Definite CNV | No CNV | |
| No. of participants | 22 | 15 | 22 | 9 | 20 |
| Gender | |||||
| Male | 9 | 10 | 13 | 5 | 17 |
| Female | 13 | 5 | 9 | 4 | 3 |
| No. of eyes | 23 | 15 | 23 | 9 | 22 |
| Anti-VEGF regimen | |||||
| 3 Loading doses | 18 | 8 | 10 | NA | NA |
| 1 dose + PRN | 5 | 7 | 13 | NA | NA |
| Age | 60.0 ± 10.9 | 54.1 ± 4.4 | 56.4 ± 14.5 | 64.3 ± 6.6 | 54.1 ± 12.0 |
| Range | 37–76 years | 41–87 years | 31–86 years | 57–77 years | 33–83 years |
| Duration of CSCR | 6.4 ± 5.3 | 5.1 ± 4.4 | 6.2 ± 4.6 | 6.3 ± 4.6 | 5.3 ± 6.4 |
| Range | 2–21 years | 0.16–15 years | 0.42–12 years | 1–9 years | 0.17–20 years |
| History of steroid use | 8 | 7 | 6 | 4 | 8 |
| Previous PDT | 4 | 0 | 2 | 0 | 1 |
| Bevacizumab-Treated | Non-Treated | ||||
|---|---|---|---|---|---|
| Definite CNV | No CNV | Presumed CNV | Definite CNV | No CNV | |
| Central foveal thickness (CFT) (µm) | |||||
| Baseline | 379.0 ± 132.8 | 434.7 ± 157.8 | 432.6 ± 232.2 | 220.3 ± 78.2 | 315.7 ± 212.2 |
| 1-Year | 277.2 ± 83.2 | 323.4 ± 105.4 | 357.0 ± 233.1 | 284.7 ± 114.4 | 228.3 ± 56.9 |
| Difference | −98.5 ± 143.4 | −110.9 ± 175.6 | −86.3 ± 183.8 | 64.3 ± 122.3 | −87.4 ± 223.6 |
| % Change | −20.2 ± 29.1% | −19.6 ± 29.1% | −12.0 ± 49.7% | 36.6 ± 61.4% | −10.7 ± 42.3% |
| p value | 0.03 * | 0.14 | 0.24 | 0.43 | 0.25 |
| Frequency of improvement | 64% | 46% | 52% | 0% | 36% |
| ETDRS BCVA (letters) | |||||
| Baseline | 58.7 ± 22.0 | 59.0 ± 18.2 | 40.7 ± 23.0 | 65.0 ± 13.2 | 65.6 ± 16.0 |
| 1-Year | 70.3 ± 17.0 | 63.1 ± 21.9 | 50.9 ± 29.3 | 62.8 ± 13.7 | 66.9 ± 20.0 |
| Difference | 11.6 ± 20.8 | 3.6 ± 9.6 | 11.8 ± 17.2 | −2.2 ± 5.1 | 1.7 ± 10.8 |
| p value | 0.03 * | 0.21 | 0.09 | 0.18 | 0.52 |
| Frequency of improvement | 78% | 57% | 62% | 0% | 43% |
| Frequency of improvementin either CFT or VA | 96% | 67% | 70% | 0% | 55% |
| Baseline OCT biomarkers | |||||
| SIRE | 86% | 46% | 83% | 89% | 45% |
| Sub-RPE hyperreflectivity | 82% | 23% | 66% | 89% | 27% |
| Sub-RPE hyporeflectivity | 4% | 23% | 17% | 0% | 18% |
| Subretinal fluid | 91% | 77% | 91% | 67% | 86% |
| Intraretinal hyperreflective foci | 55% | 46% | 61% | 11% | 23% |
| Subretinal hyperreflective foci | 82% | 85% | 87% | 44% | 82% |
| Subretinal hyperreflective material | 77% | 62% | 87% | 33% | 23% |
| Intraretinal cysts | 14% | 54% | 65% | 22% | 9% |
| Pachychoroid | 91% | 92% | 87% | 89% | 100% |
| ETDRS VA | CFT | |
|---|---|---|
| Mean change after 1 year (p value, Mann–Whitney U test) | ||
| Treated “definite CNV” vs. non-treated “definite CNV” | 0.001 * | 0.008 * |
| Treated “no CNV” vs. non-treated “no CNV” | 0.54 | 0.41 |
| Treated “presumed CNV” vs. treated “no CNV” | 0.13 | 0.99 |
| Treated “presumed CNV” vs. treated “definite CNV” | 0.59 | 0.79 |
| Frequency of improvement (p value, Pearson’s Chi-square test; and z score) | ||
| All groups | 0.001 * | 0.021 * |
| Treated “definite CNV” | 2.7 * | 2.0 * |
| Treated “no CNV” | 0.2 | 0.1 |
| Treated “presumed CNV” | 0.8 | 0.8 |
| Non-treated “definite CNV” | −3.5 * | −2.9 * |
| Non-treated “no CNV” | −1.2 | −0.9 |
© 2020 by the authors. Licensee MDPI, Basel, Switzerland. This article is an open access article distributed under the terms and conditions of the Creative Commons Attribution (CC BY) license (http://creativecommons.org/licenses/by/4.0/).
Share and Cite
Hagag, A.M.; Chandra, S.; Khalid, H.; Lamin, A.; Keane, P.A.; Lotery, A.J.; Sivaprasad, S. Multimodal Imaging in the Management of Choroidal Neovascularization Secondary to Central Serous Chorioretinopathy. J. Clin. Med. 2020, 9, 1934. https://doi.org/10.3390/jcm9061934
Hagag AM, Chandra S, Khalid H, Lamin A, Keane PA, Lotery AJ, Sivaprasad S. Multimodal Imaging in the Management of Choroidal Neovascularization Secondary to Central Serous Chorioretinopathy. Journal of Clinical Medicine. 2020; 9(6):1934. https://doi.org/10.3390/jcm9061934
Chicago/Turabian StyleHagag, Ahmed M., Shruti Chandra, Hagar Khalid, Ali Lamin, Pearse A. Keane, Andrew J. Lotery, and Sobha Sivaprasad. 2020. "Multimodal Imaging in the Management of Choroidal Neovascularization Secondary to Central Serous Chorioretinopathy" Journal of Clinical Medicine 9, no. 6: 1934. https://doi.org/10.3390/jcm9061934
APA StyleHagag, A. M., Chandra, S., Khalid, H., Lamin, A., Keane, P. A., Lotery, A. J., & Sivaprasad, S. (2020). Multimodal Imaging in the Management of Choroidal Neovascularization Secondary to Central Serous Chorioretinopathy. Journal of Clinical Medicine, 9(6), 1934. https://doi.org/10.3390/jcm9061934