The Effect of Cellular Coenzyme Q10 Deficiency on Lysosomal Acidification

 , , and
Abstract
1. Introduction
2. Materials and Methods
2.1. Cell Culture
2.2. CoQ10 Quantification
2.3. Total Protein Analysis
2.4. CoQ10 Treatment
2.5. Lysosomal pH Measurements
2.6. LysoTracker
2.7. LysoSensor
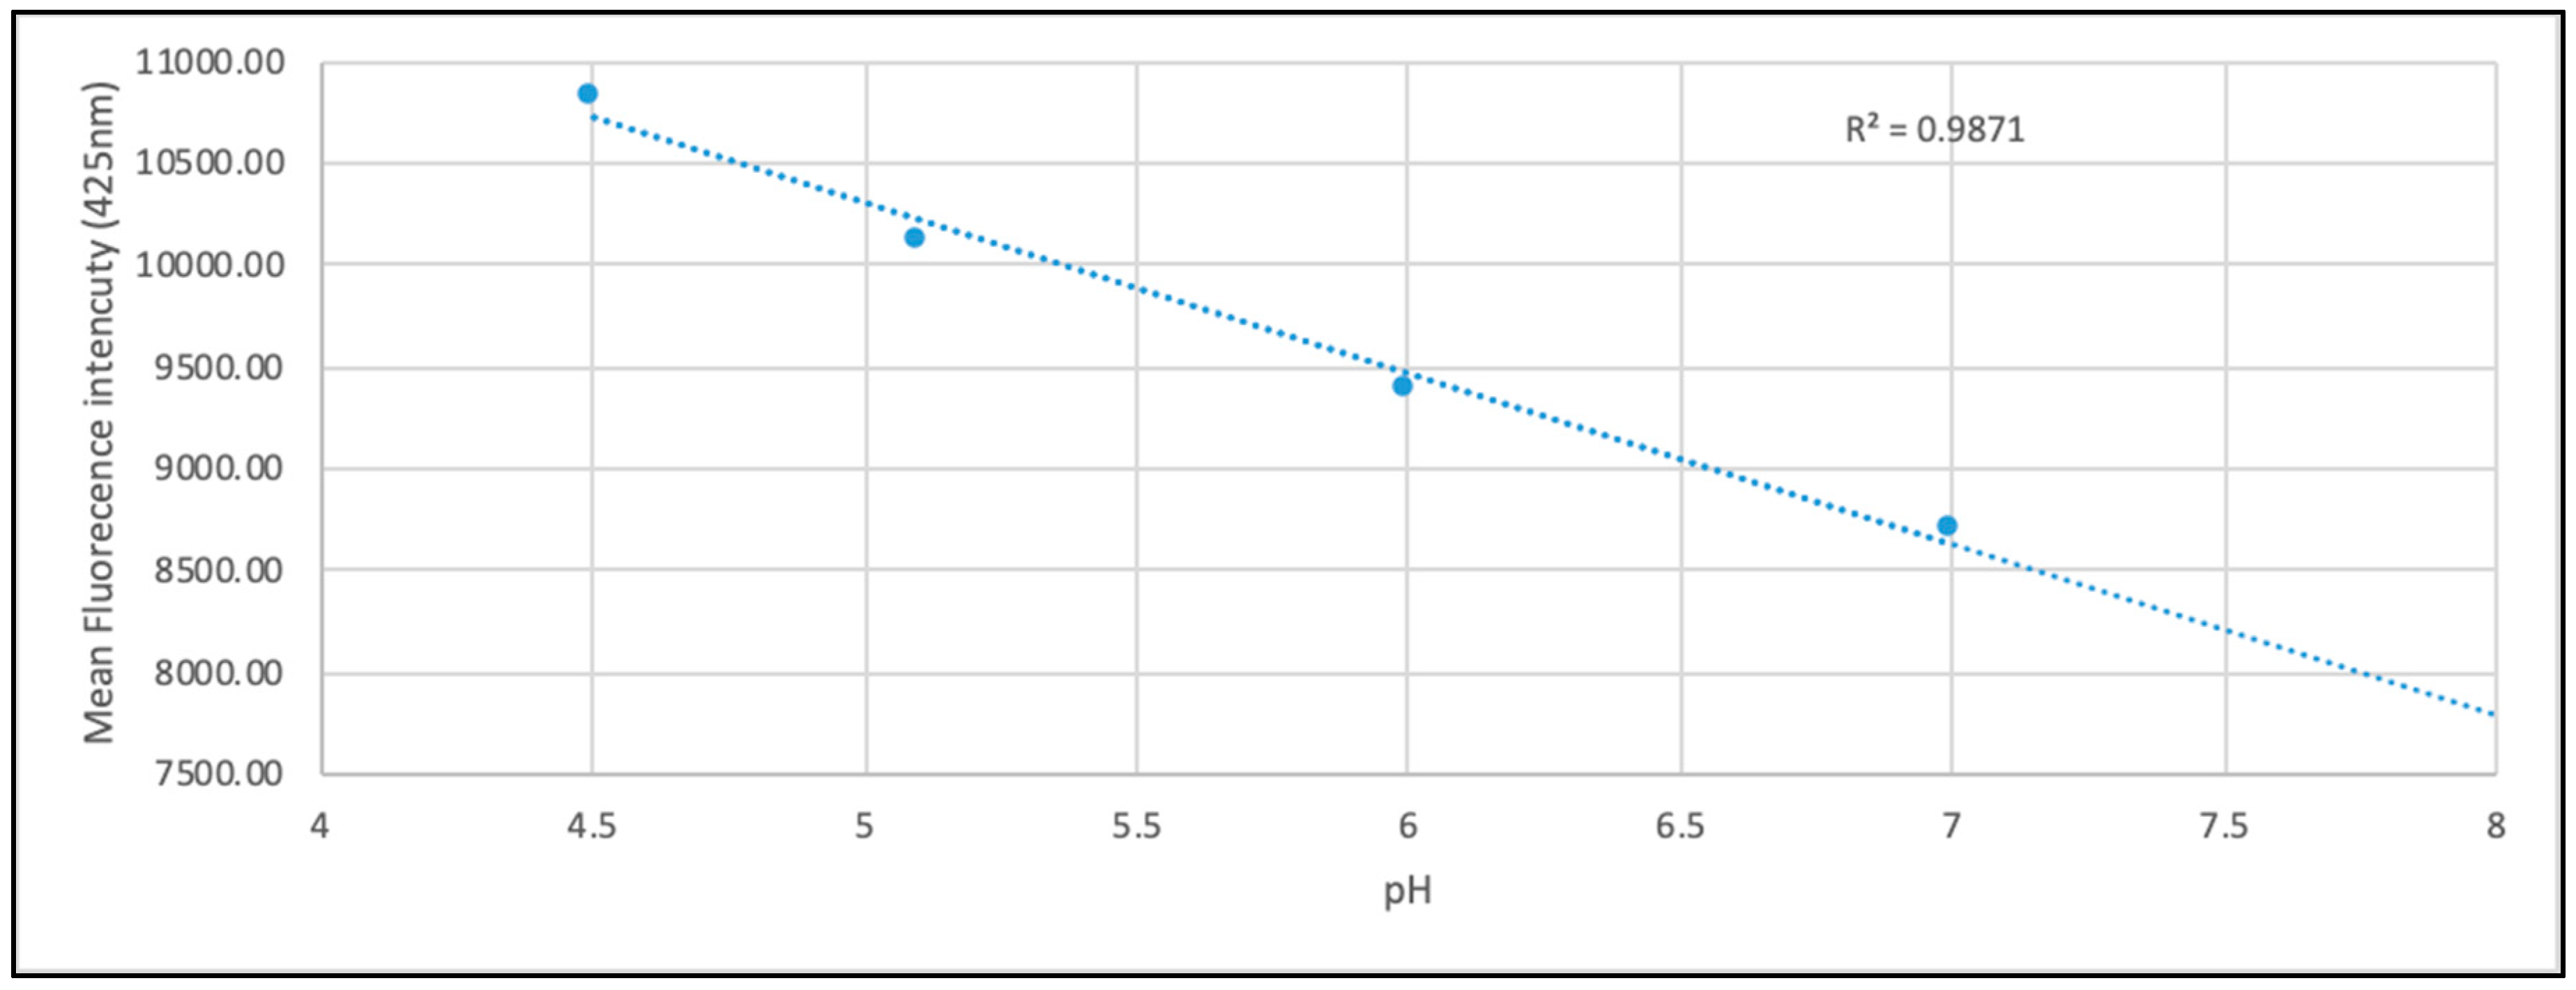
2.8. PH Calibration
2.9. Imaging Probes
2.10. Statistical Analysis
3. Results
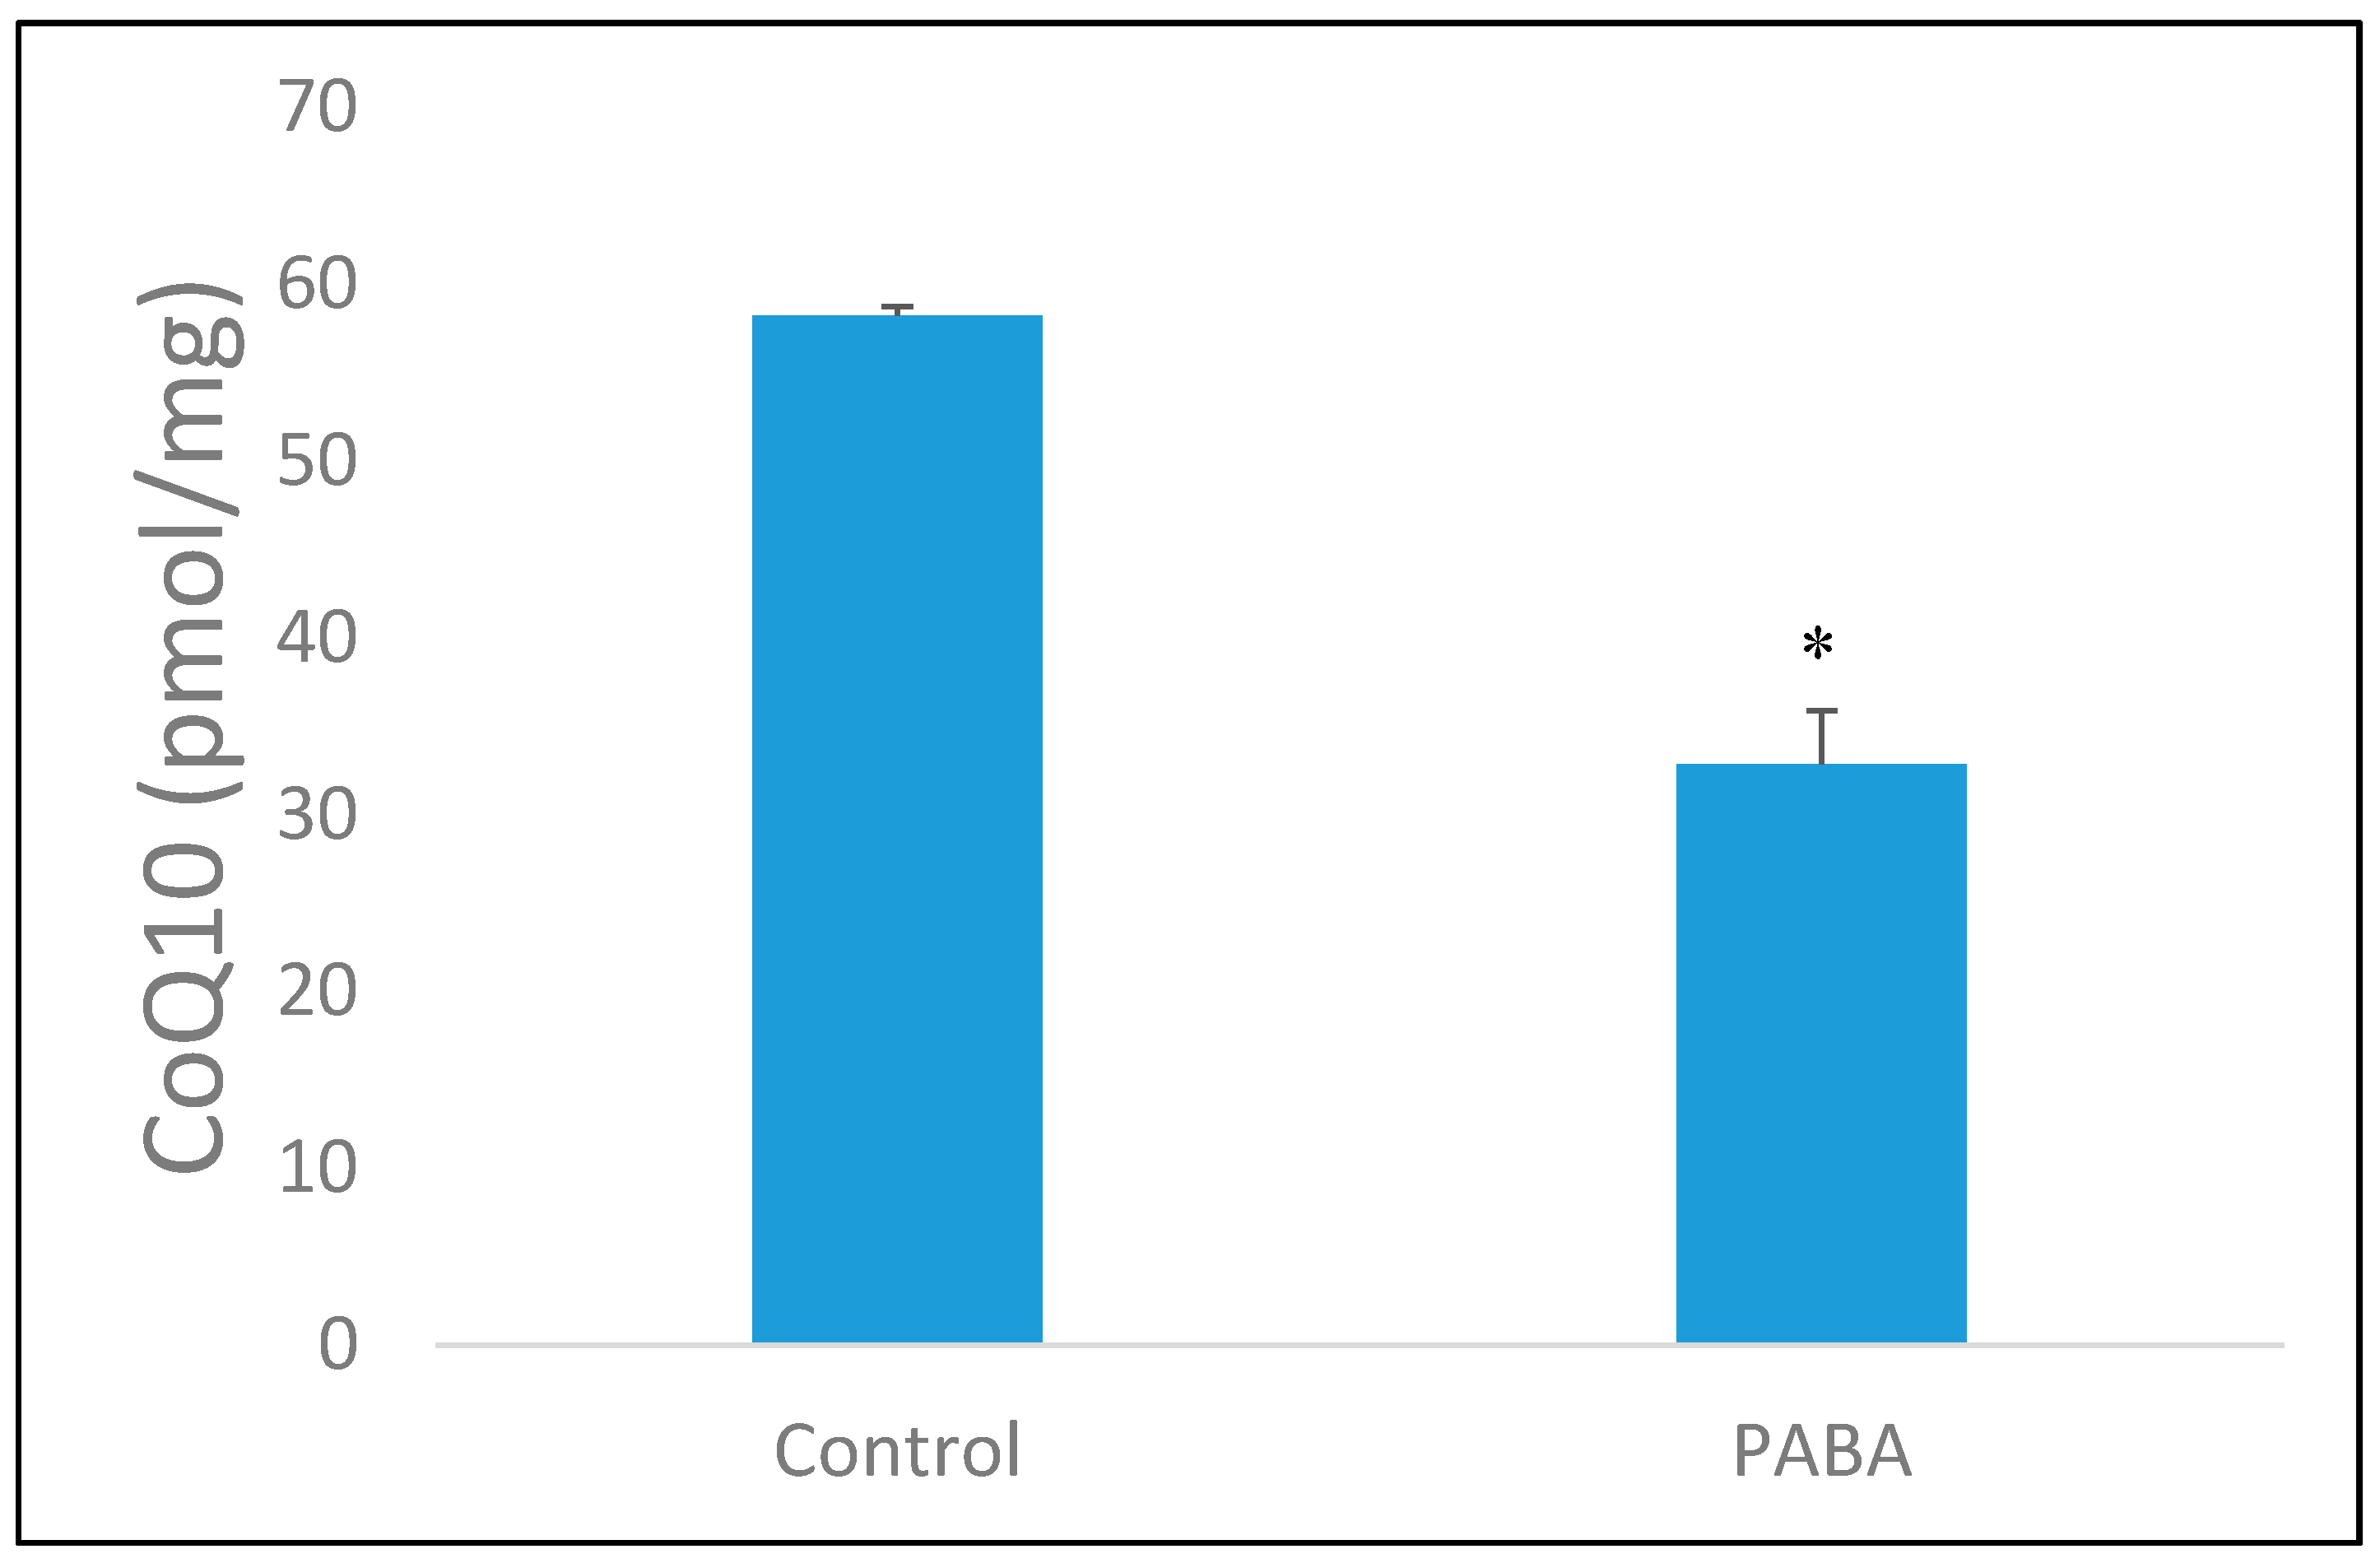
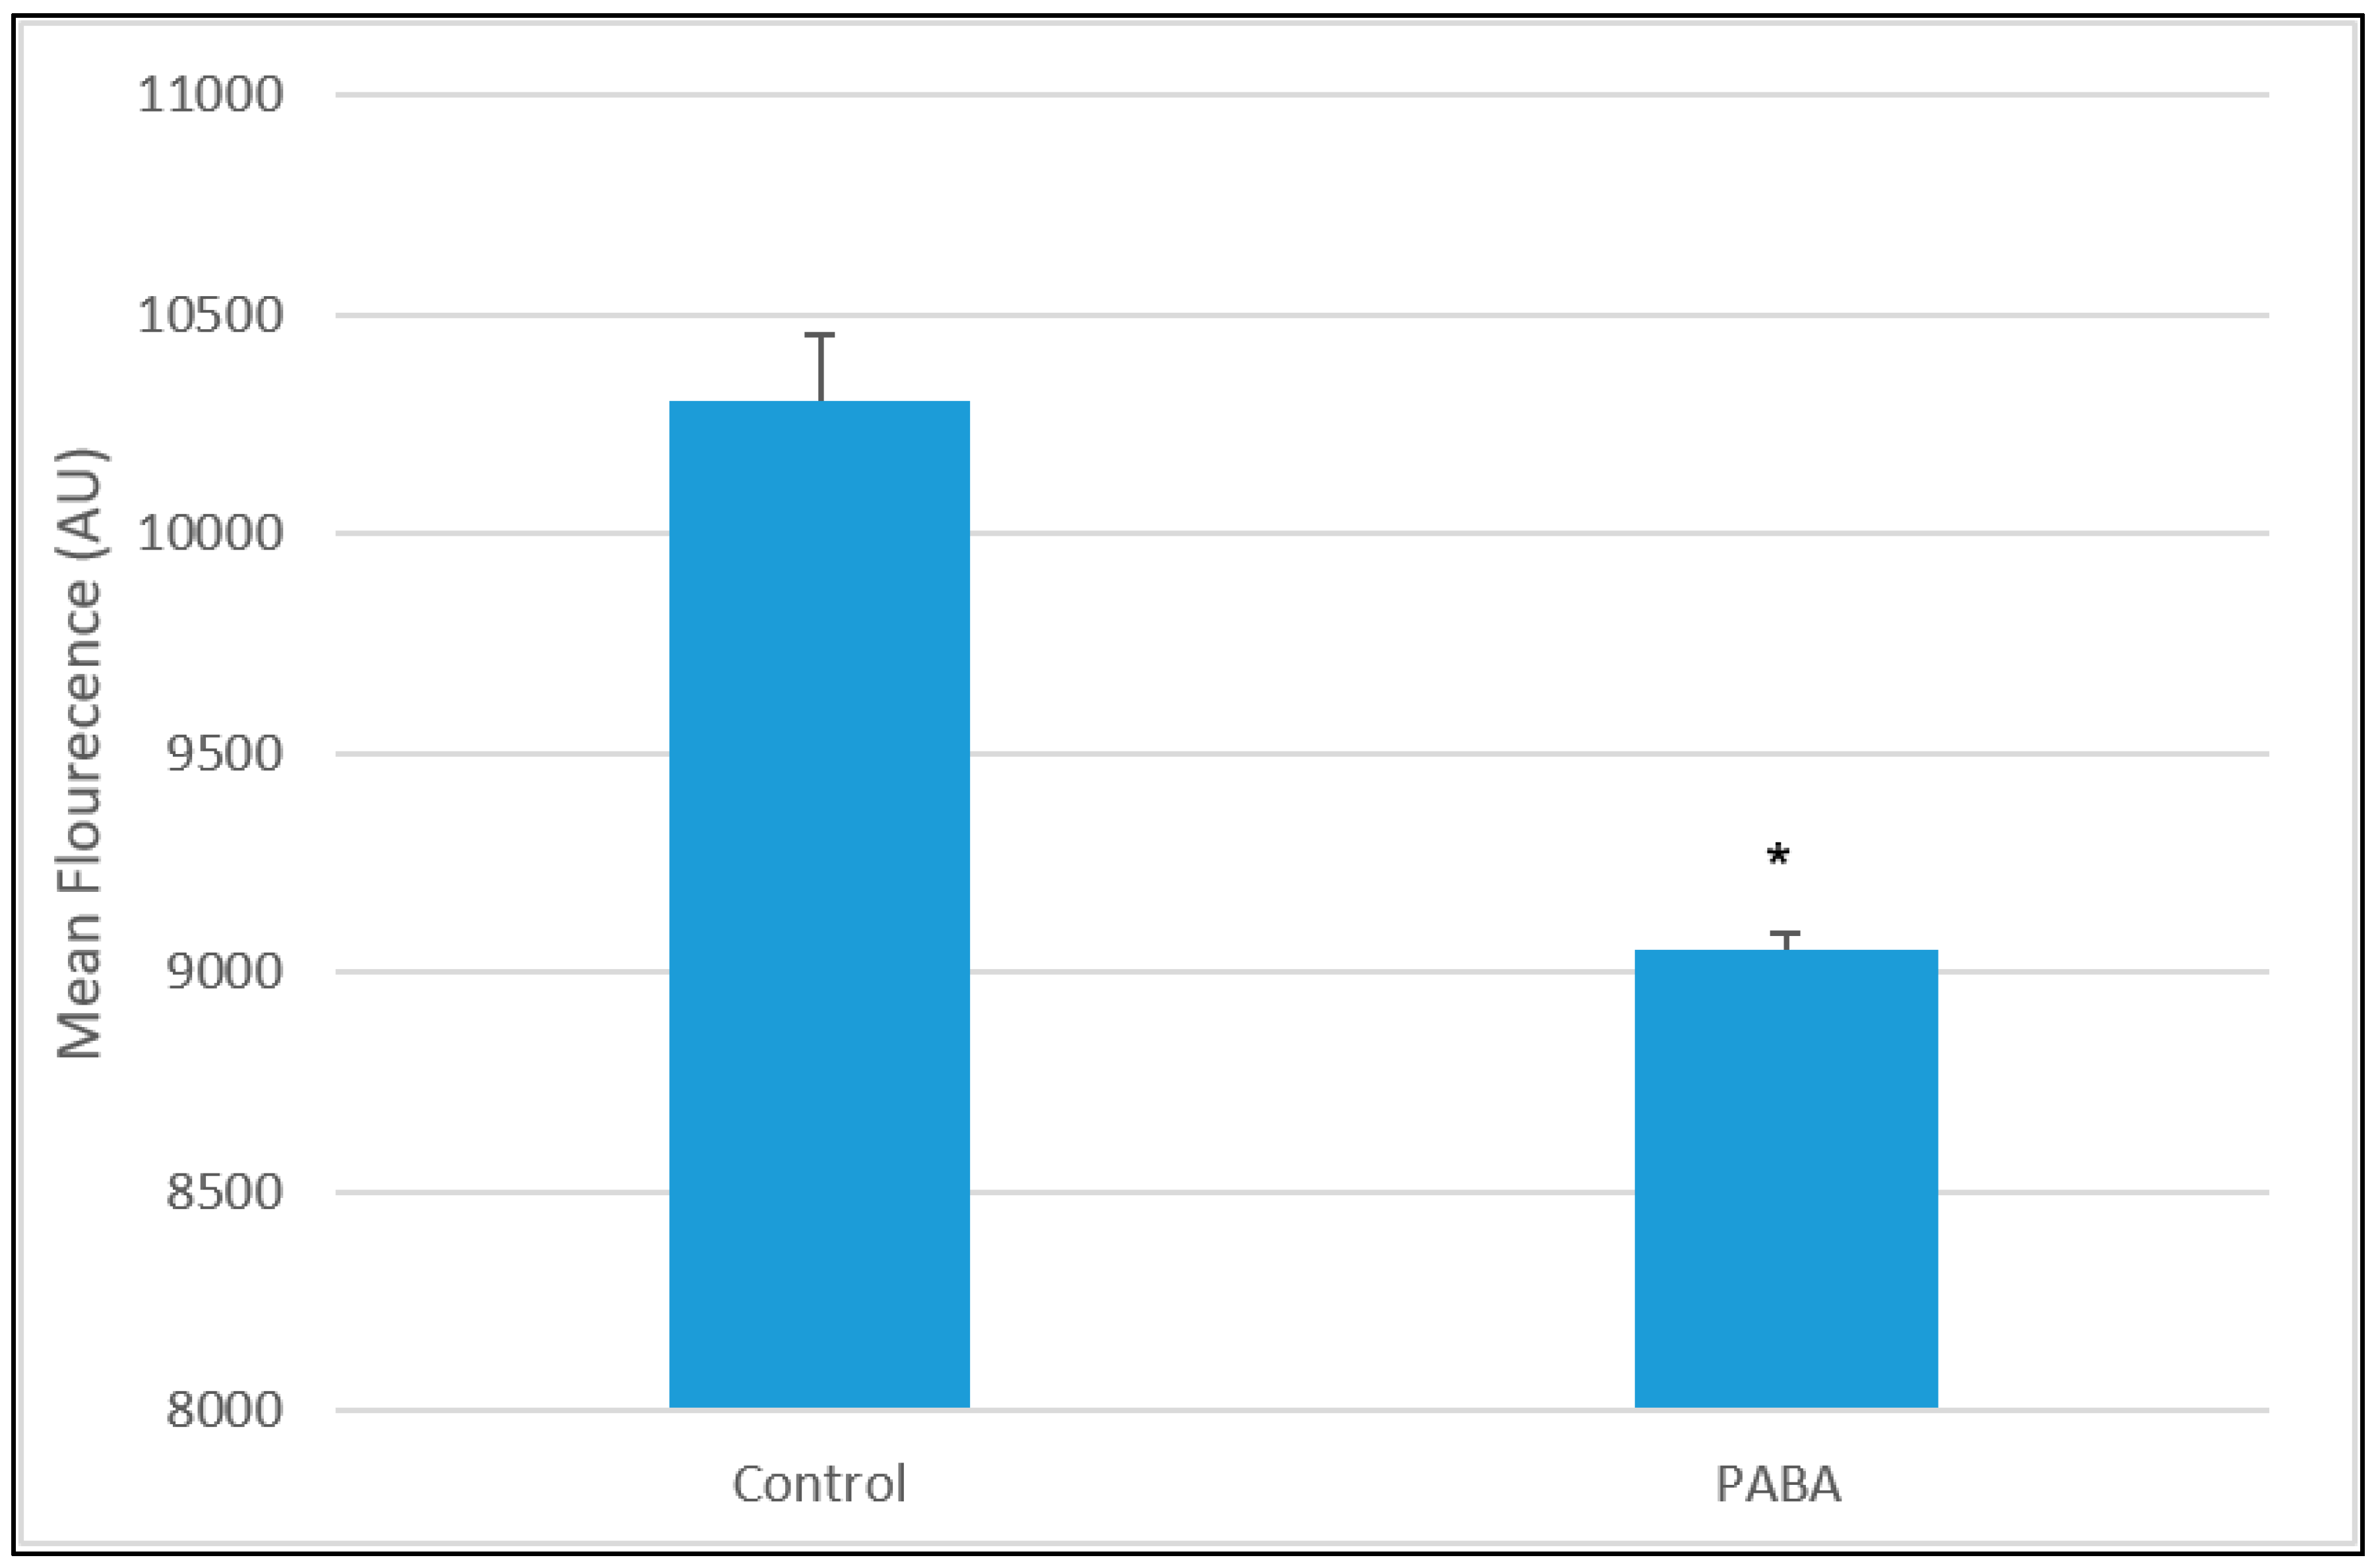
3.1. PABA Treatment
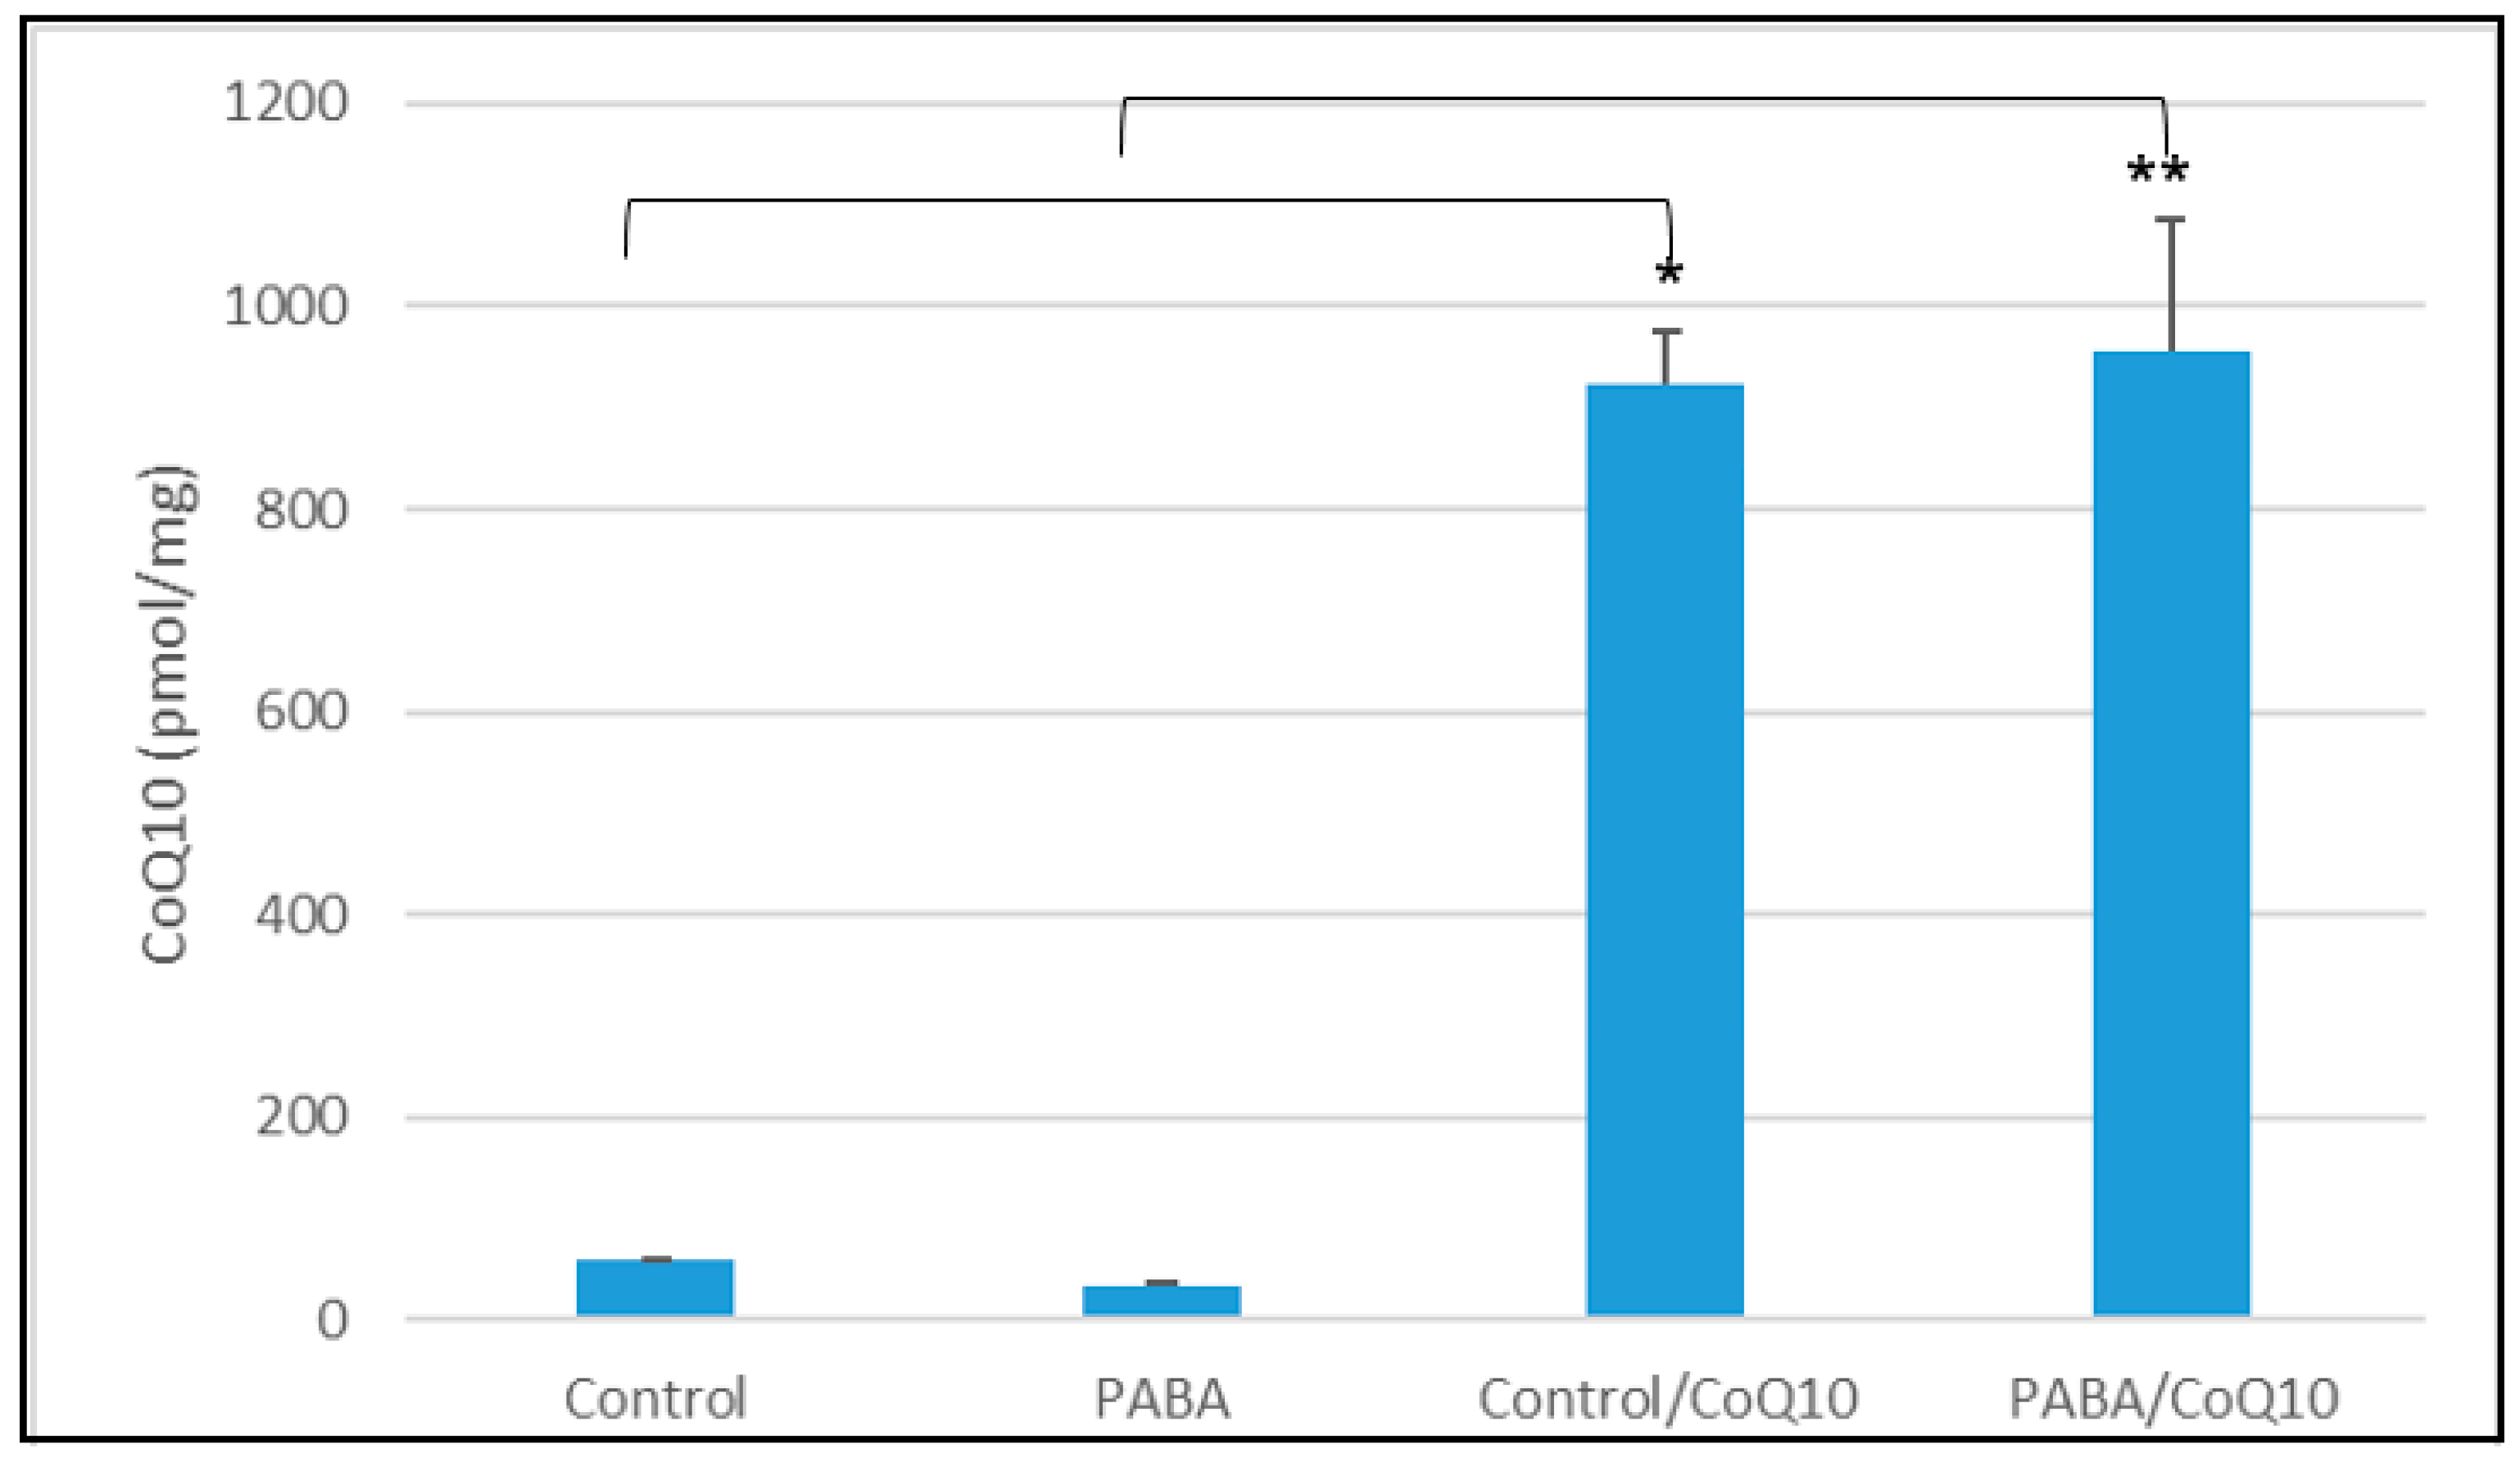
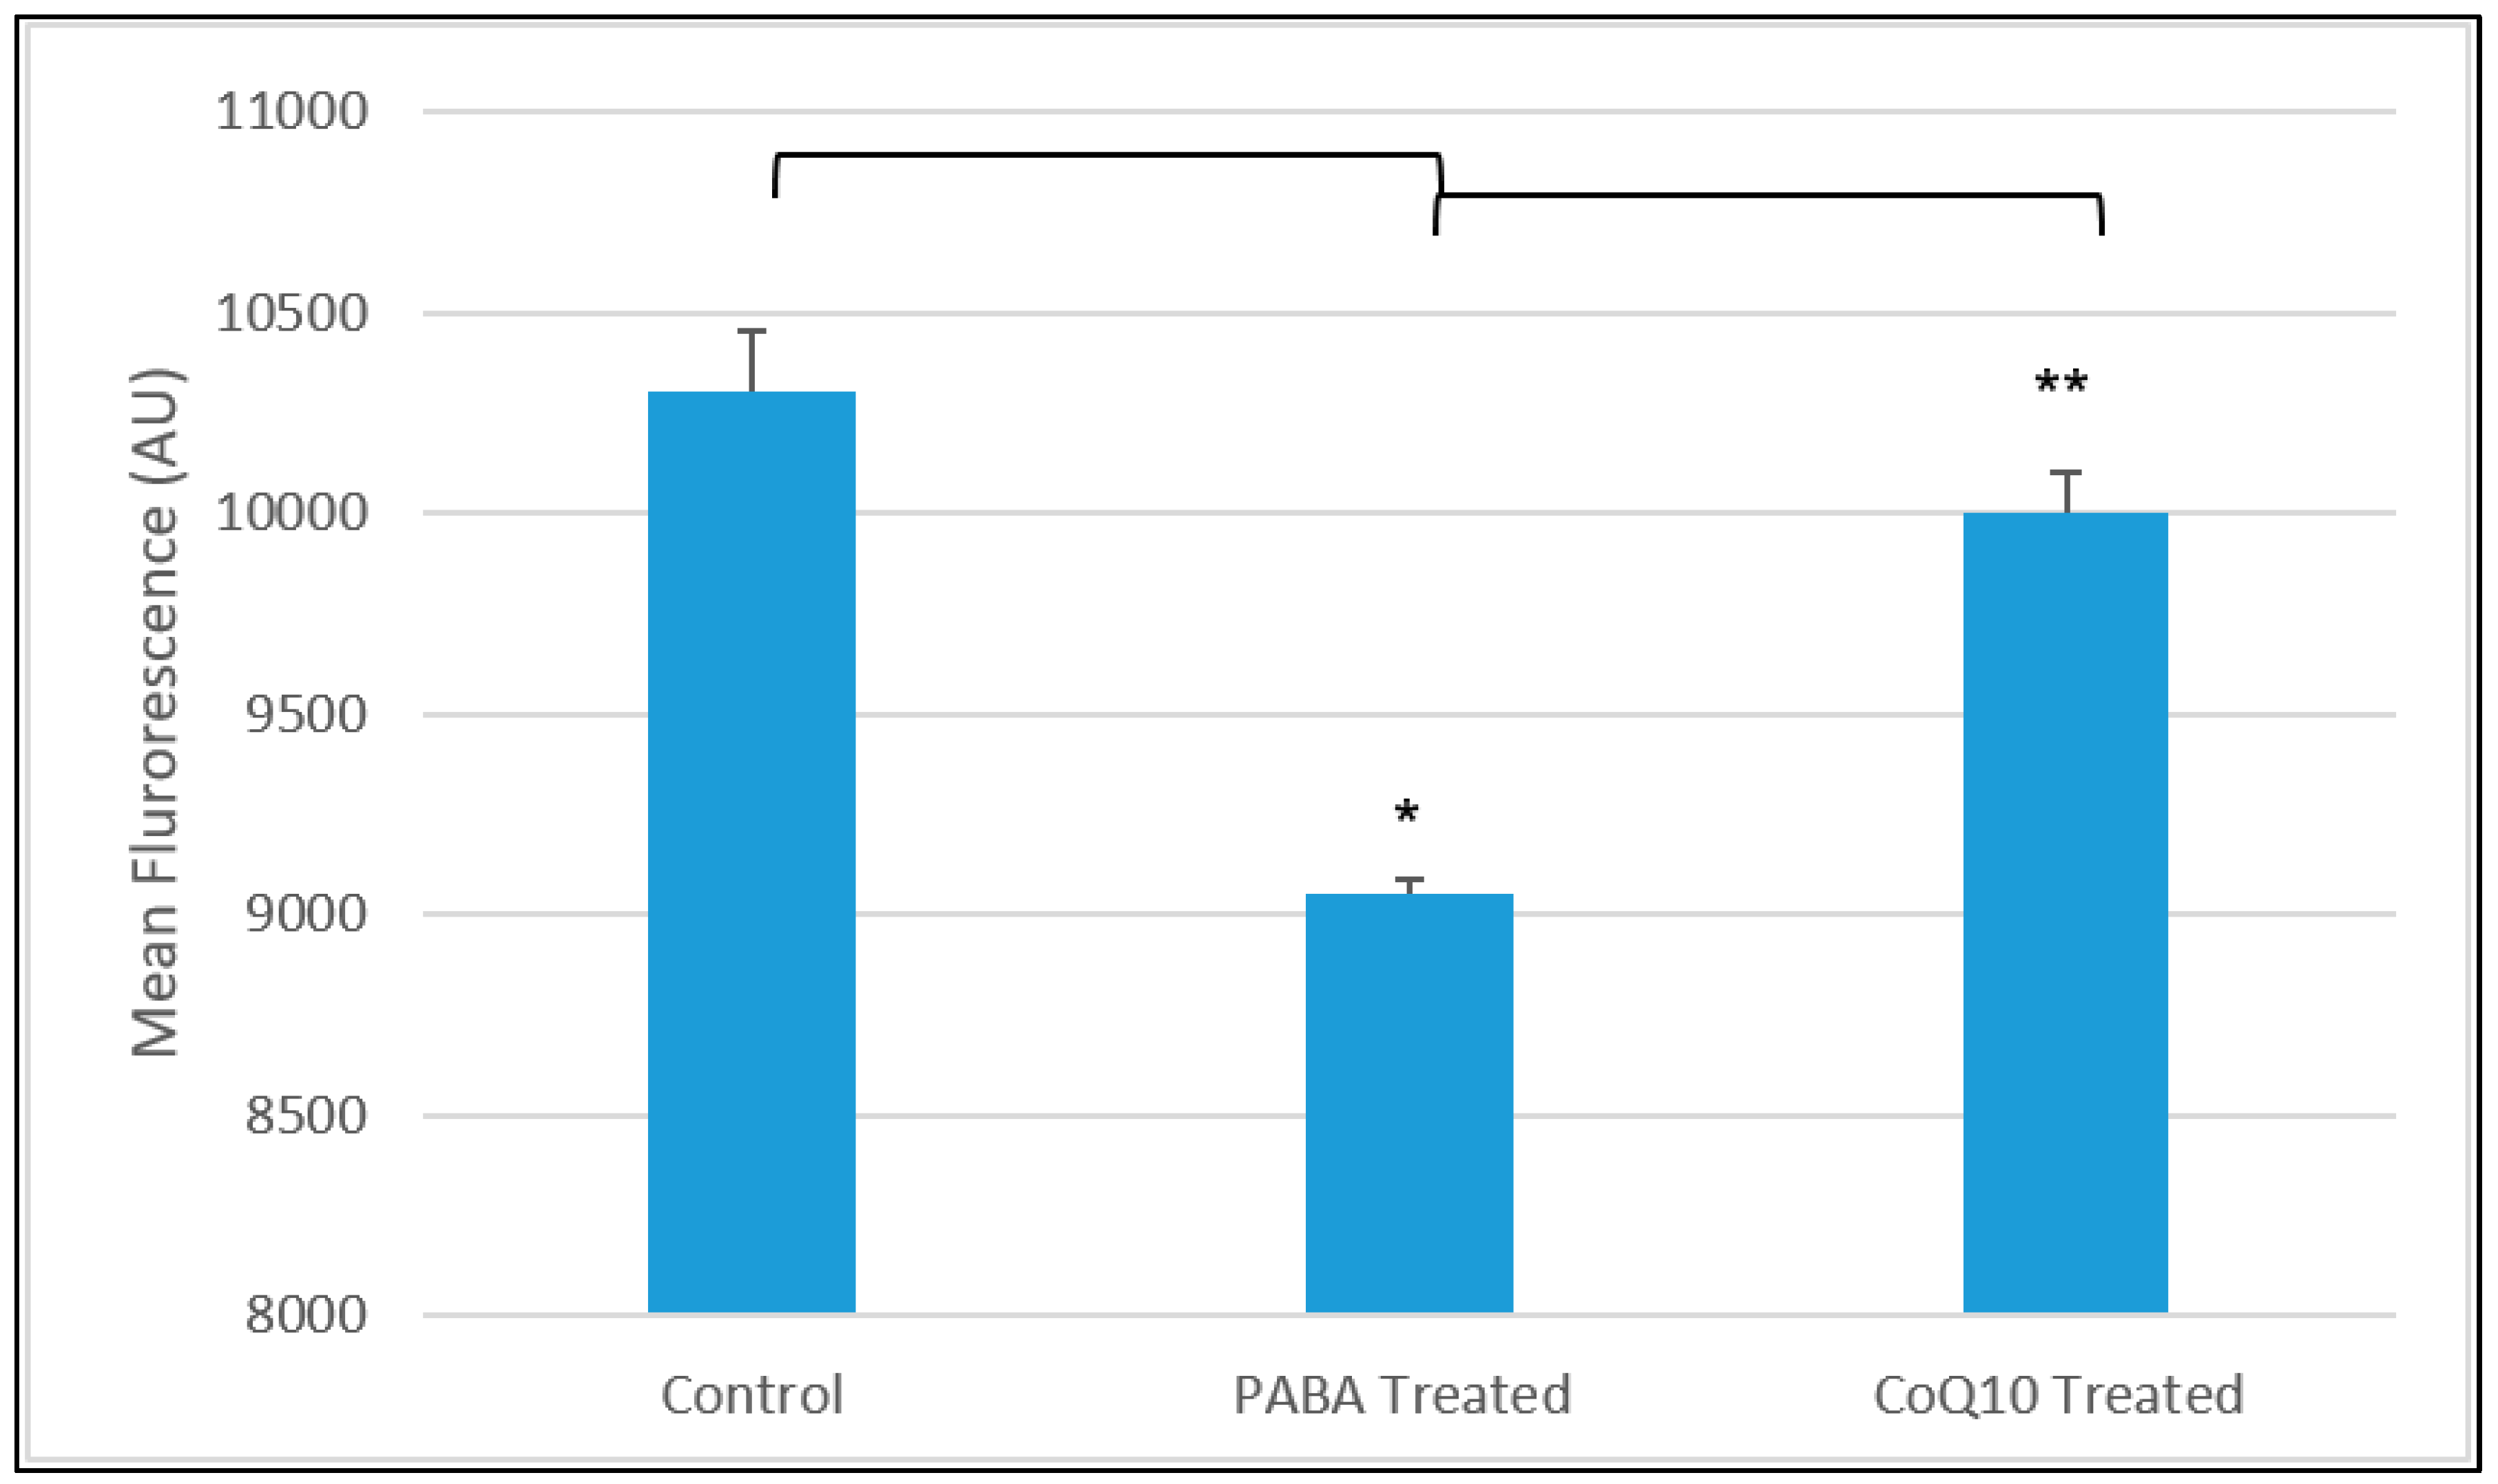
3.2. CoQ10 Treatment
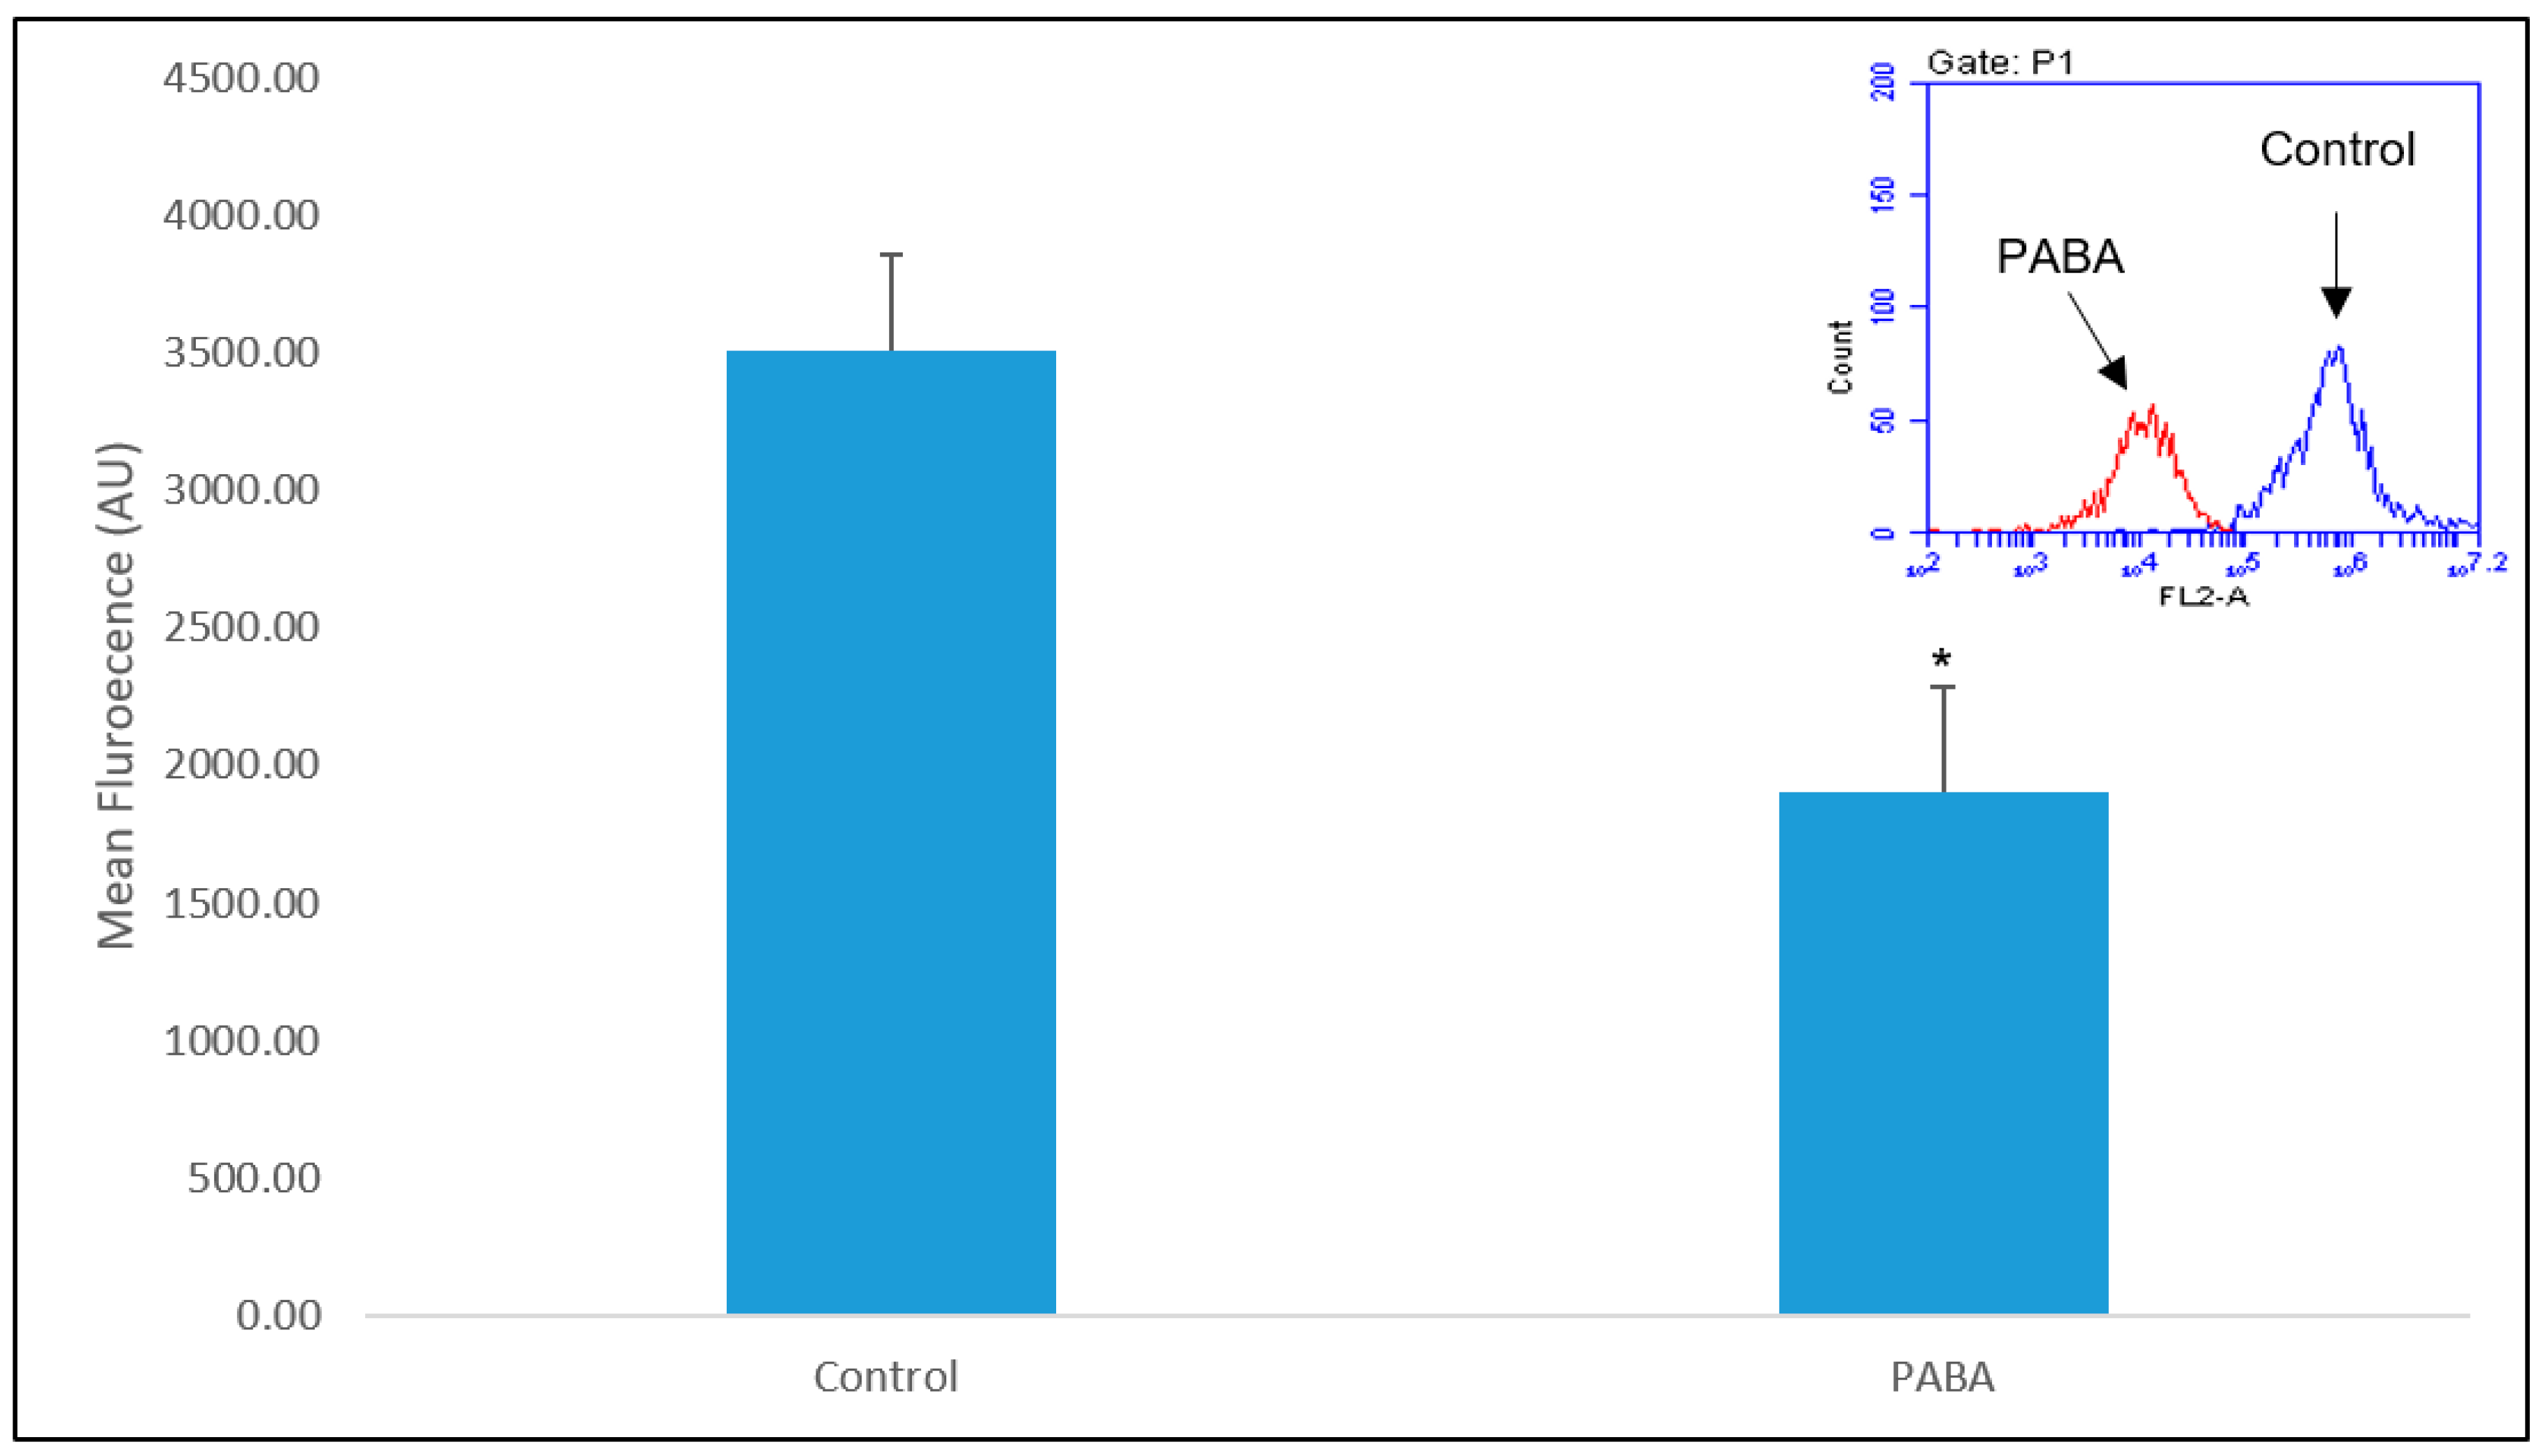
3.3. LysoTracker
3.4. LysoSensor
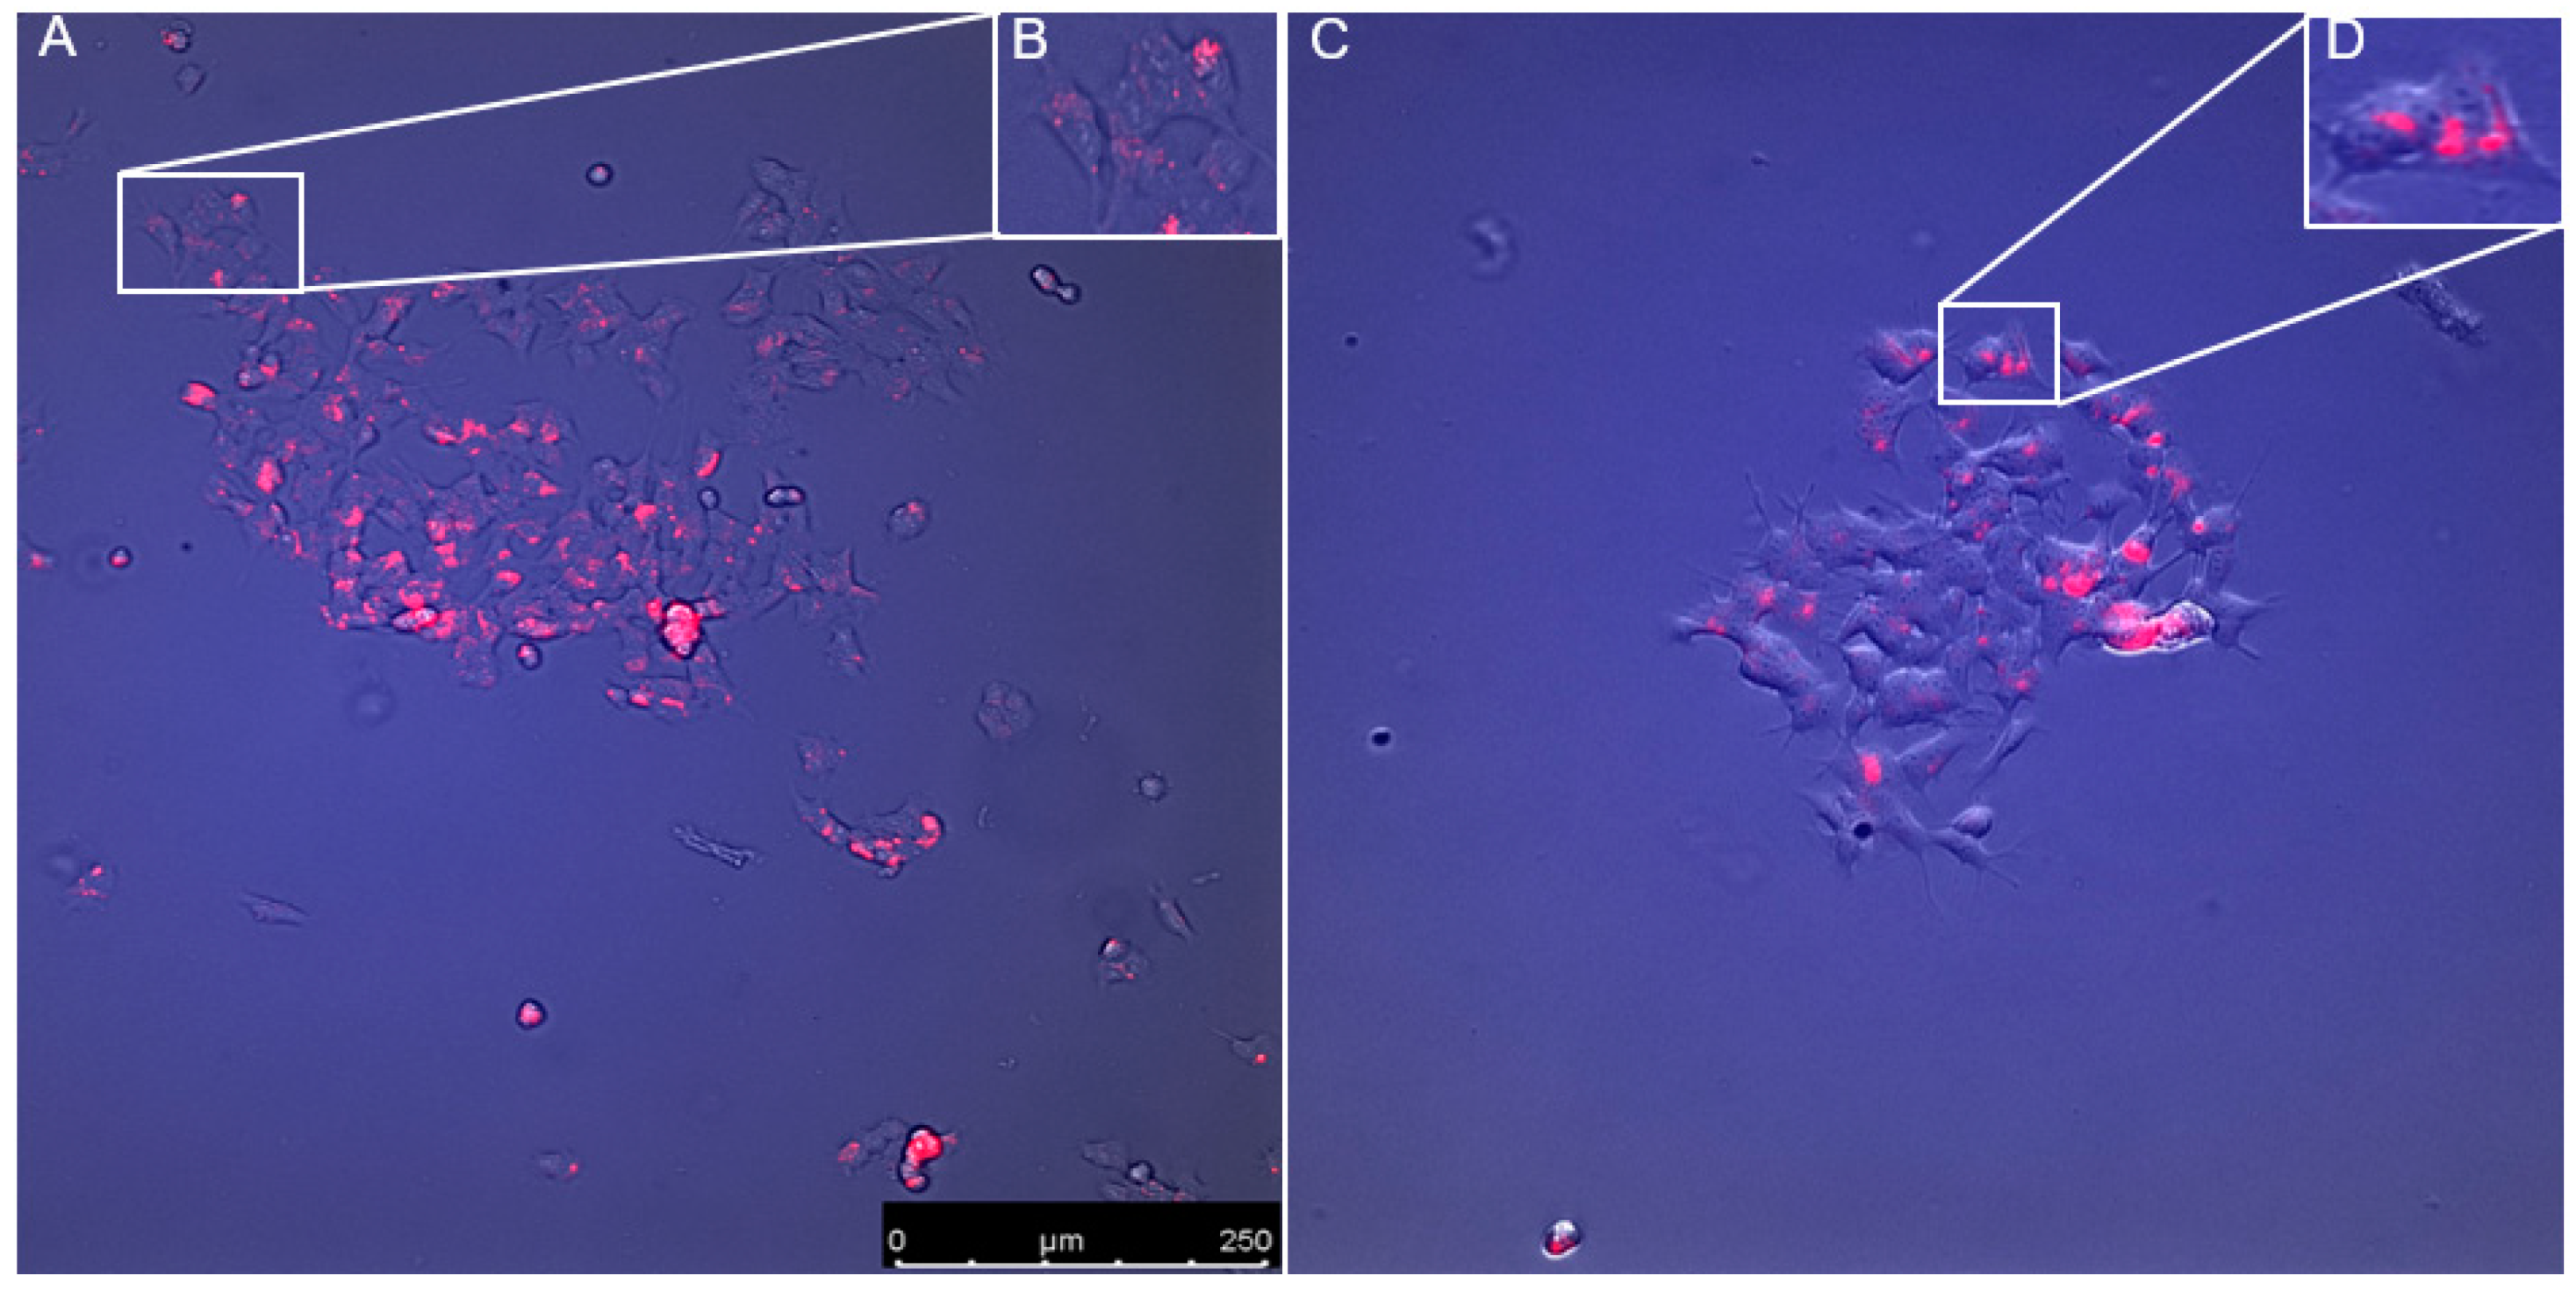
3.5. Visulisation of Probes
4. Discussion
Supplementary Materials
Author Contributions
Funding
Conflicts of Interest
References
- Crane, F.L. Biochemical functions of coenzyme Q10. J. Am. Coll. Nutr. 2001, 20, 591–598. [Google Scholar] [CrossRef] [PubMed]
- Turunen, M.; Olsson, J.; Dallner, G. Metabolism and function of coenzyme Q. Biochim. Biophys. Acta (BBA) Biomembr. 2004, 1660, 171–199. [Google Scholar] [CrossRef] [PubMed]
- Yubero, D.; Montero, R.; Artuch, R.; Land, J.M.; Heales, S.J.; Hargreaves, I.P. Biochemical diagnosis of coenzyme q10 deficiency. Mol. Syndromol. 2014, 5, 147–155. [Google Scholar] [CrossRef] [PubMed]
- Hargreaves, I.P. Ubiquinone: Cholesterol’s reclusive cousin. Ann. Clin. Biochem. 2003, 40, 207–218. [Google Scholar] [CrossRef]
- Hargreaves, I. Coenzyme Q10 as a therapy for mitochondrial disease. Int. J. Biochem. Cell Biol. 2014, 49, 105–111. [Google Scholar] [CrossRef]
- DiNicolantonio, J.J.; Bhutani, J.; Mccarty, M.F.; O’Keefe, J.H. Coenzyme Q10 for the treatment of heart failure: A review of the literature. Open Heart 2015, 2, 000326. [Google Scholar] [CrossRef]
- Mortensen, A.L.; Rosenfeldt, F.; Filipiak, K.J. Effect of coenzyme Q10 in Europeans with chronic heart failure: A sub-group analysis of the Q-SYMBIO randomized double-blind trial. Cardiol. J. 2019, 26, 147–156. [Google Scholar] [CrossRef]
- Mortensen, S.A.; Rosenfeldt, F.; Kumar, A.; Dolliner, P.; Filipiak, K.J.; Pella, D.; Alehagen, U.; Steurer, G.; Littarru, G.P.; Q-SYMBIO Study Investigators. The effect of coenzyme Q10 on morbidity and mortality in chronic heart failure: Results from Q-SYMBIO: A randomized double-blind trial. JACC: Heart Fail. 2014, 2, 641–649. [Google Scholar]
- Gao, L.; Mao, Q.; Cao, J.; Wang, Y.; Zhou, X.; Fan, L. Effects of coenzyme Q10 on vascular endothelial function in humans: A meta-analysis of randomized controlled trials. Atherosclerosis 2012, 221, 311–316. [Google Scholar] [CrossRef]
- Neergheen, V.; Chalasani, A.; Wainwright, L.; Yubero, D.; Montero, R.; Artuch, R.; Hargreaves, I. Coenzyme Q10 in the treatment of mitochondrial disease. J. Inborn Errors Metab. Screen. 2017, 5, 2326409817707771. [Google Scholar] [CrossRef]
- Duncan, A.J.; Bitner-Glindzicz, M.; Meunier, B.; Costello, H.; Hargreaves, I.P.; López, L.C.; Hirano, M.; Quinzii, C.M.; Sadowski, M.I.; Hardy, J. A nonsense mutation in COQ9 causes autosomal-recessive neonatal-onset primary coenzyme Q10 deficiency: A potentially treatable form of mitochondrial disease. Am. J. Hum. Genet. 2009, 84, 558–566. [Google Scholar] [CrossRef] [PubMed]
- Federico, A.; Cardaioli, E.; Da Pozzo, P.; Formichi, P.; Gallus, G.N.; Radi, E. Mitochondria, oxidative stress and neurodegeneration. J. Neurol. Sci. 2012, 322, 254–262. [Google Scholar] [CrossRef] [PubMed]
- Rahman, S.; Hargreaves, I.; Clayton, P.; Heales, S. Neonatal presentation of coenzyme Q10 deficiency. J. Pediatrics 2001, 139, 456–458. [Google Scholar] [CrossRef] [PubMed]
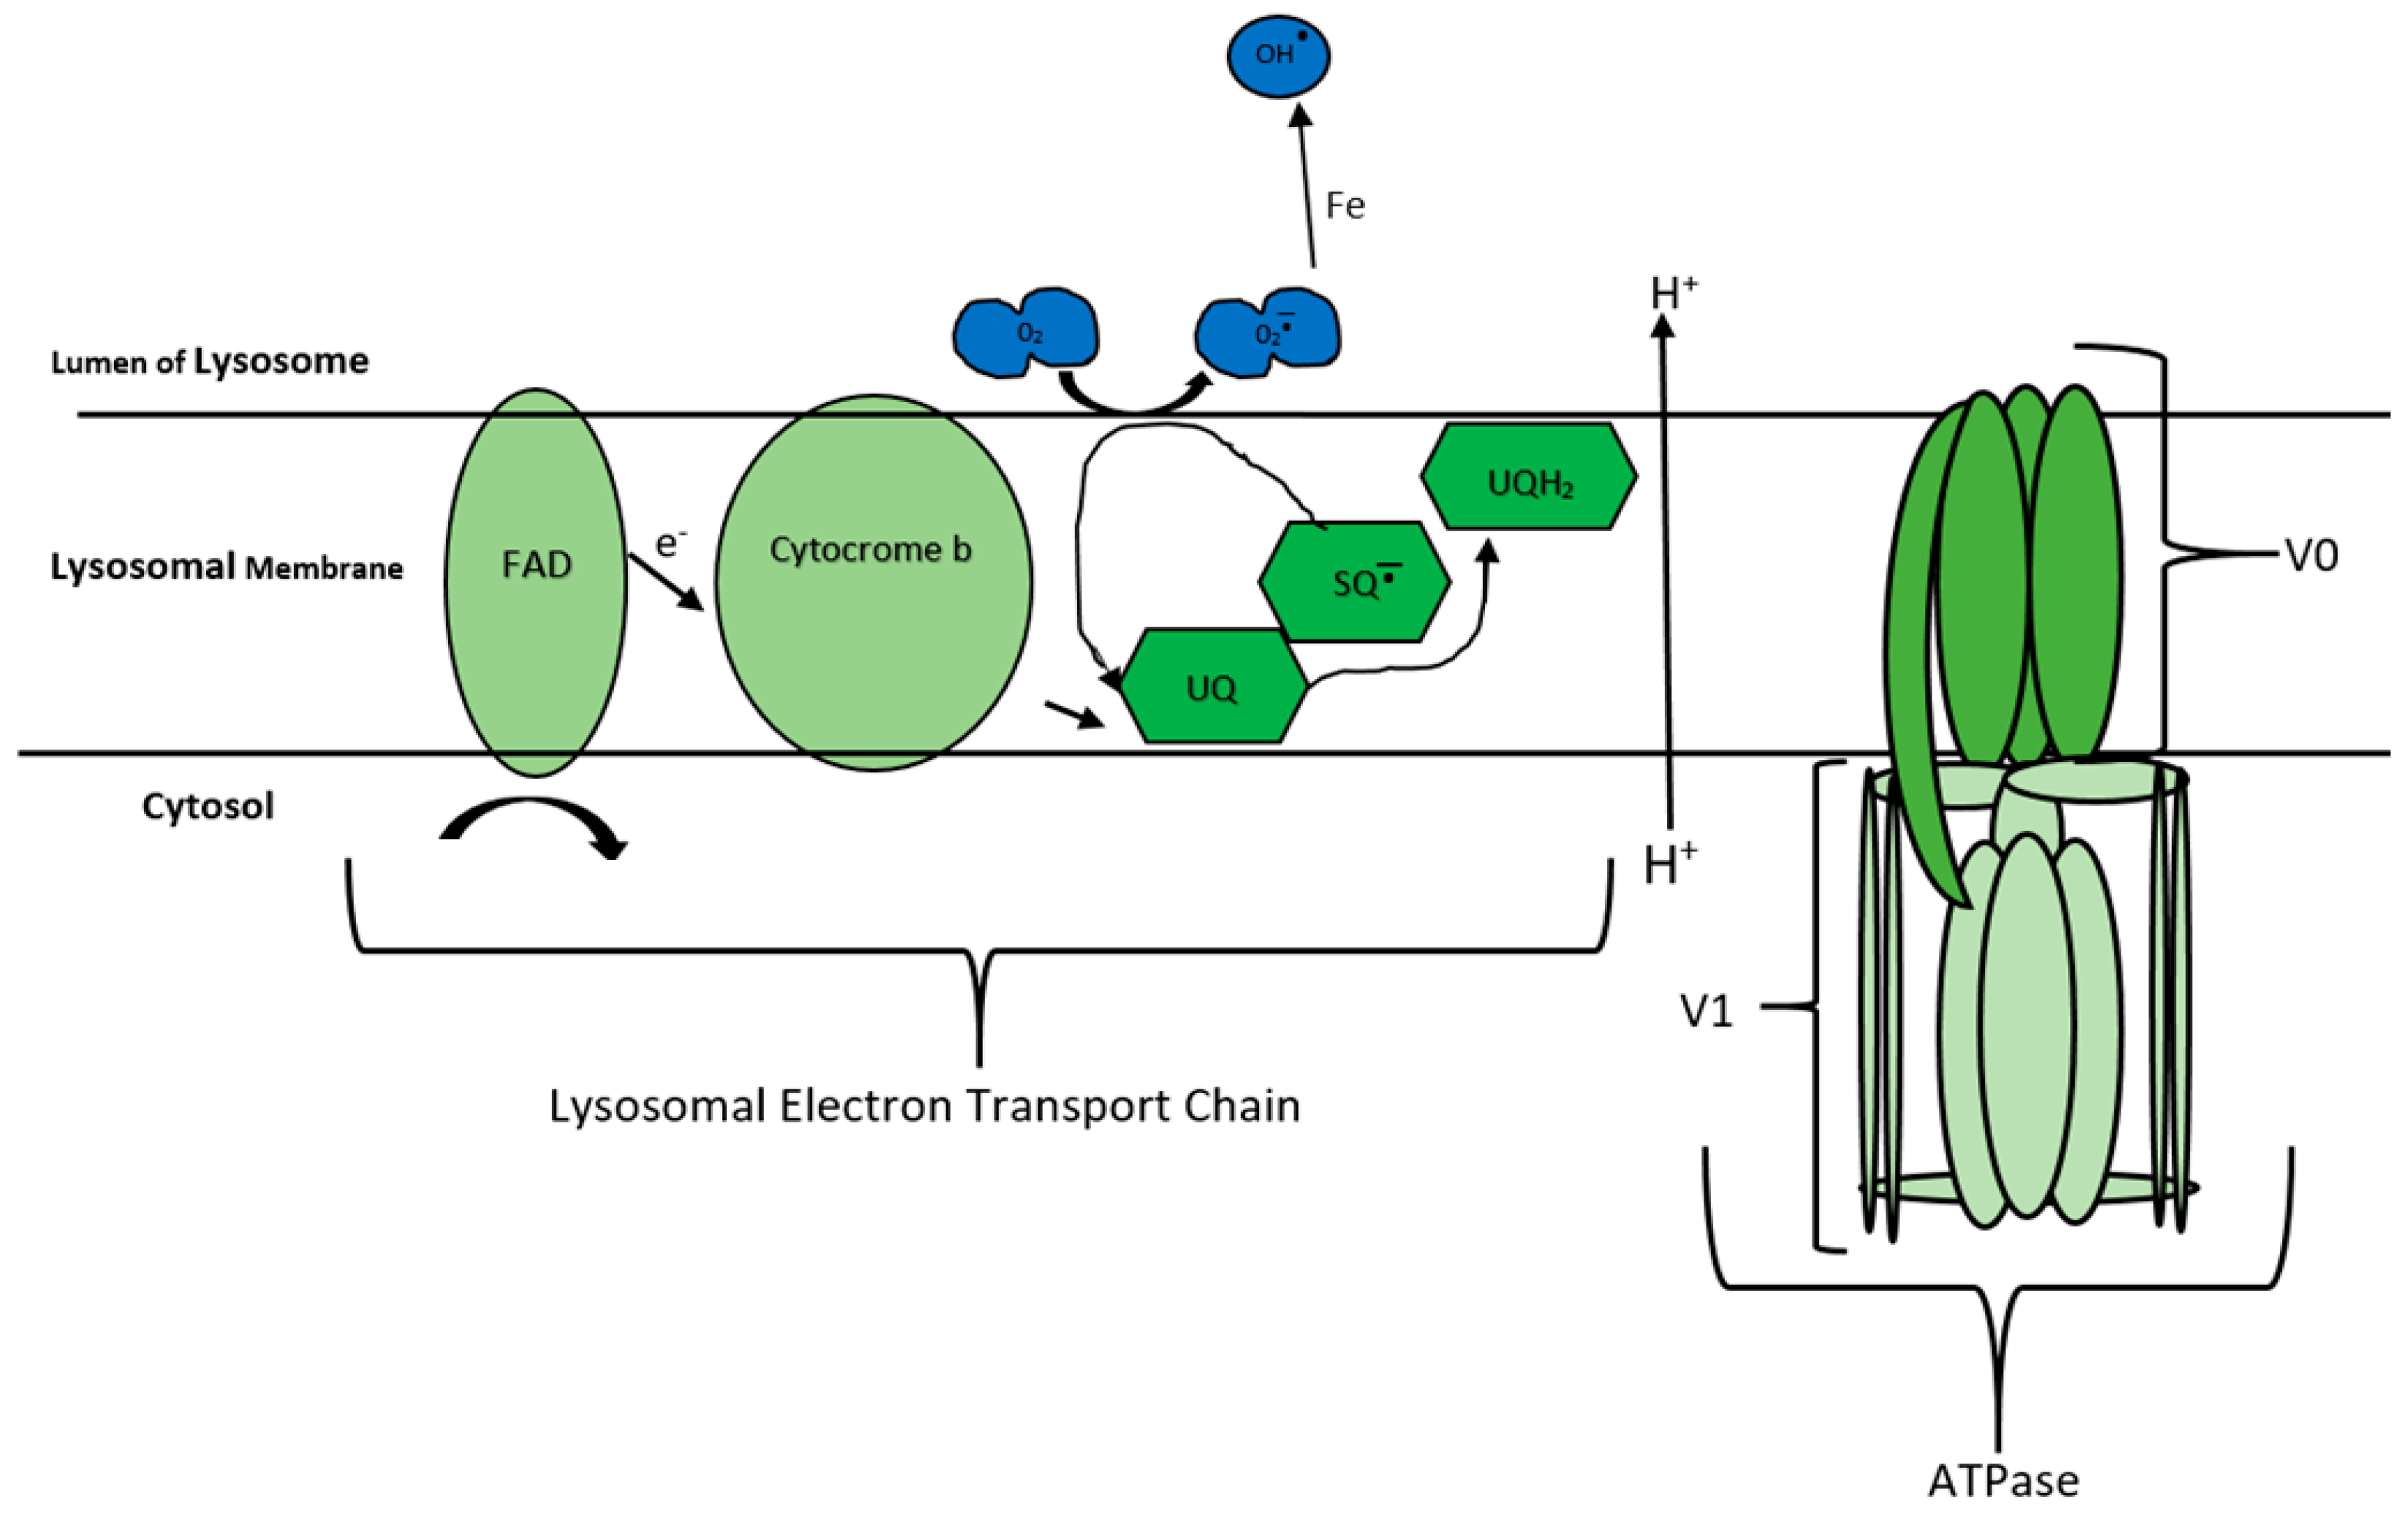
- Gille, L.; Nohl, H. The existence of a lysosomal redox chain and the role of ubiquinone. Arch. Biochem. Biophys. 2000, 375, 347–354. [Google Scholar] [CrossRef] [PubMed]
- Zoncu, R.; Bar-Peled, L.; Efeyan, A.; Wang, S.; Sancak, Y.; Sabatini, D.M. mTORC1 senses lysosomal amino acids through an inside-out mechanism that requires the vacuolar H+-ATPase. Science 2011, 334, 678–683. [Google Scholar] [CrossRef] [PubMed]
- Forgac, M. Structure and function of vacuolar class of ATP-driven proton pumps. Physiol. Rev. 1989, 69, 765–796. [Google Scholar] [CrossRef]
- Weissmann, G. The role of lysosomes in inflammation and disease. Annu. Rev. Med. 1967, 18, 97–112. [Google Scholar] [CrossRef]
- De Duve, C. The lysosome. Sci. Am. 1963, 208, 64–73. [Google Scholar] [CrossRef]
- Smith, R.E.; Farquhar, M.G. Lysosome function in the regulation of the secretory process in cells of the anterior pituitary gland. J. Cell Biol. 1966, 31, 319–347. [Google Scholar] [CrossRef]
- Kroemer, G.; Jäättelä, M. Lysosomes and autophagy in cell death control. Nat. Rev. Cancer 2005, 5, 886–897. [Google Scholar] [CrossRef]
- Aronson, N.N.; de Duve, C. Digestive activity of lysosomes II. The digestion of macromolecular carbohydrates by extracts of rat liver lysosomes. J. Biol. Chem. 1968, 243, 4564–4573. [Google Scholar] [PubMed]
- Wartosch, L.; Bright, N.A.; Luzio, J.P. Lysosomes. Curr. Biol. 2015, 25, R315–R316. [Google Scholar] [CrossRef] [PubMed]
- Ferreira, C.R.; Gahl, W.A. Lysosomal storage diseases. Transl. Sci. Rare Dis. 2017, 2, 1–71. [Google Scholar] [CrossRef] [PubMed]
- Mindell, J.A. Lysosomal acidification mechanisms. Annu. Rev. Physiol. 2012, 74, 69–86. [Google Scholar] [CrossRef] [PubMed]
- Ishida, Y.; Nayak, S.; Mindell, J.A.; Grabe, M. A model of lysosomal pH regulation. J. Gen. Physiol. 2013, 141, 705–720. [Google Scholar] [CrossRef]
- Kalen, A.; Norling, B.; Appelkvist, E.; Dallner, G. Ubiquinone biosynthesis by the microsomal fraction from rat liver. Biochim. Biophys. Acta (BBA) Gen. Subj. 1987, 926, 70–78. [Google Scholar] [CrossRef]
- Nohl, H.; Gille, L. Lysosomal ROS formation. Redox Rep. 2005, 10, 199–205. [Google Scholar] [CrossRef]
- Takahashi, T.; Okamoto, T.; Mori, K.; Sayo, H.; Kishi, T. Distribution of ubiquinone and ubiquinol homologues in rat tissues and subcellular fractions. Lipids 1993, 28, 803–809. [Google Scholar] [CrossRef]
- Nohl, H.; Gille, L. The bifunctional activity of ubiquinone in lysosomal membranes. Biogerontology 2002, 3, 125–131. [Google Scholar] [CrossRef]
- Zhang, Y.; Turunen, M.; Appelkvist, E.-L. Restricted uptake of dietary coenzyme Q is in contrast to the unrestricted uptake of α-tocopherol into rat organs and cells. J. Nutr. 1996, 126, 2089–2097. [Google Scholar] [CrossRef]
- Parkinson-Lawrence, E.J.; Shandala, T.; Prodoehl, M.; Plew, R.; Borlace, G.N.; Brooks, D.A. Lysosomal storage disease: Revealing lysosomal function and physiology. Physiology 2010, 25, 102–115. [Google Scholar] [CrossRef] [PubMed]
- Rahman, S.; Clarke, C.F.; Hirano, M. 176th ENMC International Workshop: Diagnosis and treatment of coenzyme Q10 deficiency. Neuromuscul. Disord. 2012, 22, 76. [Google Scholar] [CrossRef] [PubMed]
- Biedler, J.L.; Roffler-Tarlov, S.; Schachner, M.; Freedman, L.S. Multiple neurotransmitter synthesis by human neuroblastoma cell lines and clones. Cancer Res. 1978, 38, 3751–3757. [Google Scholar] [PubMed]
- Duberley, K.E.; Abramov, A.Y.; Chalasani, A.; Heales, S.J.; Rahman, S.; Hargreaves, I.P. Human neuronal coenzyme Q10 deficiency results in global loss of mitochondrial respiratory chain activity, increased mitochondrial oxidative stress and reversal of ATP synthase activity: Implications for pathogenesis and treatment. J. Inherit. Metab. Dis. Off. J. Soc. Study Inborn Errors Metab. 2013, 36, 63–73. [Google Scholar] [CrossRef] [PubMed]
- Alam, S.S.; Nambudiri, A.; Rudney, H. 4-Hydroxybenzoate: Polyprenyl transferase and the prenylation of 4-aminobenzoate in mammalian tissues. Arch. Biochem. Biophys. 1975, 171, 183–190. [Google Scholar] [CrossRef]
- Duncan, A.J.; Heales, S.J.; Mills, K.; Eaton, S.; Land, J.M.; Hargreaves, I.P. Determination of coenzyme Q10 status in blood mononuclear cells, skeletal muscle, and plasma by HPLC with di-propoxy-coenzyme Q10 as an internal standard. Clin. Chem. 2005, 51, 2380–2382. [Google Scholar] [CrossRef]
- Lowry, O.H.; Rosebrough, N.J.; Farr, A.L.; Randall, R.J. Protein measurement with the Folin phenol reagent. J. Biol. Chem. 1951, 193, 265–275. [Google Scholar]
- López, L.C.; Quinzii, C.M.; Area, E.; Naini, A.; Rahman, S.; Schuelke, M.; Salviati, L.; DiMauro, S.; Hirano, M. Treatment of CoQ10 deficient fibroblasts with ubiquinone, CoQ analogs, and vitamin C: Time-and compound-dependent effects. PLoS ONE 2010, 5, e11897. [Google Scholar] [CrossRef]
- Duberley, K.; Heales, S.; Abramov, A.; Chalasani, A.; Land, J.; Rahman, S.; Hargreaves, I. Effect of Coenzyme Q10 supplementation on mitochondrial electron transport chain activity and mitochondrial oxidative stress in Coenzyme Q10 deficient human neuronal cells. Int. J. Biochem. Cell Biol. 2014, 50, 60–63. [Google Scholar] [CrossRef]
- Johnson, I.D. Molecular Probes Handbook: A Guide to Fluorescent Probes and Labeling Technologies; Life Technologies Corporation: Carlsbad, CA, USA, 2010; p. 3. [Google Scholar]
- Kang, C.-C.; Huang, W.-C.; Kouh, C.-W.; Wang, Z.-F.; Cho, C.-C.; Chang, C.-C.; Wang, C.-L.; Chang, T.-C.; Seemann, J.; Huang, L.J.-S. Chemical principles for the design of a novel fluorescent probe with high cancer-targeting selectivity and sensitivity. Integr. Biol. 2013, 5, 1217–1228. [Google Scholar] [CrossRef]
- Avrahami, L.; Farfara, D.; Shaham-Kol, M.; Vassar, R.; Frenkel, D.; Eldar-Finkelman, H. Inhibition of Glycogen Synthase Kinase-3 Ameliorates β-Amyloid Pathology and Restores Lysosomal Acidification and Mammalian Target of Rapamycin Activity in the Alzheimer Disease Mouse Model In Vivo and In Vitro Studies. J. Biol. Chem. 2013, 288, 1295–1306. [Google Scholar] [CrossRef] [PubMed]
- Guha, S.; Coffey, E.E.; Lu, W.; Lim, J.C.; Beckel, J.M.; Laties, A.M.; Boesze-Battaglia, K.; Mitchell, C.H. Approaches for detecting lysosomal alkalinization and impaired degradation in fresh and cultured RPE cells: Evidence for a role in retinal degenerations. Exp. Eye Res. 2014, 126, 68–76. [Google Scholar] [CrossRef] [PubMed]
- Yamada, D.; Saiki, S.; Furuya, N.; Ishikawa, K.-I.; Imamichi, Y.; Kambe, T.; Fujimura, T.; Ueno, T.; Koike, M.; Sumiyoshi, K. Ethambutol neutralizes lysosomes and causes lysosomal zinc accumulation. Biochem. Biophys. Res. Commun. 2016, 471, 109–116. [Google Scholar] [CrossRef] [PubMed]
- Ma, L.; Ouyang, Q.; Werthmann, G.C.; Thompson, H.M.; Morrow, E.M. Live-cell Microscopy and Fluorescence-based Measurement of Luminal pH in Intracellular Organelles. Front. Cell Dev. Biol. 2017, 5, 71. [Google Scholar] [CrossRef]
- Anway, M.D.; Wright, W.W.; Zirkin, B.R.; Korah, N.; Mort, J.S.; Hermo, L. Expression and localization of cathepsin k in adult rat sertoli cells. Biol. Reprod. 2004, 70, 562–569. [Google Scholar] [CrossRef]
- Altan, N.; Chen, Y.; Schindler, M.; Simon, S.M. Defective acidification in human breast tumor cells and implications for chemotherapy. J. Exp. Med. 1998, 187, 1583–1598. [Google Scholar] [CrossRef]
- Papakrivos, J.; Sa, J.M.; Wellems, T.E. Functional characterization of the Plasmodium falciparum chloroquine-resistance transporter (PfCRT) in transformed Dictyostelium discoideum vesicles. PLoS ONE 2012, 7, e39569. [Google Scholar] [CrossRef] [PubMed]
- Xu, H.; Ren, D. Lysosomal physiology. Annu. Rev. Physiol. 2015, 77, 57–80. [Google Scholar] [CrossRef] [PubMed]
- Ben-Meir, A.; Burstein, E.; Borrego-Alvarez, A.; Chong, J.; Wong, E.; Yavorska, T.; Naranian, T.; Chi, M.; Wang, Y.; Bentov, Y. Coenzyme Q10 restores oocyte mitochondrial function and fertility during reproductive aging. Aging Cell 2015, 14, 887–895. [Google Scholar] [CrossRef] [PubMed]
- Shults, C.W.; Oakes, D.; Kieburtz, K.; Beal, M.F.; Haas, R.; Plumb, S.; Juncos, J.L.; Nutt, J.; Shoulson, I.; Carter, J. Effects of coenzyme Q10 in early Parkinson disease: Evidence of slowing of the functional decline. Arch. Neurol. 2002, 59, 1541–1550. [Google Scholar] [CrossRef] [PubMed]
- Galindo, F.; Burguete, M.I.; Vigara, L.; Luis, S.V.; Kabir, N.; Gavrilovic, J.; Russell, D.A. Synthetic macrocyclic peptidomimetics as tunable pH probes for the fluorescence imaging of acidic organelles in live cells. Angew. Chem. Int. Ed. 2005, 44, 6504–6508. [Google Scholar] [CrossRef] [PubMed]
- Terman, A.; Gustafsson, B.; Brunk, U.T. The lysosomal–mitochondrial axis theory of postmitotic aging and cell death. Chem. Biol. Interact. 2006, 163, 29–37. [Google Scholar] [CrossRef] [PubMed]


© 2020 by the authors. Licensee MDPI, Basel, Switzerland. This article is an open access article distributed under the terms and conditions of the Creative Commons Attribution (CC BY) license (http://creativecommons.org/licenses/by/4.0/).
Share and Cite
Heaton, R.A.; Heales, S.; Rahman, K.; Sexton, D.W.; Hargreaves, I. The Effect of Cellular Coenzyme Q10 Deficiency on Lysosomal Acidification. J. Clin. Med. 2020, 9, 1923. https://doi.org/10.3390/jcm9061923
Heaton RA, Heales S, Rahman K, Sexton DW, Hargreaves I. The Effect of Cellular Coenzyme Q10 Deficiency on Lysosomal Acidification. Journal of Clinical Medicine. 2020; 9(6):1923. https://doi.org/10.3390/jcm9061923
Chicago/Turabian StyleHeaton, Robert A., Simon Heales, Khalid Rahman, Darren W. Sexton, and Iain Hargreaves. 2020. "The Effect of Cellular Coenzyme Q10 Deficiency on Lysosomal Acidification" Journal of Clinical Medicine 9, no. 6: 1923. https://doi.org/10.3390/jcm9061923
APA StyleHeaton, R. A., Heales, S., Rahman, K., Sexton, D. W., & Hargreaves, I. (2020). The Effect of Cellular Coenzyme Q10 Deficiency on Lysosomal Acidification. Journal of Clinical Medicine, 9(6), 1923. https://doi.org/10.3390/jcm9061923