Hippocampal Volume in Provisional Tic Disorder Predicts Tic Severity at 12-Month Follow-up

 ,
,
Abstract
1. Introduction
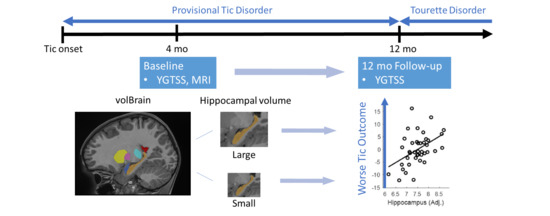
2. Methods
2.1. Participants
2.2. Procedure
2.3. MRI Acquisition
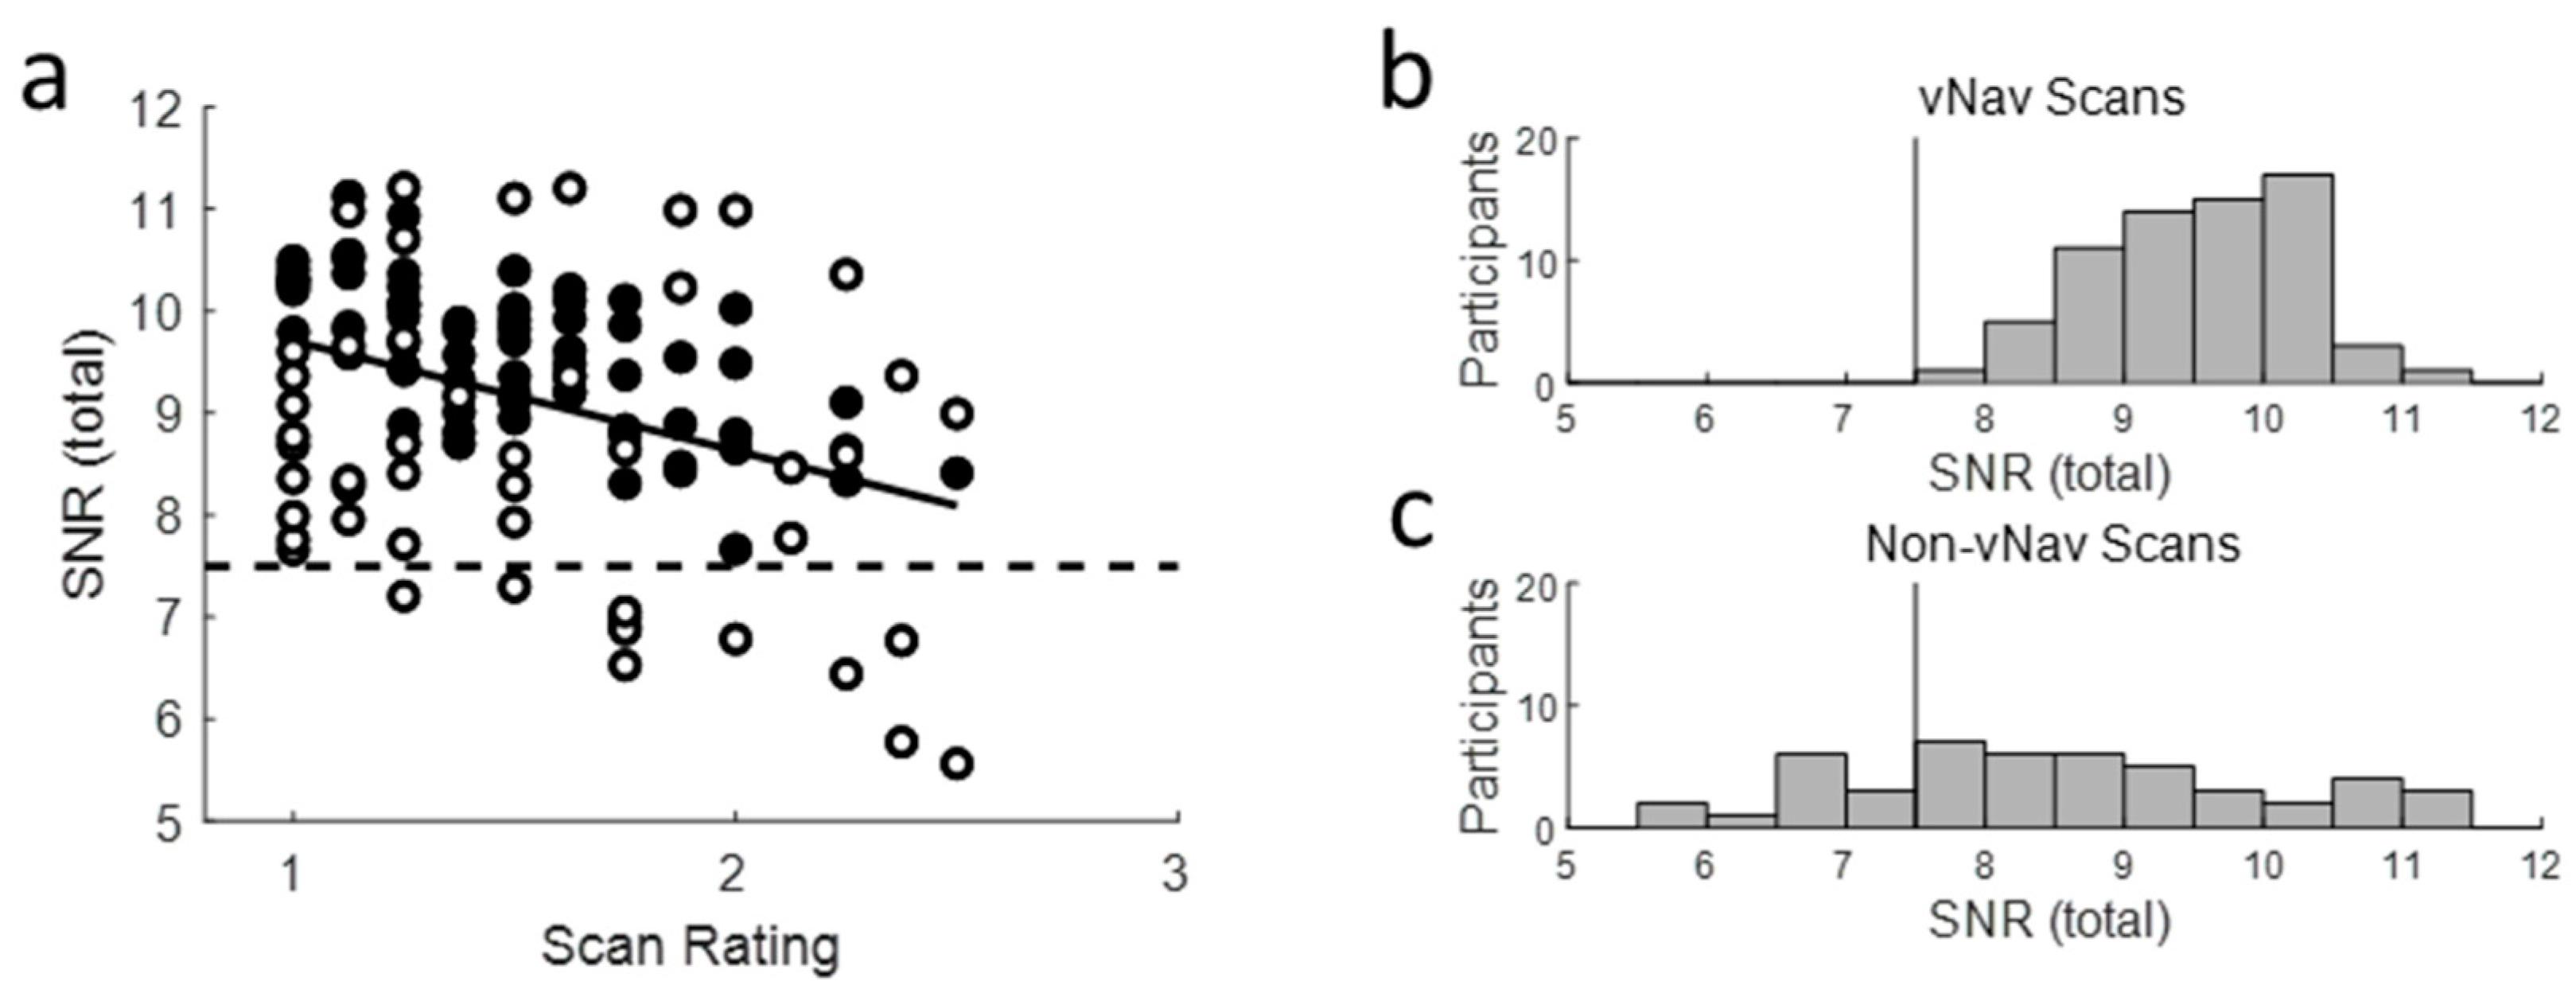
2.4. Scan QC
2.5. Analysis
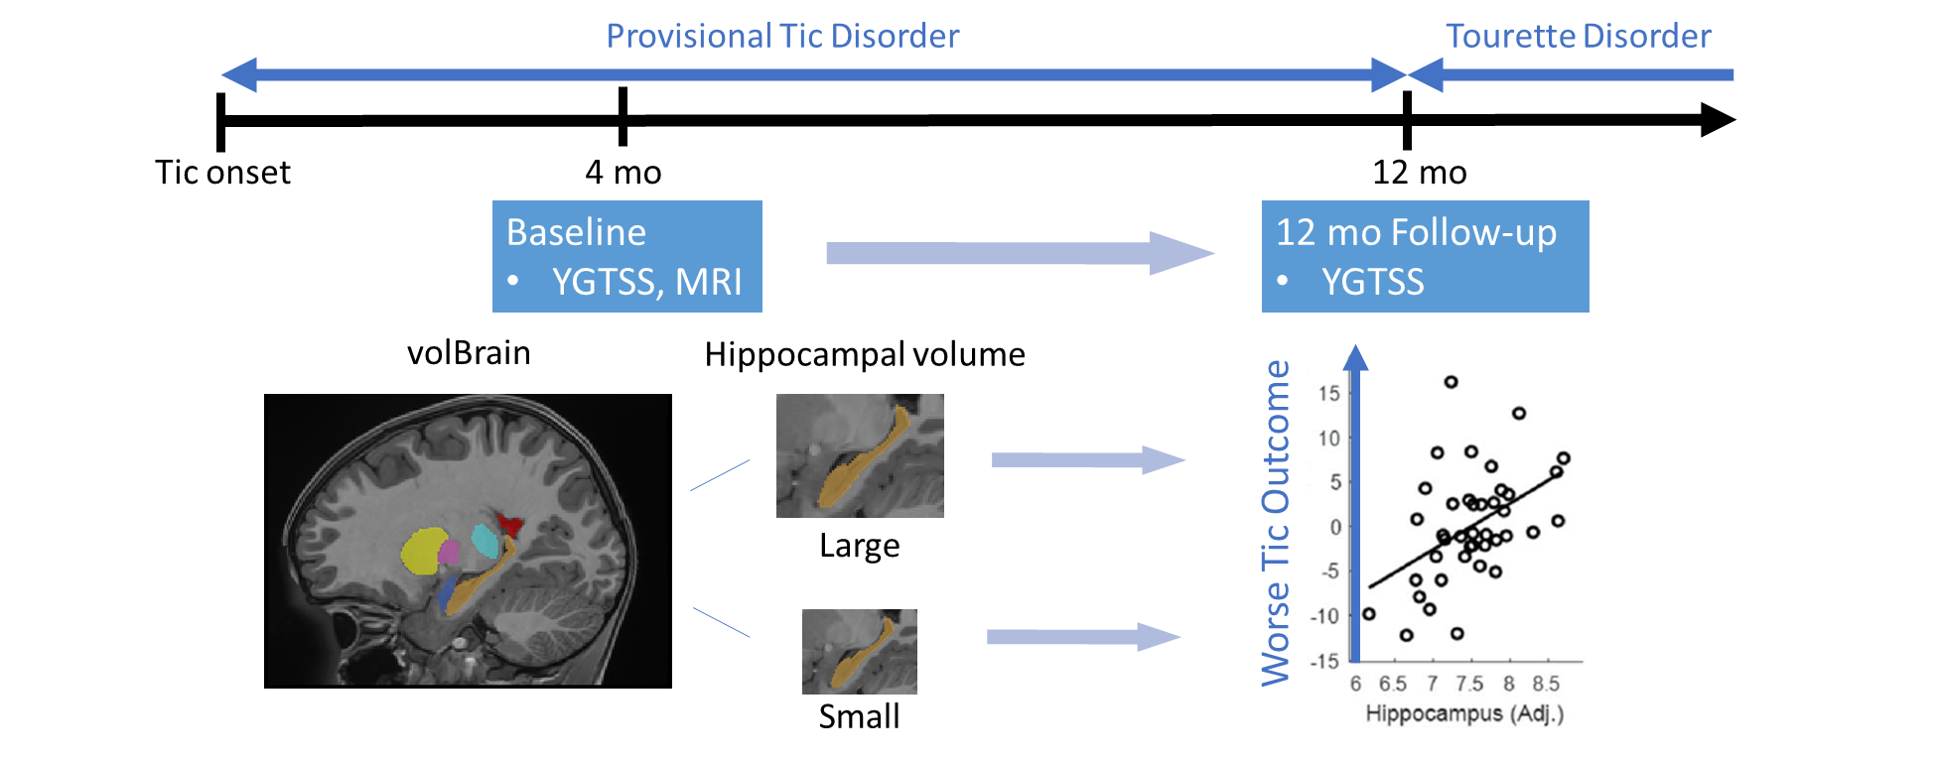
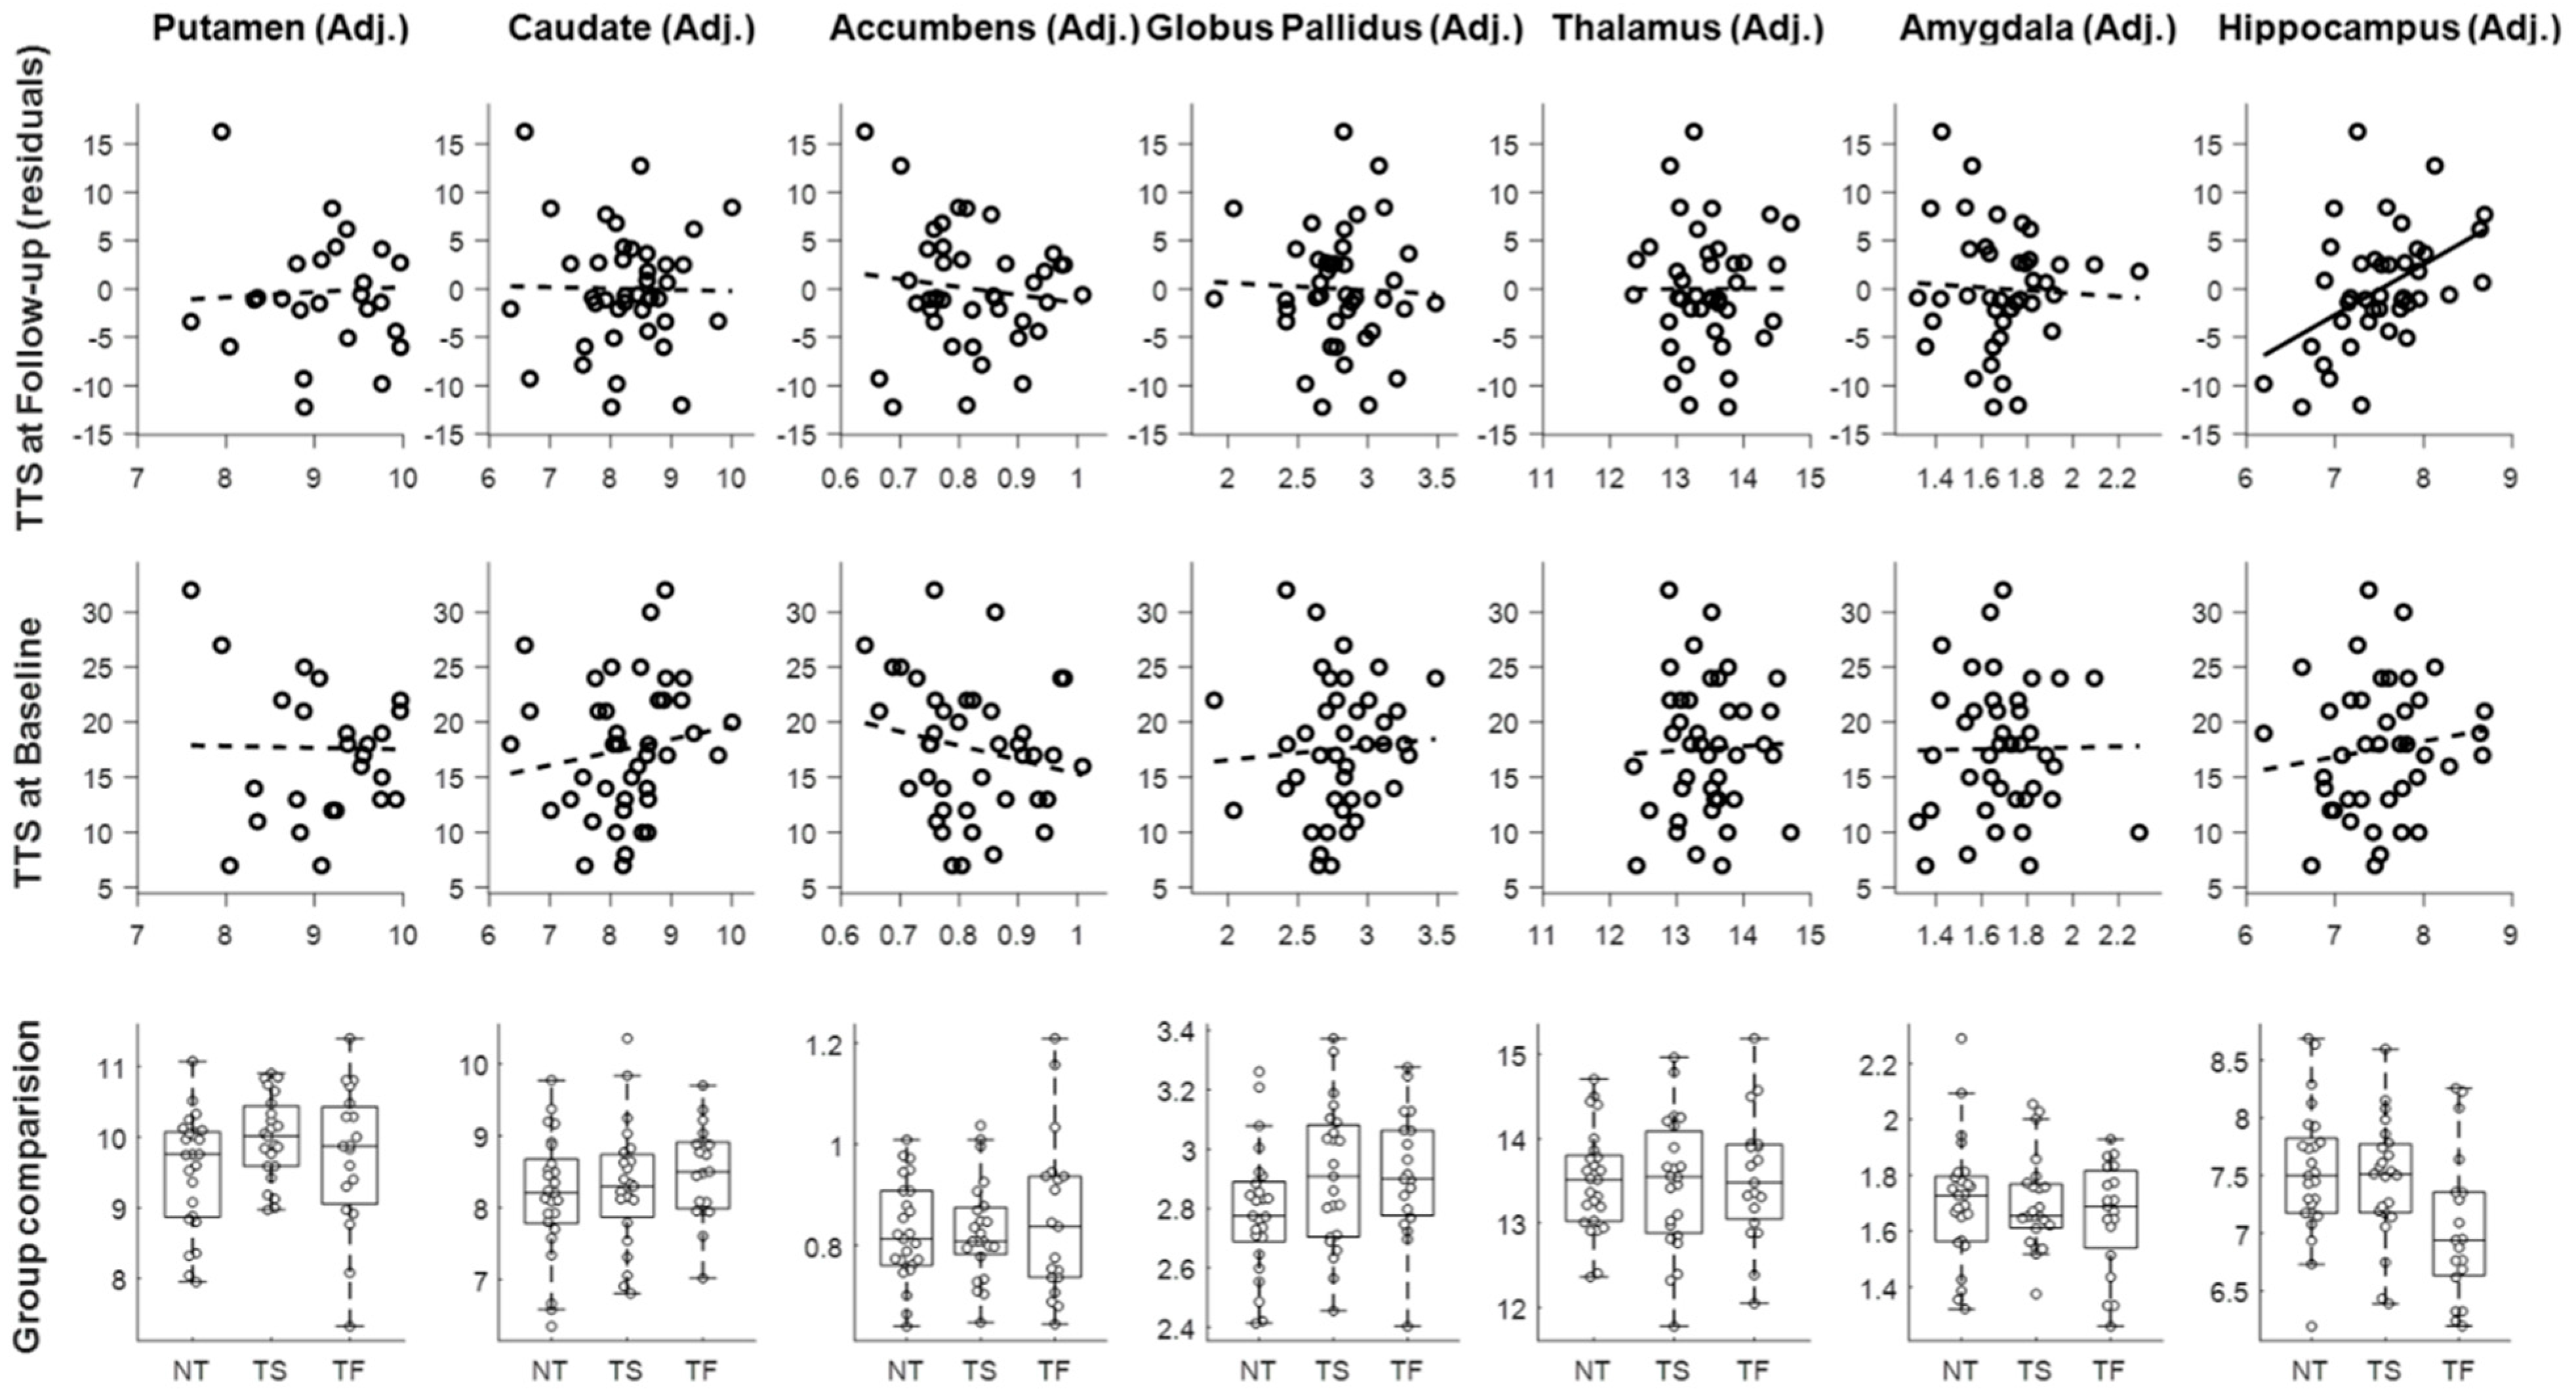
3. Results
3.1. Mean Clinical Change
3.2. Predictors of Change in the NewTics Group
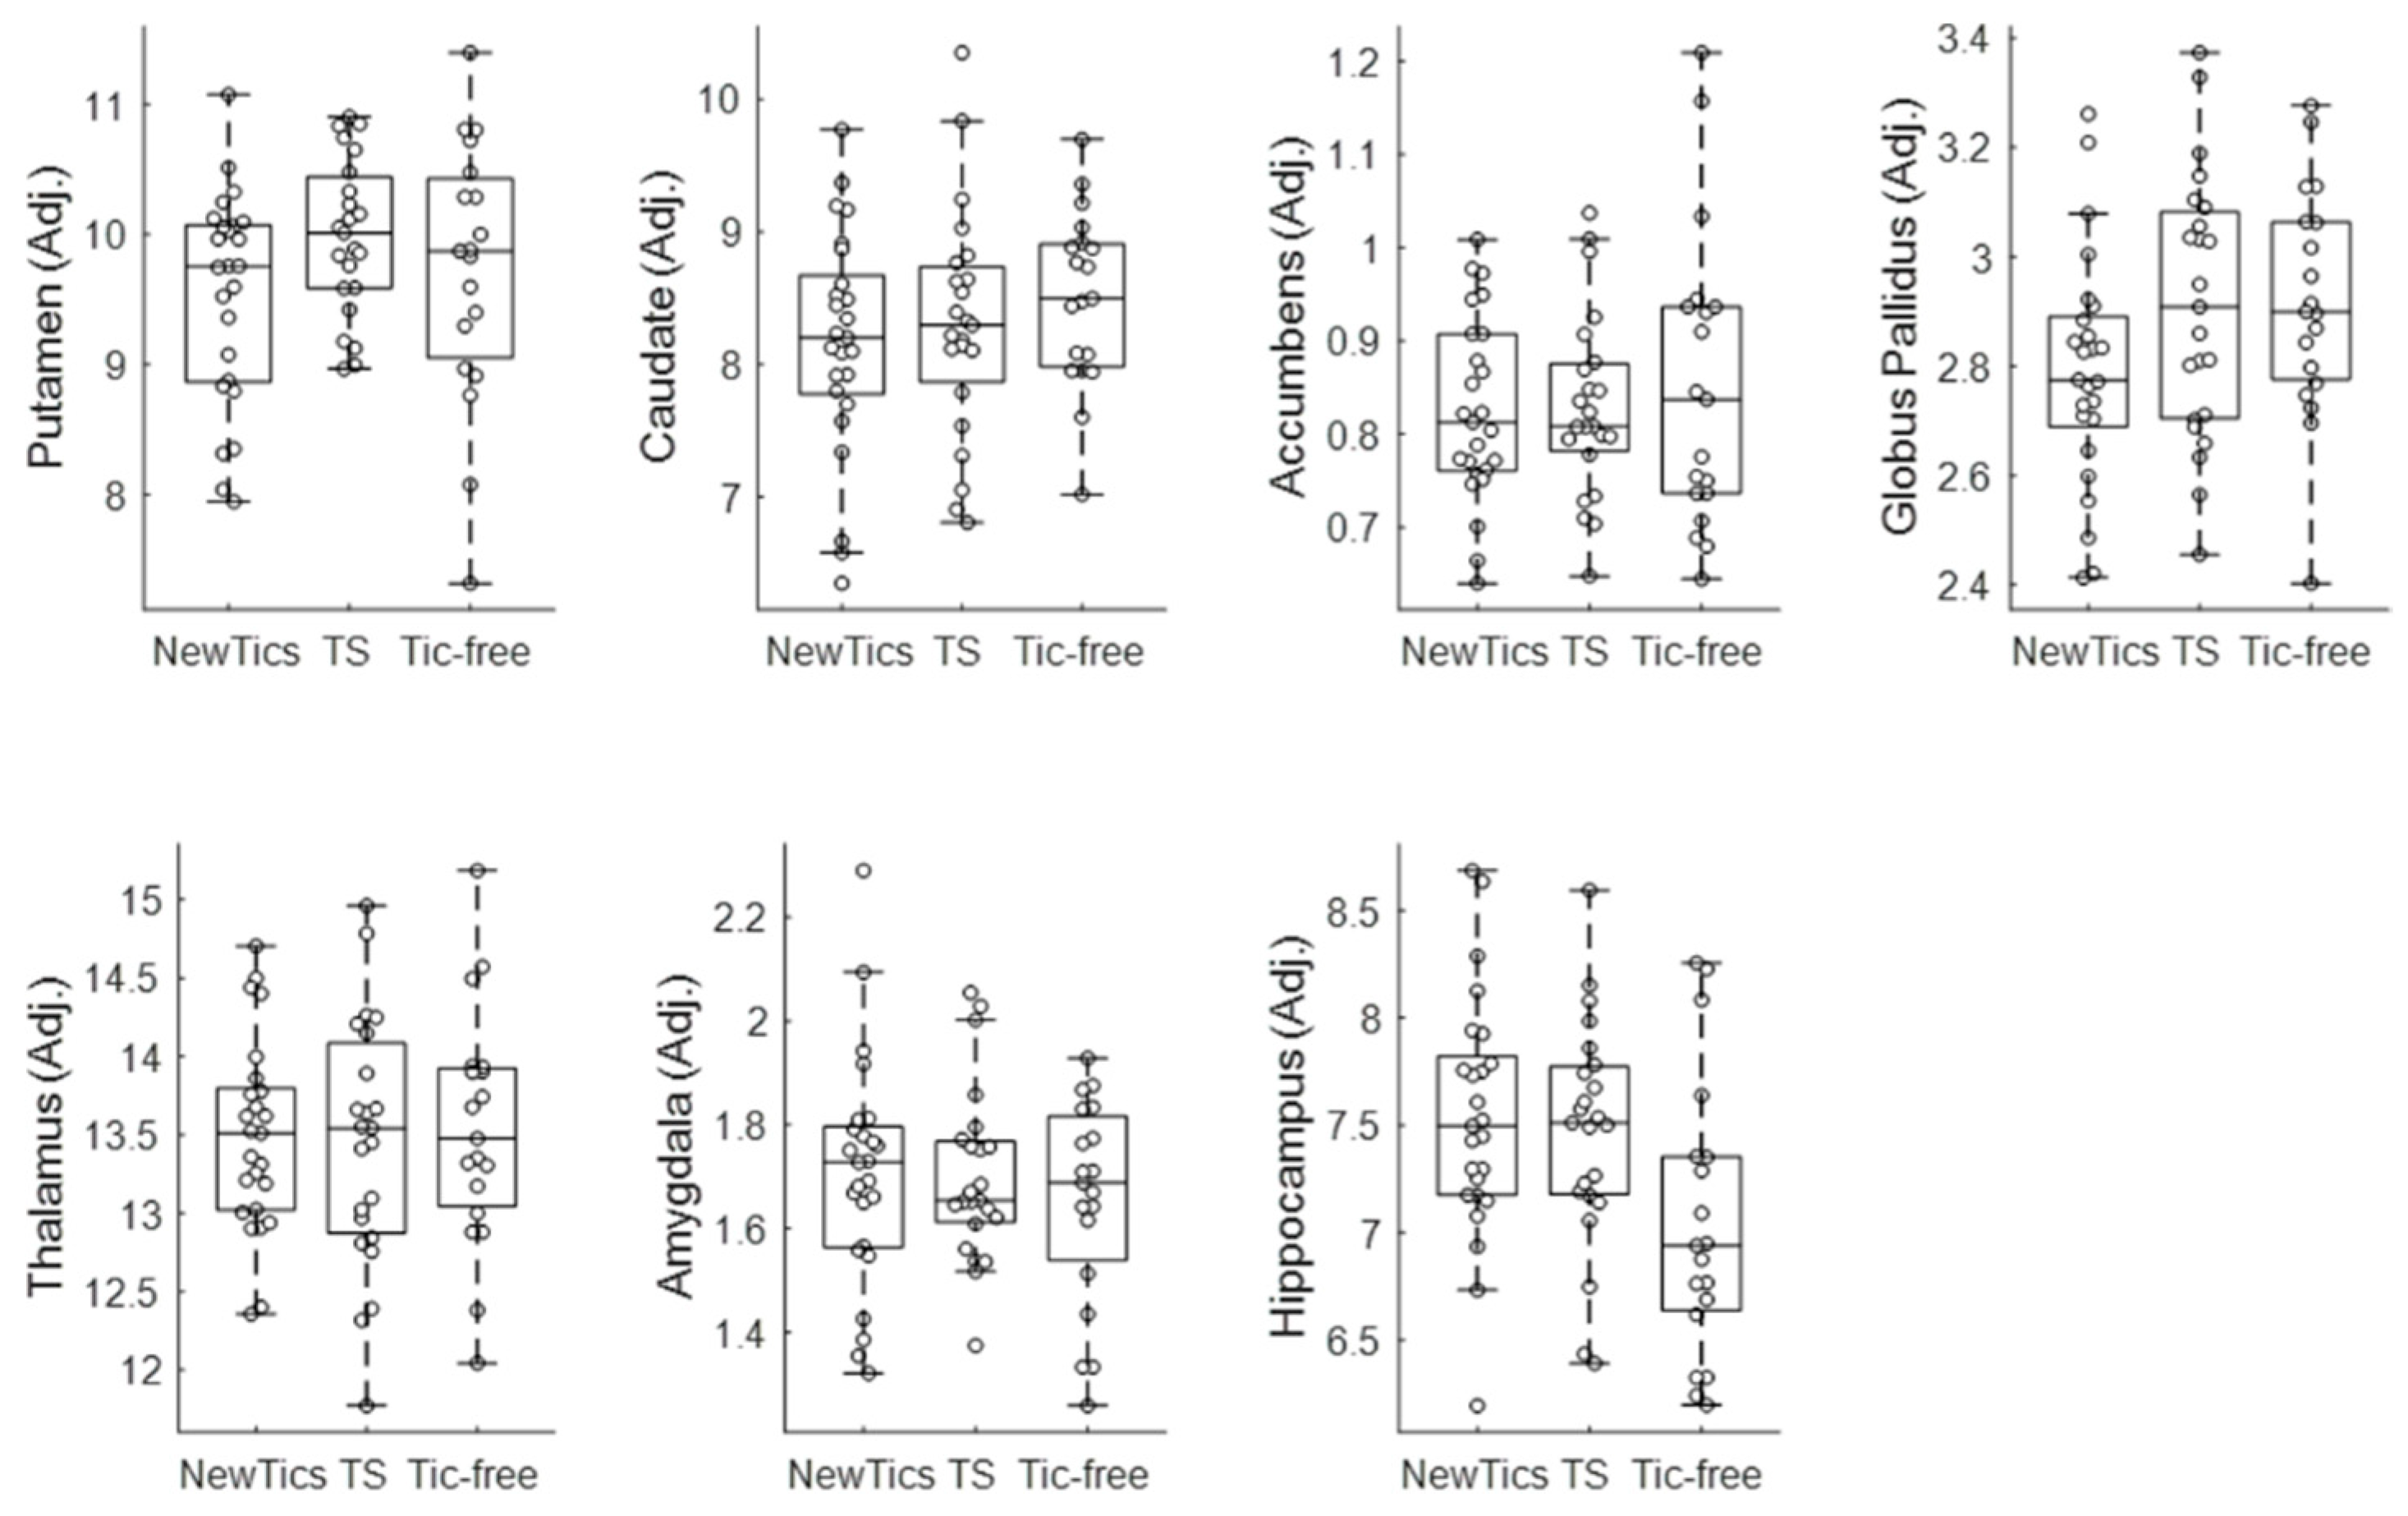
3.3. Group Comparisons
3.4. Subgroup Analysis
4. Discussion
Supplementary Materials
Author Contributions
Funding
Acknowledgments
Conflicts of Interest
Data Availability
Appendix A. Structural MRI Collection Specifications

| vNav Category | Study | Scanner | Sequence Parameters | NewTics N | TS N | Tic-free N | Note |
|---|---|---|---|---|---|---|---|
| non-vNav | NewTics (Cohort 1) | Siemens Trio 3T | MPRAGE; tfl3d1_ns; Frames 176; FOV 224×256 Voxels; Vox. Res. 1.0 1.0 1.0; TR 2200; TE 2.34; TI 1000; flip angle 7 | 23 (12 QC fail) | - | - | Data collected between 2010-Oct and 2015-Jul |
| non-vNav | NewTics (Cohort 2) | Siemens Prisma 3T | MPRAGE; *tfl3d1_16ns; Frames 196; FOV 240×256 Voxels; Vox. Res. 0.8 0.8 0.8; TR 2400; TE 2.22; TI 1000; flip angle 8 | 6 (1 QC fail) | - | - | Data collected between 2015-Dec and 2016-Sep |
| vNav | NewTics (Cohort 3) | Siemens Prisma 3T | MPRAGE; tfl3d1_16ns; Frames 196; FOV 256×256 Voxels; Vox. Res. 1.0 1.0 1.0; TR 2500; TE 2.9; TI 1070; flip angle 8 | 25 | 27 (4 QC fail) | 19 | Data collected between 2016-Oct and 2019-Dec |
| non-vNav | CTS | Siemens Trio 3T | MPRAGE; *tfl3d1_ns; Frames 256; FOV 256×256 Voxels; Vox. Res. 1.0 1.0 1.0; TR 2400; TE 3.08; TI 1000; flip angle 8 | - | 7 | 4 | |
| non-vNav | JCA | Siemens Trio 3T | MPRAGE; *tfl3d1_ns; Frames 176; FOV 256×256 Voxels; Vox. Res. 1.0 1.0 1.0; TR 2400; TE 3.08; TI 1000; flip angle 8 | - | 4 | - | |
| non-vNav | TRACK | Siemens Trio 3T | MPRAGE; *tfl3d1_ns; Frames 192; FOV 256×256 Voxels; Vox. Res. 1.0 1.0 1.0; TR 2400; TE 3.16; TI 1000; flip angle 8 | - | - | 4 | |
| vNav | NEWT | Siemens Prisma 3T | MPRAGE; tfl3d1_16ns; Frames 192; FOV 256×256 Voxels; Vox. Res. 1.0 1.0 1.0; TR 2500; TE 2.9; TI 1070; flip angle 8 | - | - | 8 | |
| vNav | MSCPI | Siemens Prisma 3T | MPRAGE; tfl3d1_16ns; Frames 192; FOV 256×256 Voxels; Vox. Res. 1.0 1.0 1.0; TR 2500; TE 2.9; TI 1070; flip angle 8 | - | - | 3 | |
| non-vNav | TR | Siemens Trio 3T | MPRAGE; *tfl3d1_ns; Frames 176; FOV 180×180 Voxels; Vox. Res. 1.0 1.0 1.0; TR 2400; TE 3.28; TI 1000; flip angle 8 | - | - | 1 (1 QC fail) | |
| non-vNav | TR | Siemens Trio 3T | MPRAGE; *tfl3d1_ns; Frames 176; FOV 256×256 Voxels; Vox. Res. 1.0 1.0 1.0; TR 2400; TE 3.12; TI 1000; flip angle 8 | - | - | 1 | |
| non-vNav | TR | Siemens Trio 3T | MPRAGE; *tfl3d1_ns; Frames 174; FOV 256×256 Voxels; Vox. Res. 1.0 1.0 1.0; TR 2400; TE 3.08; TI 1000; flip angle 8 | - | - | 1 |
Appendix B. Scan Quality Control

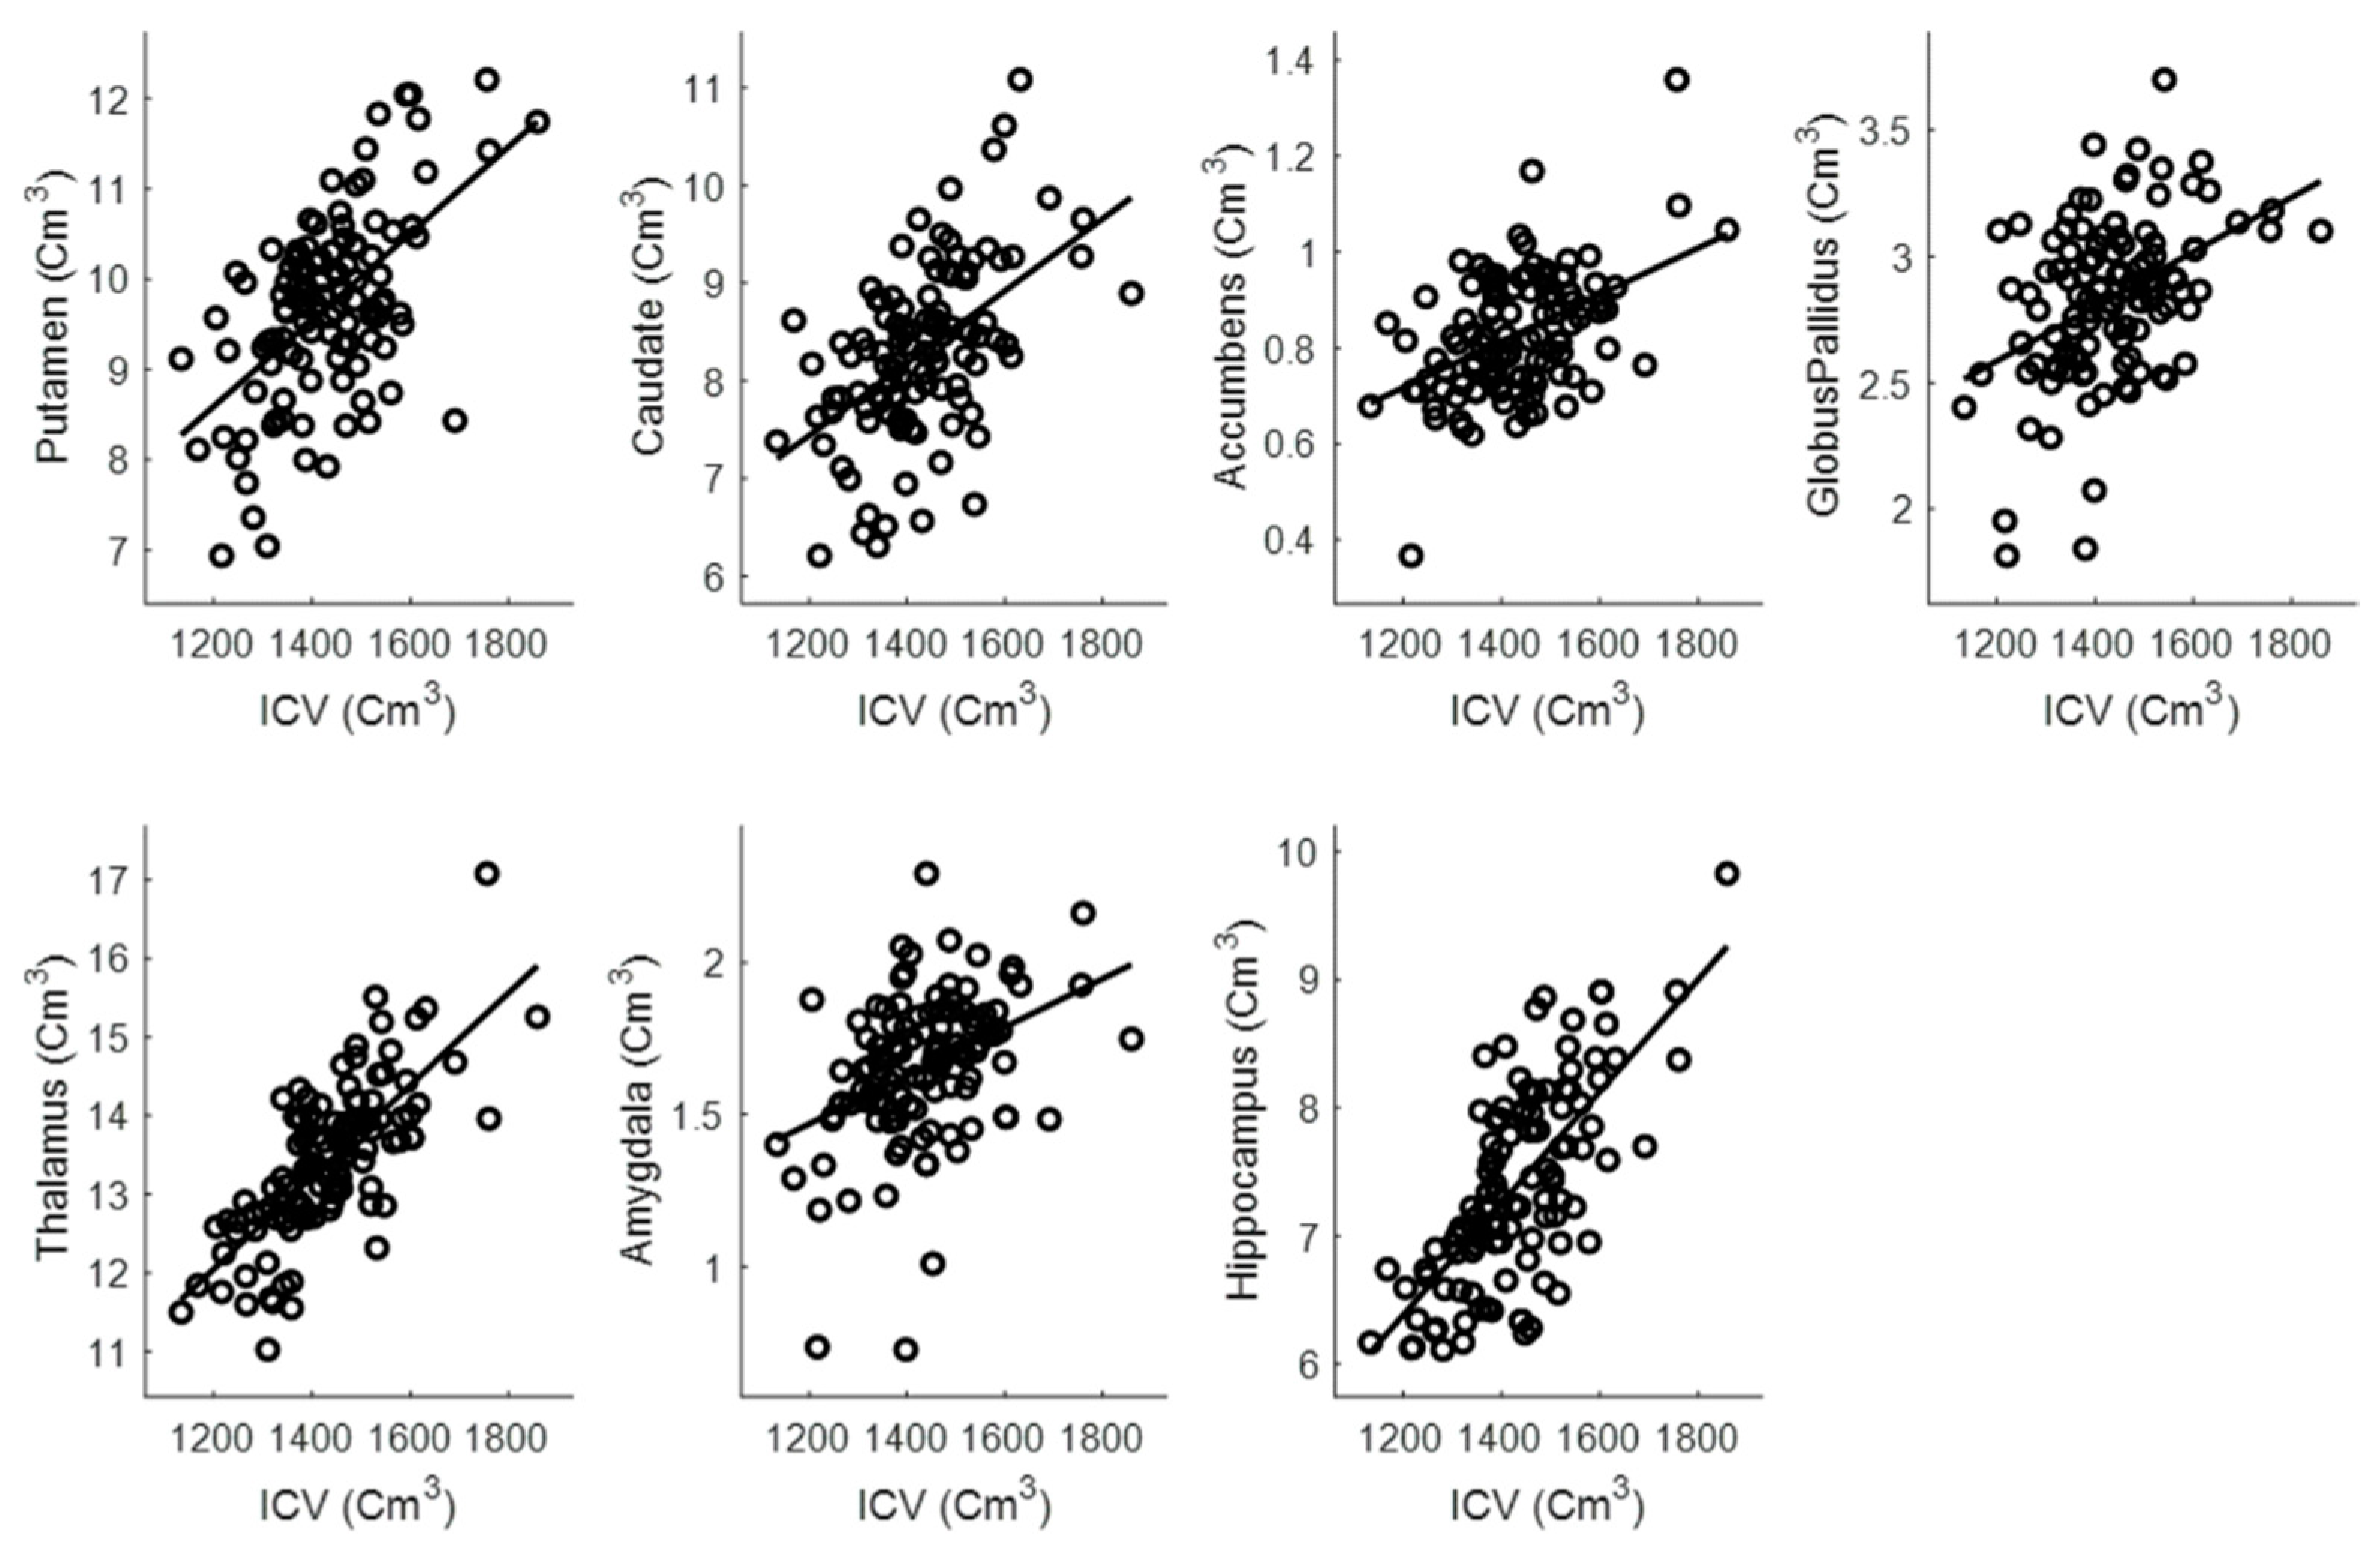
Appendix C. Intracranial Volume Adjustment

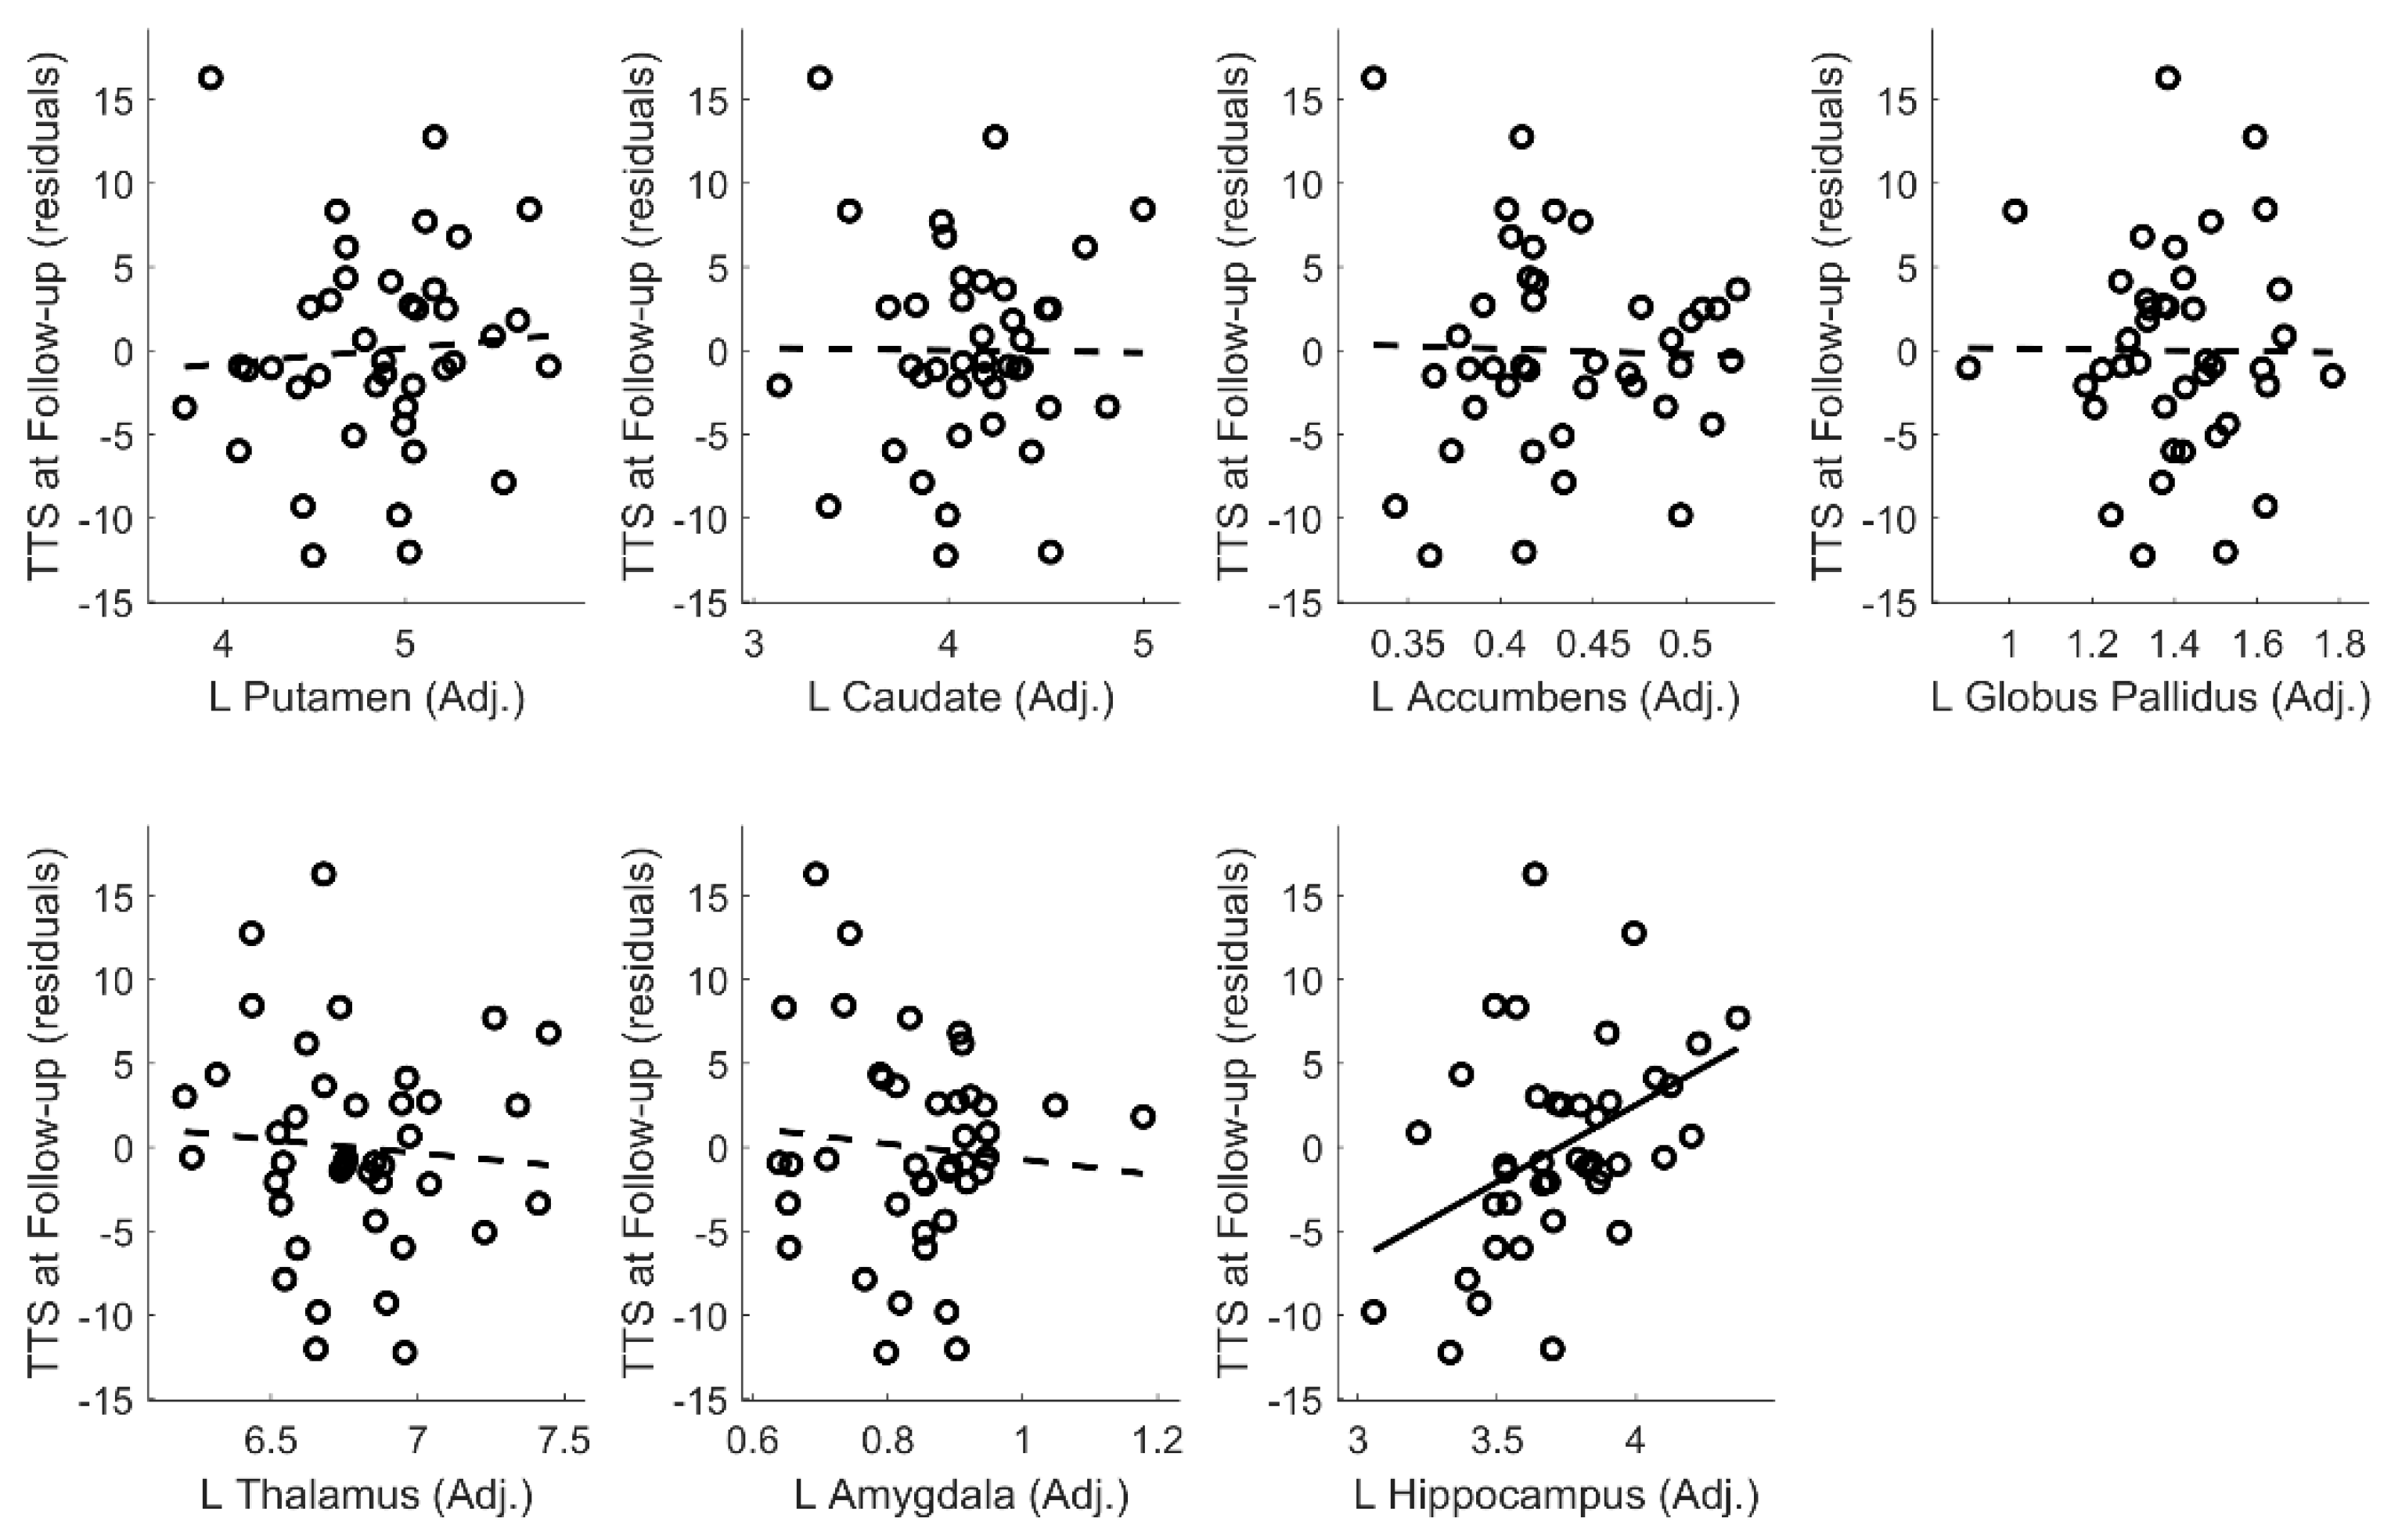
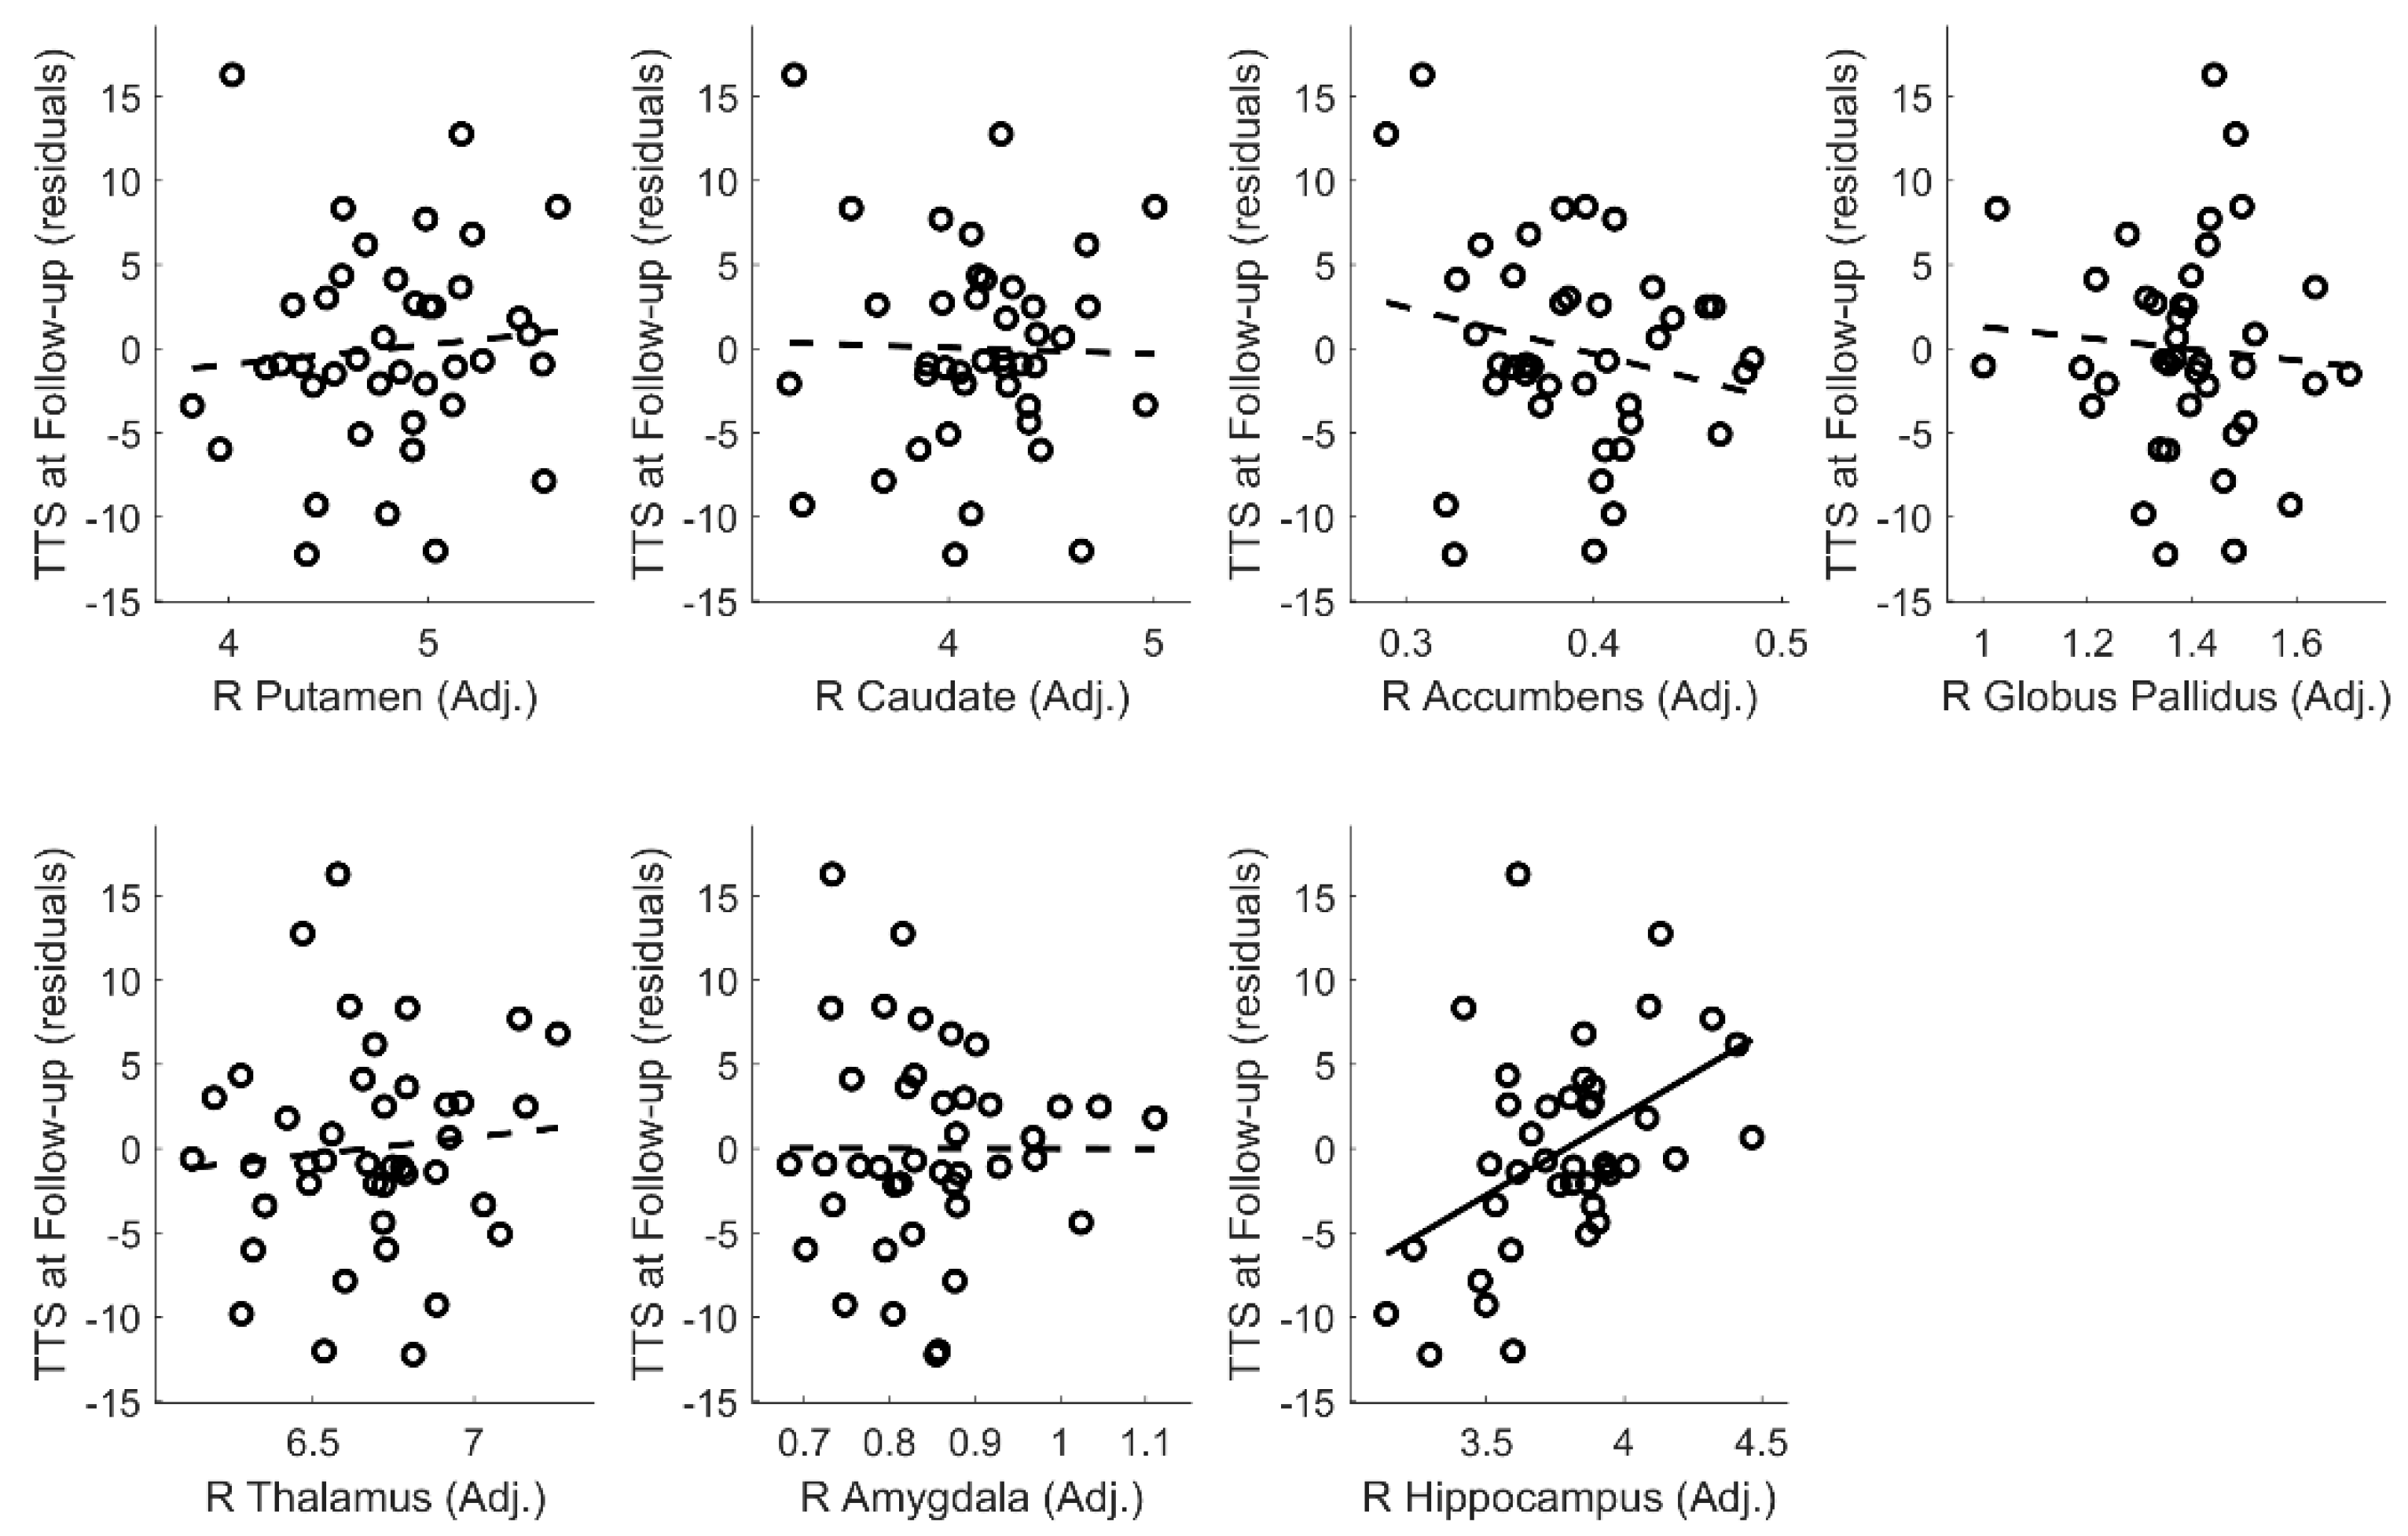
Appendix D. Tic Severity Prognosis by Volumes of Left and Right Subcortical Structures


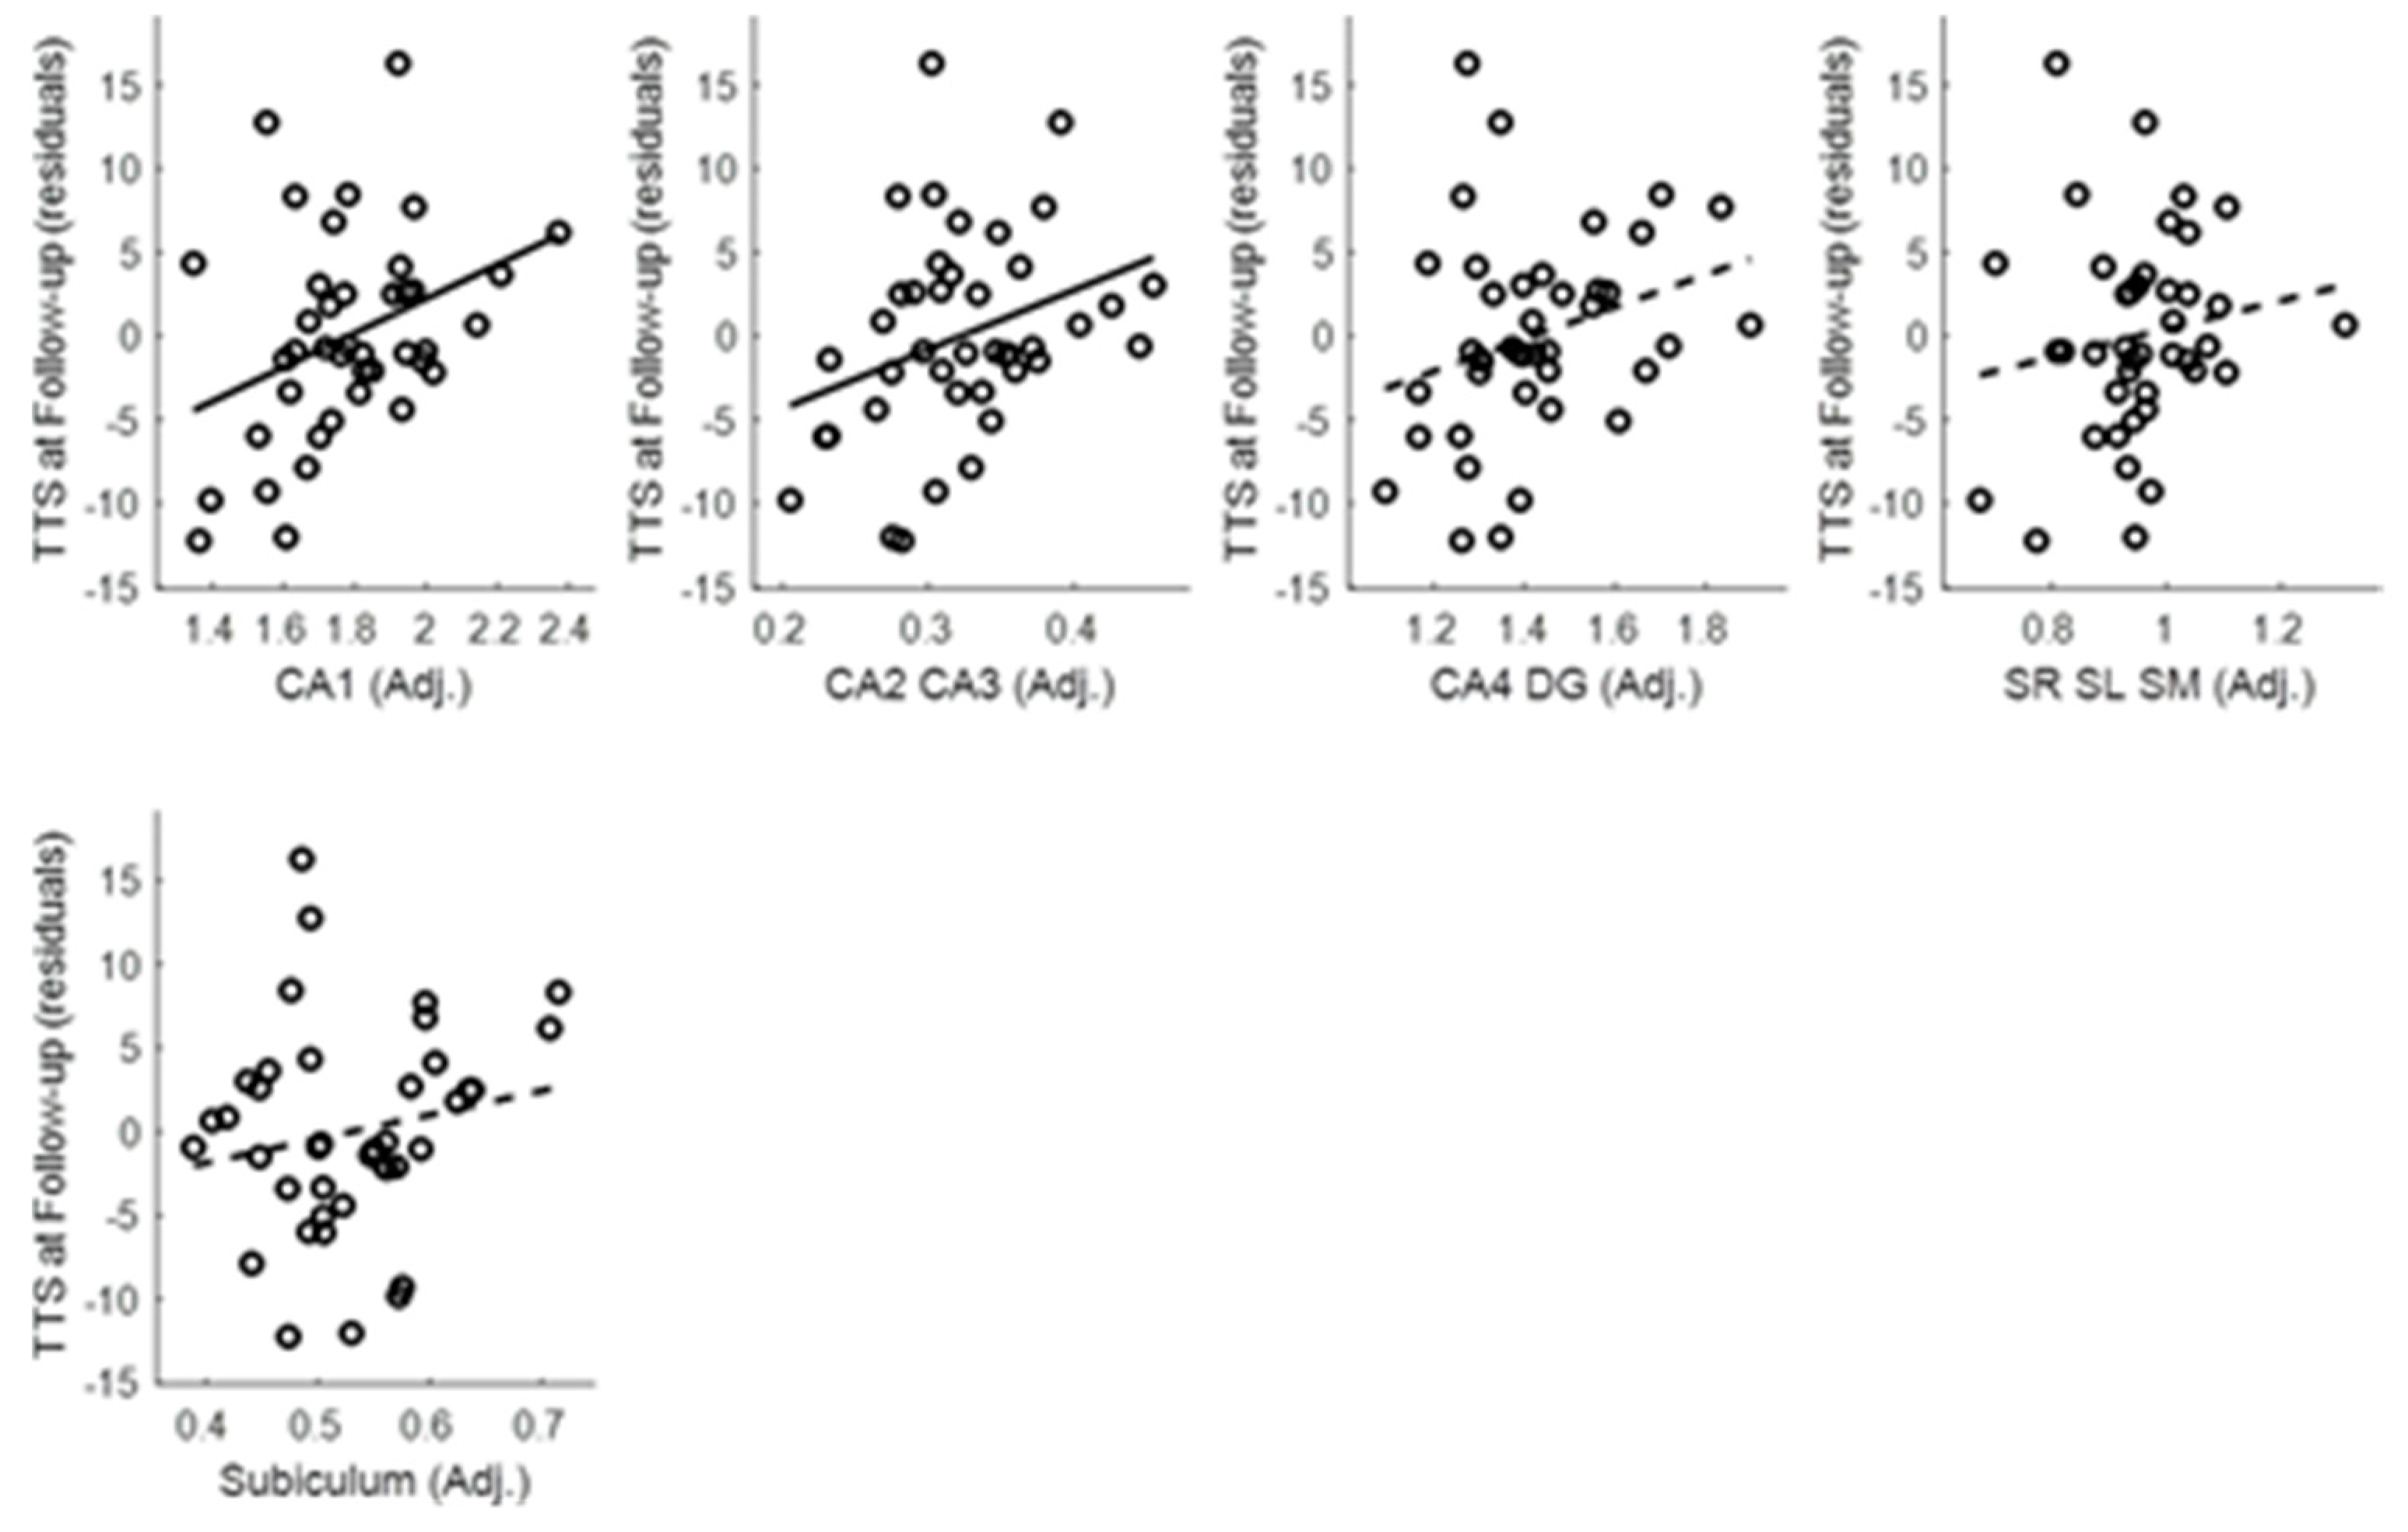
Appendix E. Hippocampal Subfield Analyses

Appendix F. Group Comparison within the Selected Subsample

References
- American Psychiatric Association Diagnostic and Statistical Manual of Mental Disorders, 5th ed.; American Psychiatric Publishing: Washington, DC, USA, 2013.
- Black, K.J.; Black, E.R.; Greene, D.J.; Schlaggar, B.L. Provisional Tic Disorder: What to tell parents when their child first starts ticcing. F1000Research 2016, 5, 696. [Google Scholar] [CrossRef]
- Kim, S.; Greene, D.J.; Bihun, E.C.; Koller, J.M.; Hampton, J.M.; Acevedo, H.; Reiersen, A.M.; Schlaggar, B.L.; Black, K.J. Provisional Tic Disorder is not so transient. Sci. Rep. 2019, 9, 3951. [Google Scholar] [CrossRef]
- Makki, M.I.; Behen, M.; Bhatt, A.; Wilson, B.; Chugani, H.T. Microstructural abnormalities of striatum and thalamus in children with Tourette syndrome. Mov. Disord. 2008, 23, 2349–2356. [Google Scholar] [CrossRef]
- Peterson, B.S.; Thomas, P.; Kane, M.J.; Scahill, L.; Zhang, H.; Bronen, R.; King, R.A.; Leckman, J.F.; Staib, L. Basal Ganglia Volumes in Patients with Gilles de la Tourette Syndrome. Arch. Gen. Psychiatry 2003, 60, 415–424. [Google Scholar] [CrossRef]
- Moriarty, J.; Varma, A.R.; Stevens, J.; Fish, M.; Trimble, M.R.; Robertson, M.M. A volumetric MRI study of Gilles de la Tourette’s syndrome. Neurology 1997, 49, 410–415. [Google Scholar] [CrossRef]
- Müller-Vahl, K.R.; Kaufmann, J.; Grosskreutz, J.; Dengler, R.; Emrich, H.M.; Peschel, T. Prefrontal and anterior cingulate cortex abnormalities in Tourette Syndrome: Evidence from voxel-based morphometry and magnetization transfer imaging. BMC Neurosci. 2009, 10, 47. [Google Scholar] [CrossRef]
- Greene, D.J.; Williams, A.C., III; Koller, J.M.; Schlaggar, B.L.; Black, K.J.; The Tourette Association of America Neuroimaging Consortium. Brain structure in pediatric Tourette syndrome. Mol. Psychiatry 2017, 22, 972–980. [Google Scholar] [CrossRef]
- Bloch, M.H.; Leckman, J.F.; Zhu, H.; Peterson, B.S. Caudate volumes in childhood predict symptom severity in adults with Tourette syndrome. Neurology 2005, 65, 1253–1258. [Google Scholar] [CrossRef]
- Makki, M.I.; Govindan, R.M.; Wilson, B.J.; Behen, M.E.; Chugani, H.T. Altered Fronto-Striato-Thalamic Connectivity in Children with Tourette Syndrome Assessed with Diffusion Tensor MRI and Probabilistic Fiber Tracking. J. Child Neurol. 2009, 24, 669–678. [Google Scholar] [CrossRef]
- Ludolph, A.G.; Juengling, F.; Libal, G.; Ludolph, A.C.; Fegert, J.M.; Kassubek, J. Grey-matter abnormalities in boys with Tourette syndrome: Magnetic resonance imaging study using optimised voxel-based morphometry. Br. J. Psychiatry 2006, 188, 484–485. [Google Scholar] [CrossRef] [PubMed]
- Roessner, V.; Overlack, S.; Schmidt-Samoa, C.; Baudewig, J.; Dechent, P.; Rothenberger, A.; Helms, G. Increased putamen and callosal motor subregion in treatment-naïve boys with Tourette syndrome indicates changes in the bihemispheric motor network. J. Child Psychol. Psychiatry 2010, 52, 306–314. [Google Scholar] [CrossRef]
- Worbe, Y.; Marrakchi-Kacem, L.; LeComte, S.; Valabregue, R.; Poupon, F.; Guevara, P.; Tucholka, A.; Mangin, J.-F.; Vidailhet, M.; Lehericy, S.; et al. Altered structural connectivity of cortico-striato-pallido-thalamic networks in Gilles de la Tourette syndrome. Brain 2014, 138, 472–482. [Google Scholar] [CrossRef]
- Lee, J.-S.; Yoo, S.-S.; Cho, S.-Y.; Ock, S.-M.; Lim, M.-K.; Panych, L.P. Abnormal thalamic volume in treatment-naive boys with Tourette syndrome. Acta Psychiatr. Scand. 2006, 113, 64–67. [Google Scholar] [CrossRef]
- Miller, A.M.; Bansal, R.; Hao, X.; Sanchez-Pena, J.P.; Sobel, L.J.; Liu, J.; Xu, N.; Zhu, H.; Chakravarty, M.M.; Durkin, K.; et al. Enlargement of thalamic nuclei in Tourette syndrome. Arch. Gen. Psychiatry 2010, 67, 955–964. [Google Scholar] [CrossRef]
- Peterson, B.S.; Choi, H.A.; Hao, X.; Amat, J.A.; Zhu, H.; Whiteman, R.; Liu, J.; Xu, N.; Bansal, R. Morphologic Features of the Amygdala and Hippocampus in Children and Adults With Tourette Syndrome. Arch. Gen. Psychiatry 2007, 64, 1281–1291. [Google Scholar] [CrossRef]
- Worbe, Y.; Gerardin, E.; Hartmann, A.; Valabregue, R.; Chupin, M.; Tremblay, L.; Vidailhet, M.; Colliot, O.; Lehéricy, S. Distinct structural changes underpin clinical phenotypes in patients with Gilles de la Tourette syndrome. Brain 2010, 133, 3649–3660. [Google Scholar] [CrossRef]
- Wittfoth, M.; Bornmann, S.; Peschel, T.; Grosskreutz, J.; Glahn, A.; Buddensiek, N.; Becker, H.; Dengler, R.; Müller-Vahl, K.R. Lateral frontal cortex volume reduction in Tourette syndrome revealed by VBM. BMC Neurosci. 2012, 13, 17. [Google Scholar] [CrossRef]
- Alexander-Bloch, A.; Clasen, L.; Stockman, M.; Ronan, L.; LaLonde, F.; Giedd, J.; Raznahan, A. Subtle in-scanner motion biases automated measurement of brain anatomy from in vivo MRI. Hum. Brain Mapp. 2016, 37, 2385–2397. [Google Scholar] [CrossRef]
- Reuter, M.; Tisdall, D.; Qureshi, A.; Buckner, R.L.; Van Der Kouwe, A.J.W.; Fischl, B. Head Motion during MRI Acquisition Reduces Gray Matter Volume and Thickness Estimates. NeuroImage 2014, 107, 107–115. [Google Scholar] [CrossRef]
- Tisdall, D.; Reuter, M.; Qureshi, A.; Buckner, R.L.; Fischl, B.; Van Der Kouwe, A.J.W. Prospective motion correction with volumetric navigators (vNavs) reduces the bias and variance in brain morphometry induced by subject motion. NeuroImage 2015, 127, 11–22. [Google Scholar] [CrossRef]
- Black, K.J.; Kim, S.; Greene, D.; Schlaggar, B.L. The New Tics study: A novel approach to pathophysiology and cause of tic disorders. J. Psychiatr. Brain Sci. 2020, in press. [Google Scholar] [CrossRef]
- Tisdall, D.; Hess, A.T.; Reuter, M.; Meintjes, E.; Fischl, B.; Van Der Kouwe, A.J.W. Volumetric navigators for prospective motion correction and selective reacquisition in neuroanatomical MRI. Magn. Reson. Med. 2011, 68, 389–399. [Google Scholar] [CrossRef]
- Esteban, O.; Birman, D.; Schaer, M.; Koyejo, O.; Poldrack, R.A.; Gorgolewski, K.J. MRIQC: Advancing the automatic prediction of image quality in MRI from unseen sites. PLoS ONE 2017, 12, e0184661. [Google Scholar] [CrossRef]
- Backhausen, L.L.; Herting, M.M.; Buse, J.; Roessner, V.; Smolka, M.N.; Vetter, N.C. Quality Control of Structural MRI Images Applied Using FreeSurfer—A Hands-On Workflow to Rate Motion Artifacts. Front. Mol. Neurosci. 2016, 10, 2385. [Google Scholar] [CrossRef]
- Manjón, J.V.; Coupe, P. volBrain: An Online MRI Brain Volumetry System. Front. Aging Neurosci. 2016, 10, 193. [Google Scholar] [CrossRef]
- Fischl, B.; Salat, D.H.; Busa, E.; Albert, M.; Dieterich, M.; Haselgrove, C.; Van Der Kouwe, A.; Killiany, R.; Kennedy, D.; Klaveness, S.; et al. Whole Brain Segmentation. Neuron 2002, 33, 341–355. [Google Scholar] [CrossRef]
- Patenaude, B.; Smith, S.M.; Kennedy, D.N.; Jenkinson, M. A Bayesian model of shape and appearance for subcortical brain segmentation. NeuroImage 2011, 56, 907–922. [Google Scholar] [CrossRef]
- Akudjedu, T.N.; Nabulsi, L.; Makelyte, M.; Scanlon, C.; Hehir, S.; Casey, H.; Ambati, S.; Kenney, J.; O’Donoghue, S.; McDermott, E.; et al. A comparative study of segmentation techniques for the quantification of brain subcortical volume. Brain Imaging Behav. 2018, 12, 1678–1695. [Google Scholar] [CrossRef]
- Næss-Schmidt, E.; Tietze, A.; Blicher, J.U.; Petersen, M.; Mikkelsen, I.K.; Coupe, P.; Manjón, J.V.; Eskildsen, S.F. Automatic thalamus and hippocampus segmentation from MP2RAGE: Comparison of publicly available methods and implications for DTI quantification. Int. J. Comput. Assist. Radiol. Surg. 2016, 11, 1979–1991. [Google Scholar] [CrossRef]
- Voevodskaya, O.; Simmons, A.; Nordenskjöld, R.; Kullberg, J.; Ahlström, H.; Lind, L.; Olof-Wahlund, L.; Larsson, E.-M.; Westman, E. The effects of intracranial volume adjustment approaches on multiple regional MRI volumes in healthy aging and Alzheimer’s disease. Front. Aging Neurosci. 2014, 6, 6. [Google Scholar] [CrossRef]
- Raftery, A.E. Bayesian model selection in social research. Sociol. Methodol. 1995, 25, 111–163. [Google Scholar] [CrossRef]
- Jeffreys, H. The Theory of Probability, 3rd ed.; Oxford University Press: Oxford, UK, 1961. [Google Scholar]
- Jarosz, A.; Wiley, J. What Are the Odds? A Practical Guide to Computing and Reporting Bayes Factors. J. Probl. Solving 2014, 7, 2. [Google Scholar] [CrossRef]
- Romero, J.E.; Coupe, P.; Manjón, J.V. HIPS: A new hippocampus subfield segmentation method. NeuroImage 2017, 163, 286–295. [Google Scholar] [CrossRef]
- Greene, D.J.; Black, K.J.; Schlaggar, B.L. Neurobiology and Functional Anatomy of Tic Disorders. Tourette Syndrome 2013, 238–275. [Google Scholar]
- Leckman, J.F.; A Riddle, M. Tourette’s Syndrome. Neuron 2000, 28, 349–354. [Google Scholar] [CrossRef]
- Kim, S.; Jackson, S.R.; Groom, M.J.; Jackson, G.M. Visuomotor learning and unlearning in children and adolescents with tourette syndrome. Cortex 2018, 109, 50–59. [Google Scholar] [CrossRef]
- Schapiro, A.C.; Reid, A.G.; Morgan, A.; Manoach, D.S.; Verfaellie, M.; Stickgold, R.A. The hippocampus is necessary for the consolidation of a task that does not require the hippocampus for initial learning. Hippocampus 2019, 29, 1091–1100. [Google Scholar] [CrossRef]
- Hong, S.B.; Shin, Y.-W.; Kim, S.H.; Yoo, S.Y.; Lee, J.-M.; Kim, I.Y.; Kim, S.I.; Kwon, J.S. Hippocampal shape deformity analysis in obsessive–compulsive disorder. Eur. Arch. Psychiatry Clin. Neurosci. 2007, 257, 185–190. [Google Scholar] [CrossRef]
- Atmaca, M.; Yildirim, H.; Ozdemir, H.; Ozler, S.; Kara, B.; Ozler, Z.; Kanmaz, E.; Mermi, O.; Tezcan, E. Hippocampus and amygdalar volumes in patients with refractory obsessive–compulsive disorder. Prog. Neuro-Psychopharmacol. Boil. Psychiatry 2008, 32, 1283–1286. [Google Scholar] [CrossRef]
- Reess, T.J.; Rus, O.G.; Gürsel, D.A.; Schmitz-Koep, B.; Wagner, G.; Berberich, G.; Koch, K. Association between hippocampus volume and symptom profiles in obsessive-compulsive disorder. NeuroImage Clin. 2017, 17, 474–480. [Google Scholar] [CrossRef]
- Gold, A.; Steuber, E.R.; White, L.K.; Pacheco, J.; Sachs, J.F.; Pagliaccio, D.; Berman, E.; Leibenluft, E.; Pine, D.S. Cortical Thickness and Subcortical Gray Matter Volume in Pediatric Anxiety Disorders. Neuropsychopharmacology 2017, 42, 2423–2433. [Google Scholar] [CrossRef]
- Jackson, S.R.; Loayza, J.; Crighton, M.; Sigurdsson, H.P.; Dyke, K.; Jackson, G.M. The role of the insula in the generation of motor tics and the experience of the premonitory urge-to-tic in Tourette syndrome. Cortex 2020, 126, 119–133. [Google Scholar] [CrossRef]
- Mufford, M.; Cheung, J.; Jahanshad, N.; Van Der Merwe, C.; Ding, L.; Groenewold, N.; Koen, N.; Chimusa, E.R.; Dalvie, S.; Psychiatric Genomics Consortium - Tourette Syndrome Working Group; et al. Concordance of genetic variation that increases risk for Tourette Syndrome and that influences its underlying neurocircuitry. Transl. Psychiatry 2019, 9, 120. [Google Scholar] [CrossRef]
- Bäumer, T.; Sajin, V.; Münchau, A. Childhood-Onset Movement Disorders: A Clinical Series of 606 Cases. Mov. Disord. Clin. Pract. 2016, 4, 437–440. [Google Scholar] [CrossRef]
- Kim, S.; Greene, D.J.; D’Andrea, C.B.; Bihun, E.C.; Koller, J.M.; O’Reilly, B.; Schlaggar, B.L.; Black, K.J. Hippocampal Volume in Provisional Tic Disorder Predicts Tic Severity at 12-Month Follow-up. 2020. Available online: https://www.biorxiv.org/content/10.1101/2020.02.05.935908v2 (accessed on 2 May 2020).


| Variable | NewTics | TS | Tic-Free |
|---|---|---|---|
| N | 41 | 34 | 40 |
| Sex | 30 M/11 F | 25 M/9 F | 29 M/11 F |
| Age | 7.87 ± 1.61 (5.41–10.81) | 8.33 ± 1.55 (5.11–10.99) | 8.18 ± 1.51 (5.19–10.92) |
| Tic duration (year) | 0.34 ± 0.16 (0.07–0.73) | 3.16 ± 1.67 (1.07–6.63) (n = 23) * | n/a |
| YGTSS total tic score (TTS) | 17.59 ± 6.10 (7–32) | 18.59 ± 6.54 (7–30) | n/a |
| YGTSS impairment | 8.29 ± 8.56 (0–30) | 11.17 ± 12.78 (0–40) (n = 30) * | n/a |
| ADHD diagnosis | 14 | 17 of 30 * | 10 of 26 * |
| OCD diagnosis | 3 | 5 of 30 * | 0 of 26 * |
| N with brain active medications | 9 | 10 of 30 * | 8 of 26 * |
| Variable | Baseline Visit | 12-Month Follow-Up |
|---|---|---|
| N | 41 | 41 |
| Tic duration (days) | 123.07 ± 58.52 (25–268) | 371.71 ± 11.13 (355–409) |
| YGTSS total tic score (TTS) | 17.59 ± 6.10 (7–32) | 13.78 ± 7.60 (0–37) |
| YGTSS impairment | 8.29 ± 8.56 (0–30) | 4.63 ± 6.84 (0–20) |
| DCI | 33.24 ± 14.36 (12–80) | 43.41 ± 15.85 (13–79) |
| PUTS | 13.66 ± 5.39 (9–31) (n = 38) * | 15.32 ± 5.65 (9–30) |
| ADHD rating scale (ARS) | 13.41 ± 11.81 (0–40) | 15.05 ± 11.92 (0–41) |
| ADHD diagnosis | 14 | 17 |
| CY-BOCS | 3.95 ± 6.45 (0–26) | 6.93 ± 8.62 (0–26) |
| OCD diagnosis | 3 | 9 |
| SRS | 48.83 ± 10.01 (35–78) | n/a |
| Variable | B | SEB | β | p | |
|---|---|---|---|---|---|
| Y = Total Tic Score at 12-Month Follow-up | |||||
| Hippocampus volume (Adjusted) | 5.311 | 1.627 | 0.381 | 0.002 | |
| Total tic score at baseline session | 0.676 | 0.145 | 0.542 | <0.001 | |
| Intercept | −38.02 | 12.197 | 0.003 | ||
© 2020 by the authors. Licensee MDPI, Basel, Switzerland. This article is an open access article distributed under the terms and conditions of the Creative Commons Attribution (CC BY) license (http://creativecommons.org/licenses/by/4.0/).
Share and Cite
Kim, S.; Greene, D.J.; D’Andrea, C.B.; Bihun, E.C.; Koller, J.M.; O’Reilly, B.; Schlaggar, B.L.; Black, K.J. Hippocampal Volume in Provisional Tic Disorder Predicts Tic Severity at 12-Month Follow-up. J. Clin. Med. 2020, 9, 1715. https://doi.org/10.3390/jcm9061715
Kim S, Greene DJ, D’Andrea CB, Bihun EC, Koller JM, O’Reilly B, Schlaggar BL, Black KJ. Hippocampal Volume in Provisional Tic Disorder Predicts Tic Severity at 12-Month Follow-up. Journal of Clinical Medicine. 2020; 9(6):1715. https://doi.org/10.3390/jcm9061715
Chicago/Turabian StyleKim, Soyoung, Deanna J. Greene, Carolina Badke D’Andrea, Emily C. Bihun, Jonathan M. Koller, Bridget O’Reilly, Bradley L. Schlaggar, and Kevin J. Black. 2020. "Hippocampal Volume in Provisional Tic Disorder Predicts Tic Severity at 12-Month Follow-up" Journal of Clinical Medicine 9, no. 6: 1715. https://doi.org/10.3390/jcm9061715
APA StyleKim, S., Greene, D. J., D’Andrea, C. B., Bihun, E. C., Koller, J. M., O’Reilly, B., Schlaggar, B. L., & Black, K. J. (2020). Hippocampal Volume in Provisional Tic Disorder Predicts Tic Severity at 12-Month Follow-up. Journal of Clinical Medicine, 9(6), 1715. https://doi.org/10.3390/jcm9061715