Body Composition Impact on Sleep in Young Adults: The Mediating Role of Sedentariness, Physical Activity, and Diet

 ,
,  ,
, 
Abstract
1. Introduction
2. Experimental Section
2.1. Study Protocol and Participants
2.2. Outcome Measurements
2.2.1. Sleep Duration and Quality
2.2.2. Anthropometry and Body Composition
2.2.3. Sedentary Time and Physical Activity Intensity Levels
2.2.4. Dietary Intake
2.3. Statistical Analysis
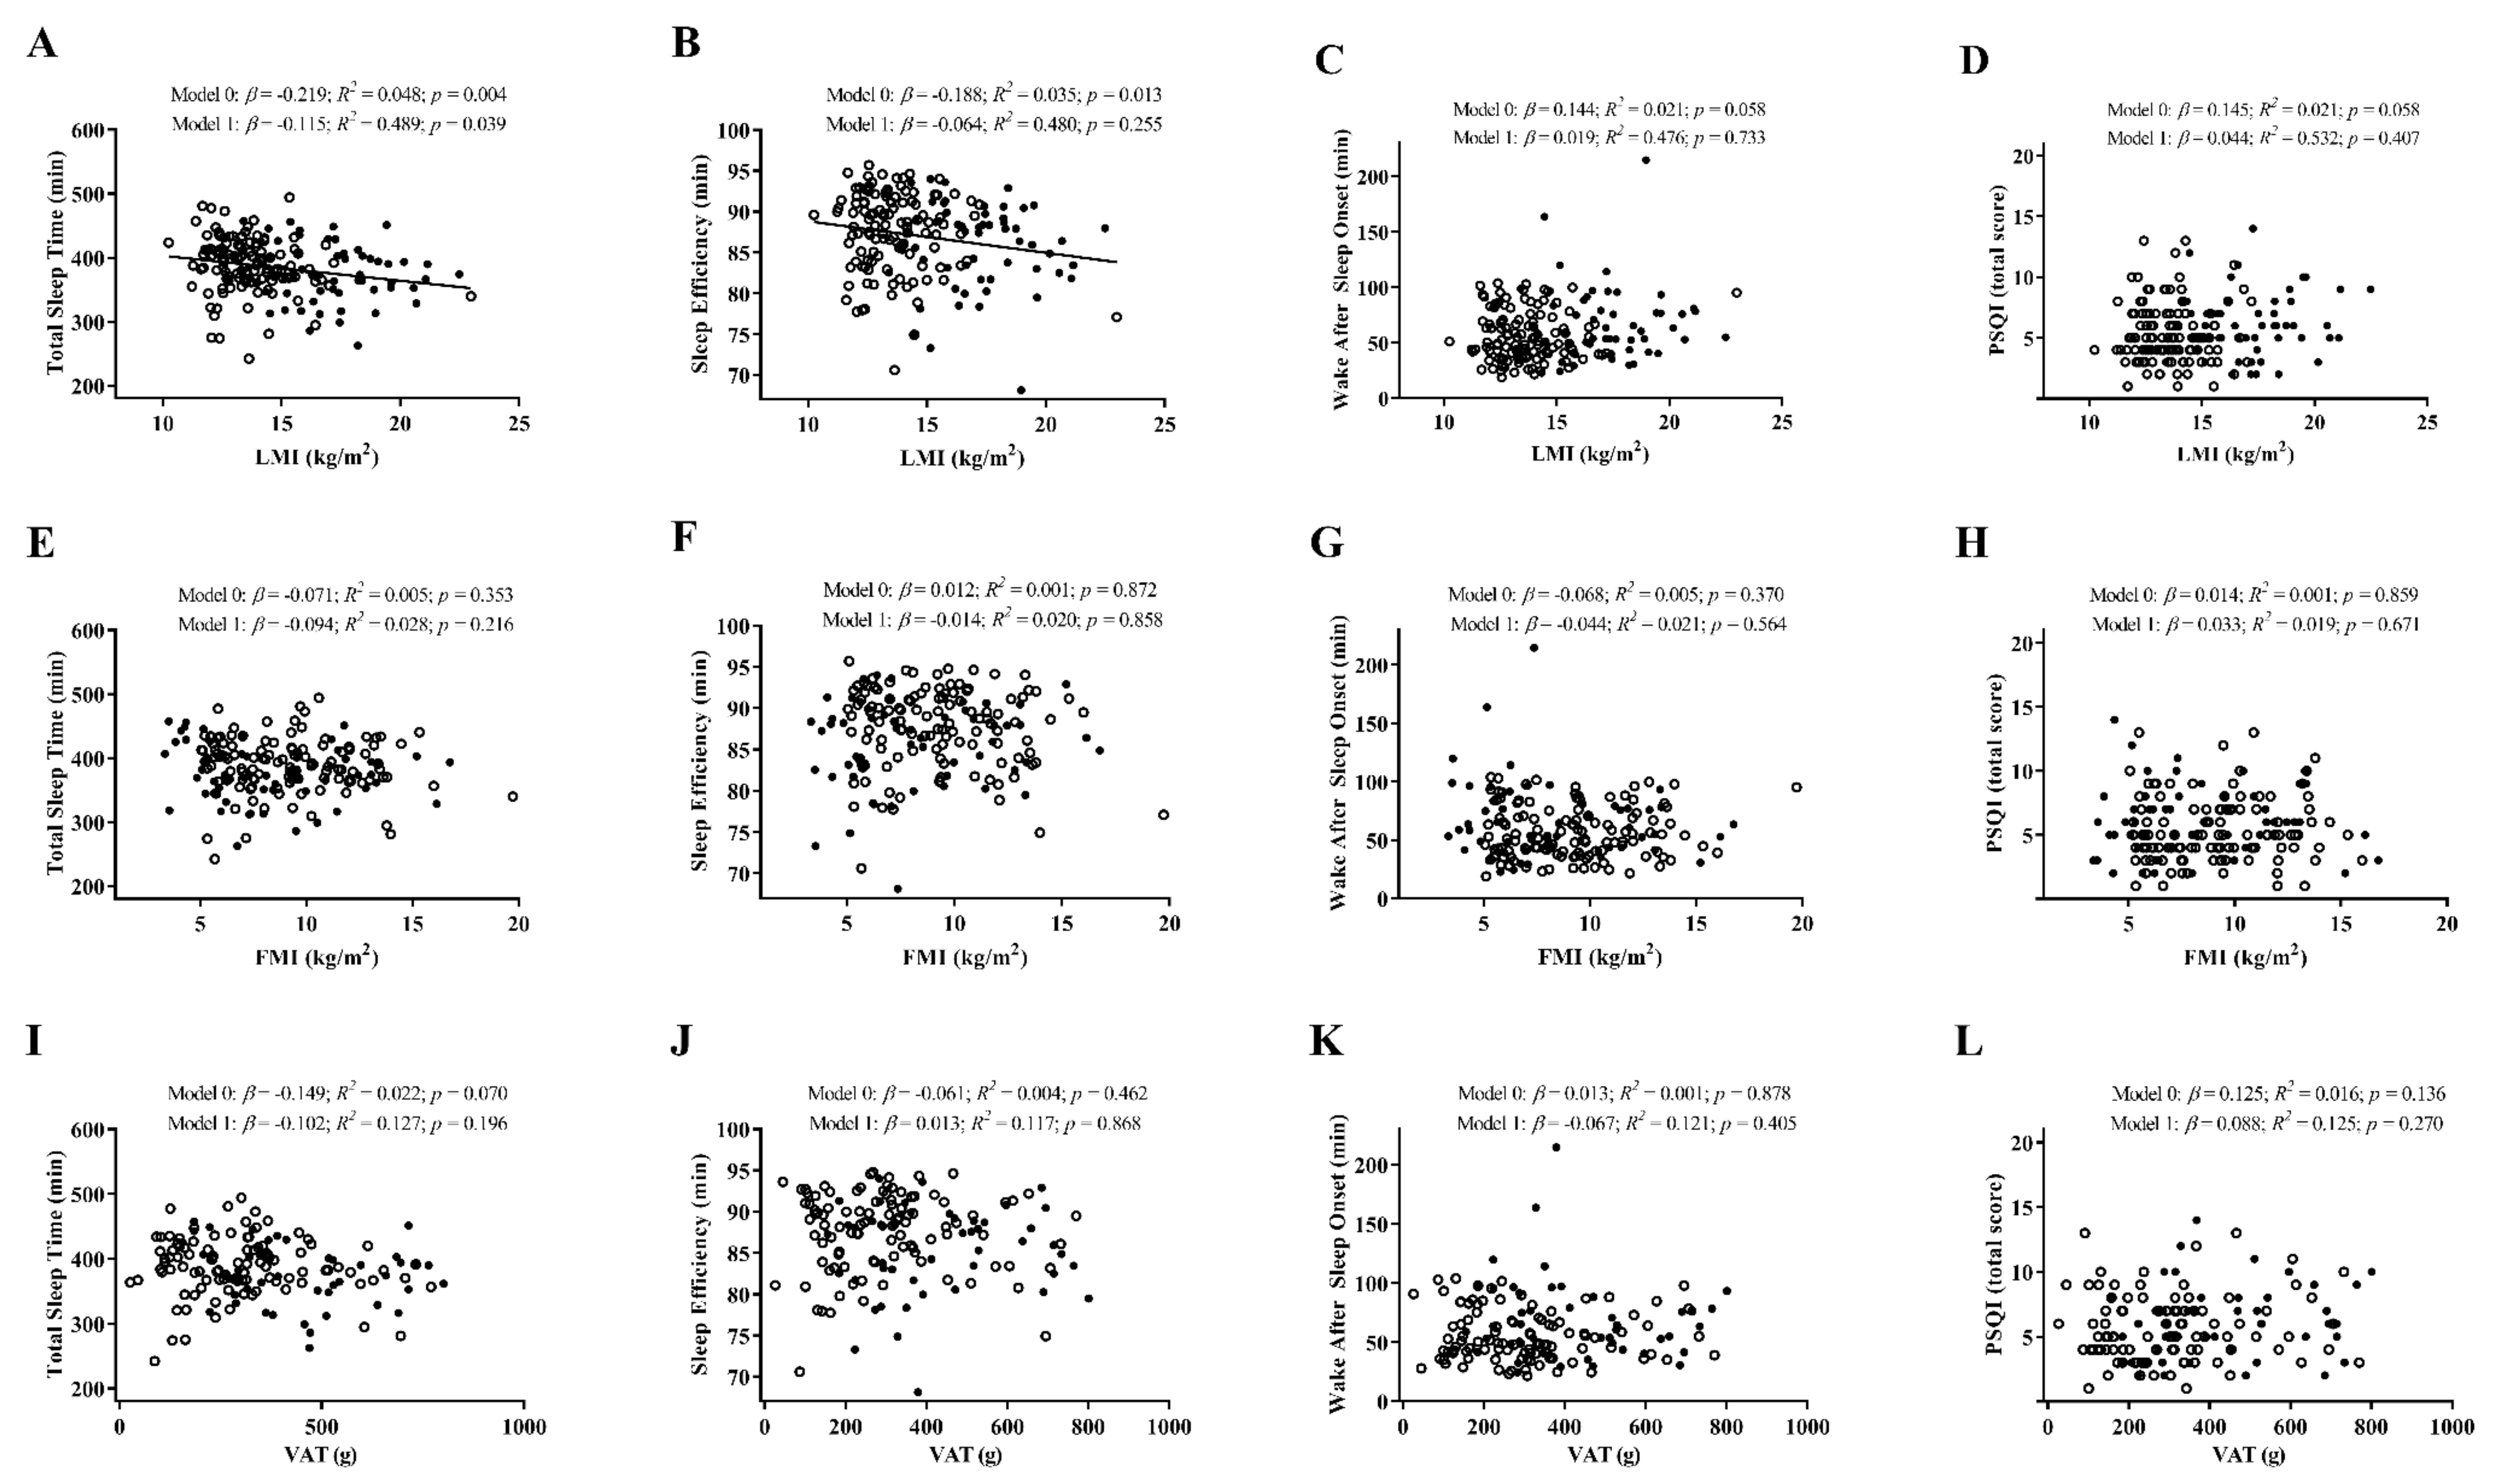
3. Results
4. Discussion
5. Limitations and Future Research
6. Conclusions
Supplementary Materials
Author Contributions
Funding
Acknowledgments
Conflicts of Interest
References
- Jastreboff, A.M.; Kotz, C.M.; Kahan, S.; Kelly, A.S.; Heymsfield, S.B. Obesity as a Disease: The Obesity Society 2018 Position Statement. Obesity 2019, 27, 7–9. [Google Scholar] [CrossRef] [PubMed]
- GBD 2017 Risk Factor Collaborators. Global, regional, and national comparative risk assessment of 84 behavioural, environmental and occupational, and metabolic risks or clusters of risks for 195 countries and territories, 1990–2017: A systematic analysis for the Global Burden of Disease Study 2017. Lancet 2018, 392, 1923–1994. [Google Scholar] [CrossRef]
- Chattu, V.K.; Manzar, M.D.; Kumary, S.; Burman, D.; Spence, D.W.; Pandi-Perumal, S.R. The global problem of insufficient sleep and its serious public health implications. Healthcare 2018, 7, 1. [Google Scholar] [CrossRef] [PubMed]
- Hillman, D.R.; Murphy, A.S.; Pezzullo, L. The economic cost of sleep disorders. Sleep 2006, 29, 299–305. [Google Scholar] [CrossRef] [PubMed]
- Consensus Conference Panel; Watson, N.F.; Badr, M.S.; Belenky, G.; Bliwise, D.L.; Buxton, O.M.; Buysse, D.; Dinges, D.F.; Gangwisch, J.; Grandner, M.A.; et al. Joint consensus statement of the American Academy of Sleep Medicine and Sleep Research Society on the recommended amount of sleep for a healthy adult: Methodology and discussion. J. Clin. Sleep Med. 2015, 11, 931–952. [Google Scholar] [CrossRef] [PubMed]
- American Academy of Sleep Medicine. International Classification of Sleep Disorders, 3rd ed.; American Academy of Sleep Medicine: Darien, IL, USA, 2014. [Google Scholar]
- Ikehara, S.; Iso, H.; Date, C.; Kikuchi, S.; Watanabe, Y.; Wada, Y.; Inaba, Y.; Tamakoshi, A.; JACC Study Group. Association of sleep duration with mortality from cardiovascular disease and other causes for Japanese men and women: The JACC study. Sleep 2009, 32, 295–301. [Google Scholar] [CrossRef]
- Cappuccio, F.P.; D’Elia, L.; Strazzullo, P.; Miller, M.A. Sleep duration and all-cause mortality: A systematic review and meta-analysis of prospective studies. Sleep 2010, 33, 585–592. [Google Scholar] [CrossRef]
- St-Onge, M.P. Sleep-obesity relation: Underlying mechanisms and consequences for treatment. Obes. Rev. 2017, 18, 34–39. [Google Scholar] [CrossRef]
- Spiegel, K.; Tasali, E.; Leproult, R.; Van Cauter, E. Effects of poor and short sleep on glucose metabolism and obesity risk. Nat. Rev. Endocrinol. 2009, 5, 253–261. [Google Scholar] [CrossRef]
- Muscogiuri, G.; Barrea, L.; Annunziata, G.; Di Somma, C.; Laudisio, D.; Colao, A.; Savastano, S. Obesity and sleep disturbance: The chicken or the egg? Crit. Rev. Food Sci. Nutr. 2019, 59, 2158–2165. [Google Scholar] [CrossRef]
- Vgontzas, A.N.; Bixler, E.O.; Basta, M. Obesity and sleep: A bidirectional association? Sleep 2010, 33, 573–574. [Google Scholar] [CrossRef]
- Vioque, J.; Torres, A.; Quiles, J. Time spent watching television, sleep duration and obesity in adults living in Valencia, Spain. Int. J. Obes. 2000, 24, 1683–1688. [Google Scholar] [CrossRef]
- Štefan, L.; Horvatin, M.; Baić, M. Are sedentary behaviors associated with sleep duration? A cross-sectional case from Croatia. Int. J. Environ. Res. Public Health 2019, 16, 200. [Google Scholar] [CrossRef]
- Lakerveld, J.; Mackenbach, J.D.; Horvath, E.; Rutters, F.; Compernolle, S.; Bárdos, H.; De Bourdeaudhuij, I.; Charreire, H.; Rutter, H.; Oppert, J.M.; et al. The relation between sleep duration and sedentary behaviours in European adults. Obes. Rev. 2016, 17, 62–67. [Google Scholar] [CrossRef]
- Buman, M.P.; Kline, C.E.; Youngstedt, S.D.; Phillips, B.; Tulio de Mello, M.; Hirshkowitz, M. Sitting and television viewing: Novel risk factors for sleep disturbance and apnea risk? Results from the 2013 National Sleep Foundation Sleep in America Poll. Chest 2015, 147, 728–734. [Google Scholar] [CrossRef]
- Kredlow, M.A.; Capozzoli, M.C.; Hearon, B.A.; Calkins, A.W.; Otto, M.W. The effects of physical activity on sleep: A meta-analytic review. J. Behav. Med. 2015, 38, 427–449. [Google Scholar] [CrossRef]
- Vanderlinden, J.; Boen, F.; van Uffelen, J.G.Z. Effects of physical activity programs on sleep outcomes in older adults: A systematic review. Int. J. Behav. Nutr. Phys. Act. 2020, 17, 11. [Google Scholar] [CrossRef]
- Christie, A.D.; Seery, E.; Kent, J.A. Physical activity, sleep quality, and self-reported fatigue across the adult lifespan. Exp. Gerontol. 2016, 77, 7–11. [Google Scholar] [CrossRef]
- St-Onge, M.P.; Mikic, A.; Pietrolungo, C.E. Effects of diet on sleep quality. Adv. Nutr. 2016, 7, 938–949. [Google Scholar] [CrossRef]
- St-Onge, M.P.; Roberts, A.; Shechter, A.; Choudhury, A.R. Fiber and saturated fat are associated with sleep arousals and slow wave sleep. J. Clin. Sleep Med. 2016, 12, 19–24. [Google Scholar] [CrossRef]
- Tanaka, E.; Yatsuya, H.; Uemura, M.; Murata, C.; Otsuka, R.; Toyoshima, H.; Tamakoshi, K.; Sasaki, S.; Kawaguchi, L.; Aoyama, A. Associations of protein, fat, and carbohydrate intakes with insomnia symptoms among middle-aged Japanese workers. J. Epidemiol. 2013, 23, 132–138. [Google Scholar] [CrossRef]
- Jurado-Fasoli, L.; Amaro-Gahete, F.J.; De-la-O, A.; Dote-Montero, M.; Gutiérrez, A.; Castillo, M.J. Association between sleep quality and body composition in sedentary middle-aged adults. Medicina 2018, 54, 91. [Google Scholar] [CrossRef]
- Kim, K.; Shin, D.; Jung, G.U.; Lee, D.; Park, S.M. Association between sleep duration, fat mass, lean mass and obesity in Korean adults: The fourth and fifth Korea National Health and Nutrition Examination Surveys. J. Sleep Res. 2017, 26, 453–460. [Google Scholar] [CrossRef]
- Shechter, A.; Airo, M.; Valentin, J.; Dugas, N.C.; Abdalla, M.; St-Onge, M.P.; Louh, I.K. Effects of continuous positive airway pressure on body composition in individuals with obstructive sleep apnea: A non-randomized, matched before-after study. J. Clin. Med. 2019, 8, 1195. [Google Scholar] [CrossRef]
- Stenholm, S.; Harris, T.B.; Rantanen, T.; Visser, M.; Kritchevsky, S.B.; Ferrucci, L. Sarcopenic obesity: Definition, cause and consequences. Curr. Opin. Clin. Nutr. Metab. Care 2008, 11, 693–700. [Google Scholar] [CrossRef]
- Zamboni, M.; Rubele, S.; Rossi, A.P. Sarcopenia and obesity. Curr. Opin. Clin. Nutr. Metab. Care 2019, 22, 13–19. [Google Scholar] [CrossRef]
- Hu, X.; Jiang, J.; Wang, H.; Zhang, L.; Dong, B.; Yang, M. Association between sleep duration and sarcopenia among community-dwelling older adults: A cross-sectional study. Medicine 2017, 96, e6268. [Google Scholar] [CrossRef]
- Prado, C.M.; Purcell, S.A.; Alish, C.; Pereira, S.L.; Deutz, N.E.; Heyland, D.K.; Goodpaster, B.H.; Tappenden, K.A.; Heymsfield, S.B. Implications of low muscle mass across the continuum of care: A narrative review. Ann. Med. 2018, 50, 675–693. [Google Scholar] [CrossRef]
- Sanchez-Delgado, G.; Martinez-Tellez, B.; Olza, J.; Aguilera, C.M.; Labayen, I.; Ortega, F.B.; Chillon, P.; Fernandez-Reguera, C.; Alcantara, J.M.A.; Martinez-Avila, W.D.; et al. Activating brown adipose tissue through exercise (ACTIBATE) in young adults: Rationale, design and methodology. Contemp. Clin. Trials 2015, 45, 416–425. [Google Scholar] [CrossRef]
- Acosta, F.M.; Sanchez-Delgado, G.; Martinez-Tellez, B.; Migueles, J.H.; Amaro-Gahete, F.J.; Rensen, P.C.N.; Llamas-Elvira, J.M.; Blondin, D.P.; Ruiz, J.R. Sleep duration and quality are not associated with brown adipose tissue volume or activity-as determined by 18F-FDG uptake, in young, sedentary adults. Sleep 2019, 42, zsz177. [Google Scholar] [CrossRef]
- Migueles, J.H.; Cadenas-Sanchez, C.; Ekelund, U.; Delisle Nyström, C.; Mora-Gonzalez, J.; Löf, M.; Labayen, I.; Ruiz, J.R.; Ortega, F.B. Accelerometer data collection and processing criteria to assess physical activity and other outcomes: A systematic review and practical considerations. Sport Med. 2017, 47, 1821–1845. [Google Scholar] [CrossRef]
- R Core Team. R: A Language and Environment for Statistical Computing. R Foundation for Statistical Computing, Vienna, Austria. 2018. Available online: https://www.R-project (accessed on 11 December 2019).
- Van Hees, V.; Fang, Z.; Zhao, J.; Heywood, J.; Mirkes, E.; Sabia, S.; Migueles, J. GGIR: Raw Accelerometer Data Analysis. 2019. Available online: https://zenodo.org/record/3779893#.XsZGLWgzaUk (accessed on 11 December 2019). [CrossRef]
- Van Hees, V.T.; Fang, Z.; Langford, J.; Assah, F.; Mohammad, A.; da Silva, I.C.M.; Trenell, M.I.; White, T.; Wareham, N.J.; Brage, S. Autocalibration of accelerometer data for free-living physical activity assessment using local gravity and temperature: An evaluation on four continents. J. Appl. Physiol. 2014, 117, 738–744. [Google Scholar] [CrossRef]
- Van Hees, V.T.; Sabia, S.; Anderson, K.N.; Denton, S.J.; Oliver, J.; Catt, M.; Abell, J.G.; Kivimäki, M.; Trenell, M.I.; Singh-Manoux, A. A novel, open access method to assess sleep duration using a wrist-worn accelerometer. PLoS ONE 2015, 10, e0142533. [Google Scholar] [CrossRef]
- Shrivastava, D.; Jung, S.; Saadat, M.; Sirohi, R.; Crewson, K. How to interpret the results of a sleep study. J. Community Hosp. Intern. Med. Perspect. 2014, 4, 24983. [Google Scholar] [CrossRef]
- Buysse, D.J.; Reynolds, C.F.; Monk, T.H.; Berman, S.R.; Kupfer, D.J. The Pittsburgh sleep quality index: A new instrument for psychiatric practice and research. Psychiatry Res. 1989, 28, 193–213. [Google Scholar] [CrossRef]
- Royuela, A.; Macías, J.A. Propiedades clinimétricas de la versión castellana del Cuestionario de Pittsburgh. Vigilia Sueño 1997, 9, 81–94. [Google Scholar]
- Amaro-Gahete, F.J.; De-la-O, A.; Jurado-Fasoli, L.; Ruiz, J.R.; Castillo, M.J.; Gutiérrez, Á. Effects of different exercise training programs on body composition: A randomized control trial. Scand. J. Med. Sci. Sports 2019, 29, 968–979. [Google Scholar] [CrossRef]
- Amaro-Gahete, F.J.; Jurado-Fasoli, L.; Gutiérrez, Á.; Ruiz, J.R.; Castillo, M.J. Association of physical activity and fitness with S-Klotho plasma levels in middle-aged sedentary adults: The FIT-AGEING study. Maturitas 2019, 123, 25–31. [Google Scholar] [CrossRef]
- Acosta, F.M.; Martinez-Tellez, B.; Sanchez-Delgado, G.; Migueles, J.H.; Contreras-Gomez, M.A.; Martinez-Avila, W.D.; Merchan-Ramirez, E.; Alcantara, J.M.A.; Amaro-Gahete, F.J.; Llamas-Elvira, J.M.; et al. Association of objectively measured physical activity with brown adipose tissue volume and activity in young adults. J. Clin. Endocrinol. Metab. 2019, 104, 223–233. [Google Scholar] [CrossRef]
- Hildebrand, M.; Hansen, B.H.; van Hees, V.T.; Ekelund, U. Evaluation of raw acceleration sedentary thresholds in children and adults. Scand. J. Med. Sci. Sport 2017, 27, 1814–1823. [Google Scholar] [CrossRef]
- Hildebrand, M.; van Hees, V.T.; Hansen, B.H.; Ekelund, U. Age group comparability of raw accelerometer output from wrist-and hip-worn monitors. Med. Sci. Sports Exerc. 2014, 46, 1816–1824. [Google Scholar] [CrossRef]
- Halliday, T.M.; Davy, B.M.; Clark, A.G.; Baugh, M.E.; Hedrick, V.E.; Marinik, E.L.; Flack, K.D.; Savla, J.; Winett, S.; Winett, R.A. Dietary intake modification in response to a participation in a resistance training program for sedentary older adults with prediabetes: Findings from the Resist Diabetes study. Eat. Behav. 2014, 15, 379–382. [Google Scholar] [CrossRef]
- Baron, R.M.; Kenny, D.A. The moderator-mediator variable distinction in social psychological research: Conceptual, strategic and statistical considerations. J. Pers. Soc. Psychol. 1986, 51, 1173–1182. [Google Scholar] [CrossRef]
- Hayes, A.F. Introduction to Mediation, Moderation, and Conditional Process Analysis: A Regression-Based Approach, 2nd ed.; Guildford Press: New York, NY, USA, 2018. [Google Scholar]
- Preacher, K.J.; Hayes, A.F. SPSS and SAS procedures for estimating indirect effects in simple mediation models. Behav. Res. Methods Instrum. Comput. 2004, 36, 717–731. [Google Scholar] [CrossRef]
- Preacher, K.J.; Hayes, A.F. Asymptotic and resampling strategies for assessing and comparing indirect effects in multiple mediator models. Behav. Res. Methods 2008, 40, 879–891. [Google Scholar] [CrossRef]
- Carneiro-Barrera, A.; Díaz-Román, A.; Guillén-Riquelme, A.; Buela-Casal, G. Weight loss and lifestyle interventions for obstructive sleep apnoea in adults: Systematic review and meta-analysis. Obes. Rev. 2019, 20, 750–762. [Google Scholar] [CrossRef]
- Carneiro-Barrera, A.; Amaro-Gahete, F.J.; Díaz-Román, A.; Guillén-Riquelme, A.; Jurado-Fasoli, L.; Sáez-Roca, G.; Martín-Carrasco, C.; Ruiz, J.R.; Buela-Casal, G. Interdisciplinary weight loss and lifestyle intervention for obstructive sleep apnoea in adults: Rationale, design and methodology of the INTERAPNEA study. Nutrients 2019, 11, 2227. [Google Scholar] [CrossRef]
- Ong, C.W.; O’Driscoll, D.M.; Truby, H.; Naughton, M.T.; Hamilton, G.S. The reciprocal interaction between obesity and obstructive sleep apnoea. Sleep Med. Rev. 2013, 17, 123–131. [Google Scholar] [CrossRef]
- Dennis, L.E.; Spaeth, A.M.; Goel, N. Phenotypic stability of energy balance responses to experimental total sleep deprivation and sleep restriction in healthy adults. Nutrients 2016, 8, 823. [Google Scholar] [CrossRef]
- Mitchell, J.A.; Godbole, S.; Moran, K.; Murray, K.; James, P.; Laden, F.; Hipp, J.A.; Kerr, J.; Glanz, K. No evidence of reciprocal associations between daily sleep and physical activity. Med. Sci. Sports Exerc. 2016, 48, 1950–1956. [Google Scholar] [CrossRef]
- Bidulescu, A.; Din-Dzietham, R.; Coverson, D.L.; Chen, Z.; Meng, Y.X.; Buxbaum, S.G.; Gibbons, G.H.; Welch, V.L. Interaction of sleep quality and psychosocial stress on obesity in African Americans: The Cardiovascular Health Epidemiology Study (CHES). BMC Public Health 2010, 10, 581. [Google Scholar] [CrossRef]
- Tom, S.E.; Berenson, A.B. Associations between poor sleep quality and psychosocial stress with obesity in reproductive-age women of lower socioeconomic status. Womens Health Issues 2013, 23, e295–e300. [Google Scholar] [CrossRef]
- Gavilán-Carrera, B.; Acosta-Manzano, P.; Soriano-Maldonado, A.; Borges-Cosic, M.; Aparicio, V.A.; Delgado-Fernández, M.; Segura-Jiménez, V. Sedentary time, physical activity, and sleep duration: Associations with body composition in fibromyalgia. The Al-Andalus Project. J. Clin. Med. 2019, 8, 1260. [Google Scholar] [CrossRef]
- Hague, J.F.; Gilbert, S.S.; Burgess, H.J.; Ferguson, S.A.; Dawson, D. A sedentary day: Effects on subsequent sleep and body temperatures in trained athletes. Physiol. Behav. 2003, 78, 261–267. [Google Scholar] [CrossRef]
- Beaton, G.H.; Milner, J.; Corey, P.; McGuire, V.; Cousins, M.; Stewart, E.; de Ramos, M.; Hewitt, D.; Grambsch, P.V.; Kassim, N.; et al. Sources of variance in 24-hour dietary recall data: Implications for nutrition study design and interpretation. Am. J. Clin. Nutr. 1979, 32, 2546–2559. [Google Scholar] [CrossRef]
- Sanchez-Delgado, G.; Acosta, F.M.; Martinez-Tellez, B.; Finlayson, G.; Gibbons, C.; Labayen, I.; Llamas-Elvira, J.M.; Gil, A.; Blundell, J.E.; Ruiz, J.R. Brown adipose tissue volume and 18F-fluorodeoxyglucose uptake are not associated with energy intake in young human adults. Am. J. Clin. Nutr. 2020, 111, 329–339. [Google Scholar] [CrossRef]
- Seidell, J.C. Waist circumference and waist/hip ratio in relation to all-cause mortality, cancer and sleep apnea. Eur. J. Clin. Nutr. 2010, 64, 35–41. [Google Scholar] [CrossRef]
- Borel, A.L.; Coumes, S.; Reche, F.; Ruckly, S.; Pépin, J.L.; Tamisier, R.; Wion, N.; Arvieux, C. Waist, neck circumferences, waist-to-hip ratio: Which is the best cardiometabolic risk marker in women with severe obesity? The SOON cohort. PLoS ONE 2018, 13, e0206617. [Google Scholar] [CrossRef]
- Hairston, K.G.; Bryer-Ash, M.; Norris, J.M.; Haffner, S.; Bowden, D.W.; Wagenknecht, L.E. Sleep duration and five-year abdominal fat accumulation in a minority cohort: The IRAS family study. Sleep 2010, 33, 289–295. [Google Scholar] [CrossRef]
- Baillet, M.; Cosin, C.; Schweitzer, P.; Pérès, K.; Catheline, G.; Swendsen, J.; Mayo, W. mood influences the concordance of subjective and objective measures of sleep duration in older adults. Front. Aging Neurosci. 2016, 8, 181. [Google Scholar] [CrossRef]
- Dewald, J.F.; Meijer, A.M.; Oort, F.J.; Kerkhof, G.A.; Bögels, S.M. The influence of sleep quality, sleep duration and sleepiness on school performance in children and adolescents: A meta-analytic review. Sleep Med. Rev. 2010, 14, 179–189. [Google Scholar] [CrossRef] [PubMed]
- Buysse, D.J.; Hall, M.L.; Strollo, P.J.; Kamarck, T.W.; Owens, J.; Lee, L.; Reis, S.E.; Matthews, K.A. Relationships between the Pittsburgh Sleep Quality Index (PSQI), Epworth Sleepiness Scale (ESS), and clinical/polysomnographic measures in a community sample. J. Clin. Sleep Med. 2008, 4, 563–571. [Google Scholar] [CrossRef] [PubMed]
- Becker, N.B.; de Jesus, S.N.; Viseu, J.N.; Stobäus, C.D.; Guerreiro, M.; Domingues, R.B. Depression and quality of life in older adults: Mediation effect of sleep quality. Int. J. Clin. Health Psychol. 2018, 18, 8–17. [Google Scholar] [CrossRef]
- Biswas, A.; Oh, P.I.; Faulkner, G.E.; Bajaj, R.R.; Silver, M.A.; Mitchell, M.S.; Alter, D.A. Sedentary time and its association with risk for disease incidence, mortality, and hospitalization in adults: A systematic review and meta-analysis. Ann. Intern. Med. 2015, 162, 123–132. [Google Scholar] [CrossRef]
- Romain, A.J.; Marleau, J.; Baillot, A. Impact of obesity and mood disorders on physical comorbidities, psychological well-being, health behaviours and use of health services. J. Affect. Disord. 2018, 225, 381–388. [Google Scholar] [CrossRef]
- Carneiro-Barrera, A.; Amaro-Gahete, F.J.; Sáez-Roca, G.; Martín-Carrasco, C.; Ruiz, J.R.; Buela-Casal, G. Anxiety and depression in patients with obstructive sleep apnoea before and after continuous positive airway pressure: The ADIPOSA study. J. Clin. Med. 2019, 8, E2099. [Google Scholar] [CrossRef]


| n | All | n | Men | n | Women | |||||||
|---|---|---|---|---|---|---|---|---|---|---|---|---|
| Age (years) | 187 | 22.07 | ± | 2.19 | 66 | 22.25 | ± | 2.24 | 121 | 21.97 | ± | 2.17 |
| Sleep quality | ||||||||||||
| Total sleep time (min) | 187 | 385.63 | ± | 44.02 | 66 | 378.38 | ± | 44.70 | 121 | 389.58 | ± | 43.32 |
| Sleep efficiency (%) | 187 | 86.99 | ± | 5.01 | 66 | 85.86 | ± | 5.17 | 121 | 87.61 | ± | 4.83 * |
| Wake after sleep onset (min) | 187 | 59.68 | ± | 26.29 | 66 | 65.53 | ± | 31.81 | 121 | 56.49 | ± | 22.24 * |
| PSQI total score | 179 | 5.63 | ± | 2.60 | 61 | 6.02 | ± | 2.66 | 118 | 5.42 | ± | 2.55 |
| Anthropometry and body composition | ||||||||||||
| Body mass index (kg/m2) | 178 | 24.97 | ± | 4.80 | 58 | 26.84 | ± | 5.26 | 120 | 24.06 | ± | 4.29 * |
| Waist–hip ratio | 147 | 0.80 | ± | 0.10 | 48 | 0.87 | ± | 0.09 | 87 | 0.76 | ± | 0.08 * |
| Waist–height ratio | 170 | 0.48 | 0.08 | 55 | 0.51 | 0.08 | 115 | 0.47 | 0.07 * | |||
| Lean mass (kg) | 178 | 41.93 | ± | 9.81 | 58 | 53.11 | ± | 7.37 | 120 | 36.53 | ± | 5.19 * |
| Lean mass index (kg/m2) | 178 | 14.74 | ± | 2.44 | 58 | 17.14 | ± | 2.09 | 120 | 13.58 | ± | 1.62 * |
| Fat mass (kg) | 178 | 24.83 | ± | 8.89 | 58 | 25.37 | ± | 10.78 | 120 | 24.57 | ± | 7.85 |
| Fat mass (%) | 178 | 35.50 | ± | 7.37 | 58 | 30.13 | ± | 7.30 | 120 | 38.09 | ± | 5.87 * |
| Fat mass index (kg/m2) | 178 | 8.83 | ± | 3.08 | 58 | 8.19 | ± | 3.43 | 120 | 9.14 | ± | 2.86 |
| Visceral adipose tissue mass (g) | 150 | 340.95 | ± | 179.43 | 49 | 427.10 | ± | 179.18 | 101 | 299.15 | ± | 164.80 * |
| Sedentariness and physical activity levels | ||||||||||||
| Sedentary time (min) | 187 | 926.9 | ± | 55.1 | 66 | 935.1 | ± | 59.9 | 121 | 922.4 | ± | 51.9 |
| Light physical activity (min) | 187 | 24.5 | ± | 12.7 | 66 | 24.7 | ± | 12.6 | 121 | 24.4 | ± | 12.7 |
| Moderate physical activity (min) | 187 | 59.8 | ± | 24.7 | 66 | 56.5 | ± | 23.2 | 121 | 61.6 | ± | 25.4 |
| Vigorous physical activity (min) | 187 | 1.8 | ± | 3.3 | 66 | 1.6 | ± | 2.1 | 121 | 1.9 | ± | 3.8 |
| Moderate–vigorous physical activity (min) | 187 | 61.7 | ± | 26.5 | 66 | 58.2 | ± | 23.8 | 121 | 63.6 | ± | 27.8 |
| Dietary intake | ||||||||||||
| Energy intake (kcal) | 170 | 1867.0 | ± | 532.7 | 59 | 2104.3 | ± | 519.1 | 111 | 1741.0 | ± | 497.7 * |
| Fat intake (g) | 170 | 83.4 | ± | 29.2 | 59 | 94.1 | ± | 29.2 | 111 | 77.7 | ± | 27.7 * |
| Protein intake (g) | 170 | 75.6 | ± | 24.0 | 59 | 91.1 | ± | 26.1 | 111 | 67.3 | ± | 18.2 * |
| Carbohydrates intake (g) | 170 | 197.9 | ± | 66.8 | 59 | 214.1 | ± | 71.0 | 111 | 189.3 | ± | 63.1 * |
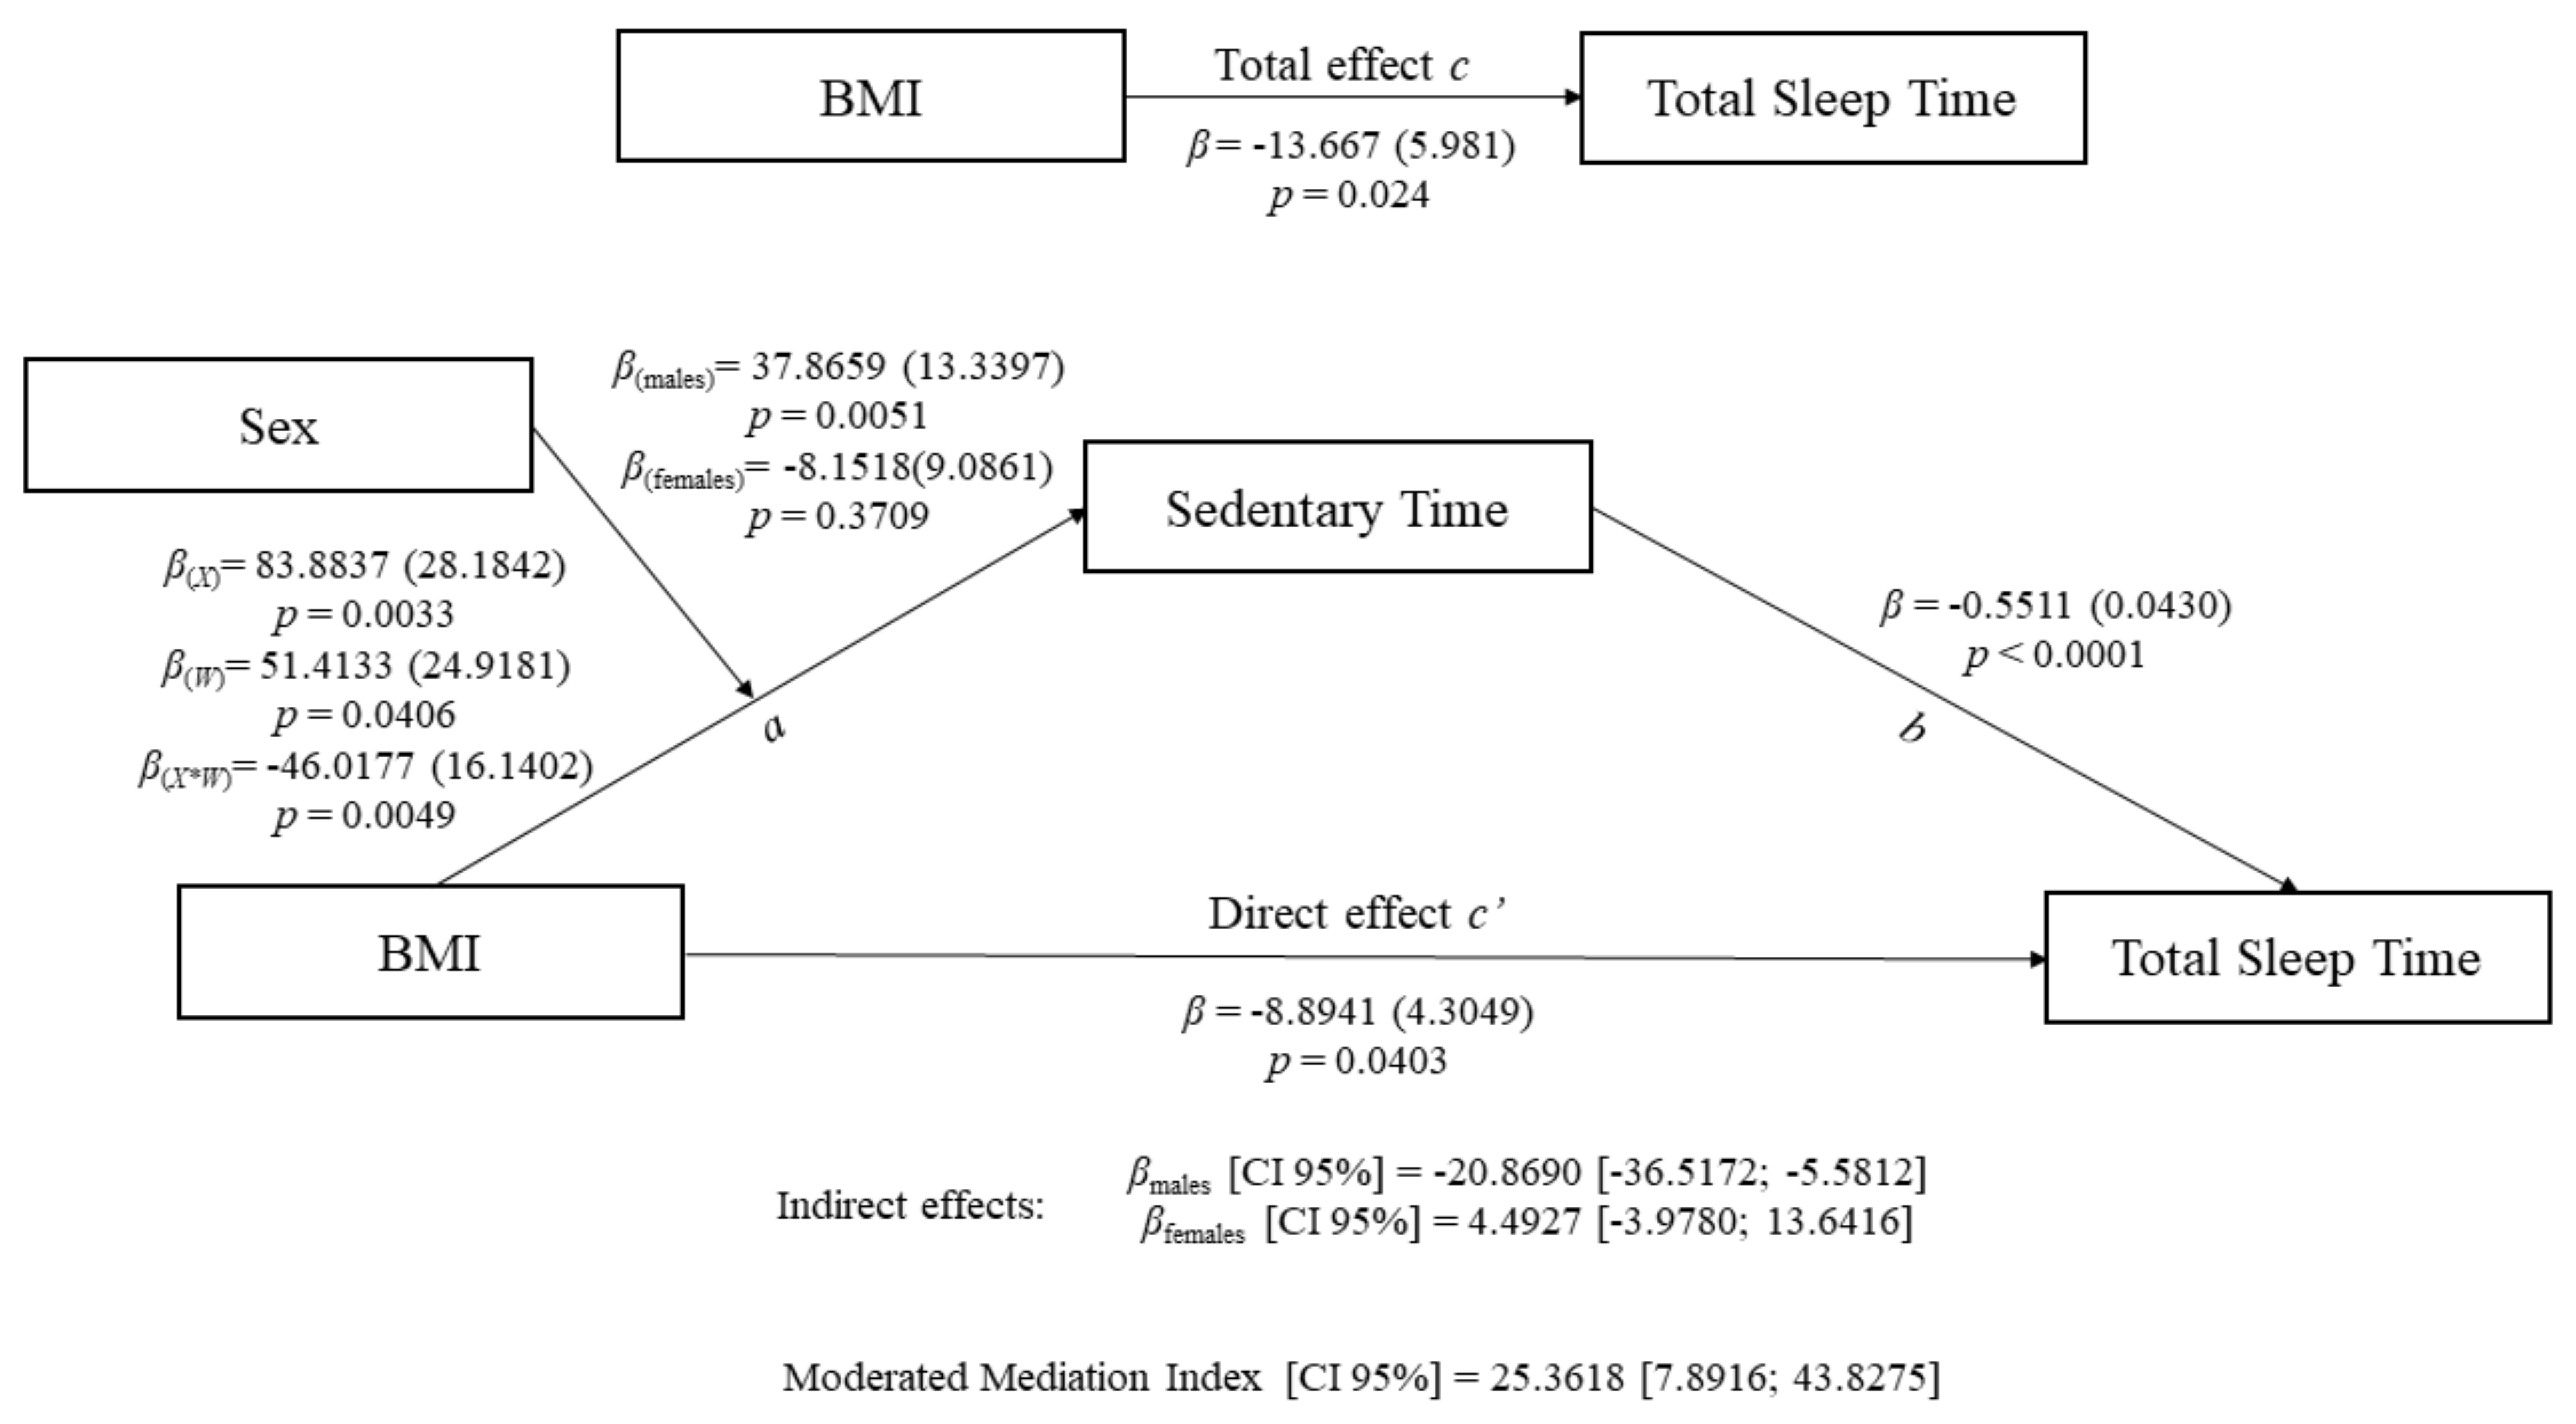
| Sedentariness (M) | Total Sleep Time (Y) | |||||
|---|---|---|---|---|---|---|
| Coefficient (SE) | 95% CI | Coefficient (SE) | 95% CI | |||
| Body mass index (X) | a1 | 83.8837 ** (28.1842) | 28.2498, 139.5175 | c’ | −8.8941 * (4.3049) | −17.3914, −0.3969 |
| Sex (V) | a2 | 51.4133 * (24.9181) | 2.2266, 100.6000 | |||
| X*W | a3 | −46.0177 ** (16.1402) | −77.8774, −14.1581 | |||
| Sedentariness (M) | b | −0.5511 *** (0.0430) | −0.6360, −0.4663 | |||
| Moderated Mediation Index | 25.3618 (0.0013) | 7.8916, 43.8275 | ||||
© 2020 by the authors. Licensee MDPI, Basel, Switzerland. This article is an open access article distributed under the terms and conditions of the Creative Commons Attribution (CC BY) license (http://creativecommons.org/licenses/by/4.0/).
Share and Cite
Carneiro-Barrera, A.; Amaro-Gahete, F.J.; Acosta, F.M.; Ruiz, J.R. Body Composition Impact on Sleep in Young Adults: The Mediating Role of Sedentariness, Physical Activity, and Diet. J. Clin. Med. 2020, 9, 1560. https://doi.org/10.3390/jcm9051560
Carneiro-Barrera A, Amaro-Gahete FJ, Acosta FM, Ruiz JR. Body Composition Impact on Sleep in Young Adults: The Mediating Role of Sedentariness, Physical Activity, and Diet. Journal of Clinical Medicine. 2020; 9(5):1560. https://doi.org/10.3390/jcm9051560
Chicago/Turabian StyleCarneiro-Barrera, Almudena, Francisco J. Amaro-Gahete, Francisco M. Acosta, and Jonatan R. Ruiz. 2020. "Body Composition Impact on Sleep in Young Adults: The Mediating Role of Sedentariness, Physical Activity, and Diet" Journal of Clinical Medicine 9, no. 5: 1560. https://doi.org/10.3390/jcm9051560
APA StyleCarneiro-Barrera, A., Amaro-Gahete, F. J., Acosta, F. M., & Ruiz, J. R. (2020). Body Composition Impact on Sleep in Young Adults: The Mediating Role of Sedentariness, Physical Activity, and Diet. Journal of Clinical Medicine, 9(5), 1560. https://doi.org/10.3390/jcm9051560