Calciprotein Particles and Serum Calcification Propensity: Hallmarks of Vascular Calcifications in Patients with Chronic Kidney Disease


Abstract
1. Introduction
2. Methodology
2.1. Search Strategy
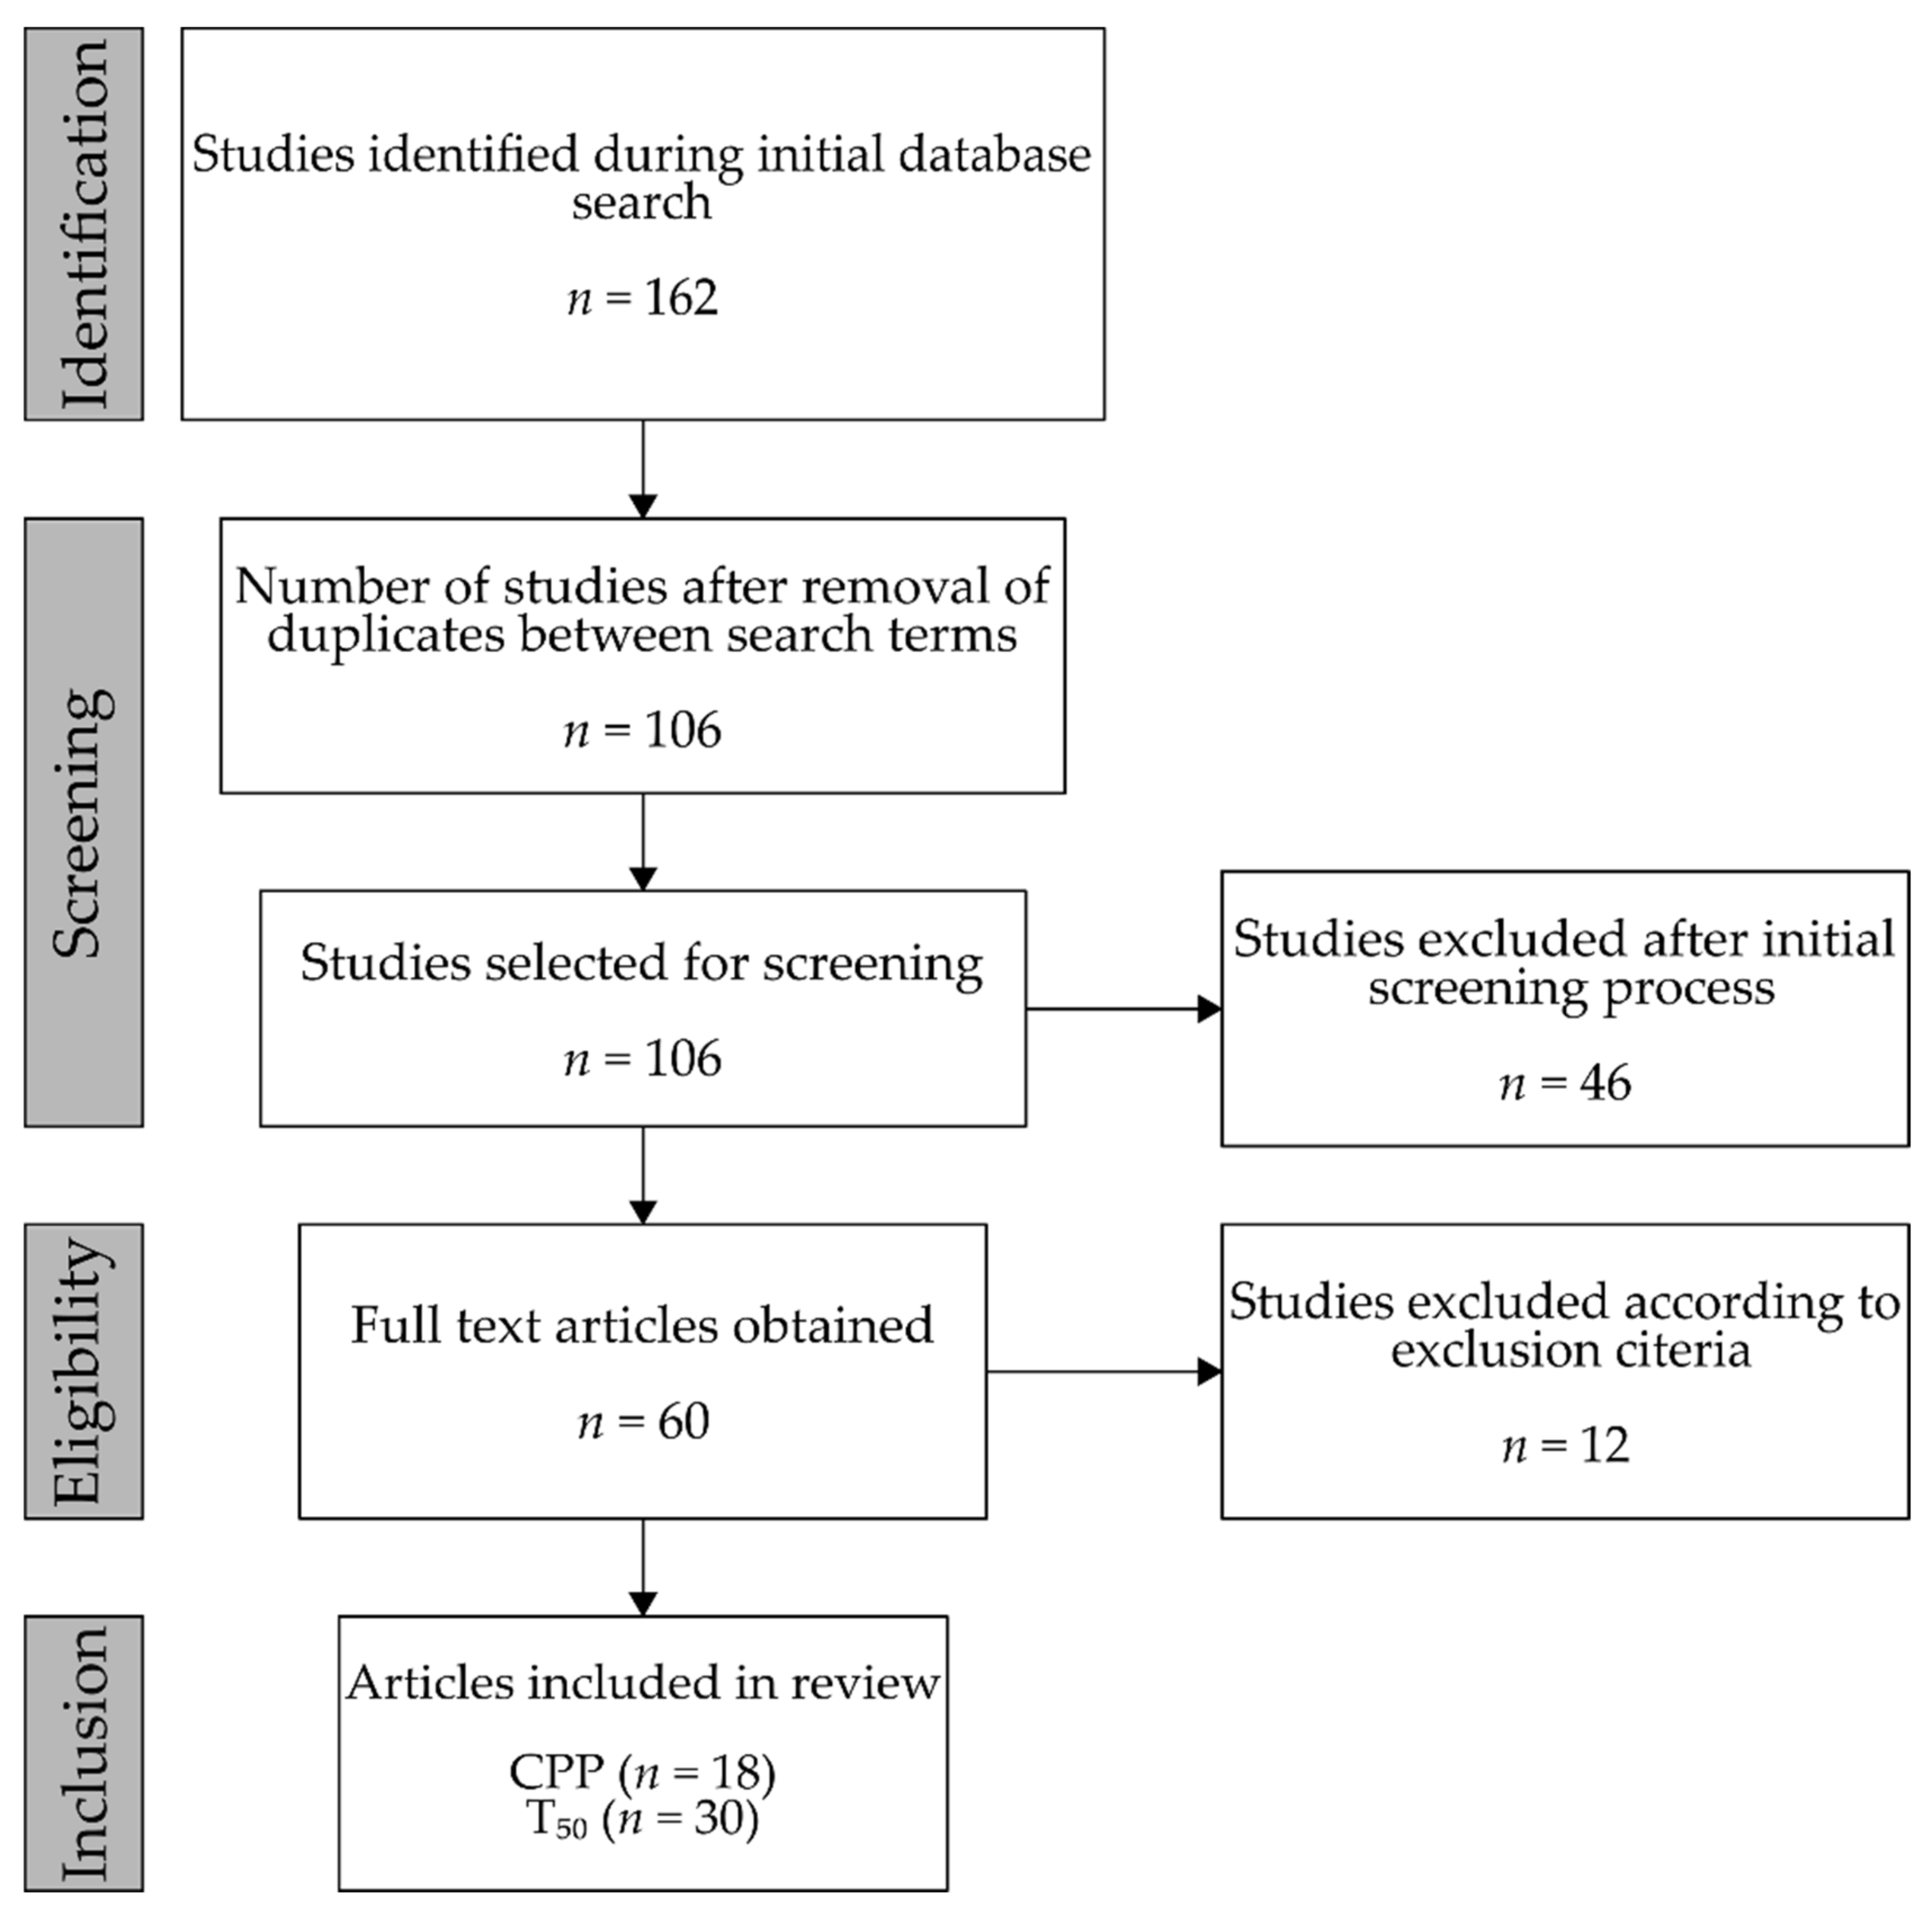
2.2. Selection, Screening, and Inclusion
3. Molecular Background
3.1. Fetuin-A and Calciprotein Particles
3.2. Calcifying Properties of Serum
4. Results
4.1. Calciprotein Particles
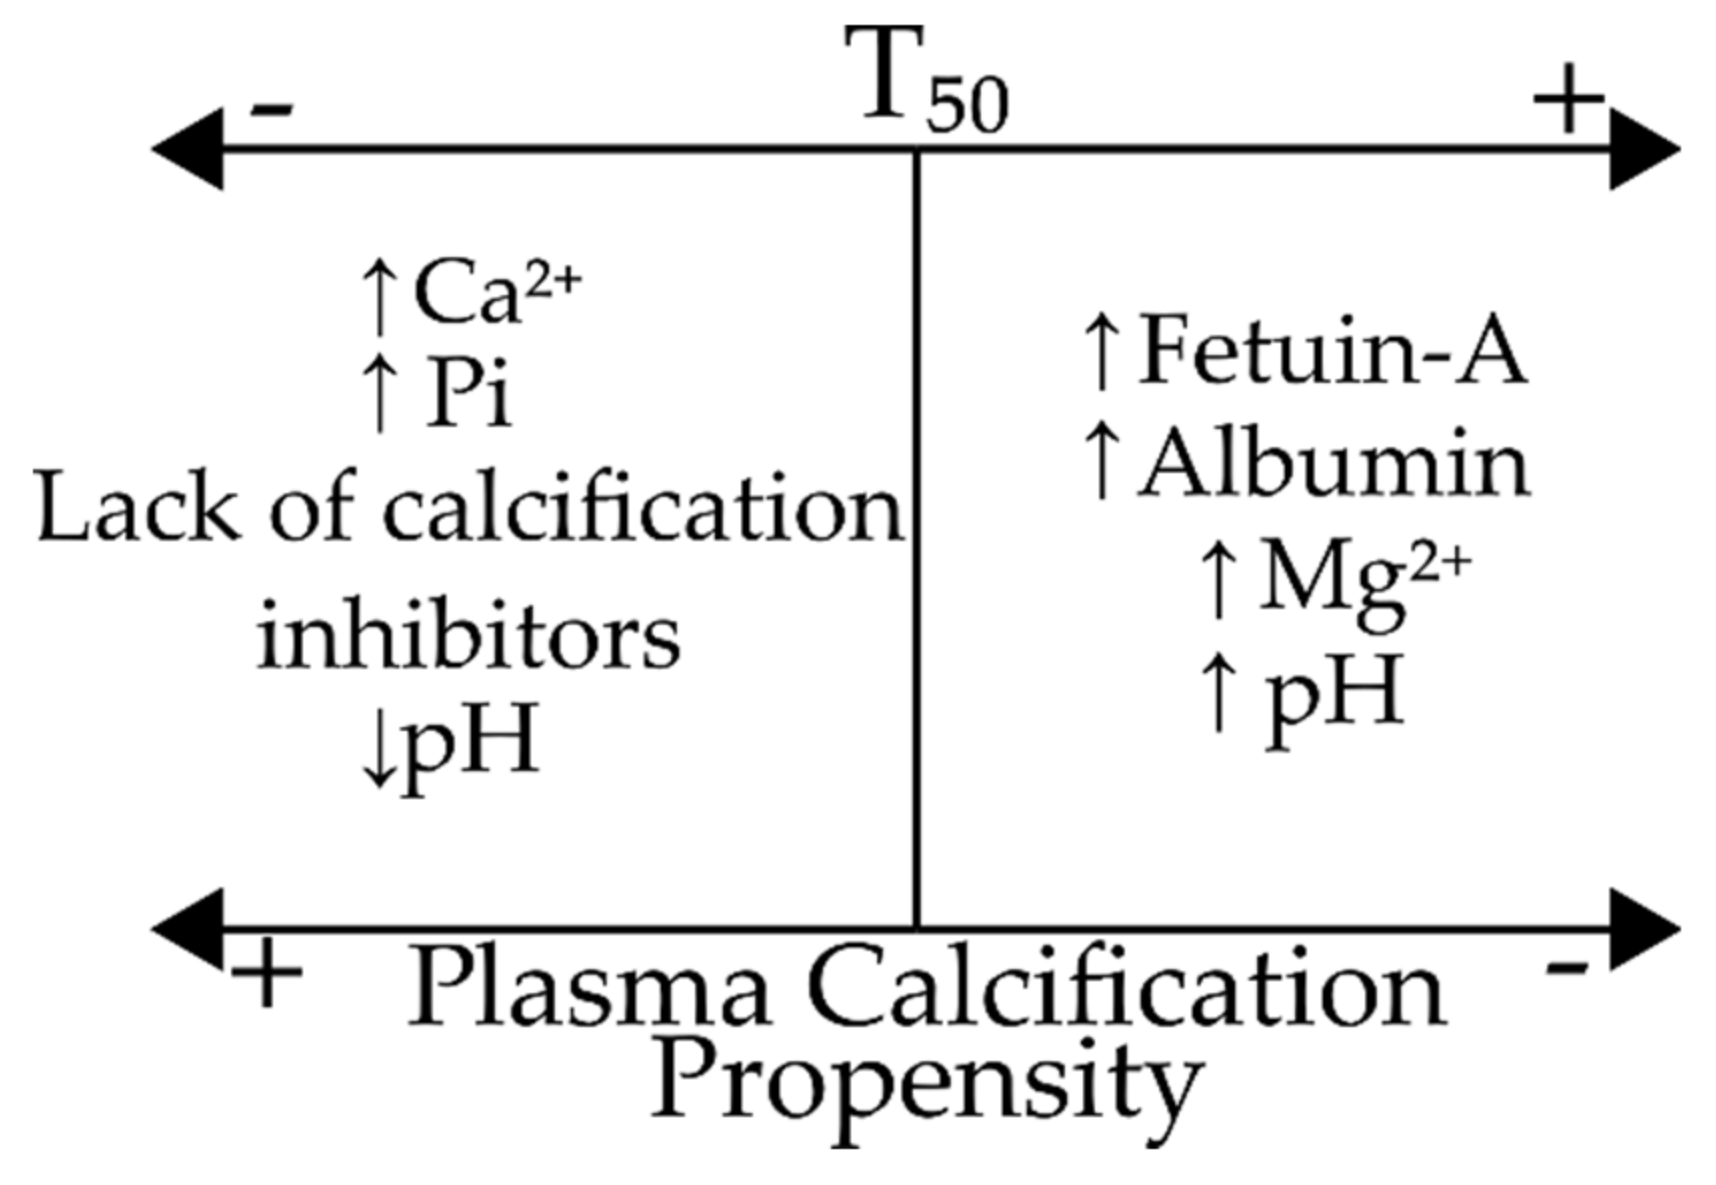
4.2. Calcification Propensity
5. Discussion
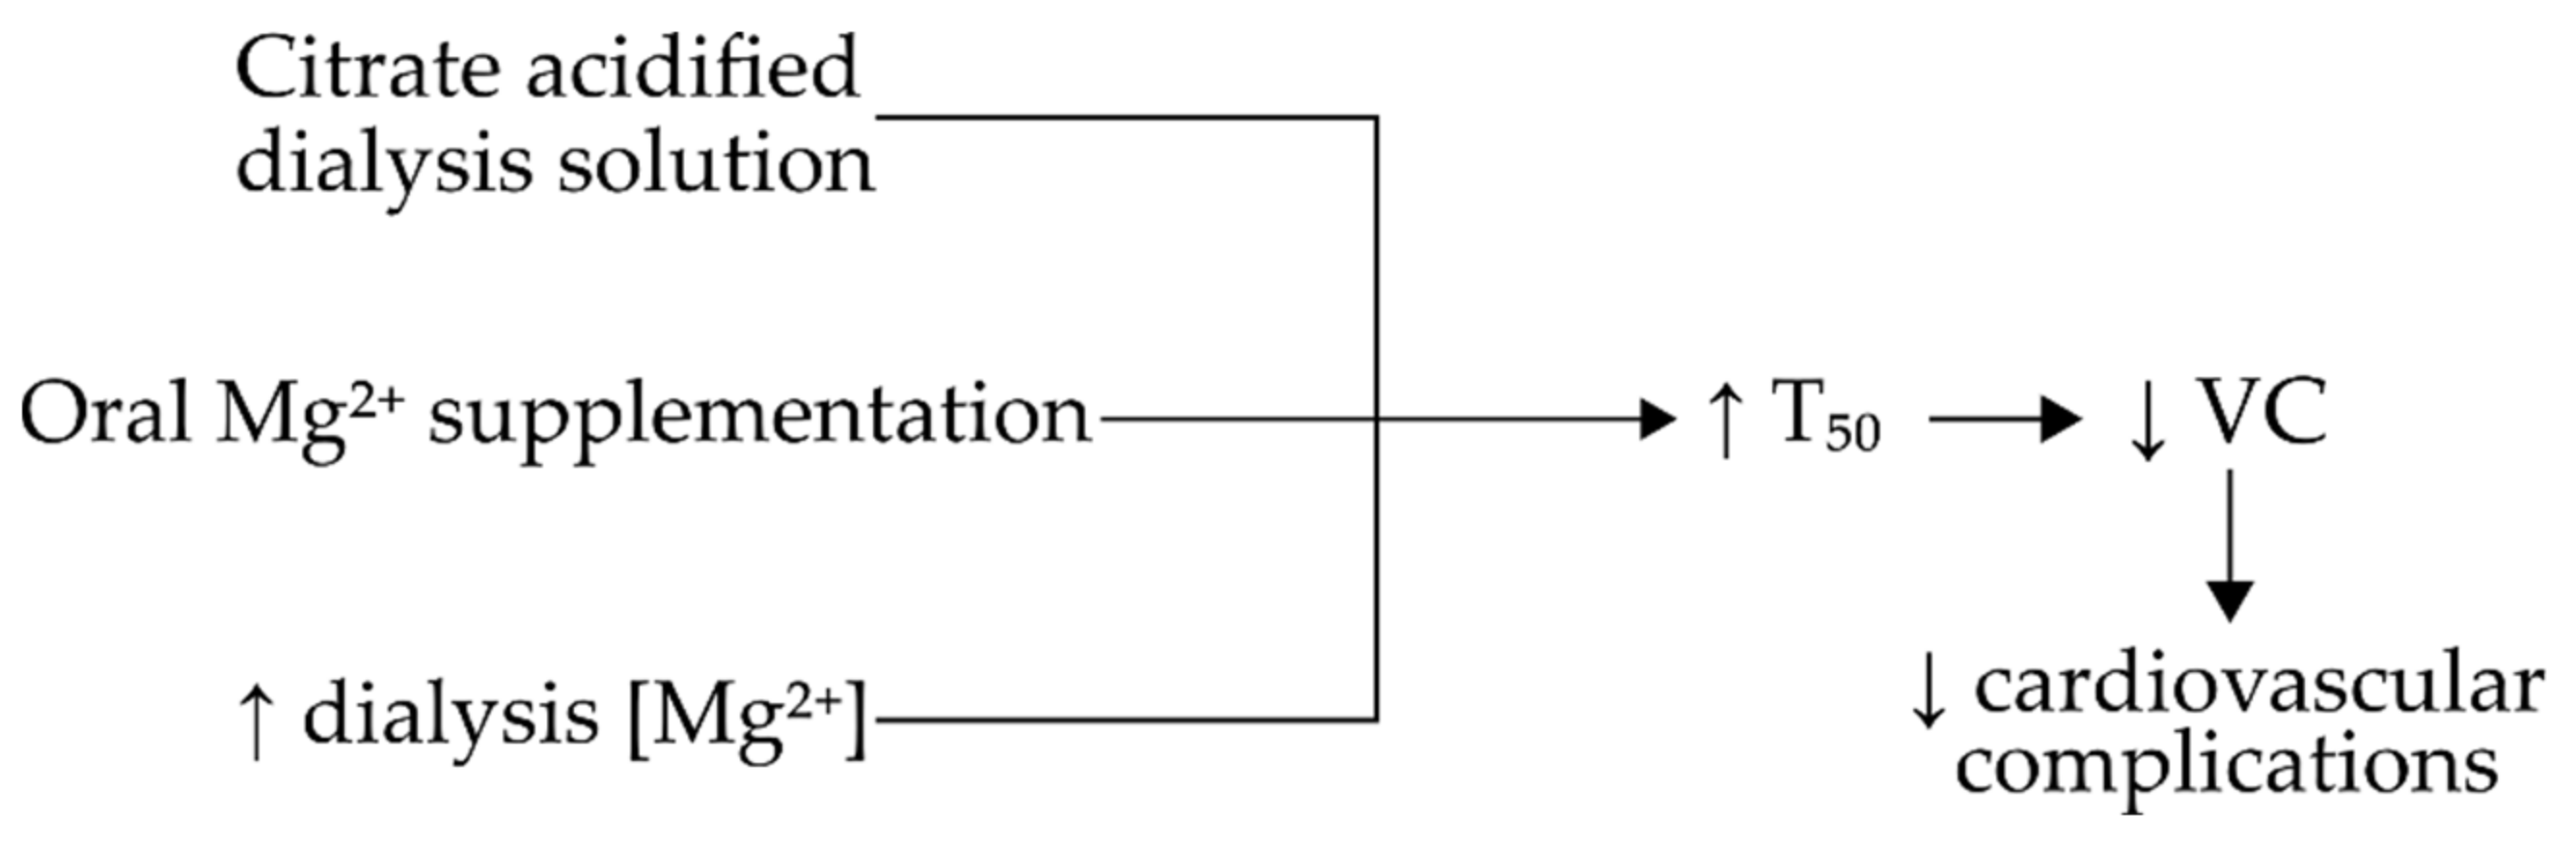
5.1. The Effect of Dialysis Solution Composition upon Serum Calcification Propensity in CKD Patients
5.2. The T50 Test Could Be Used as a Factor in the Staging and/or Prognosis of CKD
6. Conclusions
Abbreviations:
| BMD | Bone Mineral Density |
| Ca2+ | Calcium |
| CAC | Coronary Artery Calcification |
| CKD | Chronic Kidney Disease |
| CPP I | Primary Calciprotein Particles |
| CPP II | Secondary Calciprotein Particles |
| CPP | Calciprotein Particles |
| CVD | Cardiovascular Disease |
| CVE | Cardiovascular Event |
| eGFR | Estimated Glomerular Filtration Rate |
| ELISA | Enzyme-Linked Immunosorbent Assay |
| GRP | Gla-Rich Protein |
| HD | Haemodialysis |
| H2S | Hydrogen Sulphide |
| IL-1β | Interleukin 1β |
| Mg2+ | Magnesium |
| N/A | Not Applicable |
| Pi | Phosphate |
| SLE | Systemic Lupus Erythematosus |
| tCPP | Total Calciprotein Particles |
| TNF-α | Tumour Necrosis Factor α |
| TOD | Time of Death |
| VC | Vascular Calcification |
| VSMC | Vascular Smooth Muscle Cell |
Author Contributions
Funding
Conflicts of Interest
References
- Heiss, A.; Duchesne, A.; Denecke, B.; Grötzinger, J.; Yamamoto, K.; Renné, T.; Jahnen-Dechent, W. Structural Basis of Calcification Inhibition by α2-HS Glycoprotein/Fetuin-A. J. Boil. Chem. 2003, 278, 13333–13341. [Google Scholar] [CrossRef]
- Köppert, S.; Büscher, A.; Babler, A.; Ghallab, A.; Buhl, E.M.; Latz, E.; Hengstler, J.G.; Smith, E.R.; Jahnen-Dechent, W. Cellular Clearance and Biological Activity of Calciprotein Particles Depend on Their Maturation State and Crystallinity. Front. Immunol. 2018, 9, 9. [Google Scholar] [CrossRef]
- Viegas, C.S.; Santos, L.; Macedo, A.; Matos, A.P.; Silva, A.P.; Neves, P.L.; Staes, A.; Gevaert, K.; Morais, R.; Vermeer, C.; et al. Chronic Kidney Disease Circulating Calciprotein Particles and Extracellular Vesicles Promote Vascular Calcification. Arter. Thromb. Vasc. Boil. 2018, 38, 575–587. [Google Scholar] [CrossRef]
- Schinke, T.; Amendt, C.; Trindl, A.; Pöschke, O.; Müller-Esterl, W.; Jahnen-Dechent, W. The Serum Protein α2-HS Glycoprotein/Fetuin Inhibits Apatite Formationin Vitroand in Mineralizing Calvaria Cells. J. Boil. Chem. 1996, 271, 20789–20796. [Google Scholar] [CrossRef]
- Holt, S.G.; Smith, E.R. Fetuin-A-containing calciprotein particles in mineral trafficking and vascular disease. Nephrol. Dial. Transplant. 2016, 31, 1583–1587. [Google Scholar] [CrossRef]
- Heiss, A.; Eckert, T.; Aretz, A.; Richtering, W.; Van Dorp, W.; Schäfer, C.; Jahnen-Dechent, W. Hierarchical Role of Fetuin-A and Acidic Serum Proteins in the Formation and Stabilization of Calcium Phosphate Particles. J. Boil. Chem. 2008, 283, 14815–14825. [Google Scholar] [CrossRef]
- Cai, M.M.X.; Smith, E.R.; Holt, S.G. The role of fetuin-A in mineral trafficking and deposition. BoneKey Rep. 2015, 4, 672. [Google Scholar] [CrossRef]
- Rochette, C.N.; Rosenfeldt, S.; Heiss, A.; Narayanan, T.; Ballauff, M.; Jahnen-Dechent, W. A Shielding Topology Stabilizes the Early Stage Protein-Mineral Complexes of Fetuin-A and Calcium Phosphate: A Time-Resolved Small-Angle X-ray Study. ChemBioChem 2009, 10, 735–740. [Google Scholar] [CrossRef]
- Pasch, A.; Farese, S.; Gräber, S.; Wald, J.; Richtering, W.; Floege, J.; Jahnen-Dechent, W. Nanoparticle-Based Test Measures Overall Propensity for Calcification in Serum. J. Am. Soc. Nephrol. 2012, 23, 1744–1752. [Google Scholar] [CrossRef]
- Hunt, J.L.; Fairman, R.; Mitchell, M.E.; Carpenter, J.P.; Golden, M.; Khalapyan, T.; Wolfe, M.; Neschis, D.; Milner, R.; Scoll, B.; et al. Bone Formation in Carotid Plaques. Stroke 2002, 33, 1214–1219. [Google Scholar] [CrossRef]
- Van Oostrom, O.; Fledderus, J.O.; De Kleijn, D.; Pasterkamp, G.; Verhaar, M. Smooth Muscle Progenitor Cells: Friend or Foe in Vascular Disease? Curr. Stem Cell Res. Ther. 2009, 4, 131–140. [Google Scholar] [CrossRef]
- Persy, V.; D’Haese, P. Vascular calcification and bone disease: The calcification paradox. Trends Mol. Med. 2009, 15, 405–416. [Google Scholar] [CrossRef]
- Ho, C.Y.; Shanahan, C.M. Medial Arterial Calcification. Arter. Thromb. Vasc. Boil. 2016, 36, 1475–1482. [Google Scholar] [CrossRef]
- Lanzer, P.; Boehm, M.; Sorribas, V.; Thiriet, M.; Janzen, J.; Zeller, T.; Hilaire, C.S.; Shanahan, C.M. Medial vascular calcification revisited: Review and perspectives. Eur. Hear. J. 2014, 35, 1515–1525. [Google Scholar] [CrossRef]
- Magne, D.; Julien, M.; Vinatier, C.; Weiss, P.; Guicheux, J.; Merhi-Soussi, F. Cartilage formation in growth plate and arteries: From physiology to pathology. BioEssays 2005, 27, 708–716. [Google Scholar] [CrossRef]
- Goodman, W.G.; Goldin, J.; Kuizon, B.D.; Yoon, C.; Gales, B.; Sider, D.; Wang, Y.; Chung, J.; Emerick, A.; Greaser, L.; et al. Coronary-Artery Calcification in Young Adults with End-Stage Renal Disease Who Are Undergoing Dialysis. New Engl. J. Med. 2000, 342, 1478–1483. [Google Scholar] [CrossRef]
- Bressendorff, I.; Hansen, D.; Pasch, A.; Holt, S.G.; Schou, M.; Brandi, L.; Smith, E.R. The effect of increasing dialysate magnesium on calciprotein particles, inflammation and bone markers: Post hoc analysis from a randomized controlled clinical trial. Nephrol. Dial. Transplant. 2019. [Google Scholar] [CrossRef]
- Shishkova, D.; Velikanova, E.; Sinitsky, M.; Tsepokina, A.; Gruzdeva, O.V.; Bogdanov, L.; Kutikhin, A. Calcium Phosphate Bions Cause Intimal Hyperplasia in Intact Aortas of Normolipidemic Rats through Endothelial Injury. Int. J. Mol. Sci. 2019, 20, 5728. [Google Scholar] [CrossRef]
- Ter Braake, A.D.; Eelderink, C.; Zeper, L.W.; Pasch, A.; Bakker, S.J.L.; De Borst, M.H.; Hoenderop, J.G.J.; De Baaij, J.H. Calciprotein particle inhibition explains magnesium-mediated protection against vascular calcification. Nephrol. Dial. Transplant. 2019. [Google Scholar] [CrossRef]
- Nakazato, J.; Hoshide, S.; Wake, M.; Miura, Y.; Kuro-O, M.; Kario, K. Association of calciprotein particles measured by a new method with coronary artery plaque in patients with coronary artery disease: A cross-sectional study. J. Cardiol. 2019, 74, 428–435. [Google Scholar] [CrossRef]
- Nakamura, K.; Nagata, Y.; Hiroyoshi, T.; Isoyama, N.; Fujikawa, K.; Miura, Y.; Matsuyama, H.; Kuro-O, M. The effect of lanthanum carbonate on calciprotein particles in hemodialysis patients. Clin. Exp. Nephrol. 2019, 24, 323–329. [Google Scholar] [CrossRef]
- Nemoto, Y.; Kumagai, T.; Ishizawa, K.; Miura, Y.; Shiraishi, T.; Morimoto, C.; Sakai, K.; Omizo, H.; Yamazaki, O.; Tamura, Y.; et al. Phosphate binding by sucroferric oxyhydroxide ameliorates renal injury in the remnant kidney model. Sci. Rep. 2019, 9, 1732. [Google Scholar] [CrossRef]
- Chen, W.; Anokhina, V.; Dieudonne, G.; Abramowitz, M.K.; Kashyap, R.; Yan, C.; Wu, T.T.; Bentley, K.L.D.M.; Miller, B.L.; Bushinsky, D. Patients with advanced chronic kidney disease and vascular calcification have a large hydrodynamic radius of secondary calciprotein particles. Nephrol. Dial. Transplant. 2019, 34, 992–1000. [Google Scholar] [CrossRef]
- Cai, M.M.X.; Smith, E.R.; Kent, A.; Huang, L.; Hewitson, T.; McMahon, L.P.; Holt, S.G. Calciprotein Particle Formation in Peritoneal Dialysis Effluent is Dependent on Dialysate Calcium Concentration. Perit. Dial. Int. 2018, 38, 286–292. [Google Scholar] [CrossRef]
- Ruderman, I.; Smith, E.R.; Toussaint, N.D.; Hewitson, T.; Holt, S.G. Longitudinal changes in bone and mineral metabolism after cessation of cinacalcet in dialysis patients with secondary hyperparathyroidism. BMC Nephrol. 2018, 19, 113. [Google Scholar] [CrossRef]
- Aghagolzadeh, P.; Radpour, R.; Bachtler, M.; Van Goor, H.; Smith, E.R.; Lister, A.; Odermatt, A.; Feelisch, M.; Pasch, A. Hydrogen sulfide attenuates calcification of vascular smooth muscle cells via KEAP1/NRF2/NQO1 activation. Atherosclerosis 2017, 265, 78–86. [Google Scholar] [CrossRef]
- Cai, M.M.X.; Smith, E.R.; Tan, S.-J.; Hewitson, T.; Holt, S.G. The Role of Secondary Calciprotein Particles in the Mineralisation Paradox of Chronic Kidney Disease. Calcif. Tissue Int. 2017, 101, 570–580. [Google Scholar] [CrossRef]
- Yamada, H.; Kuro-O, M.; Ishikawa, S.-E.; Funazaki, S.; Kusaka, I.; Kakei, M.; Hara, K. Daily variability in serum levels of calciprotein particles and their association with mineral metabolism parameters: A cross-sectional pilot study. Nephrology 2018, 23, 226–230. [Google Scholar] [CrossRef]
- Aghagolzadeh, P.; Bachtler, M.; Bijarnia, R.; Jackson, C.B.; Smith, E.R.; Odermatt, A.; Radpour, R.; Pasch, A. Calcification of vascular smooth muscle cells is induced by secondary calciprotein particles and enhanced by tumor necrosis factor-α. Atherosclerosis 2016, 251, 404–414. [Google Scholar] [CrossRef]
- Cai, M.M.X.; Wigg, B.; Smith, E.R.; Hewitson, T.; McMahon, L.P.; Holt, S.G. Relative abundance of fetuin- A in peritoneal dialysis effluent and its association with in situ formation of calciprotein particles: An observational pilot study. Nephrology 2014, 20, 6–10. [Google Scholar] [CrossRef]
- Smith, E.R.; Hanssen, E.; McMahon, L.P.; Holt, S.G. Fetuin-A-Containing Calciprotein Particles Reduce Mineral Stress in the Macrophage. PLoS ONE 2013, 8, e60904. [Google Scholar] [CrossRef] [PubMed]
- Smith, E.R.; Cai, M.M.; McMahon, L.P.; Pedagogos, E.; Toussaint, N.D.; Brumby, C.; Holt, S.G. Serum fetuin-A concentration and fetuin-A-containing calciprotein particles in patients with chronic inflammatory disease and renal failure. Nephrology 2013, 18, 215–221. [Google Scholar] [CrossRef] [PubMed]
- Smith, E.R.; Ford, M.L.; Tomlinson, L.; Rajkumar, C.; McMahon, L.P.; Holt, S.G. Phosphorylated fetuin-A-containing calciprotein particles are associated with aortic stiffness and a procalcific milieu in patients with pre-dialysis CKD. Nephrol. Dial. Transplant. 2012, 27, 1957–1966. [Google Scholar] [CrossRef] [PubMed]
- Ter Meulen, K.J.; Dekker, M.J.E.; Pasch, A.; Broers, N.J.H.; Van Der Sande, F.M.; Kooman, J.P.; Konings, C.J.A.M.; Gsponer, I.M.; Bachtler, M.D.N.; Gauly, A.; et al. Citric-acid dialysate improves the calcification propensity of hemodialysis patients: A multicenter prospective randomized cross-over trial. PLoS ONE 2019, 14, e0225824. [Google Scholar] [CrossRef]
- Van Dijk, P.R.; Hop, H.; Waanders, F.; Mulder, U.J.; Pasch, A.; Hillebrands, J.-L.; Van Goor, H.; Bilo, H.J. Serum calcification propensity in type 1 diabetes associates with mineral stress. Diabetes Res. Clin. Pract. 2019, 158, 107917. [Google Scholar] [CrossRef]
- Bundy, J.D.; Cai, X.; Mehta, R.C.; Scialla, J.J.; De Boer, I.H.; Hsu, C.-Y.; Go, A.S.; Dobre, M.; Chen, J.; Rao, P.S.; et al. Serum Calcification Propensity and Clinical Events in CKD. Clin. J. Am. Soc. Nephrol. 2019, 14, 1562–1571. [Google Scholar] [CrossRef]
- Ponte, B.; Pruijm, M.; Pasch, A.; Dufey-Teso, A.; Martin, P.-Y.; De Seigneux, S. Dialysis initiation improves calcification propensity. Nephrol. Dial. Transplant. 2019, 35, 495–502. [Google Scholar] [CrossRef]
- Bundy, J.D.; Cai, X.; Scialla, J.J.; Dobre, M.A.; Chen, J.; Hsu, C.-Y.; Leonard, M.B.; Go, A.S.; Rao, P.S.; Lash, J.P.; et al. Serum Calcification Propensity and Coronary Artery Calcification Among Patients With CKD: The CRIC (Chronic Renal Insufficiency Cohort) Study. Am. J. Kidney Dis. 2019, 73, 806–814. [Google Scholar] [CrossRef]
- Quiñones, H.; Hamdi, T.; Sakhaee, K.; Pasch, A.; Moe, O.W.; Pak, C.Y.C. Control of metabolic predisposition to cardiovascular complications of chronic kidney disease by effervescent calcium magnesium citrate: A feasibility study. J. Nephrol. 2018, 32, 93–100. [Google Scholar] [CrossRef]
- Aigner, C.; Cejka, D.; Sliber, C.; Fraunschiel, M.; Sunder-Plassmann, G.; Gaggl, M. Oral Sodium Bicarbonate Supplementation Does Not Affect Serum Calcification Propensity in Patients with Chronic Kidney Disease and Chronic Metabolic Acidosis. Kidney Blood Press. Res. 2019, 44, 188–199. [Google Scholar] [CrossRef]
- Bullen, A.L.; Anderson, C.A.M.; Hooker, E.R.; Kado, D.M.; Orwoll, E.; Pasch, A.; Ix, J.H. Correlates of T50 and relationships with bone mineral density in community-living older men: The osteoporotic fractures in men (MrOS) study. Osteoporos. Int. 2019, 30, 1529–1531. [Google Scholar] [CrossRef] [PubMed]
- Bostom, A.; Pasch, A.; Madsen, T.; Roberts, M.B.; Franceschini, N.; Steubl, D.; Garimella, P.S.; Ix, J.H.; Tuttle, K.R.; Ivanova, A.; et al. Serum Calcification Propensity and Fetuin-A: Biomarkers of Cardiovascular Disease in Kidney Transplant Recipients. Am. J. Nephrol. 2018, 48, 21–31. [Google Scholar] [CrossRef] [PubMed]
- Andrews, E.S.; Perrenoud, L.; Nowak, K.L.; You, Z.; Pasch, A.; Chonchol, M.; Kendrick, J.; Jalal, D. Examining the effects of uric acid-lowering on markers vascular of calcification and CKD-MBD. A post-hoc analysis of a randomized clinical trial. PLoS ONE 2018, 13, e0205831. [Google Scholar] [CrossRef] [PubMed]
- Ussif, A.M.; Pihlstrøm, H.; Pasch, A.; Holdaas, H.; Hartmann, A.; Smerud, K.; Åsberg, A. Paricalcitol supplementation during the first year after kidney transplantation does not affect calcification propensity score. BMC Nephrol. 2018, 19, 212. [Google Scholar] [CrossRef]
- Bressendorff, I.; Hansen, D.; Schou, M.; Pasch, A.; Brandi, L. The Effect of Increasing Dialysate Magnesium on Serum Calcification Propensity in Subjects with End Stage Kidney Disease. Clin. J. Am. Soc. Nephrol. 2018, 13, 1373–1380. [Google Scholar] [CrossRef]
- Lorenz, G.; Mayer, C.C.; Bachmann, Q.; Stryeck, S.; Braunisch, M.C.; Haller, B.; Carbajo-Lozoya, J.; Schmidt, A.; Witthauer, S.; Abuzahu, J.; et al. Acetate-free, citrate-acidified bicarbonate dialysis improves serum calcification propensity—a preliminary study. Nephrol. Dial. Transplant. 2018, 33, 2043–2051. [Google Scholar] [CrossRef]
- Dahdal, S.; Devetzis, V.; Chalikias, G.; Tziakas, D.; Chizzolini, C.; Ribi, C.; Trendelenburg, M.; Eisenberger, U.; Hauser, T.; Pasch, A.; et al. Serum calcification propensity is independently associated with disease activity in systemic lupus erythematosus. PLoS ONE 2018, 13, e0188695. [Google Scholar] [CrossRef]
- Pruijm, M.; Lu, Y.; Megdiche, F.; Piskunowicz, M.; Milani, B.; Stuber, M.; Bachtler, M.; Vogt, B.; Burnier, M.; Pasch, A. Serum calcification propensity is associated with renal tissue oxygenation and resistive index in patients with arterial hypertension or chronic kidney disease. J. Hypertens. 2017, 35, 2044–2052. [Google Scholar] [CrossRef]
- Pasch, A.; Block, G.A.; Bachtler, M.; Smith, E.R.; Jahnen-Dechent, W.; Arampatzis, S.; Chertow, G.M.; Parfrey, P.; Ma, X.; Floege, J. Blood Calcification Propensity, Cardiovascular Events, and Survival in Patients Receiving Hemodialysis in the EVOLVE Trial. Clin. J. Am. Soc. Nephrol. 2016, 12, 315–322. [Google Scholar] [CrossRef]
- Bielesz, B.; Reiter, T.; Marculescu, R.; Gleiss, A.; Bojic, M.; Kieweg, H.; Cejka, D. Calcification Propensity of Serum is Independent of Excretory Renal Function. Sci. Rep. 2017, 7, 17941. [Google Scholar] [CrossRef]
- Bressendorff, I.; Hansen, D.; Schou, M.; Silver, B.; Pasch, A.; Bouchelouche, P.; Pedersen, L.; Rasmussen, L.M.; Brandi, L. Oral Magnesium Supplementation in Chronic Kidney Disease Stages 3 and 4: Efficacy, Safety, and Effect on Serum Calcification Propensity-A Prospective Randomized Double-Blinded Placebo-Controlled Clinical Trial. Kidney Int. Rep. 2016, 2, 380–389. [Google Scholar] [CrossRef] [PubMed]
- Lorenz, G.; Steubl, D.; Kemmner, S.; Pasch, A.; Koch-Sembdner, W.; Pham, D.; Haller, B.; Bachmann, Q.; Mayer, C.C.; Wassertheurer, S.; et al. Worsening calcification propensity precedes all-cause and cardiovascular mortality in haemodialyzed patients. Sci. Rep. 2017, 7, 13368. [Google Scholar] [CrossRef] [PubMed]
- Smerud, K.; Åsberg, A.; Kile, H.; Pasch, A.; Dahle, D.O.; Bollerslev, J.; Godang, K.; Hartmann, A. A rapid and sustained improvement of calcification propensity score (serum T50) after successful kidney transplantation: Reanalysis of a randomized controlled trial of ibandronate. Clin. Transplant. 2017, 31, e13131. [Google Scholar] [CrossRef] [PubMed]
- Dekker, M.; Pasch, A.; Van Der Sande, F.; Konings, C.; Bachtler, M.; Dionisi, M.; Meier, M.; Kooman, J.; Canaud, B. High-Flux Hemodialysis and High-Volume Hemodiafiltration Improve Serum Calcification Propensity. PLoS ONE 2016, 11, e0151508. [Google Scholar] [CrossRef] [PubMed]
- Bristow, S.; Gamble, G.D.; Pasch, A.; O’Neill, W.C.; Stewart, A.; Horne, A.; Reid, I.R. Acute and 3-month effects of calcium carbonate on the calcification propensity of serum and regulators of vascular calcification: Secondary analysis of a randomized controlled trial. Osteoporos. Int. 2015, 27, 1209–1216. [Google Scholar] [CrossRef] [PubMed]
- Dahle, D.O.; Åsberg, A.; Hartmann, A.; Holdaas, H.; Bachtler, M.; Jenssen, T.G.; Dionisi, M.; Pasch, A. Serum Calcification Propensity Is a Strong and Independent Determinant of Cardiac and All-Cause Mortality in Kidney Transplant Recipients. Arab. Archaeol. Epigr. 2015, 16, 204–212. [Google Scholar] [CrossRef]
- Keyzer, C.A.; De Borst, M.H.; Berg, E.V.D.; Jahnen-Dechent, W.; Arampatzis, S.; Farese, S.; Bergmann, I.P.; Floege, J.; Navis, G.; Bakker, S.J.; et al. Calcification Propensity and Survival among Renal Transplant Recipients. J. Am. Soc. Nephrol. 2015, 27, 239–248. [Google Scholar] [CrossRef]
- Berchtold, L.; Ponte, B.; Moll, S.; Hadaya, K.; Seyde, O.; Bachtler, M.; Vallée, J.-P.; Martin, P.-Y.; Pasch, A.; De Seigneux, S. Phosphocalcic Markers and Calcification Propensity for Assessment of Interstitial Fibrosis and Vascular Lesions in Kidney Allograft Recipients. PLoS ONE 2016, 11, e0167929. [Google Scholar] [CrossRef]
- De Seigneux, S.; Ponte, B.; Berchtold, L.; Hadaya, K.; Martin, P.-Y.; Pasch, A. Living kidney donation does not adversely affect serum calcification propensity and markers of vascular stiffness. Transpl. Int. 2015, 28, 1074–1080. [Google Scholar] [CrossRef]
- Smith, E.R.; Ford, M.L.; Tomlinson, L.; Bodenham, E.; McMahon, L.P.; Farese, S.; Rajkumar, C.; Holt, S.G.; Pasch, A. Serum Calcification Propensity Predicts All-Cause Mortality in Predialysis CKD. J. Am. Soc. Nephrol. 2013, 25, 339–348. [Google Scholar] [CrossRef]
- Zarb, Y.; Weber-Stadlbauer, U.; Kirschenbaum, D.; Kindler, D.R.; Richetto, J.; Keller, D.; Rademakers, R.; Dickson, D.W.; Pasch, A.; Byzova, T.V.; et al. Ossified blood vessels in primary familial brain calcification elicit a neurotoxic astrocyte response. Brain 2019, 142, 885–902. [Google Scholar] [CrossRef] [PubMed]
- Kendrick, J.; Shah, P.; Andrews, E.; You, Z.; Nowak, K.L.; Pasch, A.; Chonchol, M. Effect of Treatment of Metabolic Acidosis on Vascular Endothelial Function in Patients with CKD. Clin. J. Am. Soc. Nephrol. 2018, 13, 1463–1470. [Google Scholar] [CrossRef] [PubMed]
- Voelkl, J.; Tuffaha, R.; Luong, T.T.; Zickler, D.; Masyout, J.; Feger, M.; Verheyen, N.; Blaschke, F.; Kuro-O, M.; Tomaschitz, A.; et al. Zinc Inhibits Phosphate-Induced Vascular Calcification through TNFAIP3-Mediated Suppression of NF-κB. J. Am. Soc. Nephrol. 2018, 29, 1636–1648. [Google Scholar] [CrossRef] [PubMed]
- Jahnen-Dechent, W.; Trindl, A.; Godovac-Zimmermann, J.; Müller-Esterl, W. Posttranslational Processing of Human alpha2-HS Glycoprotein (Human Fetuin). Evidence for the Production of a Phosphorylated Single-Chain Form by Hepatoma Cells. JBIC J. Boil. Inorg. Chem. 1994, 226, 59–69. [Google Scholar] [CrossRef] [PubMed]
- Mathews, S.T.; Chellam, N.; Srinivas, P.R.; Cintron, V.J.; Leon, M.; Goustin, A.S.; Grunberger, G. Alpha2-HSG, a specific inhibitor of insulin receptor autophosphorylation, interacts with the insulin receptor. Mol. Cell. Endocrinol. 2000, 164, 87–98. [Google Scholar] [CrossRef]
- Auberger, P.; Falquerho, L.; Contreres, J.O.; Pagès, G.; Le Cam, G.; Rossi, B.; Le Cam, A. Characterization of a natural inhibitor of the insulin receptor tyrosine kinase: cDNA cloning, purification, and anti-mitogenic activity. Cell 1989, 58, 631–640. [Google Scholar] [CrossRef]
- Suzuki, M.; Shimokawa, H.; Takagi, Y.; Sasaki, S. Calcium-binding properties of fetuin in fetal bovine serum. J. Exp. Zoöl. 1994, 270, 501–507. [Google Scholar] [CrossRef]
- Herrmann, M.; Schäfer, C.; Heiss, A.; Gräber, S.; Kinkeldey, A.; Büscher, A.; Schmitt, M.M.; Bornemann, J.; Nimmerjahn, F.; Herrmann, M.; et al. Clearance of Fetuin-A–Containing Calciprotein Particles Is Mediated by Scavenger Receptor-A. Circ. Res. 2012, 111, 575–584. [Google Scholar] [CrossRef]
- Hamano, T.; Matsui, I.; Mikami, S.; Tomida, K.; Fujii, N.; Imai, E.; Rakugi, H.; Isaka, Y. Fetuin-mineral complex reflects extraosseous calcification stress in CKD. J. Am. Soc. Nephrol. 2010, 21, 1998–2007. [Google Scholar] [CrossRef]
- Smith, E.R.; Hewitson, T.; Cai, M.M.X.; Aghagolzadeh, P.; Bachtler, M.; Pasch, A.; Holt, S.G. A novel fluorescent probe-based flow cytometric assay for mineral-containing nanoparticles in serum. Sci. Rep. 2017, 7, 5686. [Google Scholar] [CrossRef]
- Ismail, A.H.; Schäfer, C.; Heiss, A.; Walter, M.; Jahnen-Dechent, W.; Leonhardt, S. An electrochemical impedance spectroscopy (EIS) assay measuring the calcification inhibition capacity in biological fluids. Biosens. Bioelectron. 2011, 26, 4702–4707. [Google Scholar] [CrossRef] [PubMed]
- Ter Braake, A.D.; Tinnemans, P.T.; Shanahan, C.M.; Hoenderop, J.G.J.; De Baaij, J.H. Magnesium prevents vascular calcification in vitro by inhibition of hydroxyapatite crystal formation. Sci. Rep. 2018, 8, 2069. [Google Scholar] [CrossRef] [PubMed]
- Huang, M.; Zheng, L.; Xu, H.; Tang, D.; Lin, L.; Zhang, J.; Li, C.; Wang, W.; Yuan, Q.; Tao, L.; et al. Oxidative stress contributes to vascular calcification in patients with chronic kidney disease. J. Mol. Cell. Cardiol. 2020, 138, 256–268. [Google Scholar] [CrossRef] [PubMed]
- Rubin, M.R.; Silverberg, S.J. Vascular calcification and osteoporosis--the nature of the nexus. J. Clin. Endocrinol. Metab. 2004, 89, 4243–4245. [Google Scholar] [CrossRef] [PubMed]
- Keeley, F.; Sitarz, E. Identification and quantitation of α2-HS-glycoprotein in the mineralized matrix of calcified plaques of atherosclerotic human aorta. Atherosclerosis 1985, 55, 63–69. [Google Scholar] [CrossRef]
- Binkert, C.; Demetriou, M.; Sukhu, B.; Szweras, M.; Tenenbaum, H.C.; Dennis, J. Regulation of osteogenesis by fetuin. J. Boil. Chem. 1999, 274, 28514–28520. [Google Scholar] [CrossRef]
- Ketteler, M.; Bongartz, P.; Westenfeld, R.; Wildberger, J.E.; Mahnken, A.H.; Böhm, R.; Metzger, T.; Wanner, C.; Jahnen-Dechent, W.; Floege, J. Association of low fetuin-A (AHSG) concentrations in serum with cardiovascular mortality in patients on dialysis: A cross-sectional study. Lancet 2003, 361, 827–833. [Google Scholar] [CrossRef]
- Fontaine, M.A.; Albert, A.; Dubois, B.; Saint-Remy, A.; Rorive, G. Fracture and bone mineral density in hemodialysis patients. Clin. Nephrol. 2000, 54, 218–226. [Google Scholar]
- Kirkpantur, A.; Altun, B.; Hazirolan, T.; Akata, D.; Arici, M.; Kirazli, S.; Turgan, C. Association Among Serum Fetuin-A Level, Coronary Artery Calcification, and Bone Mineral Densitometry in Maintenance Hemodialysis Patients. Artif. Organs 2009, 33, 844–854. [Google Scholar] [CrossRef]
- Pasch, A.; Jahnen-Dechent, W.; Smith, E.R. Phosphate, Calcification in Blood, and Mineral Stress: The Physiologic Blood Mineral Buffering System and Its Association with Cardiovascular Risk. Int. J. Nephrol. 2018, 2018, 1–5. [Google Scholar] [CrossRef]


| Author, Year | Study Design, Duration | Number of Subjects, Disease | CPP Type Studied | Findings |
|---|---|---|---|---|
| Nakazato et al. 2019 [20] | cross-sectional, N/A | 71 ACS | tCPP | High CPP levels associated with atherosclerosis. |
| Chen et al. 2019 [23] | cross-sectional, N/A | 45 CKD stage IV–V | CPP II | Larger CPP II diameter in patients with VC. |
| Viegas et al. 2018 [3] | cross-sectional, N/A | 16 CKD stage II-IV, 20 CKD stage V | tCPP | CPP from CKD stage V patients contained less fetuin-A and GRP and had CPP II like characteristics. |
| Yamada et al. 2018 [28] | cross-sectional, N/A | 10 diabetes mellitus type 2 | tCPP | CPP elevated 2 h post-meal, CPP inversely correlated with eGFR. |
| Cai et al. 2015 [30] | cross-sectional, N/A | 20 peritoneal dialysis | tCPP | CPP present, fetuin-A abundant in peritoneal dialysis effluent. |
| Smith et al. 2013 [32] | cross-sectional, N/A | 11 CKD stage III–IV, 42 HD, 18 peritoneal dialysis, 13 chronic inflammatory disease | tCPP | CPP increased in CKD III-IV, HD, peritoneal dialysis and chronic inflammatory disease patients; CPP was highest in HD patients with calcific uremic arteriolopathy. |
| Smith et al. 2012 [33] | cross-sectional, N/A | 200 CKD stage III–IV | tCPP | Higher CPP levels associated with increased aortic stiffness. |
| Cai et al. 2018 [24] | prospective cohort, 7 weeks | 12 peritoneal dialysis | tCPP | Dialysate with higher Ca2+ concentration had higher CPP content. |
| Ruderman et al. 2018 [25] | prospective cohort, 12 months | 62 HD | CPP I | Increase of serum CPP I after cessation of cinacalcet treatment. |
| Bressendorff et al. 2019 [17] | Interventional, 28 days | 57 HD | CPP I, CPP II | Higher Mg2+ concentration dialysis solution reduced both CPP I and CPP II levels, compared to standard dialysis solution. |
| Nakamura et al. 2019 [21] | Interventional, 16 weeks | 24 HD | tCPP | Lower CPP in lanthanum carbonate treated patients vs. calcium carbonate. |
| Author, Year | Study Design | Animals/Cells | CPP Type Studied | Findings |
|---|---|---|---|---|
| Nemoto et al. 2019 [22] | animal | rats with 5/6 nephrectomy | tCPP | Lower CPP in rats treated with sucroferric oxyhydroxide. |
| Shishkova et al. 2019 [18] | in vitro | VSMCs | CPP I, CPP II | Both CPP I and CPP II induced VSMC intimal hyperplasia, more pronounced in case of CPP II. |
| Ter Braake et al. 2019 [19] | in vitro | VSMCs | CPP II | CPP II induced VSMC calcification. |
| Aghagolzadeh et al. 2017 [26] | in vitro | VSMCs | tCPP | H2S inhibits CPP induced VSMC calcification. |
| Cai et al. 2017 [27] | in vitro | VSMCs | CPP II | Pi or CPP II alone did not initiate VSMC mineralization, but CPP II with Pi did. |
| Aghagolzadeh et al. 2016 [29] | in vitro | VSMCs | CPP I, CPP II | CPP II induced calcification in VSMCs, CPP I did not. |
| Smith et al. 2013 [31] | in vitro | VSMCs | tCPP | CPP induce secretion of TNF-α and IL-1β in macrophages, but less significantly than that induced by hydroxyapatite crystals. |
| Author, Year | Study Design | Follow-Up Time | Number of Subjects, Disease | Findings |
|---|---|---|---|---|
| Bullen et al. 2019 [41] | cross-sectional | N/A | 149 men with osteoporosis | T50 was not associated with bone mineral density. |
| Dahdal et al. 2018 [47] | cross-sectional | N/A | 168, SLE | T50 was negatively associated with disease activity. |
| Pruijm et al. 2017 [48] | cross-sectional | N/A | 58, CKD; 48, hypertension | Lower T50 was associated with reduced tissue oxygenation and perfusion. |
| Bielesz et al. 2017 [50] | cross-sectional | N/A | 118, CKD stage I–V | T50 associated with Pi, Mg2+ and fetuin-A but not with eGFR. |
| Dekker et al. 2016 [54] | cross-sectional | N/A | 64, HD | T50 increased post-haemodialysis and post-haemodiafiltration. |
| Voelkl et al. 2018 [63] | cross-sectional | N/A | 16, CKD; 20, HD | T50 was lower in CKD patients compared to controls. |
| van Dijk et al. 2019 [35] | prospective cohort | 15 years | 216, type 1 diabetes | T50 not associated with mortality. |
| Bundy et al. 2019 [36] | prospective cohort | At TOD or 11.2 years | 3404, CKD stage II–IV | Lower T50 associated with cardiovascular events and all-cause mortality. |
| Ponte et al. 2019 [37] | prospective cohort | 3 months | 46, HD; 12, peritoneal dialysis | Higher T 50 after dialysis initiation. |
| Bundy et al. 2019 [38] | prospective cohort | 3.2 ± 0.6 years | 780, CKD stage II–IV | Lower T50 was associated with greater CAC severity and progression, however, T50 was not associated with CAC incidence. |
| Bostom et al. 2018 [42] | prospective cohort | median of 2.18 years | 685, CVD | Lower T50 and fetuin-A levels were associated with greater risk for CVD outcomes. |
| Pasch et al. 2017 [49] | prospective cohort | At TOD or first non-fatal CVE | 2785, HD | Lower T50 associated with all-cause mortality, myocardial infarction, and peripheral vascular events. |
| Lorenz et al. 2017 [52] | prospective cohort | 24 months | 188, HD | T50 rate of decline significantly predicted all-cause and cardiovascular mortality. |
| Dahle et al. 2016 [56] | prospective cohort | median of 5.1 years | 1435, kidney transplant | Lower T50 associated with all-cause and cardiac mortality. |
| Keyzer et al. 2016 [57] | prospective cohort | median of 3.1 years | 699, kidney transplant | Lower T50 associated with increased graft failure, all-cause, and cardiac mortality. |
| de Seigneux et al. 2015 [59] | prospective cohort | 1 year | 21, kidney donors | T50 was independent of eGFR. |
| Smith et al. 2014 [60] | prospective cohort | median of 5.3 years | 184, CKD stage III–IV | Lower T50 associated with higher all-cause mortality. |
| Berchtold et al. 2016 [58] | retrospective cohort | between 2 and 43 years | 129, kidney transplant | T50 associated with interstitial fibrosis and vascular lesions. |
| Author, Year | Study Duration | Number of Subjects, Disease | Findings |
|---|---|---|---|
| Smerud et al. 2017 [53] | 1 year | 123, kidney transplant | T50 increased with no further change after 1 year, ibandronate had no effect on T50. |
| Andrews et al. 2018 [43] | 12 weeks | 80, CKD with hyperuricemia | Allopurinol lowered uric acid levels but had no effect on T50. |
| Lorenz et al. 2018 [46] | 3 months | 78, HD | Acetate-free, citrate-acidified, standard bicarbonate dialysis solution increased T50 compared to acetate dialysis solution. |
| Ussif et al. 2018 [44] | 1 year | 76, kidney transplant | Paricalcitol supplementation had no effect on T50. |
| Bressendorff et al. 2018 [45] | 28 days | 57, HD | Higher dialysis solution Mg2+ concentration increased T50. |
| Bristow et al. 2016 [55] | 3 months | 41, post-menopausal women | Insignificant decrease of T50 in the group treated with oral calcium carbonate supplement. |
| Bressendorff et al. 2017 [51] | 8 weeks | 36, CKD III–IV | Oral Mg2+ supplementation increased T50. |
| Aigner et al. 2019 [40] | 4 weeks | 35, CKD | Oral bicarbonate supplementation showed no effect on T50 in acidotic CKD patients. |
| Kendrick et al. 2018 [62] | 14 weeks | 18, CKD | Oral sodium bicarbonate supplementation showed no effect on T50 in CKD patients with low serum bicarbonate levels. |
| Ter Meulen et al. 2019 [34] | 2 weeks | 18, HD | Citric acid-buffered dialysis solution increased T50 compared to acetate-buffered solution. |
| Quiñones et al. 2019 [39] | 2 weeks | 9, CKD stage III, 9, CKD stage V | Effervescent, oral, calcium-magnesium citrate increased T50. |
© 2020 by the authors. Licensee MDPI, Basel, Switzerland. This article is an open access article distributed under the terms and conditions of the Creative Commons Attribution (CC BY) license (http://creativecommons.org/licenses/by/4.0/).
Share and Cite
Silaghi, C.N.; Ilyés, T.; Van Ballegooijen, A.J.; Crăciun, A.M. Calciprotein Particles and Serum Calcification Propensity: Hallmarks of Vascular Calcifications in Patients with Chronic Kidney Disease. J. Clin. Med. 2020, 9, 1287. https://doi.org/10.3390/jcm9051287
Silaghi CN, Ilyés T, Van Ballegooijen AJ, Crăciun AM. Calciprotein Particles and Serum Calcification Propensity: Hallmarks of Vascular Calcifications in Patients with Chronic Kidney Disease. Journal of Clinical Medicine. 2020; 9(5):1287. https://doi.org/10.3390/jcm9051287
Chicago/Turabian StyleSilaghi, Ciprian N., Tamás Ilyés, Adriana J. Van Ballegooijen, and Alexandra M. Crăciun. 2020. "Calciprotein Particles and Serum Calcification Propensity: Hallmarks of Vascular Calcifications in Patients with Chronic Kidney Disease" Journal of Clinical Medicine 9, no. 5: 1287. https://doi.org/10.3390/jcm9051287
APA StyleSilaghi, C. N., Ilyés, T., Van Ballegooijen, A. J., & Crăciun, A. M. (2020). Calciprotein Particles and Serum Calcification Propensity: Hallmarks of Vascular Calcifications in Patients with Chronic Kidney Disease. Journal of Clinical Medicine, 9(5), 1287. https://doi.org/10.3390/jcm9051287