Modification of Muscle-Related Hormones in Women with Obesity: Potential Impact on Bone Metabolism

 , ,
, , 
Abstract
1. Introduction
2. Subjects and Methods
2.1. Patient Consent
2.2. Bone Mineral Density, Body Fat and Lean Body Mass
2.3. Assays
3. Statistical Analysis
4. Results
4.1. Areal Bone Mineral Density
4.2. Biological Parameters
4.3. Correlations between Anthropometric and Biological Parameters and aBMD
4.4. Mediation Effects of Myokines on aBMD
5. Discussion
5.1. Obesity and Myokines
5.2. Limitations
6. Conclusions
Author Contributions
Acknowledgments
Conflicts of Interest
References
- Andersen, S.; Frederiksen, K.D.; Hansen, S.; Brixen, K.; Gram, J.; Stoving, R.K. Bone structure and estimated bone strength in obese patients evaluated by high-resolution peripheral quantitative computed tomography. Calcif. Tissue Int. 2014, 95, 19–28. [Google Scholar] [CrossRef]
- Bredella, M.A.; Torriani, M.; Ghomi, R.H.; Thomas, B.J.; Brick, D.J.; Gerweck, A.V.; Harrington, L.M.; Breggia, A.; Rosen, C.J.; Miller, K.K. Determinants of bone mineral density in obese premenopausal women. Bone 2011, 48, 748–754. [Google Scholar] [CrossRef] [PubMed]
- Sornay-Rendu, E.; Boutroy, S.; Vilayphiou, N.; Claustrat, B.; Chapurlat, R.D. In obese postmenopausal women, bone microarchitecture and strength are not commensurate to greater body weight: The Os des Femmes de Lyon (OFELY) study. J. Bone Miner. Res. 2013, 28, 1679–1687. [Google Scholar] [CrossRef] [PubMed]
- Evans, A.L.; Paggiosi, M.A.; Eastell, R.; Walsh, J.S. Bone Density, Microstructure and Strength in Obese and Normal Weight Men and Women in Younger and Older Adulthood. J. Bone Miner. Res. 2015, 30, 920–928. [Google Scholar] [CrossRef] [PubMed]
- Beck, T.J.; Petit, M.A.; Wu, G.; LeBoff, M.S.; Cauley, J.A.; Chen, Z. Does obesity really make the femur stronger? BMD, geometry, and fracture incidence in the wome’s health initiative-observational study. J. Bone Miner. Res. 2009, 24, 1369–1379. [Google Scholar] [CrossRef]
- Maimoun, L.; Mura, T.; Leprieur, E.; Avignon, A.; Mariano-Goulart, D.; Sultan, A. Impact of obesity on bone mass throughout adult life: Influence of gender and severity of obesity. Bone 2016, 90, 23–30. [Google Scholar] [CrossRef]
- Frost, H.M. The role of changes in mechanical usage set points in the pathogenesis of osteoporosis. J. Bone Miner. Res. 1992, 7, 253–261. [Google Scholar] [CrossRef]
- Maimoun, L.; Garnero, P.; Mura, T.; Nocca, D.; Lefebvre, P.; Philibert, P.; Seneque, M.; Gaspari, L.; Vauchot, F.; Courtet, P.; et al. Specific effects of anorexia nervosa and obesity on bone mineral density and bone turnover in young women. J. Clin. Endocrinol. Metab. 2019. [Google Scholar] [CrossRef]
- El Hage, R.; Bachour, F.; Khairallah, W.; Bedran, F.; Maalouf, N.; Zakhem, E.; Issa, M.; Adib, G.; Maalouf, G. The influence of obesity and overweight on hip bone mineral density in lebanese women. J. Clin. Densitom. 2014, 17, 216–217. [Google Scholar] [CrossRef]
- Hage, R.E.; Bachour, F.; Sebaaly, A.; Issa, M.; Zakhem, E.; Maalouf, G. The Influence of Weight Status on Radial Bone Mineral Density in Lebanese Women. Calcif. Tissue Int. 2014, 94, 465–467. [Google Scholar] [CrossRef]
- Kontogianni, M.D.; Dafni, U.G.; Routsias, J.G.; Skopouli, F.N. Blood leptin and adiponectin as possible mediators of the relation between fat mass and BMD in perimenopausal women. J. Bone Miner. Res. 2004, 19, 546–551. [Google Scholar] [CrossRef] [PubMed]
- Pasco, J.A.; Henry, M.J.; Kotowicz, M.A.; Collier, G.R.; Ball, M.J.; Ugoni, A.M.; Nicholson, G.C. Serum leptin levels are associated with bone mass in nonobese women. J. Clin. Endocrinol. Metab. 2001, 86, 1884–1887. [Google Scholar] [CrossRef] [PubMed]
- Reid, I.R. Relationships among body mass, its components, and bone. Bone 2002, 31, 547–555. [Google Scholar] [CrossRef]
- Bredella, M.A.; Lin, E.; Gerweck, A.V.; Landa, M.G.; Thomas, B.J.; Torriani, M.; Bouxsein, M.L.; Miller, K.K. Determinants of bone microarchitecture and mechanical properties in obese men. J. Clin. Endocrinol. Metab. 2012, 97, 4115–4122. [Google Scholar] [CrossRef]
- Biver, E.; Salliot, C.; Combescure, C.; Gossec, L.; Hardouin, P.; Legroux-Gerot, I.; Cortet, B. Influence of adipokines and ghrelin on bone mineral density and fracture risk: A systematic review and meta-analysis. J. Clin. Endocrinol. Metab. 2011, 96, 2703–2713. [Google Scholar] [CrossRef] [PubMed]
- Zhao, L.J.; Liu, Y.J.; Liu, P.Y.; Hamilton, J.; Recker, R.R.; Deng, H.W. Relationship of obesity with osteoporosis. J. Clin. Endocrinol. Metab. 2007, 92, 1640–1646. [Google Scholar] [CrossRef]
- Aguirre, L.; Napoli, N.; Waters, D.; Qualls, C.; Villareal, D.T.; Armamento-Villareal, R. Increasing adiposity is associated with higher adipokine levels and lower bone mineral density in obese older adults. J. Clin. Endocrinol. Metab. 2014, 99, 3290–3297. [Google Scholar] [CrossRef]
- Madeira, E.; Mafort, T.T.; Madeira, M.; Guedes, E.P.; Moreira, R.O.; de Mendonca, L.M.; Lima, I.C.; de Pinho, P.R.; Lopes, A.J.; Farias, M.L. Lean mass as a predictor of bone density and microarchitecture in adult obese individuals with metabolic syndrome. Bone 2014, 59, 89–92. [Google Scholar] [CrossRef]
- Burr, D.B.; Robling, A.G.; Turner, C.H. Effects of biomechanical stress on bones in animals. Bone 2002, 30, 781–786. [Google Scholar] [CrossRef]
- Giudice, J.; Taylor, J.M. Muscle as a paracrine and endocrine organ. Curr. Opin. Pharmacol. 2017, 34, 49–55. [Google Scholar] [CrossRef]
- Hamrick, M.W.; McPherron, A.C.; Lovejoy, C.O. Bone mineral content and density in the humerus of adult myostatin-deficient mice. Calcif. Tissue Int. 2002, 71, 63–68. [Google Scholar] [CrossRef] [PubMed]
- Hamrick, M.W. Increased bone mineral density in the femora of GDF8 knockout mice. Anat. Rec. A Discov. Mol. Cell Evol. Biol. 2003, 272, 388–391. [Google Scholar] [CrossRef] [PubMed]
- Hamrick, M.W.; McPherron, A.C.; Lovejoy, C.O.; Hudson, J. Femoral morphology and cross-sectional geometry of adult myostatin-deficient mice. Bone 2000, 27, 343–349. [Google Scholar] [CrossRef]
- Hamrick, M.W.; Shi, X.; Zhang, W.; Pennington, C.; Thakore, H.; Haque, M.; Kang, B.; Isales, C.M.; Fulzele, S.; Wenger, K.H. Loss of myostatin (GDF8) function increases osteogenic differentiation of bone marrow-derived mesenchymal stem cells but the osteogenic effect is ablated with unloading. Bone 2007, 40, 1544–1553. [Google Scholar] [CrossRef] [PubMed]
- Kellum, E.; Starr, H.; Arounleut, P.; Immel, D.; Fulzele, S.; Wenger, K.; Hamrick, M.W. Myostatin (GDF-8) deficiency increases fracture callus size, Sox-5 expression, and callus bone volume. Bone 2009, 44, 17–23. [Google Scholar] [CrossRef]
- Zhang, Z.L.; He, J.W.; Qin, Y.J.; Hu, Y.Q.; Li, M.; Zhang, H.; Hu, W.W.; Liu, Y.J.; Gu, J.M. Association between myostatin gene polymorphisms and peak BMD variation in Chinese nuclear families. Osteoporos. Int. 2008, 19, 39–47. [Google Scholar] [CrossRef]
- Yue, H.; He, J.W.; Zhang, H.; Wang, C.; Hu, W.W.; Gu, J.M.; Ke, Y.H.; Fu, W.Z.; Hu, Y.Q.; Li, M.; et al. Contribution of myostatin gene polymorphisms to normal variation in lean mass, fat mass and peak BMD in Chinese male offspring. Acta. Pharmacol. Sin. 2012, 33, 660–667. [Google Scholar] [CrossRef]
- Harslof, T.; Frost, M.; Nielsen, T.L.; Husted, L.B.; Nyegaard, M.; Brixen, K.; Borglum, A.D.; Mosekilde, L.; Andersen, M.; Rejnmark, L.; et al. Polymorphisms of muscle genes are associated with bone mass and incident osteoporotic fractures in Caucasians. Calcif. Tissue Int. 2013, 92, 467–476. [Google Scholar] [CrossRef]
- Trayhurn, P.; Drevon, C.A.; Eckel, J. Secreted proteins from adipose tissue and skeletal muscle—Adipokines, myokines and adipose/muscle cross-talk. Arch. Physiol. Biochem. 2011, 117, 47–56. [Google Scholar] [CrossRef]
- Physical Status: The Use and Interpretation of Anthropometry. Available online: https://apps.who.int/iris/bitstream/handle/10665/37003/WHO_TRS_854.pdf?sequence=1&isAllowed=y (accessed on 20 December 2019).
- Yung, Y.-F.; Lamm, M.; Zhang, W.; SAS Institute Inc. Causal Mediation Analysis with the CASUALMED Procedure. Available online: https://www.sas.com/content/dam/SAS/support/en/sas-global-forum-proceedings/2018/1991-2018.pdf (accessed on 12 November 2019).
- Valeri, L.; Vanderweele, T.J. Mediation analysis allowing for exposure-mediator interactions and causal interpretation: Theoretical assumptions and implementation with SAS and SPSS macros. Psychol. Methods 2013, 18, 137–150. [Google Scholar] [CrossRef]
- Pedersen, B.K.; Febbraio, M.A. Muscles, exercise and obesity: Skeletal muscle as a secretory organ. Nat. Rev. Endocrinol. 2012, 8, 457–465. [Google Scholar] [CrossRef]
- Perakakis, N.; Kokkinos, A.; Peradze, N.; Tentolouris, N.; Ghaly, W.; Tsilingiris, D.; Alexandrou, A.; Mantzoros, C.S. Follistatins in glucose regulation in healthy and obese individuals. Diabetes Obes. Metab. 2019, 21, 683–690. [Google Scholar] [CrossRef]
- Lyons, J.A.; Haring, J.S.; Biga, P.R. Myostatin expression, lymphocyte population, and potential cytokine production correlate with predisposition tohigh-fat diet induced obesity in mice. PLoS ONE 2010, 5, e12928. [Google Scholar] [CrossRef] [PubMed]
- Hittel, D.S.; Berggren, J.R.; Shearer, J.; Boyle, K.; Houmard, J.A. Increased secretion and expression of myostatin in skeletal muscle from extremely obese women. Diabetes 2009, 58, 30–38. [Google Scholar] [CrossRef] [PubMed]
- Park, J.J.; Berggren, J.R.; Hulver, M.W.; Houmard, J.A.; Hoffman, E.P. GRB14, GPD1, and GDF8 as potential network collaborators in weight loss-induced improvements in insulin action in human skeletal muscle. Physiol. Genom. 2006, 27, 114–121. [Google Scholar] [CrossRef] [PubMed]
- Tang, L.; Gao, X.; Yang, X.; Liu, C.; Wang, X.; Han, Y.; Zhao, X.; Chi, A.; Sun, L. Ladder-Climbing Training Prevents Bone Loss and Microarchitecture Deterioration in Diet-Induced Obese Rats. Calcif. Tissue Int. 2016, 98, 85–93. [Google Scholar] [CrossRef] [PubMed]
- Allen, D.L.; Cleary, A.S.; Speaker, K.J.; Lindsay, S.F.; Uyenishi, J.; Reed, J.M.; Madden, M.C.; Mehan, R.S. Myostatin, activin receptor IIb, and follistatin-like-3 gene expression are altered in adipose tissue and skeletal muscle of obese mice. Am. J. Physiol. Endocrinol. Metab. 2008, 294, 918–927. [Google Scholar] [CrossRef]
- Milan, G.; Dalla Nora, E.; Pilon, C.; Pagano, C.; Granzotto, M.; Manco, M.; Mingrone, G.; Vettor, R. Changes in muscle myostatin expression in obese subjects after weight loss. J. Clin. Endocrinol. Metab. 2004, 89, 2724–2727. [Google Scholar] [CrossRef] [PubMed]
- Moreno-Navarrete, J.M.; Ortega, F.; Serrano, M.; Guerra, E.; Pardo, G.; Tinahones, F.; Ricart, W.; Fernandez-Real, J.M. Irisin is expressed and produced by human muscle and adipose tissue in association with obesity and insulin resistance. J. Clin. Endocrinol. Metab. 2013, 98, 769–778. [Google Scholar] [CrossRef]
- Polyzos, S.A.; Kountouras, J.; Anastasilakis, A.D.; Geladari, E.V.; Mantzoros, C.S. Irisin in patients with nonalcoholic fatty liver disease. Metabolism 2014, 63, 207–217. [Google Scholar] [CrossRef]
- Osella, A.R.; Colaianni, G.; Correale, M.; Pesole, P.L.; Bruno, I.; Buongiorno, C.; Deflorio, V.; Leone, C.M.; Colucci, S.C.; Grano, M.; et al. Irisin Serum Levels in Metabolic Syndrome Patients Treated with Three Different Diets: A Post-Hoc Analysis from a Randomized Controlled Clinical Trial. Nutrients 2018, 10, 844. [Google Scholar] [CrossRef] [PubMed]
- Crujeiras, A.B.; Pardo, M.; Arturo, R.R.; Navas-Carretero, S.; Zulet, M.A.; Martinez, J.A.; Casanueva, F.F. Longitudinal variation of circulating irisin after an energy restriction-induced weight loss and following weight regain in obese men and women. Am. J. Hum. Biol. 2014, 26, 198–207. [Google Scholar] [CrossRef]
- Lu, C.; Li, Z.; Yang, J.; Feng, L.; Wang, C.; Shi, Q. Variations in Irisin, Bone Mineral Density, Bone Mineral Content, and Body Composition After Laparoscopic Bariatric Procedures in Obese Adults. J. Clin. Densitom. 2019. [Google Scholar] [CrossRef] [PubMed]
- Sajoux, I.; Lorenzo, P.M.; Gomez-Arbelaez, D.; Zulet, M.A.; Abete, I.; Castro, A.I.; Baltar, J.; Portillo, M.P.; Tinahones, F.J.; Martinez, J.A.; et al. Effect of a Very-Low-Calorie Ketogenic Diet on Circulating Myokine Levels Compared with the Effect of Bariatric Surgery or a Low-Calorie Diet in Patients with Obesity. Nutrients 2019, 11, 2368. [Google Scholar] [CrossRef] [PubMed]
- Jia, J.; Yu, F.; Wei, W.P.; Yang, P.; Zhang, R.; Sheng, Y.; Shi, Y.Q. Relationship between circulating irisin levels and overweight/obesity: A meta-analysis. World J. Clin. Cases 2019, 7, 1444–1455. [Google Scholar] [CrossRef] [PubMed]
- Albrecht, E.; Norheim, F.; Thiede, B.; Holen, T.; Ohashi, T.; Schering, L.; Lee, S.; Brenmoehl, J.; Thomas, S.; Drevon, C.A.; et al. Irisin—A myth rather than an exercise-inducible myokine. Sci. Rep. 2015, 5, 8889. [Google Scholar] [CrossRef] [PubMed]
- Chiu, C.S.; Peekhaus, N.; Weber, H.; Adamski, S.; Murray, E.M.; Zhang, H.Z.; Zhao, J.S.; Ernst, R.; Lineberger, J.; Huang, L.Y.; et al. Increased muscle force production and bone mineral density in ActRIIB-Fc-treated mature rodents. J. Gerontol. Ser. A Biomed. Sci. Med Sci. 2013, 68, 1181–1192. [Google Scholar] [CrossRef][Green Version]
- Tang, L.; Yang, X.F.; Gao, X.; Du, H.; Han, Y.; Zhang, D.; Wang, Z.; Sun, L. Inhibiting myostatin signaling prevents femoral trabecular bone loss and microarchitecture deterioration in diet-induced obese rats. Exp. Biol. Med. 2016, 241, 308–316. [Google Scholar] [CrossRef]
- Morissette, M.R.; Stricker, J.C.; Rosenberg, M.A.; Buranasombati, C.; Levitan, E.B.; Mittleman, M.A.; Rosenzweig, A. Effects of myostatin deletion in aging mice. Aging Cell 2009, 8, 573–583. [Google Scholar] [CrossRef]
- Ma, Y.; Li, X.; Zhang, H.; Ou, Y.; Zhang, Z.; Li, S.; Wu, F.; Sheng, Z.; Liao, E. Serum myostatin in central south Chinese postmenopausal women: Relationship with body composition, lipids and bone mineral density. Endocr. Res. 2016. [Google Scholar] [CrossRef]
- Moriwaki, K.; Matsumoto, H.; Tanishima, S.; Tanimura, C.; Osaki, M.; Nagashima, H.; Hagino, H. Association of serum bone- and muscle-derived factors with age, sex, body composition, and physical function in community-dwelling middle-aged and elderly adults: A cross-sectional study. BMC Musculoskelet Disord. 2019, 20, 276. [Google Scholar] [CrossRef] [PubMed]
- Wu, Y.; Qu, J.; Li, H.; Yuan, H.; Guo, Q.; Ouyang, Z.; Lu, Q. Relationship between serum level of growth differentiation factors 8, 11 and bone mineral density in girls with anorexia nervosa. Clin. Endocrinol. 2019, 90, 88–93. [Google Scholar] [CrossRef] [PubMed]
- Wu, L.F.; Zhu, D.C.; Wang, B.H.; Lu, Y.H.; He, P.; Zhang, Y.H.; Gao, H.Q.; Zhu, X.W.; Xia, W.; Zhu, H.; et al. Relative abundance of mature myostatin rather than total myostatin is negatively associated with bone mineral density in Chinese. J. Cell Mol. Med. 2018, 22, 1329–1336. [Google Scholar] [CrossRef] [PubMed]
- Kim, H.; Wrann, C.D.; Jedrychowski, M.; Vidoni, S.; Kitase, Y.; Nagano, K.; Zhou, C.; Chou, J.; Parkman, V.A.; Novick, S.J.; et al. Irisin Mediates Effects on Bone and Fat via alphaV Integrin Receptors. Cell 2018, 175, 1756–1768. [Google Scholar] [CrossRef]
- Zhou, K.; Qiao, X.; Cai, Y.; Li, A.; Shan, D. Lower circulating irisin in middle-aged and older adults with osteoporosis: A systematic review and meta-analysis. Menopause 2019, 26, 1302–1310. [Google Scholar] [CrossRef]
- Miyamoto-Mikami, E.; Sato, K.; Kurihara, T.; Hasegawa, N.; Fujie, S.; Fujita, S.; Sanada, K.; Hamaoka, T.; Tabata, I.; Iemitsu, M. Endurance training-induced increase in circulating irisin levels is associated with reduction of abdominal visceral fat in middle-aged and older adults. PLoS ONE 2015, 10, e0120354. [Google Scholar] [CrossRef]
- Huh, J.Y.; Panagiotou, G.; Mougios, V.; Brinkoetter, M.; Vamvini, M.T.; Schneider, B.E.; Mantzoros, C.S. FNDC5 and irisin in humans: I. Predictors of circulating concentrations in serum and plasma and II. mRNA expression and circulating concentrations in response to weight loss and exercise. Metabolism 2012, 61, 1725–1738. [Google Scholar] [CrossRef]
- Zugel, M.; Qiu, S.; Laszlo, R.; Bosnyak, E.; Weigt, C.; Muller, D.; Diel, P.; Steinacker, J.M.; Schumann, U. The role of sex, adiposity, and gonadectomy in the regulation of irisin secretion. Endocrine 2016, 54, 101–110. [Google Scholar] [CrossRef]
- Roca-Rivada, A.; Castelao, C.; Senin, L.L.; Landrove, M.O.; Baltar, J.; Belen Crujeiras, A.; Seoane, L.M.; Casanueva, F.F.; Pardo, M. FNDC5/irisin is not only a myokine but also an adipokine. PLoS ONE 2013, 8, e60563. [Google Scholar] [CrossRef]


| Variables | Controls | Obese Patients | Class I Obesity | Class II Obesity | Class III Obesity | p-Values for Comparisons between Obese Groups |
|---|---|---|---|---|---|---|
| Number | 40 | 139 | 47 | 45 | 47 | |
| Age, years | 45.6 ± 16.9 | 47.0 ±15.2 | 46.6 ± 15.7 | 46.6 ± 14.5 | 47.8 ± 15.5 | 0.912 |
| Weight, kg | 61.0 ± 7.8 | 101.2 ± 17.2 *** | 87.5 ± 8.2 a | 97.1 ± 10.8 b | 118.9 ± 13.5 c | <0.001 |
| Height, cm | 163.3 ± 6.0 | 162.1 ± 7.4 | 163.3 ± 7.2 | 161.0 ± 7.9 | 162.0 ± 7.2 | 0.344 |
| BMI, kg/m² | 22.8 ± 2.0 | 38.5 ± 5.9 *** | 32.7 ± 1.4 a | 37.3 ± 1.4 b | 45.3 ± 4.3 c | <0.001 |
| Body composition | ||||||
| Fat mass, kg | 19.2 ± 5.1 | 46.4 ± 11.1 *** | 36.8 ± 4.1 a | 44.6 ± 6.6 b | 57.9 ± 8.9 c | <0.001 |
| Fat mass, % | 30.8 ± 5.4 | 45.0 ± 4.6 *** | 41.5 ± 3.0 a | 45.1 ± 4.3 b | 48.3 ± 3.7 c | <0.001 |
| Lean body mass, kg | 40.4 ± 4.9 | 53.7 ± 9.4 *** | 49.7 ± 5.7 a | 51.0 ± 9.7 a | 58.2 ± 9.8 b | <0.001 |
| Bone mineral density | ||||||
| Whole body (g/cm²) | 1.056 ± 0.085 | 1.114 ± 0.100 *** | 1.101 ± 0.103 | 1.101 ± 0.085 | 1.140 ± 0.106 | 0.093 |
| Z-score whole body (SD) | −0.1 ± 0.9 | 0.8 ± 1.0 *** | 0.7 ± 1.1 | 0.7 ± 0.9 | 1.1 ± 0.9 | 0.100 |
| Hip (g/cm²) | 0.886 ± 0.115 | 1.028 ± 0.130 *** | 1.016 ± 0.142 | 1.004 ± 0.118 | 1.063 ± 0.123 | 0.069 |
| Z-score hip (SD) | −0.1 ± 0.9 | 1.0 ±1.0 *** | 0.9 ± 1.1 a,b | 0.8 ± 0.9 a | 1.4 ± 1.0 b | 0.022 |
| Lumbar spine (g/cm²) | 0.949 ± 0.132 | 1.051 ± 0.137 *** | 1.048 ± 0.146 | 1.044 ± 0.134 | 1.061 ± 0.132 | 0.816 |
| Z-score lumbar spine (SD) | −0.2 ± 1.1 | 0.9 ± 1.3 *** | 0.9 ± 1.3 | 0.7 ± 1.3 | 0.9 ± 1.3 | 0.690 |
| Radius (g/cm²) | 0.558 ± 0.052 | 0.584 ± 0.048 ** | 0.581 ± 0.048 | 0.591 ± 0.048 | 0.579 ± 0.048 | 0.417 |
| Z-score radius (SD) | 0.9 ± 1.4 | 1.3 ± 1.0 * | 1.3 ± 1.1 | 1.4 ± 1.0 | 1.2 ± 1.0 | 0.608 |
| Bone markers | ||||||
| Osteocalcin, ng/mL | 24.3 ± 7.9 | 10.3 ± 5.1 *** | 12.3 ± 6.4 a | 9.2 ± 3.8 b | 9.4 ± 4.2 b | 0.015 |
| sCTx, ng/ml | 0.39 ± 0.22 | 0.21 ± 0.23 *** | 0.26 ± 0.26 a | 0.19 ± 0.15 a,b | 0.18 ±0.24 b | 0.006 |
| Trap−5 | 2.7 ± 0.9 | 1.1 ± 0.5 *** | 1.2 ± 0.6 | 1.0 ± 0.3 | 1.2 ± 0.4 | 0.067 |
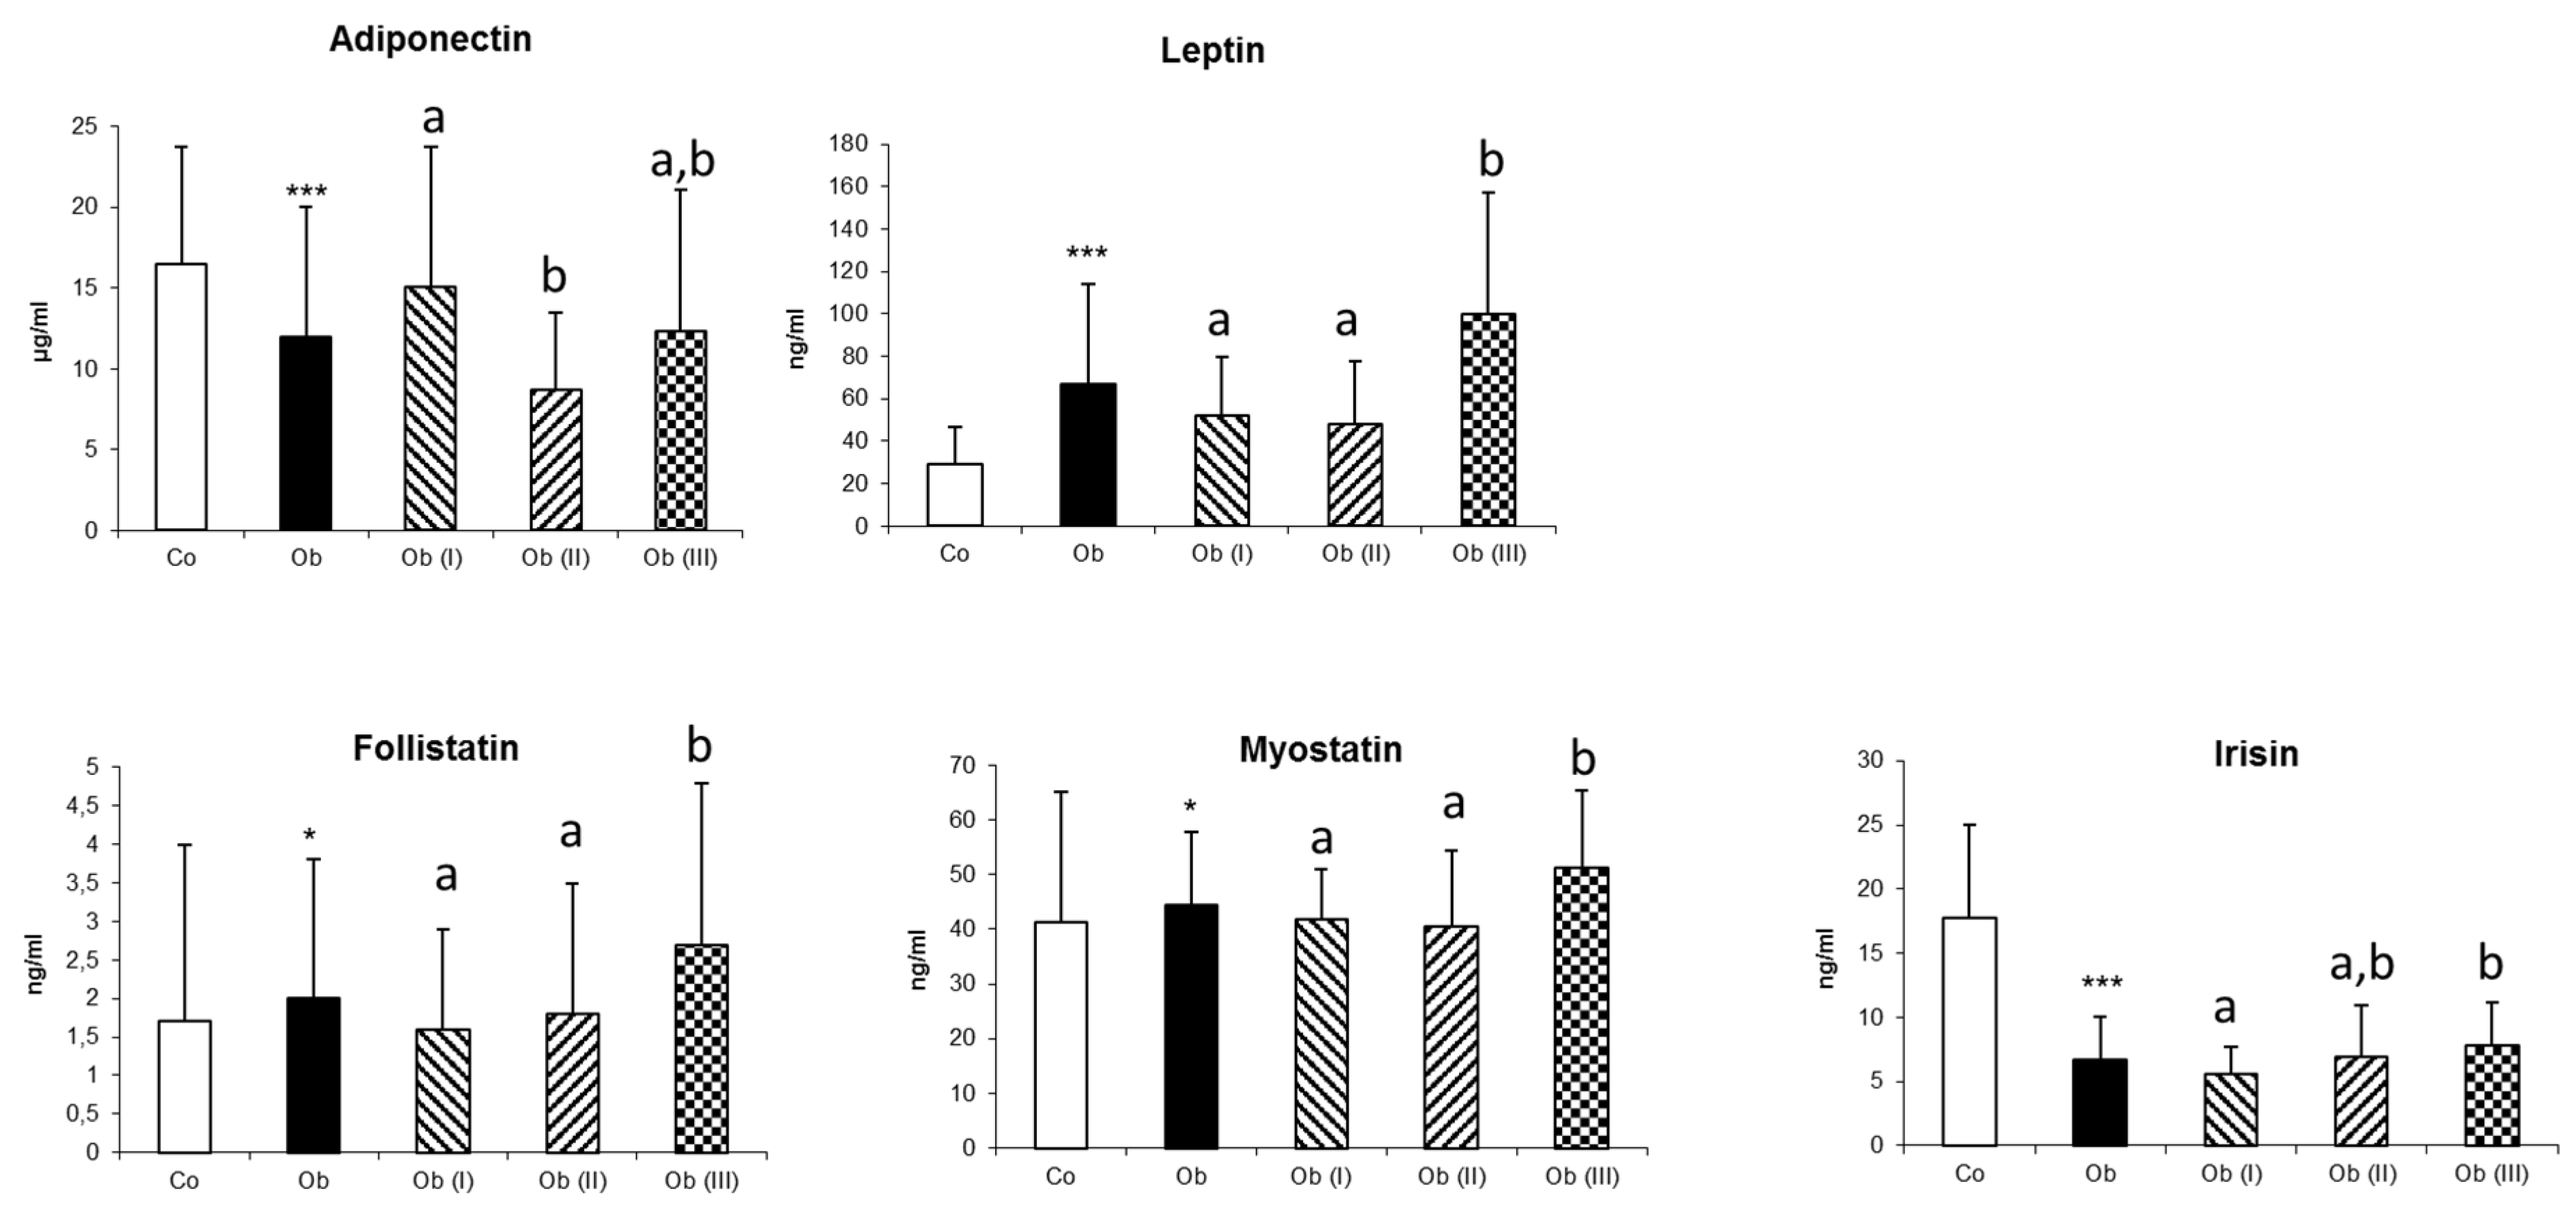
| Adipokines | ||||||
| Adiponectin | 16.5 ± 7.2 | 12.0 ± 8.0 *** | 15.1 ± 8.6 a | 8.7 ± 4.8 b | 12.3 ± 8.8 a,b | <0.001 |
| Leptin | 29.1 ± 17.4 | 67.1 ± 46.7 *** | 52.1 ± 27.6 a | 48.3 ± 29.3 a | 100.1 ± 57.1 b | <0.001 |
| Myokines | ||||||
| Myostatin | 41.2 ± 23.8 | 44.5 ± 13.4 * | 41.7 ± 9.4 a | 40.6 ± 13.8 a | 51.2 ± 14.2 b | <0.001 |
| Follistatin | 1.7 ± 2.3 | 2.0 ± 1.8 * | 1.6 ± 1.3 a | 1.8 ± 1.7 a | 2.7 ± 2.1 b | 0.007 |
| Irisin | 17.8 ± 7.2 | 6.7 ± 3.4 *** | 5.6 ± 2.1 a | 6.9 ± 4.0 a,b | 7.8 ± 3.4 b | 0.004 |
| Weight | BMI | FM | LBM | aBMD WB | aBMD LS | aBMD Hip | aBMD Radius | Myostatin | Log Irisin | Follistatin | |
|---|---|---|---|---|---|---|---|---|---|---|---|
| Weight | - | - | - | - | 0.393 *** | 0.345 *** | 0.529 *** | 0.282 ** | - | - | - |
| BMI | - | - | - | - | 0.345 *** | 0.307 *** | 0.483 *** | 0.219 ** | - | - | - |
| FM | - | - | - | - | 0.299 *** | 0.277 *** | 0.450 *** | 0.225 ** | - | - | - |
| LBM | - | - | - | - | 0.415 *** | 0.359 *** | 0.467 *** | 0.316 *** | - | - | - |
| OC | −0.540 *** | −0.607 *** | −0.550 *** | −0.376 *** | −0.329 *** | −0.266 *** | −0.431 *** | −0.285 *** | −0.049 | 0.321 *** | −0.172 * |
| Log sCTx | −0.340 *** | −0.411 *** | −0.347 *** | −0.181 * | −0.296 ** | −0.221 ** | −0.356 *** | −0.207 ** | −0.050 | 0.067 | −0.207 * |
| Trap−5 | −0.555 *** | −0.591 *** | −0.572 *** | −0.376 *** | −0.235 ** | −0.269 *** | −0.387 *** | −0.260 *** | −0.080 | 0.424 *** | −0.101 |
| Adiponectin | −0.240 ** | −0.260 *** | −0.202 ** | −0.211 ** | −0.292 *** | −0.215 ** | −0.266 *** | −0.162 * | −0.128 | 0.142 | 0.068 |
| Leptin | 0.524 *** | 0.547 *** | 0.573 *** | 0.341 *** | 0.198 * | 0.208 ** | 0.198 * | 0.155 * | 0.248 ** | −0.174 * | 0.150 |
| Myostatin | 0.226 ** | 0.194 ** | 0.210 ** | 0.191 * | 0.094 | 0.068 | 0.108 | 0.033 | - | −0.011 | 0.008 |
| Follistatin | 0.162 * | 0.192 * | 0.174 * | 0.053 | 0.037 | −0.076 | 0.009 | 0.031 | 0.008 | −0.004 | - |
| Log Irisin | −0.449 *** | −0.447 *** | −0.458 *** | −0.345 *** | −0.309 *** | −0.281 *** | −0.368 *** | −0.297 *** | −0.011 | - | −0.004 |
| WB aBMD | LS aBMD | Hip aBMD | Radius aBMD | |||||||||
|---|---|---|---|---|---|---|---|---|---|---|---|---|
| Effect | SEM | p-Value | Effect | SEM | p-Value | Effect | SEM | p-Value | Effect | SEM | p-Value | |
| Total effect for a 10-kg increase in LBM | 0.039 | 0.007 | <0.0001 | 0.049 | 0.012 | <0.0001 | 0.063 | 0.010 | <0.0001 | 0.014 | 0.004 | 0.0005 |
| Proportion of the total effect of LBM mediated by | % | STD | p-Value | % | STD | p-Value | % | STD | p-Value | % | STD | p-Value |
| Myostatin | 1.4 | 3.2 | 0.68 | 0.2 | 3.9 | 0.95 | 2.1 | 2.8 | 0.47 | −0.1 | 5.9 | 0.98 |
| Follistatin | −0.7 | 1.8 | 0.69 | −2.1 | 3.1 | 0.49 | −0.2 | 1.3 | 0.91 | 0.6 | 2.7 | 0.83 |
| Log Irisin | 14.8 | 7.6 | 0.05 | 17.8 | 9.3 | 0.06 | 15.8 | 6.3 | 0.01 | 29.8 | 15.2 | 0.05 |
© 2020 by the authors. Licensee MDPI, Basel, Switzerland. This article is an open access article distributed under the terms and conditions of the Creative Commons Attribution (CC BY) license (http://creativecommons.org/licenses/by/4.0/).
Share and Cite
Maïmoun, L.; Mura, T.; Attalin, V.; Dupuy, A.M.; Cristol, J.-P.; Avignon, A.; Mariano-Goulart, D.; Sultan, A. Modification of Muscle-Related Hormones in Women with Obesity: Potential Impact on Bone Metabolism. J. Clin. Med. 2020, 9, 1150. https://doi.org/10.3390/jcm9041150
Maïmoun L, Mura T, Attalin V, Dupuy AM, Cristol J-P, Avignon A, Mariano-Goulart D, Sultan A. Modification of Muscle-Related Hormones in Women with Obesity: Potential Impact on Bone Metabolism. Journal of Clinical Medicine. 2020; 9(4):1150. https://doi.org/10.3390/jcm9041150
Chicago/Turabian StyleMaïmoun, Laurent, Thibault Mura, Vincent Attalin, Anne Marie Dupuy, Jean-Paul Cristol, Antoine Avignon, Denis Mariano-Goulart, and Ariane Sultan. 2020. "Modification of Muscle-Related Hormones in Women with Obesity: Potential Impact on Bone Metabolism" Journal of Clinical Medicine 9, no. 4: 1150. https://doi.org/10.3390/jcm9041150
APA StyleMaïmoun, L., Mura, T., Attalin, V., Dupuy, A. M., Cristol, J.-P., Avignon, A., Mariano-Goulart, D., & Sultan, A. (2020). Modification of Muscle-Related Hormones in Women with Obesity: Potential Impact on Bone Metabolism. Journal of Clinical Medicine, 9(4), 1150. https://doi.org/10.3390/jcm9041150