Increased Mortality Burden in Young Asian Subjects with Dysglycemia and Comorbidities

 ,
,
Abstract
1. Introduction
2. Methods
2.1. NHIS Database and NHIS Health Checkup Data
2.2. Measurements
2.3. Study Design and Definition of Diseases
2.4. Statistical Analysis
3. Results
4. Discussion
Supplementary Materials
Author Contributions
Funding
Acknowledgments
Conflicts of Interest
References
- Available online: https://diabetesatlas.org (accessed on 25 July 2019).
- Kim, B.Y.; Won, J.C.; Lee, J.H.; Kim, H.S.; Park, J.H.; Ha, K.H.; Won, K.C.; Kim, D.J.; Park, K.S. Diabetes Fact Sheets in Korea, 2018: An Appraisal of Current Status. Diabetes. Metab. J. 2019, 43, 487–494. [Google Scholar] [CrossRef] [PubMed]
- Rhee, E.J. Diabetes in Asians. Endocrinol. Metab. (Seoul) 2015, 30, 263–269. [Google Scholar] [CrossRef] [PubMed]
- Zhang, Y.; Ning, G. Diabetes: Young-onset type 2 diabetes mellitus—A challenge for Asia. Nat. Rev. Endocrinol. 2014, 10, 703–704. [Google Scholar] [CrossRef] [PubMed]
- Available online: https://www.who.int/news-room/fact-sheets/detail/the-top-10-causes-of-death (accessed on 25 July 2019).
- American Diabetes Association. 2. Classification and Diagnosis of Diabetes: Standards of Medical Care in Diabetes-2019. Diabetes Care 2019, 42, S13–S28. [Google Scholar] [CrossRef]
- Huang, Y.; Cai, X.; Mai, W.; Li, M.; Hu, Y. Association between prediabetes and risk of cardiovascular disease and all cause mortality: Systematic review and meta-analysis. BMJ 2016, 355, i5953. [Google Scholar] [CrossRef]
- Ning, F.; Tuomilehto, J.; Pyörälä, K.; Onat, A.; Söderberg, S.; Qiao, Q.; DECODE Study Group. Cardiovascular disease mortality in Europeans in relation to fasting and 2 h plasma glucose levels within a normoglycemic range. Diabetes Care 2010, 33, 2211–2216. [Google Scholar] [CrossRef]
- Markus, M.R.P.; Ittermann, T.; Baumeister, S.E.; Huth, C.; Thorand, B.; Herder, C.; Roden, M.; Siewert-Markus, U.; Rathmann, W.; Koenig, W.; et al. Prediabetes is associated with microalbuminuria, reduced kidney function and chronic kidney disease in the general population: The KORA (Cooperative Health Research in the Augsburg Region) F4-Study. Nutr. Metab. Cardiovasc. Dis. 2018, 28, 234–242. [Google Scholar] [CrossRef]
- Rhee, E.J.; Park, S.E.; Chang, Y.; Ryu, S.; Lee, W.Y. Baseline glycemic status and mortality in 241,499 Korean metropolitan subjects: A Kangbuk Samsung Health Study. Metabolism 2016, 65, 68–77. [Google Scholar] [CrossRef]
- Diabetes Control and Complications Trial Research Group; Nathan, D.M.; Genuth, S.; Lachin, J.; Cleary, P.; Crofford, O.; Davis, M.; Rand, L.; Siebert, C. The effect of intensive treatment of diabetes on the development and progression of long-term complications in insulin-dependent diabetes mellitus. N. Engl. J. Med. 1993, 329, 977–986. [Google Scholar] [CrossRef]
- UK Prospective Diabetes Study (UKPDS) Group. Effect of intensive blood-glucose control with metformin on complications in overweight patients with type 2 diabetes (UKPDS 34). Lancet 1998, 352, 854–865. [Google Scholar] [CrossRef]
- Rawshani, A.; Rawshani, A.; Franzén, S.; Sattar, N.; Eliasson, B.; Svensson, A.M.; Zethelius, B.; Miftaraj, M.; McGuire, D.K.; Rosengren, A.; et al. Risk Factors, Mortality, and Cardiovascular Outcomes in Patients with Type 2 Diabetes. N. Engl. J. Med. 2018, 379, 633–644. [Google Scholar] [CrossRef] [PubMed]
- Sattar, N.; Rawshani, A.; Franzén, S.; Rawshani, A.; Svensson, A.M.; Rosengren, A.; McGuire, D.K.; Eliasson, B.; Gudbjörnsdottir, S. Age at Diagnosis of Type 2 Diabetes Mellitus and Associations With Cardiovascular and Mortality Risks. Circulation 2019, 139, 2228–2237. [Google Scholar] [CrossRef] [PubMed]
- Song, S.O.; Jung, C.H.; Song, Y.D.; Park, C.Y.; Kwon, H.S.; Cha, B.S.; Park, J.Y.; Lee, K.U.; KO, K.S.; Lee, B.W.; et al. Background and data configuration process of a nationwide population-based study using the korean national health insurance system. Diabetes. Metab. J. 2014, 38, 395–403. [Google Scholar] [CrossRef] [PubMed]
- Levey, A.S.; Bosch, J.P.; Lewis, J.B.; Greene, T.; Rogers, N.; Roth, D. A more accurate method to estimate glomerular filtration rate from serum creatinine: A new prediction equation. Modification of Diet in Renal Disease Study Group. Ann. Intern. Med. 1999, 130, 461–470. [Google Scholar] [CrossRef] [PubMed]
- Seo, M.H.; Lee, W.Y.; Kim, S.S.; Kang, J.H.; Kang, J.H.; Kim, K.K.; Kim, B.Y.; Kim, Y.H.; Kim, W.J.; Kim, E.M.; et al. 2018 Korean Society for the Study of Obesity Guideline for the Management of Obesity in Korea. J. Obes. Metab. Syndr. 2019, 28, 40–45. [Google Scholar] [CrossRef] [PubMed]
- Available online: http://kosis.kr (accessed on 1 August 2019).
- Yang, J.J.; Yu, D.; Wen, W.; Saito, E.; Rahman, S.; Shu, X.O.; Chen, Y.; Gupta, P.C.; Gu, D.; Tsugane, S.; et al. Association of Diabetes with All-Cause and Cause-Specific Mortality in Asia: A Pooled Analysis of More Than 1 Million Participants. JAMA Netw. Open 2019, 2, e192696. [Google Scholar] [CrossRef] [PubMed]
- Gaede, P.; Vedel, P.; Larsen, N.; Jensen, G.V.; Parving, H.H.; Pedersen, O. Multifactorial intervention and cardiovascular disease in patients with type 2 diabetes. N. Engl. J. Med. 2003, 348, 383–393. [Google Scholar] [CrossRef]
- Emerging Risk Factors Collaboration; Di Angelantonio, E.; Kaptoge, S.; Wormser, D.; Willeit, P.; Butterworth, A.S.; Bansal, N.; O’Keeffe, L.M.; Gao, P.; Wood, A.M.; et al. Association of Cardiometabolic Multimorbidity With Mortality. JAMA 2015, 314, 52–60. [Google Scholar]
- Home, P. Cardiovascular outcome trials of glucose-lowering medications: An update. Diabetologia 2019, 62, 357–369. [Google Scholar] [CrossRef]
- Wright, A.K.; Kontopantelis, E.; Emsley, R.; Buchan, I.; Mamas, M.A.; Sattar, N.; Rutter, M.K.; Ashcroft, D.M. Life Expectancy and Cause-Specific Mortality in Type 2 Diabetes: A Population-Based Cohort Study Quantifying Relationships in Ethnic Subgroups. Diabetes Care 2017, 40, 338–435. [Google Scholar] [CrossRef]
- Lin, C.C.; Li, C.I.; Liu, C.S.; Lin, W.Y.; Lin, C.H.; Chiang, J.I.; Yang, S.Y.; Li, T.C. Obesity paradox in associations between body mass index and diabetes-related hospitalization and mortality in patients with type 2 diabetes: Retrospective cohort studies. Diabetes Metab. 2019, 45, 564–572. [Google Scholar] [CrossRef] [PubMed]
- Jung, H.H.; Park, J.I.; Jeong, J.S. Incidence of diabetes and its mortality according to body mass index in South Koreans aged 40–79 years. Clin. Epidemiol. 2017, 9, 667–678. [Google Scholar] [CrossRef] [PubMed][Green Version]
- Brown, J.C.; Harhay, M.O.; Harhay, M.N. Sarcopenia and mortality among a population-based sample of community-dwelling older adults. J Cachexia Sarcopenia Muscle 2016, 7, 290–298. [Google Scholar] [CrossRef] [PubMed]
- Carnethon, M.R.; De Chavez, P.J.; Biggs, M.L.; Lewis, C.E.; Pankow, J.S.; Bertoni, A.G.; Golden, S.H.; Liu, K.; Mukamal, K.J.; Jenkins, B.C.; et al. Association of weight status with mortality in adults with incident diabetes. JAMA 2012, 308, 581–590. [Google Scholar] [CrossRef] [PubMed]
- Perry, J.R.; Voight, B.F.; Yengo, L.; Amin, N.; Dupuis, J.; Ganser, M.; Grallert, H.; Navarro, P.; Li, M.; Qi, L.; et al. Stratifying type 2 diabetes cases by BMI identifies genetic risk variants in LAMA1 and enrichment for risk variants in lean compared to obese cases. PLoS Genet. 2012, 8, e1002741. [Google Scholar] [CrossRef] [PubMed]
- Wing, R.R.; Lang, W.; Wadden, T.A.; Safford, M.; Knowler, W.C.; Bertoni, A.G.; Hill, J.O.; Brancati, F.L.; Peters, A.; Look AHEAD Research Group; et al. Benefits of modest weight loss in improving cardiovascular risk factors in overweight and obese individuals with type 2 diabetes. Diabetes Care 2011, 34, 1481–1486. [Google Scholar] [CrossRef]


| No Diabetes (n = 5,617,468) | Diabetes (n = 712,901) | ||
|---|---|---|---|
| Age (years) | 46.9 ± 14.4 | 58.4 ± 11.7 | <0.0001 |
| Sex: men (%) | 3,144,640(56.0) | 427,084(59.9) | <0.0001 |
| Body weight (kg) | 64.1 ± 11.6 | 66.0 ± 11.4 | <0.0001 |
| Body mass index (kg/m2) | 23.7 ± 3.2 | 25.1 ± 3.3 | <0.0001 |
| Waist circumference (cm) | 80.2 ± 9.0 | 85.6 ± 8.4 | <0.0001 |
| Fasting blood glucose (mg/dL) | 92.9 ± 11.4 | 144.3 ± 45.8 | <0.0001 |
| Total cholesterol (mg/dL) | 194.9 ± 36.1 | 195.2 ± 41.3 | <0.0001 |
| Systolic blood pressure (mmHg) | 122.5 ± 14.9 | 129.2 ± 15.7 | <0.0001 |
| Diastolic blood pressure (mmHg) | 76.5 ± 9.9 | 78.9 ± 10.1 | <0.0001 |
| Obesity (BMI ≥ 25 kg/m2) (%) | 1,809,615(32.2) | 340,975(47.8) | <0.0001 |
| Dyslipidemia (%) | 1,000,705(17.8) | 305,720(42.9) | <0.0001 |
| Hypertension (%) | 1,532,538(27.28) | 434,475(60.94) | <0.0001 |
| Chronic kidney disease (%) | 354,747(6.3) | 91,858(12.9) | <0.0001 |
| Heart disease (%) | 156,214(2.8) | 41,191(5.8) | <0.0001 |
| Ischemic stroke (%) | 83,069(1.5) | 18,541(2.6) | <0.0001 |
| Current smoker (%) | 1,480,548(26.4) | 174,548(24.5) | <0.0001 |
| Heavy alcohol drinker (%) | 380,422(6.8) | 57,953(8.1) | <0.0001 |
| Regular exercise (%) | 2,902,134(51.7) | 348,223(48.9) | <0.0001 |
| Glycemic Status | Total Number | Number of Events | IR (Per 1000 Person Years) | Multivariate-Adjusted HR (95% CI) | |
|---|---|---|---|---|---|
| Model 1 | Model 2 | ||||
| Diabetes | |||||
| No | 5,617,468 | 157,328 | 0.384 | 1.000(reference) | 1000(reference) |
| Yes | 712,901 | 63,298 | 1.244 | 1.547(1.533,1.561) | 1.613(1.598,1.629) |
| Glycemic status | |||||
| No diabetes | 4,176,024 | 103,156 | 0.338 | 1.000(reference) | 1000(reference) |
| Impaired fasting glucose | 1,427,415 | 52,650 | 0.507 | 1.013(1.002,1.024) | 1.053(1.042,1.064) |
| Newly developed diabetes | 186,940 | 10,903 | 0.812 | 1.398(1.371,1.426) | 1.438(1.41,1.467) |
| Diabetes duration < 5 years | 260,228 | 21,608 | 1.157 | 1.467(1.446,1.489) | 1.594(1.57,1.618) |
| Diabetes duration ≥ 5 years | 279,762 | 32,309 | 1.635 | 1.691(1.670,1.712) | 1.774(1.752,1.797) |
| Men | |||||
| Diabetes | |||||
| No | 3,144,640 | 102,064 | 4.459 | 1.000(reference) | 1000(reference) |
| Yes | 427,084 | 41,608 | 13.764 | 1.529(1.513,1.548) | 1.605(1.585,1.623) |
| Glycemic status | |||||
| No diabetes | 2,238,583 | 65,487 | 4.012 | 1.000(reference) | 1000(reference) |
| Impaired fasting glucose | 898,198 | 35,626 | 5.474 | 0.996(0.983,1.009) | 1.044(1.031,1.058) |
| Newly developed diabetes | 132,313 | 7853 | 8.286 | 1.37(1.339,1.403) | 1.424(1.39,1.457) |
| Diabetes duration < 5 years | 149,612 | 14,442 | 13.589 | 1.492(1.465,1.519) | 1.633(1.603,1.663) |
| Diabetes duration ≥ 5 years | 153,018 | 20,264 | 18.982 | 1.63(1.604,1.656) | 1.731(1.703,1.759) |
| Women | |||||
| Diabetes | |||||
| No | 2,472,828 | 55,264 | 3.049 | 1.000(reference) | 1000(reference) |
| Yes | 285,817 | 21,690 | 10.503 | 1.567(1.543,1.592) | 1.629(1.603,1.656) |
| Glycemic status | |||||
| No diabetes | 1,937,441 | 37,669 | 2.651 | 1.000(reference) | 1000(reference) |
| Impaired fasting glucose | 529,217 | 17,024 | 4.398 | 1.031(1.013,1.05) | 1.061(1.042,1.081) |
| Newly developed diabetes | 54,627 | 3050 | 7.723 | 1.403(1.352,1.456) | 1.445(1.392,1.499) |
| Diabetes duration < 5 years | 110,616 | 7166 | 8.897 | 1.404(1.369,1.44) | 1.514(1.476,1.554) |
| Diabetes duration ≥ 5 years | 126,744 | 12,045 | 13.252 | 1.791(1.755,1.829) | 1.853(1.814,1.892) |
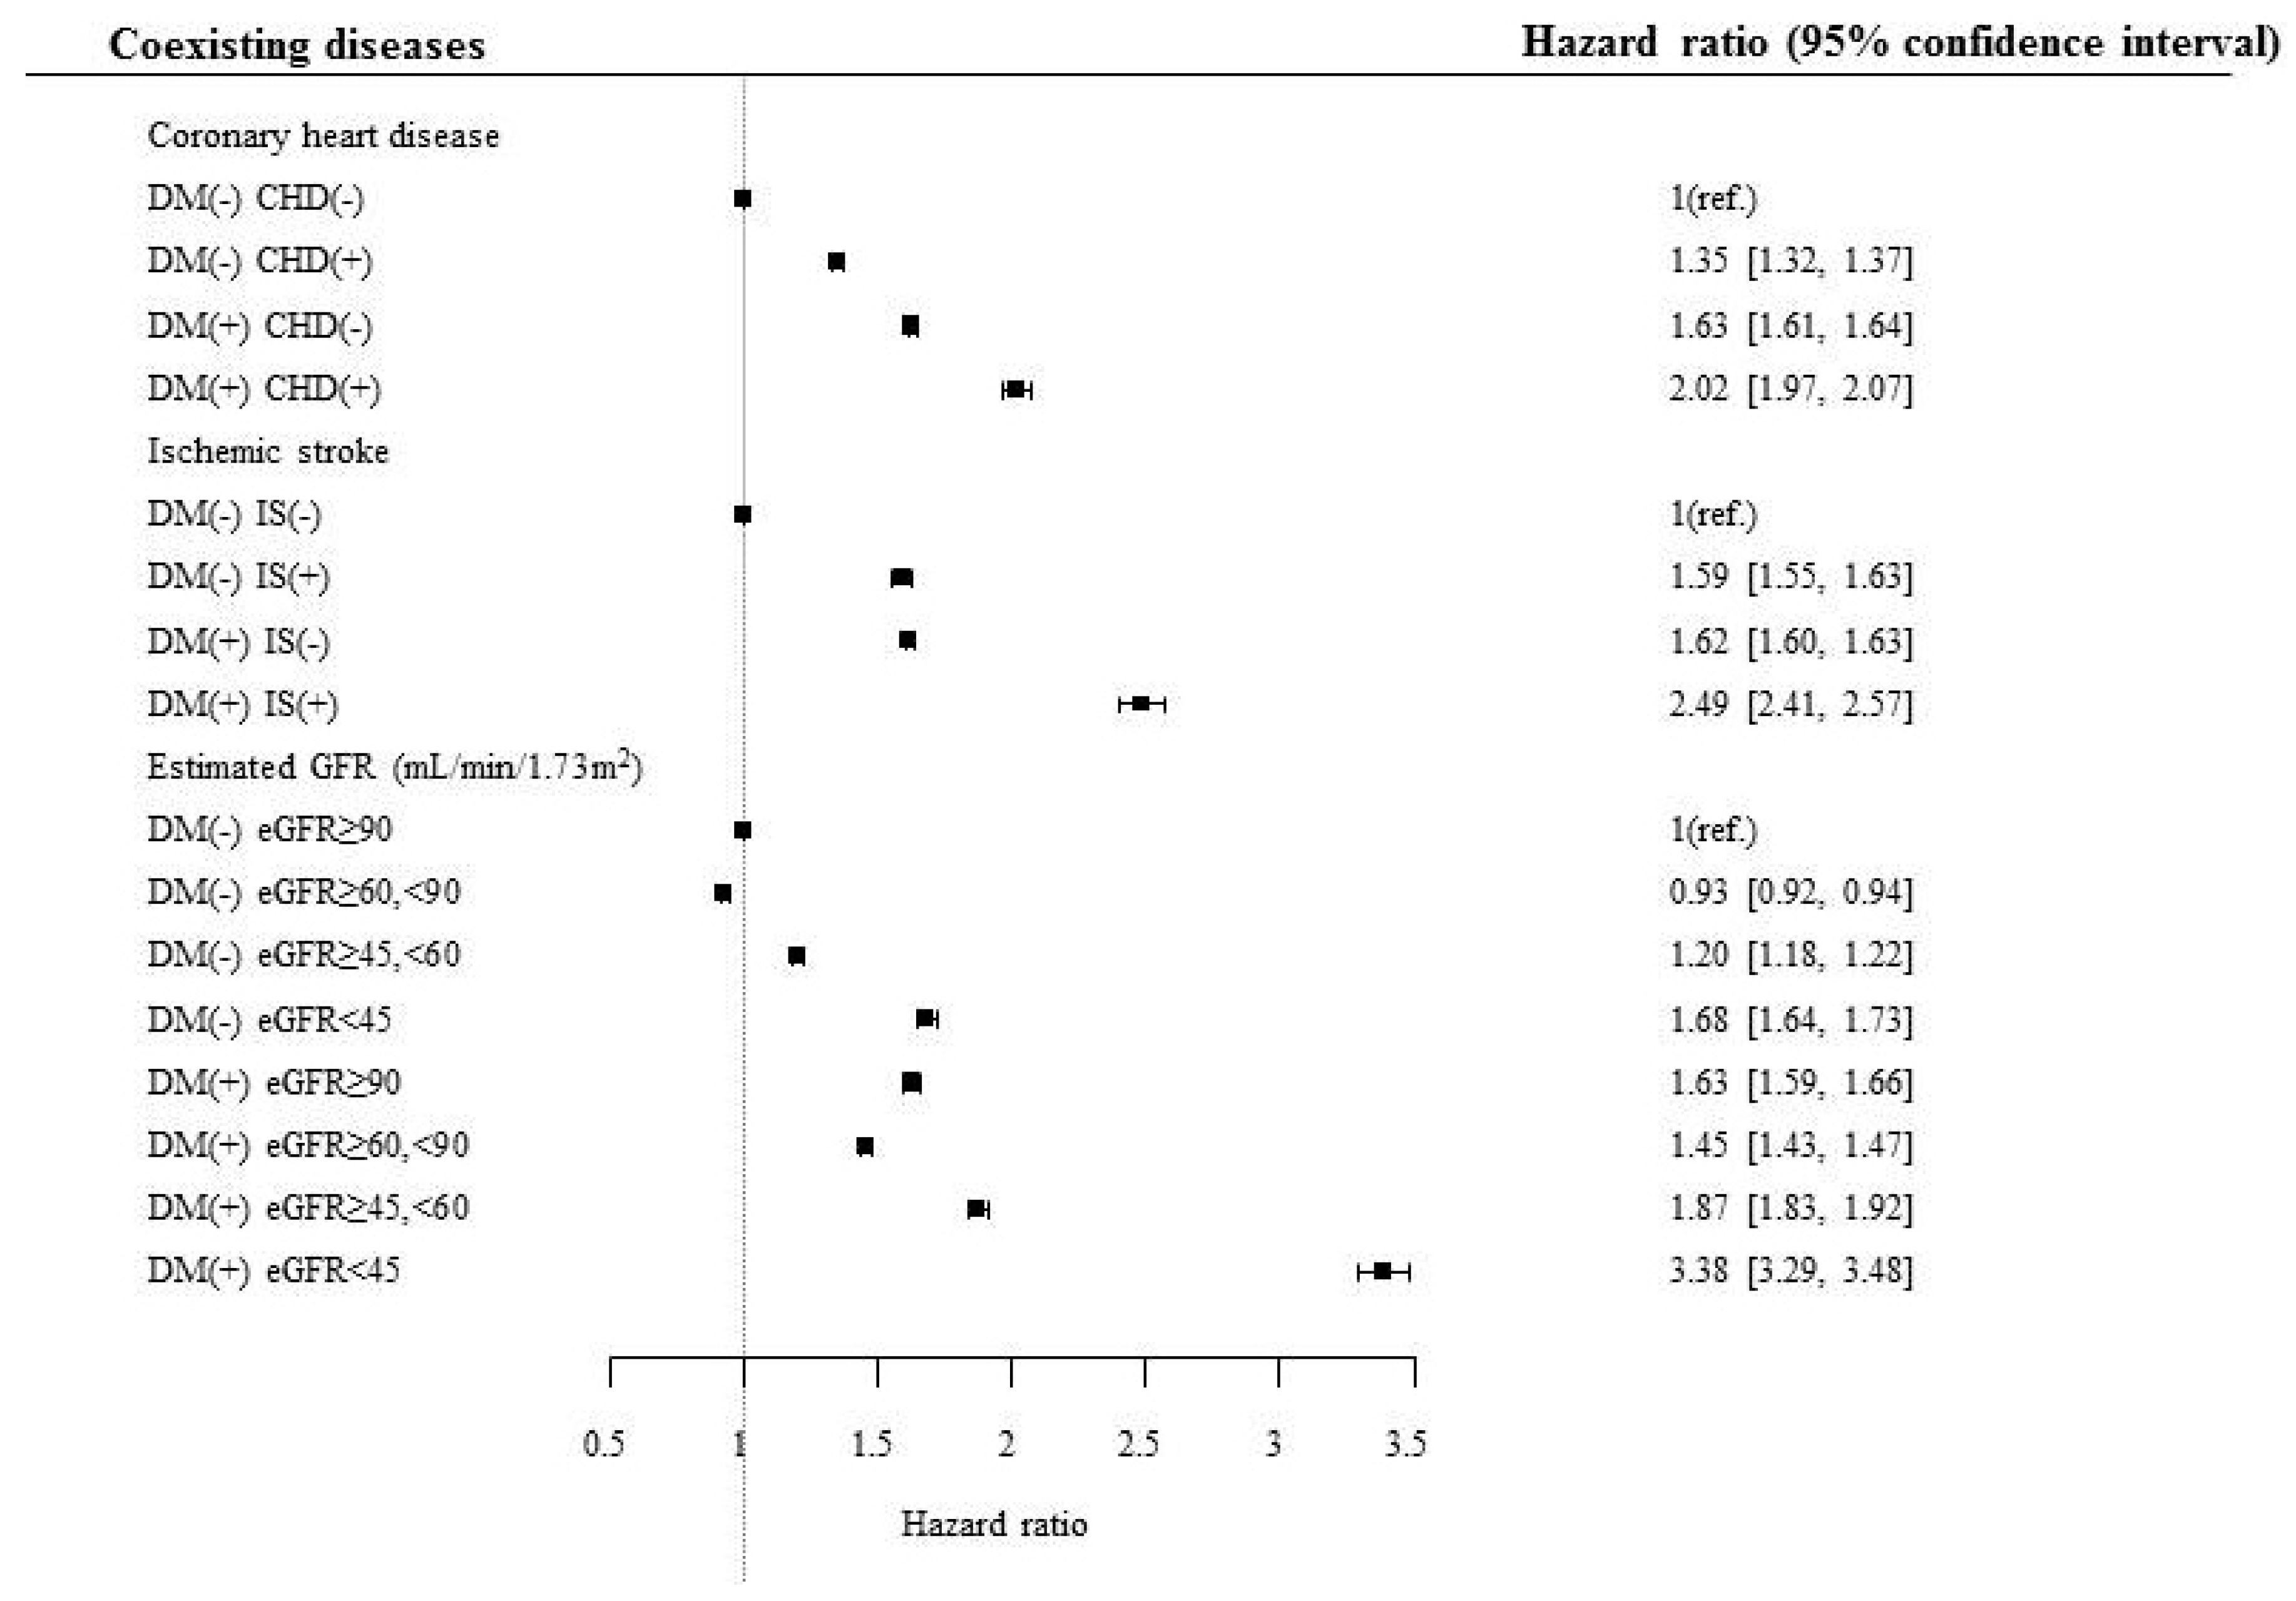
| Diabetes Status | Comorbidities | Total Number | Number of Events | IR (Per 1000 Person Years) | Multivariate-Adjusted HR (95% CI) | |
|---|---|---|---|---|---|---|
| Model 1 | Model 2 | |||||
| Coronary heart disease | ||||||
| No | No | 5,461,254 | 144,092 | 0.361 | 1.000(reference) | 1.000(reference) |
| Yes | 156,214 | 13,236 | 1.180 | 1.293(1.27,1.317) | 1.35(1.326,1.374) | |
| Yes | No | 671,710 | 57,031 | 1.188 | 1.552(1.537,1.568) | 1.417(1.397,1.437) |
| Yes | 41,191 | 6267 | 2.185 | 1.875(1.828,1.924) | 1.737(1.69,1.787) | |
| Ischemic stroke | ||||||
| No | No | 5,534,399 | 149,816 | 0.371 | 1.000(reference) | 1.000(reference) |
| Yes | 83,069 | 7512 | 1.266 | 1.582(1.546,1.619) | 1.592(1.556,1.63) | |
| Yes | No | 694,360 | 59,704 | 1.203 | 1.545(1.53,1.56) | 1.406(1.387,1.426) |
| Yes | 18,541 | 3594 | 2.847 | 2.402(2.324,2.483) | 2.144(2.07,2.221) | |
| Estimated glomerular filtration rate (mL/min/1.73 m2) | ||||||
| No | >90 | 2,117,700 | 41,705 | 0.269 | 1.000(reference) | 1.000(reference) |
| 60–90 | 3,145,021 | 89,280 | 0.389 | 0.877(0.867,0.887) | 0.928(0.917,0.939) | |
| 45–59 | 215,123 | 19,038 | 1.233 | 1.112(1.093,1.132) | 1.204(1.183,1.226) | |
| <45 | 139,624 | 7305 | 0.720 | 1.591(1.552,1.632) | 1.682(1.641,1.725) | |
| Yes | >90 | 229,022 | 14,473 | 0.878 | 1.52(1.492,1.549) | 1.432(1.402,1.463) |
| 60–90 | 392,021 | 32,351 | 1.152 | 1.296(1.277,1.315) | 1.274(1.252,1.297) | |
| 45–59 | 66,923 | 10,624 | 2.278 | 1.649(1.614,1.685) | 1.622(1.583,1.663) | |
| <45 | 24,935 | 5850 | 3.523 | 3.001(2.919,3.085) | 2.886(2.799,2.975) | |
| Smoking | ||||||
| No | No | 4,136,920 | 115,403 | 0.382 | 1.000(reference) | 1.000(reference) |
| Current | 1,480,548 | 41,925 | 0.389 | 1.672(1.652,1.692) | 1.545(1.526,1.564) | |
| Yes | No | 538,353 | 47,401 | 1.231 | 1.56(1.543,1.577) | 1.402(1.381,1.423) |
| Current | 174,548 | 15,897 | 1.286 | 2.522(2.479,2.565) | 2.157(2.115,2.2) | |
| Regular exercise | ||||||
| No | No | 2,715,334 | 99,493 | 0.504 | 1.000(reference) | 1.000(reference) |
| Yes | 2,902,134 | 57,835 | 0.272 | 0.756(0.749,0.764) | 0.786(0.777,0.794) | |
| Yes | No | 364,678 | 40,383 | 1.565 | 1.571(1.553,1.59) | 1.42(1.398,1.442) |
| Yes | 348,223 | 22,915 | 0.914 | 1.154(1.137,1.171) | 1.073(1.054,1.093) | |
| Abdominal obesity (Men: 90 cm/Women: 85 cm) | ||||||
| No | No | 4,121,743 | 105,470 | 0.351 | 1.000(reference) | 1.000(reference) |
| Yes | 1,495,725 | 51,858 | 0.475 | 0.862(0.853,0.871) | 1.197(1.182,1.213) | |
| Yes | No | 364,402 | 34,230 | 1.323 | 1.591(1.571,1.61) | 1.42(1.397,1.443) |
| Yes | 348,499 | 29,068 | 1.162 | 1.349(1.331,1.366) | 1.619(1.589,1.649) | |
| Body mass index (kg/m2) | ||||||
| No | <18.5 | 2,406,712 | 77,986 | 0.445 | 1.446(1.428,1.464) | 1.412(1.395–1.430) |
| 18.5–25 | 1,401,141 | 36,030 | 0.352 | 1.000(reference) | 1.000(reference) | |
| 25- | 1,809,615 | 43,312 | 0.327 | 0.965(0.952,0.979) | 0.957(0.943–0.970) | |
| Yes | <18.5 | 188,227 | 25,411 | 1.934 | 2.443(2.404,2.483) | 2.030(1.991–2.069) |
| 18.5–24.9 | 183,699 | 15,523 | 1.180 | 1.63(1.6,1.661) | 1.375(1.345–1.405) | |
| ≥25- | 340,975 | 22,364 | 0.909 | 1.495(1.47,1.52) | 1.262(1.237–1.286) | |
| Glycemic Status | Total Number | Number of Events | IR (Per 1000 Person Years) | Multivariate-Adjusted HR (95% CI) | |
|---|---|---|---|---|---|
| Model 1 | Model 2 | ||||
| 20–39 years | |||||
| Diabetes | |||||
| No | 1,877,765 | 6589 | 0.478 | 1.000(reference) | 1.000(reference) |
| Yes | 42,780 | 375 | 1.204 | 2.066(1.859,2.294) | 1.845(1.658,2.053) |
| Glycemic status | |||||
| No diabetes | 1,563,198 | 5296 | 0.461 | 1.000(reference) | 1.000(reference) |
| Impaired fasting glucose | 314,256 | 1291 | 0.562 | 1.063(1,1.13) | 1.03(0.968,1.096) |
| Newly developed diabetes | 29,237 | 232 | 1.089 | 1.923(1.685,2.194) | 1.735(1.518,1.983) |
| Diabetes duration < 5 years | 10,356 | 106 | 1.405 | 2.375(1.958,2.881) | 2.062(1.693,2.511) |
| Diabetes duration ≥ 5 years | 3498 | 39 | 1.538 | 2.596(1.894,3.56) | 2.249(1.637,3.088) |
| 40–64 years | |||||
| Diabetes | |||||
| No | 2,988,010 | 49,782 | 2.273 | 1.000(reference) | 1.000(reference) |
| Yes | 434,801 | 18,641 | 5.915 | 1.838(1.808,1.869) | 1.845(1.812,1.88) |
| Glycemic status | |||||
| No diabetes | 2,117,487 | 32,457 | 2.089 | 1.000(reference) | 1.000(reference) |
| Impaired fasting glucose | 862,911 | 17,010 | 2.696 | 1.063(1.044,1.084) | 1.09(1.069,1.11) |
| Newly developed diabetes | 121,376 | 3963 | 4.507 | 1.589(1.537,1.643) | 1.589(1.537,1.643) |
| Diabetes duration < 5 years | 164,923 | 6875 | 5.730 | 1.853(1.805,1.902) | 1.931(1.879,1.983) |
| Diabetes duration ≥ 5 years | 156,114 | 8118 | 7.197 | 2.1(2.049,2.153) | 2.104(2.051,2.158) |
| ≥65 years | |||||
| Diabetes | |||||
| No | 751,693 | 100,957 | 18.929 | 1.000(reference) | 1.000(reference) |
| Yes | 235,320 | 44,282 | 27.251 | 1.488(1.471,1.504) | 1.553(1.536,1.57) |
| Glycemic status | |||||
| No diabetes | 495,339 | 65,403 | 18.583 | 1.000(reference) | 1.000(reference) |
| Impaired fasting glucose | 250,248 | 34,349 | 19.381 | 1.004(0.991,1.017) | 1.043(1.029,1.057) |
| Newly developed diabetes | 36,327 | 6708 | 26.800 | 1.314(1.281,1.347) | 1.357(1.323,1.391) |
| Diabetes duration < 5 years | 84,949 | 14,627 | 24.668 | 1.382(1.357,1.407) | 1.499(1.472,1.527) |
| Diabetes duration ≥ 5 years | 120,150 | 24,152 | 29.333 | 1.635(1.611,1.659) | 1.716(1.69,1.742) |
© 2020 by the authors. Licensee MDPI, Basel, Switzerland. This article is an open access article distributed under the terms and conditions of the Creative Commons Attribution (CC BY) license (http://creativecommons.org/licenses/by/4.0/).
Share and Cite
Rhee, E.-J.; Jung, I.; Kwon, H.; Park, S.E.; Kim, Y.-H.; Han, K.-D.; Park, Y.-G.; Lee, W.-Y. Increased Mortality Burden in Young Asian Subjects with Dysglycemia and Comorbidities. J. Clin. Med. 2020, 9, 1042. https://doi.org/10.3390/jcm9041042
Rhee E-J, Jung I, Kwon H, Park SE, Kim Y-H, Han K-D, Park Y-G, Lee W-Y. Increased Mortality Burden in Young Asian Subjects with Dysglycemia and Comorbidities. Journal of Clinical Medicine. 2020; 9(4):1042. https://doi.org/10.3390/jcm9041042
Chicago/Turabian StyleRhee, Eun-Jung, Inha Jung, Hyemi Kwon, Se Eun Park, Yang-Hyun Kim, Kyung-Do Han, Yong-Gyu Park, and Won-Young Lee. 2020. "Increased Mortality Burden in Young Asian Subjects with Dysglycemia and Comorbidities" Journal of Clinical Medicine 9, no. 4: 1042. https://doi.org/10.3390/jcm9041042
APA StyleRhee, E.-J., Jung, I., Kwon, H., Park, S. E., Kim, Y.-H., Han, K.-D., Park, Y.-G., & Lee, W.-Y. (2020). Increased Mortality Burden in Young Asian Subjects with Dysglycemia and Comorbidities. Journal of Clinical Medicine, 9(4), 1042. https://doi.org/10.3390/jcm9041042