Quantification of Plasma and Urine Thymidine and 2’-Deoxyuridine by LC-MS/MS for the Pharmacodynamic Evaluation of Erythrocyte Encapsulated Thymidine Phosphorylase in Patients with Mitochondrial Neurogastrointestinal Encephalomyopathy
Abstract
1. Introduction
2. Materials and Methods
2.1. Reagents and Materials
2.2. Preparation of Calibrators, Quality Control (QC), and IS Solutions
2.2.1. Plasma Assay
2.2.2. Urine Assay
2.3. Sample Preparation
2.4. LC-MS/MS Instrumentation and Analytical Conditions
2.5. Method Validation
2.6. Clinical Application of Validated Plasma Assay
3. Results and Discussion
3.1. Optimization of LC–MS/MS Conditions
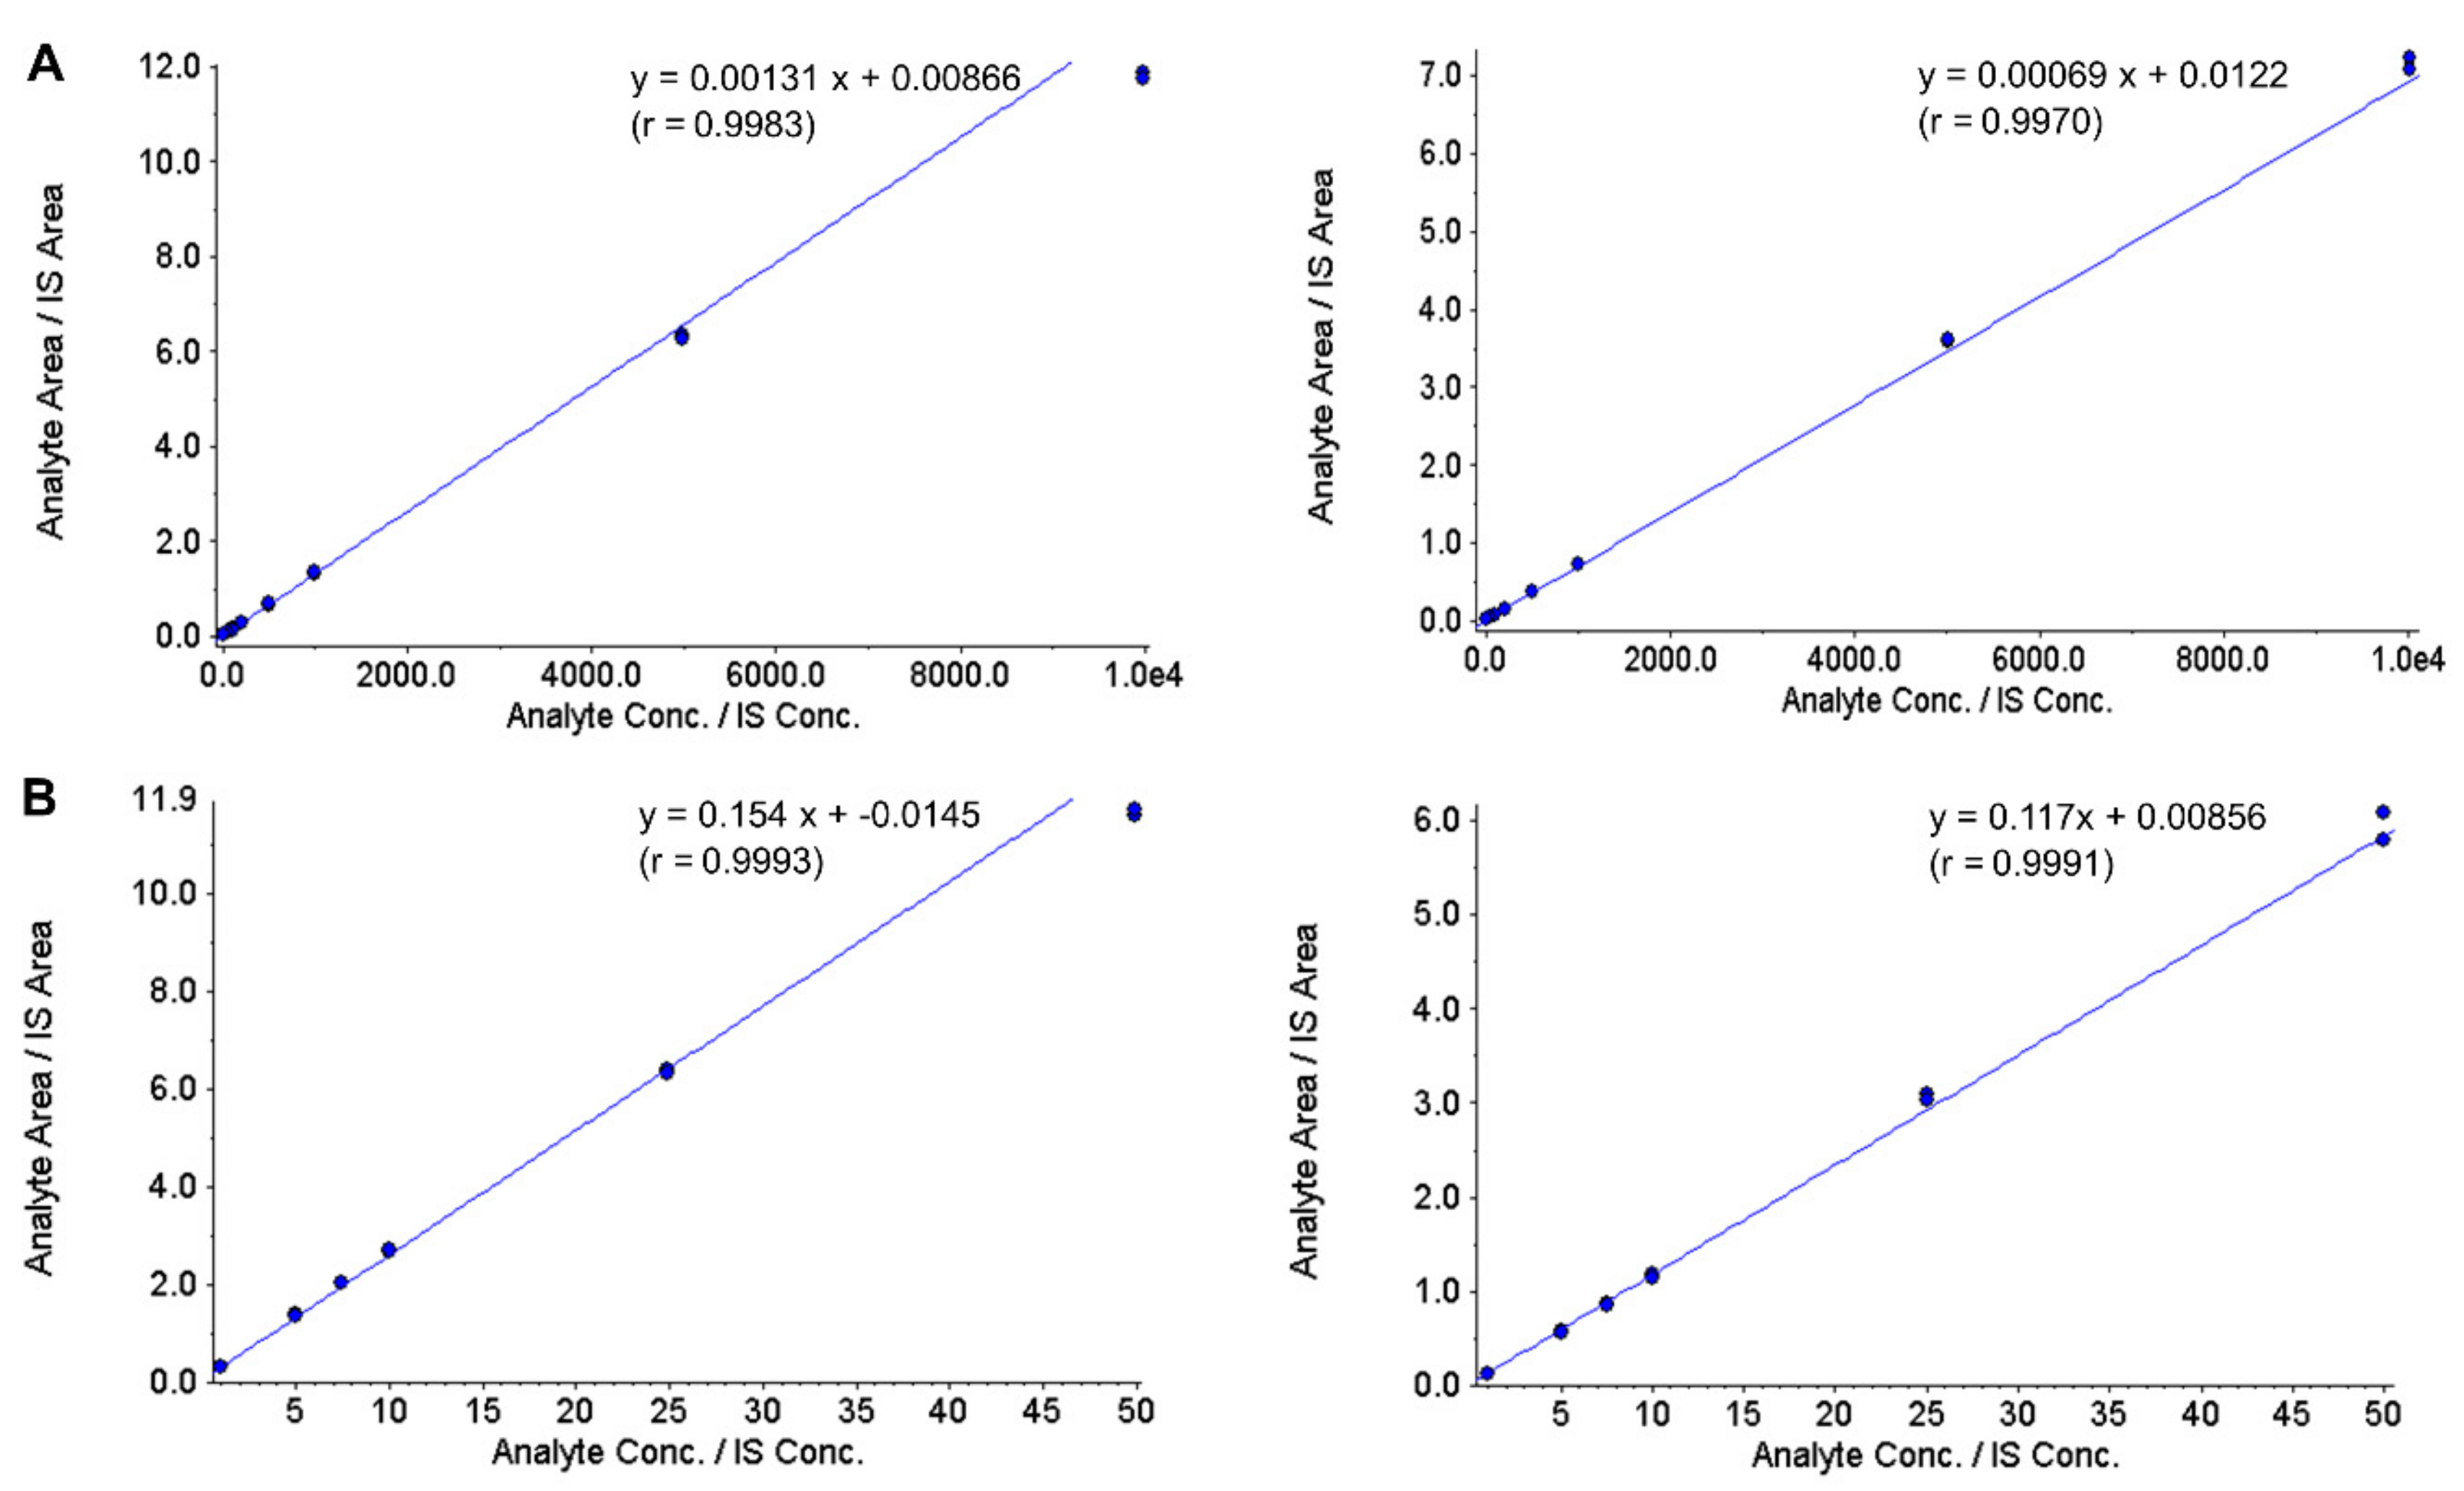
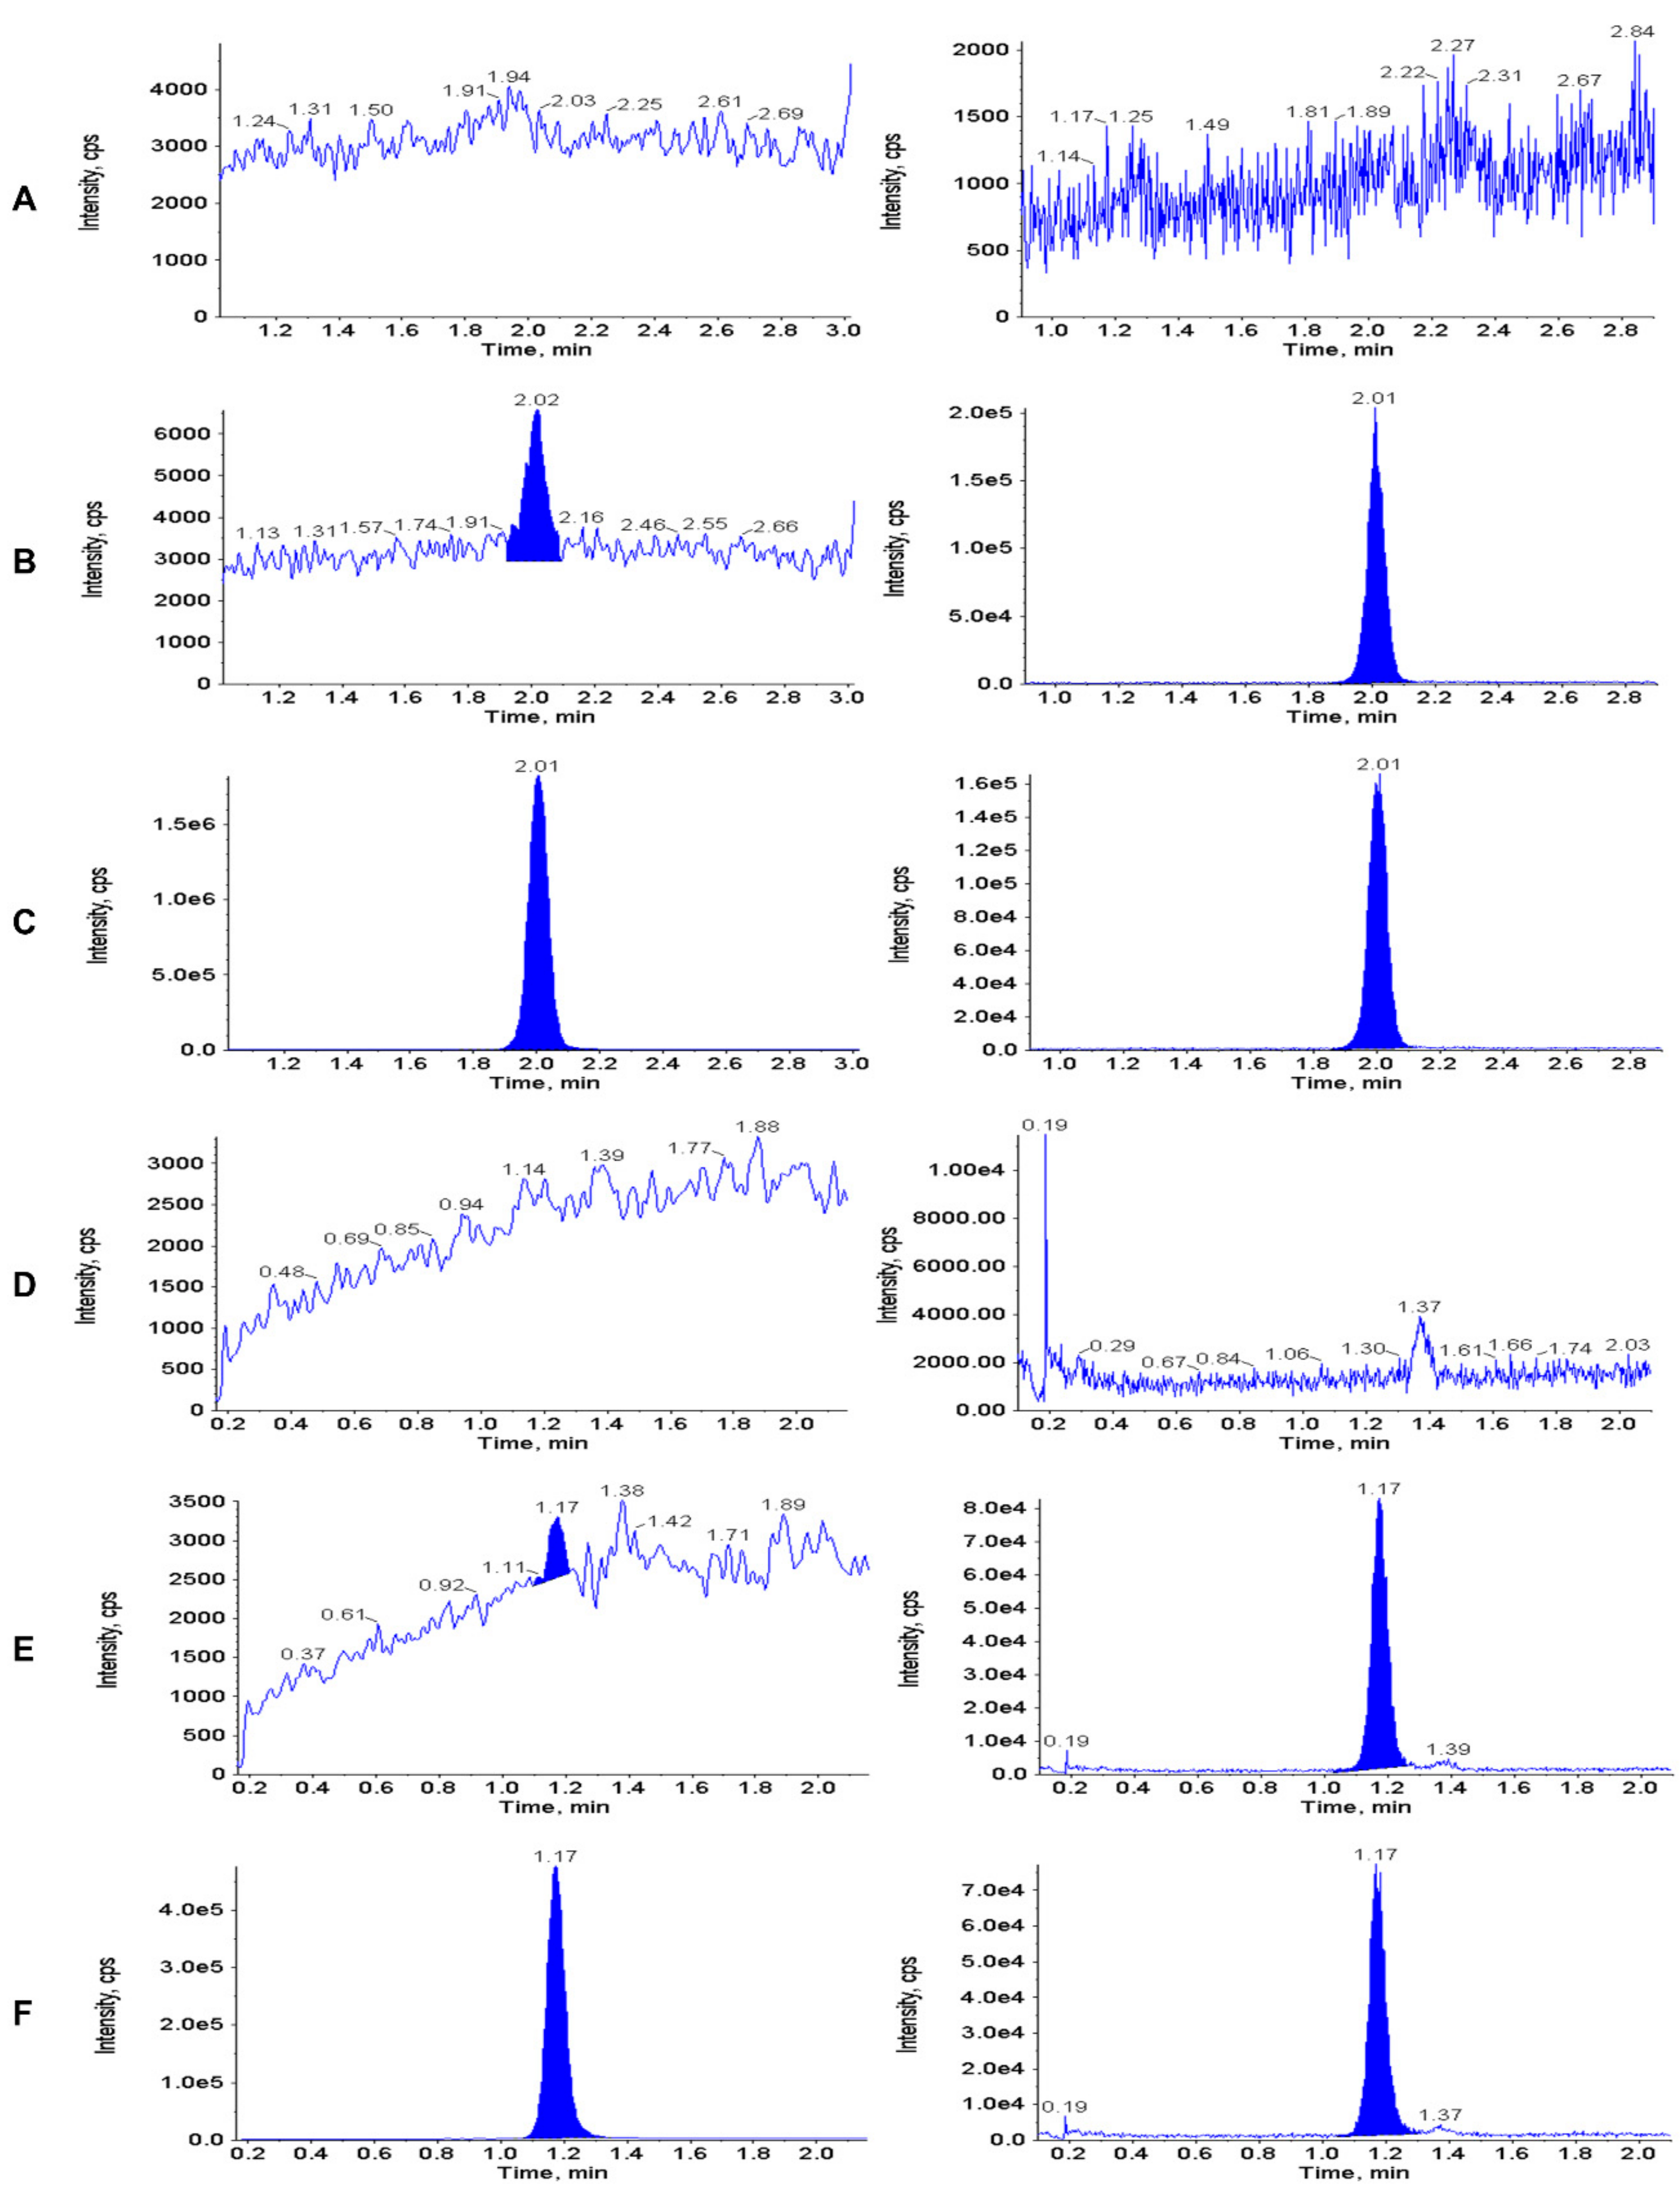
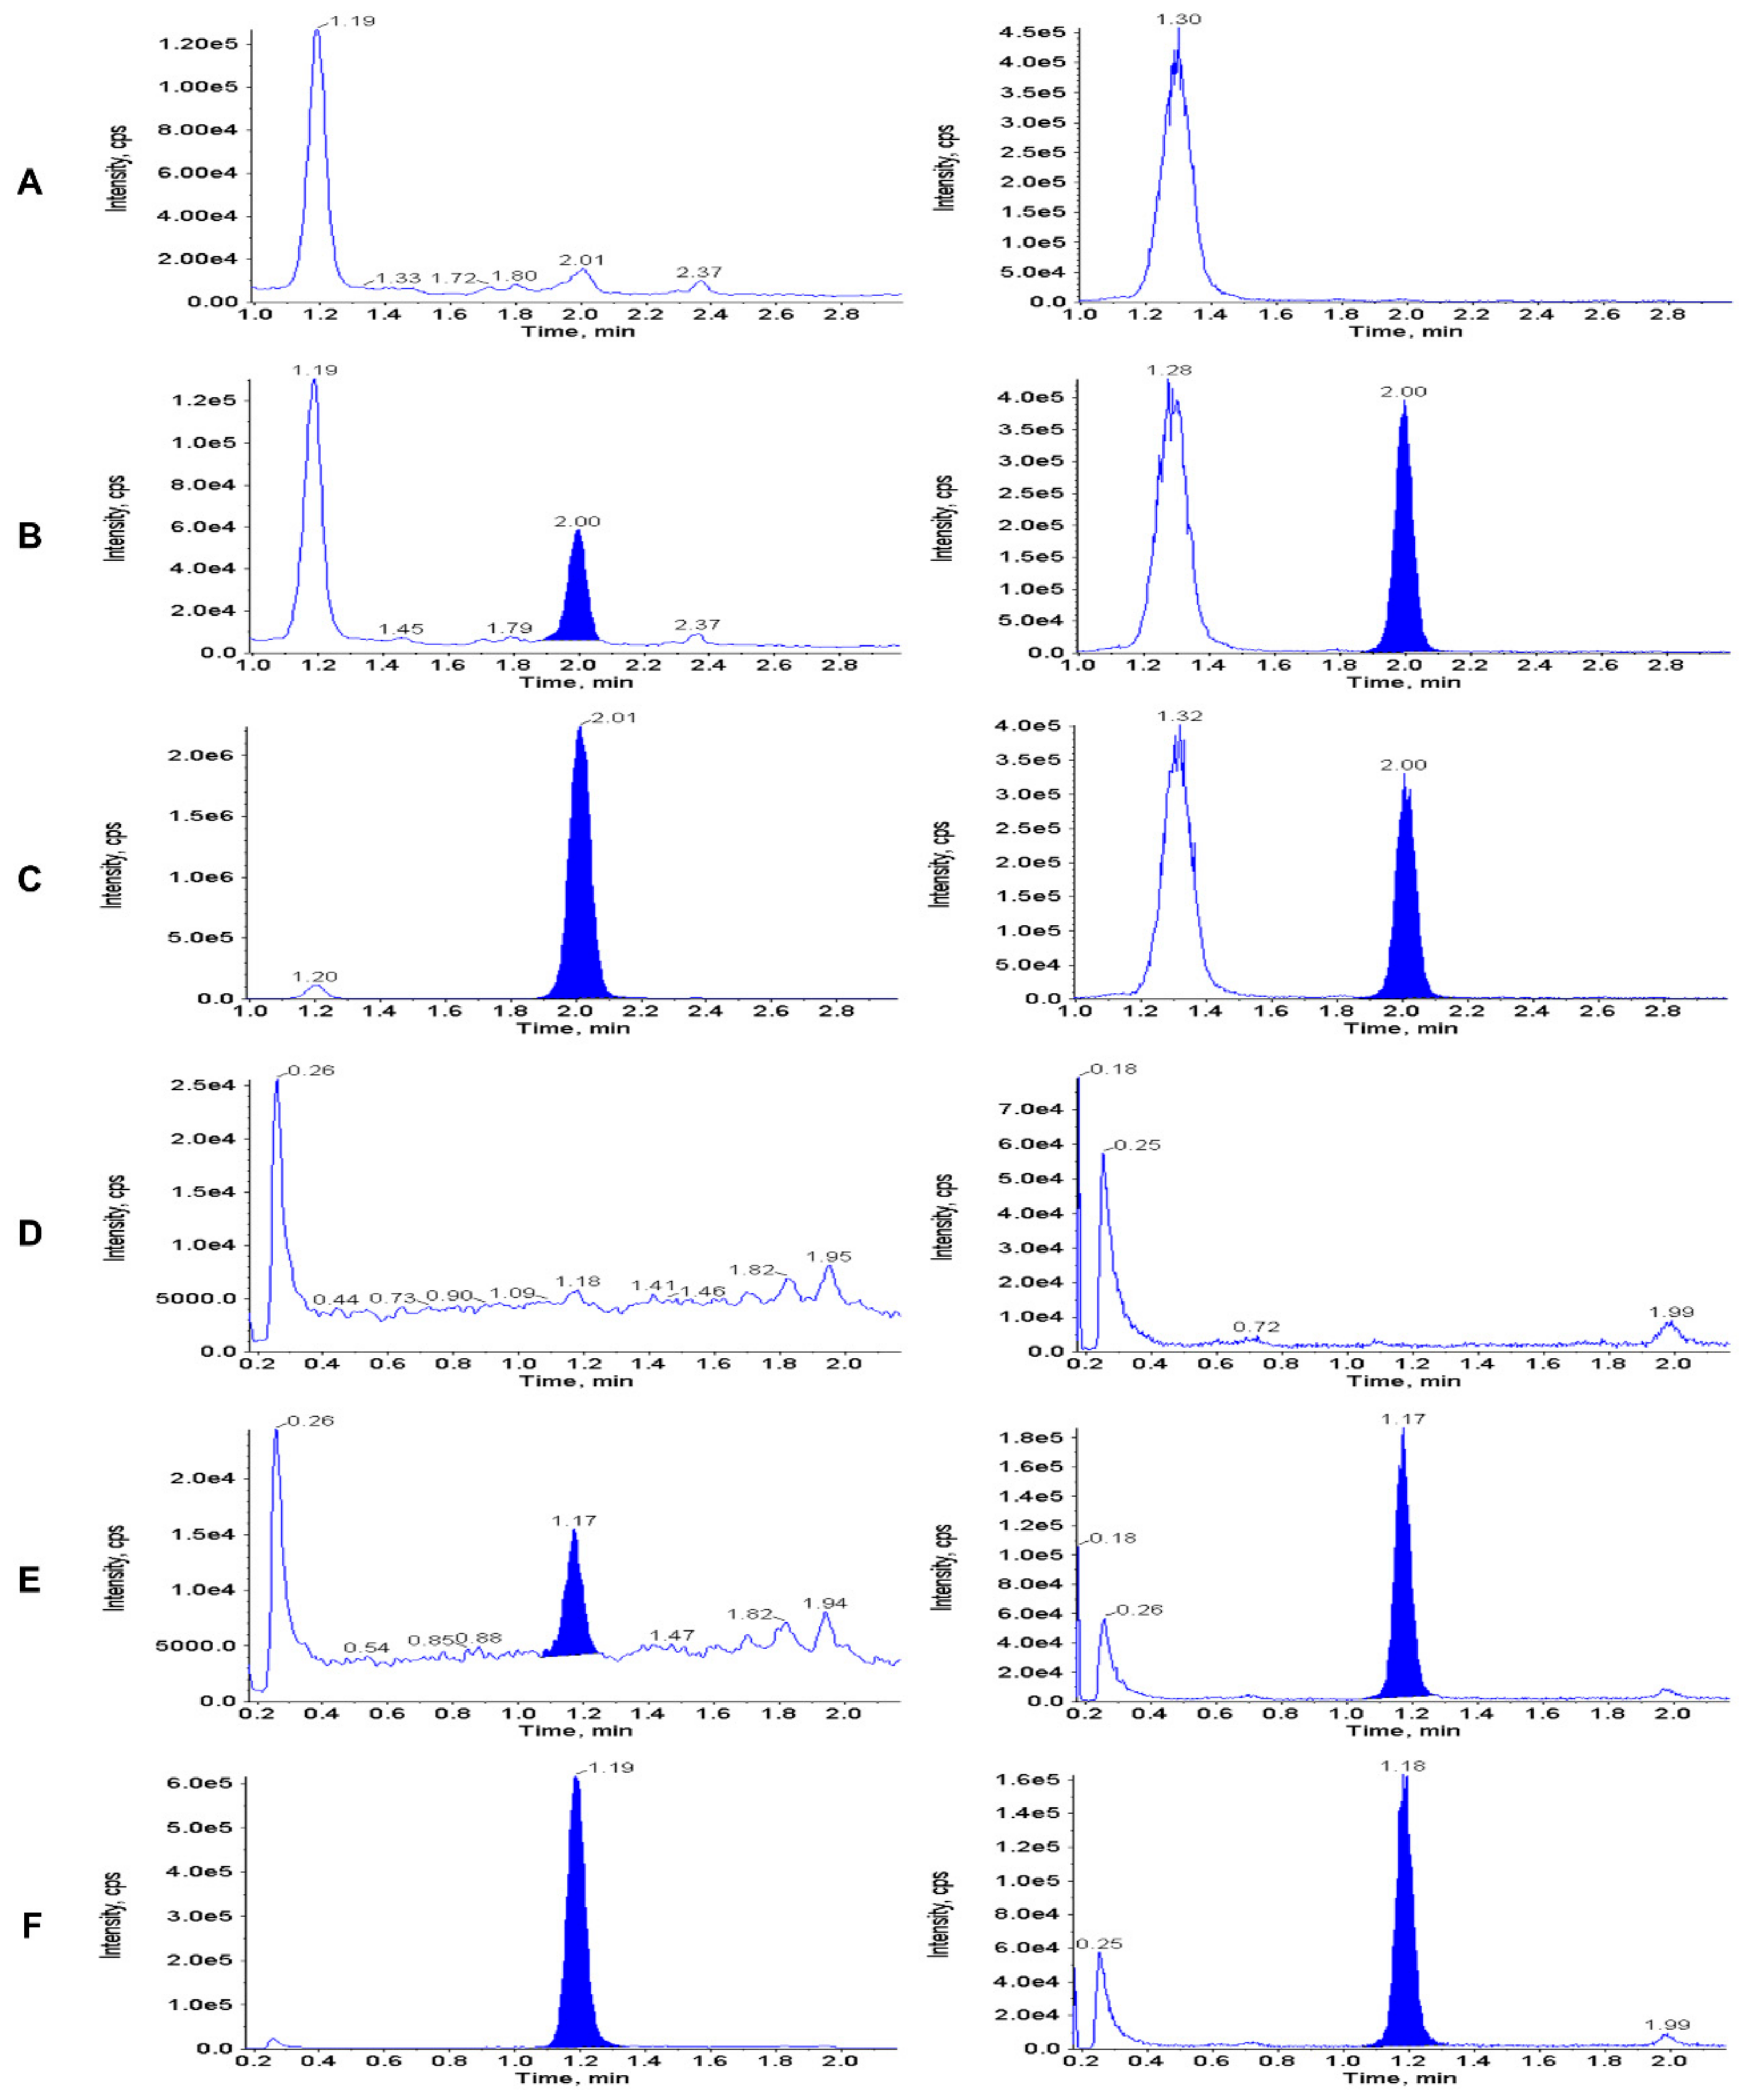
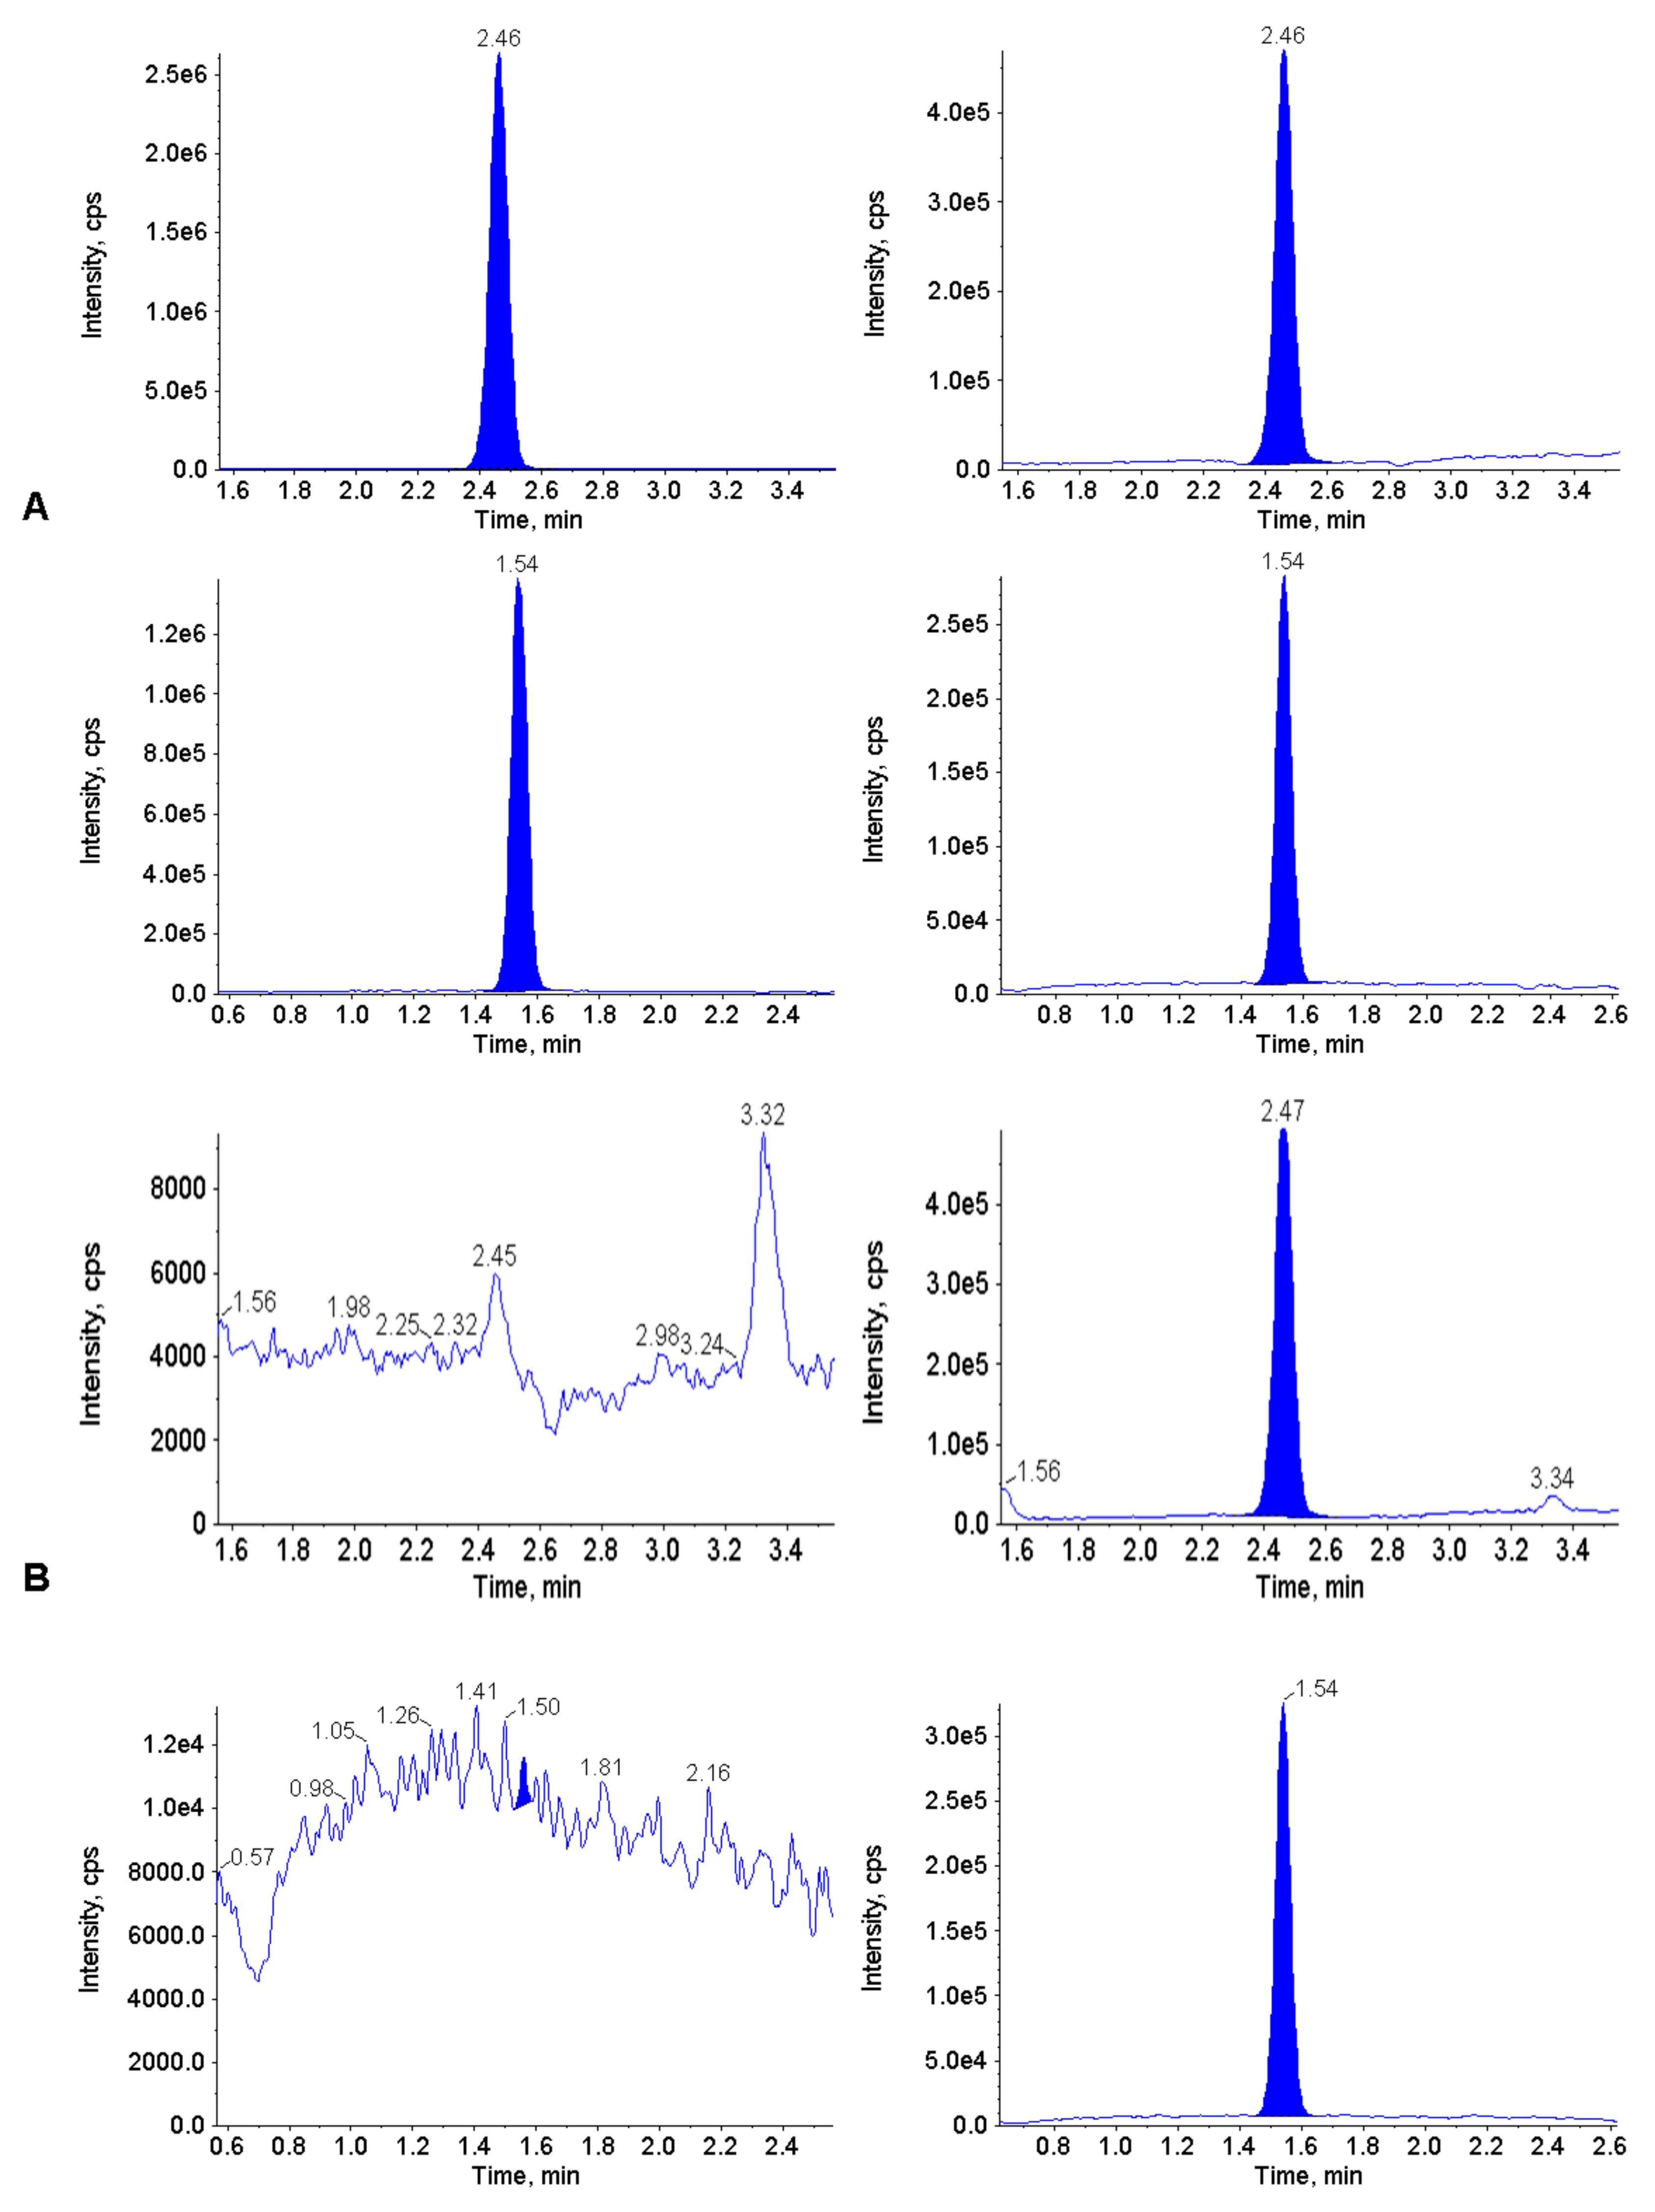
3.2. Calibration Curve, LLOQ and Selectivity
3.3. Accuracy and Precision
3.4. Recovery and Matrix Effect
3.5. Stability
3.6. Carry-Over
3.7. Clinical Application
4. Conclusions
Author Contributions
Funding
Acknowledgments
Conflicts of Interest
References
- Pacitti, D.; Levene, M.; Garone, C.; Nirmalananthan, N.; Bax, B. Mitochondrial Neurogastrointestinal Encephalomyopathy: Into the Fourth Decade, What We Have Learned So Far. Front. Genet. 2018, 9, 669. [Google Scholar] [CrossRef] [PubMed]
- Spinazzola, A.; Marti, R.; Nishino, I.; Andreu, A.L.; Naini, A.; Tadesse, S.; Pela, I.; Zammarchi, E.; Donati, M.A.; Oliver, J.A.; et al. Altered thymidine metabolism due to defects of thymidine phosphorylase. J. Boil. Chem. 2001, 277, 4128–4133. [Google Scholar] [CrossRef] [PubMed]
- Yavuz, H.; Özel, A.; Christensen, M.; Christensen, E.; Schwartz, M.; Elmaci, M.; Vissing, J. Treatment of mitochondrial neurogastrointestinal encephalomyopathy with dialysis. Arch. Neurol. 2007, 64, 435–438. [Google Scholar] [CrossRef] [PubMed]
- Levene, M.; Bain, M.D.; Moran, N.F.; Nirmalananthan, N.; Poulton, J.; Scarpelli, M.; Filosto, M.; Mandel, H.; MacKinnon, A.D.; Fairbanks, L.; et al. Safety and efficacy of erythrocyte encapsulated thymidine phosphorylase in mitochondrial neurogastrointestinal encephalomyopathy. J. Clin. Med. 2019, 8, 457. [Google Scholar] [CrossRef] [PubMed]
- De Giorgio, R.; Pironi, L.; Rinaldi, R.; Boschetti, E.; Caporali, L.; Capristo, M.; Casali, C.; Cenacchi, G.; Contin, M.; D’Angelo, R.; et al. Liver transplantation for mitochondrial neurogastrointestinal encephalomyopathy. Ann. Neurol. 2016, 80, 448–455. [Google Scholar] [CrossRef]
- La Marca, G.; Malvagia, S.; Casetta, B.; Pasquini, E.; Pela, I.; Hirano, M.; Donati, M.A.; Zammarchi, E. Pre- and post-dialysis quantitative dosage of thymidine in urine and plasma of a MNGIE patient by using HPLC-ESI-MS/MS. J. Mass Spectrom. 2006, 41, 586–592. [Google Scholar] [CrossRef]
- Lara, M.C.; Weiss, B.; Illa, I.; Madoz, P.; Massuet, L.; Andreu, A.L.; Valentino, M.L.; Anikster, Y.; Hirano, M.; Marti, R. Infusion of platelets transiently reduces nucleoside overload in MNGIE. Neurol. 2006, 67, 1461–1463. [Google Scholar] [CrossRef]
- Halter, J.; Schüpbach, W.M.M.; Casali, C.; Elhasid, R.; Fay, K.; Hammans, S.; Illa, I.; Kappeler, L.; Krähenbühl, S.; Lehmann, T.; et al. Allogeneic hematopoietic SCT as treatment option for patients with mitochondrial neurogastrointestinal encephalomyopathy (MNGIE): A consensus conference proposal for a standardized approach. Bone Marrow Transplant. 2010, 46, 330–337. [Google Scholar] [CrossRef]
- Filosto, M.; Scarpelli, M.; Tonin, P.; Lucchini, G.; Pavan, F.; Santus, F.; Parini, R.; Donati, M.A.; Cotelli, M.S.; Vielmi, V.; et al. Course and management of allogeneic stem cell transplantation in patients with mitochondrial neurogastrointestinal encephalomyopathy. J. Neurol. 2012, 259, 2699–2706. [Google Scholar] [CrossRef]
- Hirano, M.; Marti, R.; Casali, C.; Tadesse, S.; Uldrick, T.; Fine, B.; Escolar, D.M.; Valentino, M.L.; Nishino, I.; Hesdorffer, C.; et al. Allogeneic stem cell transplantation corrects biochemical derangements in MNGIE. Neurol. 2006, 67, 1458–1460. [Google Scholar] [CrossRef]
- Halter, J.P.; Michael, W.; Schüpbach, M.; Mandel, H.; Casali, C.; Orchard, K.; Collin, M.; Valcarcel, D.; Rovelli, A.; Filosto, M.; et al. Allogeneic haematopoietic stem cell transplantation for mitochondrial neurogastrointestinal encephalomyopathy. Brain 2015, 138, 2847–2858. [Google Scholar] [CrossRef] [PubMed]
- Moran, N.F.; Bain, M.D.; Muqit, M.M.K.; Bax, B.E. Carrier erythrocyte entrapped thymidine phosphorylase therapy for mngie. Neurology 2008, 71, 686–688. [Google Scholar] [CrossRef] [PubMed]
- Bax, B.; Bain, M.D.; Scarpelli, M.; Filosto, M.; Tonin, P.; Moran, N. Clinical and biochemical improvements in a patient with MNGIE following enzyme replacement. Neurology 2013, 81, 1269–1271. [Google Scholar] [CrossRef] [PubMed]
- Bax, B.; Levene, M.; Bain, M.D.; Fairbanks, L.D.; Filosto, M.; Ucar, S.K.; Klopstock, T.; Kornblum, C.; Mandel, H.; Rahman, S.; et al. erythrocyte encapsulated thymidine phosphorylase for the treatment of patients with mitochondrial neurogastrointestinal encephalomyopathy: Study protocol for a multi-centre, multiple dose, open label trial. J. Clin. Med. 2019, 8, 1096. [Google Scholar] [CrossRef] [PubMed]
- Marti, R.; Nishigaki, Y.; Hirano, M. Elevated plasma deoxyuridine in patients with thymidine phosphorylase deficiency. Biochem. Biophys. Res. Commun. 2003, 303, 14–18. [Google Scholar] [CrossRef]
- Massa, R.; Tessa, A.; Margollicci, M.; Micheli, V.; Romigi, A.; Tozzi, G.; Terracciano, C.; Piemonte, F.; Bernardi, G.; Santorelli, F.M. Late-onset MNGIE without peripheral neuropathy due to incomplete loss of thymidine phosphorylase activity. Neuromuscul. Disord. 2009, 19, 837–840. [Google Scholar] [CrossRef]
- Mohamed, S.; Caporali, L.; De Giorgio, R.; Carelli, V.; Contin, M. HPLC-UV analysis of thymidine and deoxyuridine in plasma of patients with thymidine phosphorylase deficiency. J. Chromatogr. B 2014, 949, 58–62. [Google Scholar] [CrossRef]
- Marti, R.; Verschuuren, J.J.; Buchman, A.; Hirano, I.; Tadesse, S.; Van Kuilenburg, A.B.P.; Van Gennip, A.H.; Poorthuis, B.J.H.M.; Hirano, M. Late-onset MNGIE due to partial loss of thymidine phosphorylase activity. Ann. Neurol. 2005, 58, 649–652. [Google Scholar] [CrossRef]
- Li, K.M.; Rivory, L.; Clarke, S. Rapid quantitation of plasma 2′-deoxyuridine by high-performance liquid chromatography/atmospheric pressure chemical ionization mass spectrometry and its application to pharmacodynamic studies in cancer patients. J. Chromatogr. B 2005, 820, 121–130. [Google Scholar] [CrossRef]
- Matuszewski, B.K.; Constanzer, M.L.; Chavez-Eng, C.M. Strategies for the Assessment of Matrix Effect in Quantitative Bioanalytical Methods Based on HPLC−MS/MS. Anal. Chem. 2003, 75, 3019–3030. [Google Scholar] [CrossRef]
- Garone, C.; Tadesse, S.; Hirano, M. Clinical and genetic spectrum of mitochondrial neurogastrointestinal encephalomyopathy. Brain 2011, 134, 3326–3332. [Google Scholar] [CrossRef] [PubMed]


| Matrix and Analyte Concentration | Inter-Assay (n = 18) 1 | Intra-assay (n = 6) | |||||
|---|---|---|---|---|---|---|---|
| Spiked | Calculated Mean ± SD | Accuracy (%) | Precision (CV%) | Calculated Mean ± SD | Accuracy (%) | Precision (CV%) | |
| Plasma Thymidine (ng/mL) | 7515.0 | 7051.1 ± 197.1 | 93.83 | 2.80 | 7051.05 ± 97.32 | 93.83 | 1.38 |
| 501.0 | 508.4 ± 10.6 | 101.47 | 2.08 | 508.39 ± 5.81 | 101.47 | 1.14 | |
| 30.06 | 31.5 ± 2.1 | 104.85 | 6.74 | 31.52 ± 1.63 | 104.85 | 5.18 | |
| 10.02 | 9.6 ± 1.2 | 95.64 | 12.17 | 9.59 ± 0.63 | 95.69 | 6.60 | |
| Plasma Deoxyuridine (ng/mL) | 7522.5 | 7121.45 ± 284.27 | 94.67 | 3.99 | 7121.45 ± 254.70 | 94.67 | 3.58 |
| 501.5 | 481.84 ± 24.97 | 96.08 | 5.18 | 481.84 ± 14.43 | 96.08 | 3.00 | |
| 30.09 | 29.71 ± 2.57 | 98.72 | 8.65 | 29.63 ± 1.38 | 98.49 | 4.66 | |
| 10.03 | 10.42 ± 1.23 | 103.91 | 11.83 | 10.39 ± 0.46 | 103.63 | 4.40 | |
| Urine Thymidine (µg/mL) | 37.58 | 36.13 ± 1.98 | 96.14 | 5.48 | 36.13 ± 2.24 | 96.14 | 6.19 |
| 15.03 | 15.36 ± 0.72 | 102.43 | 4.70 | 15.36 ± 0.78 | 102.43 | 5.08 | |
| 3.01 | 3.22 ± 0.12 | 106.99 | 3.70 | 3.23 ± 0.14 | 107.30 | 4.36 | |
| 1.00 | 1.03 ± 0.10 | 103.09 | 9.50 | 1.05 ± 0.12 | 104.80 | 11.51 | |
| Urine Deoxyuridine (µg/mL) | 37.61 | 39.02 ± 1.50 | 103.76 | 3.84 | 38.57 ± 1.50 | 102.55 | 3.89 |
| 15.05 | 15.56 ± 0.80 | 103.40 | 5.15 | 15.41 ± 0.91 | 102.36 | 5.88 | |
| 3.01 | 3.13 ± 0.15 | 104.03 | 4.89 | 3.14 ± 0.16 | 104.37 | 5.04 | |
| 1.00 | 1.06 ± 0.08 | 106.20 | 7.09 | 1.07 ± 0.09 | 107.45 | 8.18 | |
| Matrix | Thymidine | 2’-deoxyuridine | ||||||
|---|---|---|---|---|---|---|---|---|
| Average ME% or MF% | Average IS Normalized MF% | Average ME% or MF% | Average IS normalized MF% | |||||
| High QC (n = 6) | Low QC (n = 6) | High QC (n = 6) | Low QC (n = 6) | High QC (n = 6) | Low QC (n = 6) | High QC (n = 6) | Low QC (n = 6) | |
| Plasma with K3EDTA | 76.65 | 80.13 | 97.58 | 114.74 | 51.59 | 66.62 | 106.92 | 152.52 |
| Dialyzed plasma with K2EDTA | 70.74 | 84.74 | 100.40 | 101.79 | 48.09 | 46.38 | 108.63 | 110.82 |
| Plasma with Lithium Heparin (1) | 68.95 | 69.13 | 100.08 | 102.94 | 47.33 | 55.73 | 111.28 | 131.89 |
| Plasma with Lithium Heparin (2) | 68.54 | 71.59 | 98.96 | 107.55 | 46.52 | 46.98 | 107.23 | 111.81 |
| Serum (1) | 69.74 | 65.91 | 99.69 | 97.51 | 47.27 | 55.89 | 106.02 | 127.48 |
| Serum (2) | 71.12 | 70.19 | 98.70 | 103.14 | 49.12 | 56.27 | 112.47 | 131.78 |
| Mean | 70.96 | 73.62 | 99.24 | 104.61 | 48.32 | 54.65 | 108.76 | 127.72 |
| Hyperlipidaemic plasma | 67.87 | 67.89 | 101.21 | 102.77 | 48.09 | 65.65 | 108.68 | 152.21 |
| Haemolysed plasma with 2.5% blood | 69.84 | 67.38 | 102.00 | 103.11 | 48.48 | 43.91 | 110.11 | 103.48 |
| Haemolysed plasma with 5% blood | 68.10 | 68.81 | 99.74 | 105.07 | 47.04 | 49.95 | 109.00 | 120.11 |
| Haemolysed plasma with 7.5% blood | 68.76 | 68.48 | 101.46 | 105.42 | 46.43 | 43.33 | 107.99 | 105.11 |
| Haemolysed plasma with 10% blood | 70.49 | 67.06 | 101.62 | 101.89 | 47.51 | 47.85 | 107.76 | 112.61 |
| Mean | 69.01 | 67.92 | 101.65 | 10365 | 47.51 | 50.14 | 108.71 | 118.70 |
| Urine (1) | 78.07 | 65.53 | 103.29 | 101.48 | 48.27 | 38.03 | 103.14 | 98.55 |
| Urine (2) | 74.64 | 64.70 | 103.50 | 101.91 | 44.79 | 35.68 | 104.01 | 100.88 |
| Urine (3) | 71.82 | 59.36 | 104.31 | 104.08 | 32.24 | 22.16 | 98.82 | 89.17 |
| Urine (4) | 82.28 | 66.41 | 102.10 | 97.56 | 55.72 | 43.19 | 106.17 | 102.12 |
| Urine (5) | 76.43 | 64.13 | 104.98 | 102.76 | 47.17 | 37.76 | 105.38 | 102.99 |
| Urine (6) | 77.15 | 62.76 | 105.63 | 100.43 | 47.75 | 38.22 | 103.86 | 100.77 |
| Mean | 76.73 | 63.82 | 103.97 | 101.37 | 45.99 | 35.84 | 103.84 | 99.08 |
| Stability Test | Thymidine | 2’-deoxyuridine | ||||||
|---|---|---|---|---|---|---|---|---|
| Concentration (ng/mL) | CV% | Accuracy (%) | Concentration (ng/mL) | CV% | Accuracy (%) | |||
| Spiked | Mean ± SD | Spiked | Mean ± SD | |||||
| Time 0 | 30.06 | 30.79 ± 1.70 | 5.54 | 102.42 | 30.09 | 30.77 ± 2.91 | 9.44 | 102.27 |
| 7515.0 | 6942.69 ± 171.60 | 2.47 | 92.38 | 7522.5 | 7358.44 ± 83.49 | 1.13 | 97.82 | |
| 24 h RT | 30.06 | 30.21 ± 2.02 | 6.69 | 100.50 | 30.09 | 30.12 ± 2.80 | 9.30 | 100.11 |
| 7515.0 | 7017.00 ± 148.35 | 2.11 | 93.37 | 7522.5 | 7039.48 ± 149.61 | 2.13 | 93.58 | |
| 24 h 4 °C | 30.06 | 31.29 ± 1.21 | 3.88 | 104.08 | 30.09 | 30.00 ± 3.92 | 13.08 | 99.71 |
| 7515.0 | 7145.74 ± 206.99 | 2.90 | 95.09 | 7522.5 | 6918.37 ± 96.97 | 1.40 | 91.97 | |
| Cycle 1 | 30.06 | 30.57 ± 2.31 | 7.57 | 101.71 | 30.09 | 30.19 ± 2.54 | 8.42 | 100.32 |
| 7515.0 | 7258.70 ± 141.88 | 1.95 | 96.59 | 7522.5 | 6852.73 ± 162.53 | 2.37 | 91.10 | |
| Cycle 2 | 30.06 | 31.64 ± 2.36 | 7.45 | 105.24 | 30.09 | 30.45 ± 2.65 | 8.69 | 101.19 |
| 7515.0 | 7077.90 ± 180.94 | 2.56 | 94.18 | 7522.5 | 7057.16 ± 243.80 | 3.45 | 93.81 | |
| Cycle 3 | 30.06 | 32.98 ± 0.97 | 2.94 | 109.70 | 30.09 | 31.79 ± 2.90 | 9.12 | 105.66 |
| 7515.0 | 7018.79 ± 111.02 | 1.58 | 93.40 | 7522.5 | 7228.30 ± 126.25 | 1.75 | 96.09 | |
| Time 0 | 10.02 | 10.26 ± 1.40 | 13.62 | 102.56 | 10.03 | 9.88 ± 1.36 | 13.78 | 98.83 |
| 30.06 | 30.79 ± 1.70 | 5.54 | 102.42 | 30.09 | 30.77 ± 2.91 | 9.44 | 102.27 | |
| 501.0 | 501.69 ± 4.30 | 0.86 | 100.14 | 501.5 | 495.66 ± 29.25 | 5.90 | 98.83 | |
| 7515.0 | 6942.69 ± 171.60 | 2.47 | 92.38 | 7522.5 | 7358.44 ± 83.49 | 1.13 | 97.82 | |
| 24 h 4 °C | 10.02 | 9.84 ± 0.91 | 9.20 | 98.37 | 10.03 | 10.34 ± 1.02 | 9.89 | 103.43 |
| 30.06 | 32.04 ± 1.77 | 5.51 | 106.59 | 30.09 | 30.08 ± 2.47 | 8.21 | 99.97 | |
| 501.0 | 493.44 ± 13.29 | 2.69 | 98.49 | 501.5 | 469.55 ± 4.81 | 1.03 | 93.63 | |
| 7515.0 | 6805.05 ± 43.87 | 0.65 | 90.55 | 7522.5 | 6841.37 ± 136.66 | 2.00 | 90.95 | |
| 48 h 4 °C | 10.02 | 10.37 ± 1.11 | 10.74 | 103.73 | 10.03 | 10.55 ± 0.60 | 5.65 | 105.52 |
| 30.06 | 30.75 ± 0.79 | 2.57 | 102.28 | 30.09 | 31.87 ± 1.86 | 5.83 | 105.93 | |
| 501.0 | 503.37 ± 8.29 | 1.65 | 100.47 | 501.5 | 484.65 ± 9.68 | 2.00 | 96.64 | |
| 7515.0 | 6902.64 ± 203.18 | 2.94 | 91.85 | 7522.5 | 7136.11 ± 166.93 | 2.34 | 94.86 | |
| 72 h 4 °C | 10.02 | 10.30 ± 0.44 | 4.30 | 102.97 | 10.03 | 9.89 ± 1.07 | 10.83 | 98.93 |
| 30.06 | 30.62 ± 2.73 | 8.93 | 101.85 | 30.09 | 30.58 ± 2.00 | 6.55 | 101.64 | |
| 501.0 | 500.08 ± 11.53 | 2.31 | 99.82 | 501.5 | 486.86 ± 15.87 | 3.26 | 97.08 | |
| 7515.0 | 6879.71 ± 244.09 | 3.55 | 91.55 | 7522.5 | 7102.80 ± 251.75 | 3.54 | 94.42 | |
| Stability Test | Thymidine | 2’-Deoxyuridine | ||||||
|---|---|---|---|---|---|---|---|---|
| Concentration (µg/mL) | CV% | Accuracy (%) | Concentration (µg/mL) | CV% | Accuracy (%) | |||
| Spiked | Mean ± SD | Spiked | Mean ± SD | |||||
| Short term | ||||||||
| Time 0 | 3.01 | 3.19 ± 0.03 | 0.89 | 105.99 | 3.01 | 3.01 ± 0.07 | 2.40 | 103.07 |
| 37.58 | 34.96 ± 0.51 | 1.47 | 93.03 | 37.61 | 38.97 ± 1.57 | 4.02 | 103.62 | |
| 24 h RT + PCA | 3.01 | 2.92 ± 0.05 | 1.66 | 97.05 | 3.01 | 3.10 ± 0.10 | 3.19 | 103.08 |
| 37.58 | 31.32 ± 0.54 | 1.73 | 83.34 | 37.61 | 36.98 ± 0.95 | 2.57 | 98.33 | |
| 24 h RT | 3.01 | ND | 3.01 | ND | ||||
| 37.58 | ND | 37.61 | ND | |||||
| 14 days 4 °C + PCA | 3.01 | 3.03 ± 0.17 | 5.71 | 100.75 | 3.01 | 2.69 ± 0.16 | 5.96 | 89.26 |
| 37.58 | 30.15 ± 0.63 | 2.07 | 80.24 | 37.61 | 33.42 ± 1.13 | 3.38 | 88.87 | |
| 14 days 4 °C | 3.01 | ND | 3.01 | ND | ||||
| 37.58 | ND | 37.61 | ND | |||||
| Freeze-thaw | ||||||||
| Cycle 1 + PCA | 3.01 | 3.18 ± 0.09 | 2.85 | 105.68 | 3.01 | 3.07 ± 0.07 | 2.26 | 102.08 |
| 37.58 | 34.74 ± 0.44 | 1.27 | 92.44 | 37.61 | 38.43 ± 0.82 | 2.15 | 102.19 | |
| Cycle 2 + PCA | 3.01 | 3.24 ± 0.10 | 3.24 | 107.57 | 3.01 | 3.23 ± 0.13 | 4.02 | 107.31 |
| 37.58 | 35.76 ± 0.63 | 1.77 | 95.17 | 37.61 | 39.56 ± 0.67 | 1.69 | 105.17 | |
| Cycle 3 + PCA | 3.01 | 3.24 ± 0.05 | 1.43 | 107.70 | 3.01 | 3.01 ± 0.10 | 3.43 | 100.08 |
| 37.58 | 35.66 ± 0.71 | 1.99 | 94.88 | 37.61 | 37.82 ± 0.82 | 2.16 | 100.55 | |
| Cycle 1 | 3.01 | 2.82 ± 0.06 | 2.10 | 93.82 | 3.01 | 2.46 ± 0.05 | 1.87 | 81.84 |
| 37.58 | 33.56 ± 0.53 | 1.58 | 89.29 | 37.61 | 35.09 ± 0.50 | 1.42 | 93.31 | |
| Cycle 2 | 3.01 | 2.80 ± 0.08 | 2.72 | 92.90 | 3.01 | 2.43 ± 0.05 | 1.98 | 80.76 |
| 37.58 | 33.39 ± 0.80 | 2.40 | 88.85 | 37.61 | 34.73 ± 0.72 | 2.07 | 92.34 | |
| Cycle 3 | 3.01 | 2.83 ± 0.06 | 2.02 | 93.89 | 3.01 | 2.37 ± 0.06 | 2.73 | 78.73 |
| 37.58 | 33.91 ± 0.81 | 2.38 | 90.23 | 37.61 | 33.35 ± 0.66 | 1.97 | 88.67 | |
| Autosampler | ||||||||
| Time 0 | 1.00 | 1.19 ± 0.01 | 0.84 | 118.50 | 1.00 | 1.18 ± 0.02 | 1.77 | 117.50 |
| 3.01 | 3.39 ± 0.03 | 0.85 | 112.49 | 3.01 | 3.32 ± 0.06 | 1.89 | 110.17 | |
| 15.03 | 16.23 ± 0.24 | 1.45 | 108.00 | 15.05 | 116.44 ± 0.36 | 2.20 | 109.20 | |
| 37.58 | 38.71 ± 0.81 | 2.08 | 103.00 | 37.61 | 40.30 ± 0.71 | 1.75 | 107.14 | |
| 24 h 4 °C | 1.00 | 1.14 ± 0.05 | 3.97 | 113.50 | 1.00 | 1.13 ± 0.07 | 5.84 | 113.43 |
| 3.01 | 3.28 ± 0.02 | 0.61 | 108.97 | 3.01 | 3.26 ± 0.15 | 4.52 | 108.45 | |
| 15.03 | 16.04 ± 0.30 | 1.90 | 106.72 | 15.05 | 15.92 ± 0.33 | 2.10 | 105.75 | |
| 37.58 | 37.83 ± 0.77 | 2.04 | 100.67 | 37.61 | 38.11 ± 0.50 | 1.32 | 101.33 | |
| 48 h 4 °C | 1.00 | 1.14 ± 0.04 | 3.52 | 114.30 | 1.00 | 1.09 ± 0.10 | 8.72 | 109.38 |
| 3.01 | 3.32 ± 0.08 | 2.37 | 110.43 | 3.01 | 3.17 ± 0.12 | 3.70 | 105.26 | |
| 15.03 | 16.60 ± 0.34 | 2.06 | 110.47 | 15.05 | 15.21 ± 0.32 | 2.14 | 101.06 | |
| 37.58 | 38.38 ± 1.23 | 3.21 | 102.12 | 37.61 | 38.57 ± 1.04 | 2.69 | 102.56 | |
| 72 h 4 °C | 1.00 | 1.14 ± 0.02 | 1.93 | 114.12 | 1.00 | 1.18 ± 0.01 | 1.19 | 118.10 |
| 3.01 | 3.32 ± 0.04 | 1.21 | 110.33 | 3.01 | 3.32 ± 0.02 | 0.64 | 110.26 | |
| 15.03 | 16.27 ± 0.18 | 1.09 | 108.24 | 15.05 | 15.94 ± 0.31 | 1.98 | 105.88 | |
| 37.58 | 37.63 ± 1.13 | 2.99 | 100.13 | 37.61 | 39.38 ± 0.57 | 1.44 | 104.70 | |
| Patient ID | TYMP Mutation | Diagnosis Concentration, ng/mL (µmol/L) | EE-TP dose (µmol/min/1010 Cells) | Treatment Day | In-Treatment Concentration, ng/mL (µmol/L) | ||
|---|---|---|---|---|---|---|---|
| Thymidine | 2’deoxyuridine | Thymidine | 2’deoxyuridine | ||||
| 1 | Heterozygous c.866A>C c.1231_1243 del | 5536.5 (22.9) | 6161.3 (27.0) | 18.2 | 117 | ND | ND |
| 2 | Homozygous c.1088 delG | 3029.5 (12.5) | 3638.1 (15.9) | 26.5 | 33 | 40.7 (0.17) | 9.9 (0.4) |
| 3 | g.4009_4010insG g.4101G>A | 4031.5 (16.6) | 4817.6 (21.1) | 27.5 | 34 | 2068.5 (8.5) | 2251.0 (9.9) |
| 4 | Homozygous c.1282G>C | 2380.9 (9.8) | 2921.8 (12.8) | NA | NA | NA | NA |
| 5 | Homozygous c.392C>T | 2892.0 (11.9) | 2558.4 (11.2) | NA | NA | NA | NA |
© 2020 by the authors. Licensee MDPI, Basel, Switzerland. This article is an open access article distributed under the terms and conditions of the Creative Commons Attribution (CC BY) license (http://creativecommons.org/licenses/by/4.0/).
Share and Cite
Kipper, K.; Hecht, M.; Antunes, N.J.; Fairbanks, L.D.; Levene, M.; Kalkan Uçar, S.; Schaefer, A.; Blakely, E.L.; Bax, B.E. Quantification of Plasma and Urine Thymidine and 2’-Deoxyuridine by LC-MS/MS for the Pharmacodynamic Evaluation of Erythrocyte Encapsulated Thymidine Phosphorylase in Patients with Mitochondrial Neurogastrointestinal Encephalomyopathy. J. Clin. Med. 2020, 9, 788. https://doi.org/10.3390/jcm9030788
Kipper K, Hecht M, Antunes NJ, Fairbanks LD, Levene M, Kalkan Uçar S, Schaefer A, Blakely EL, Bax BE. Quantification of Plasma and Urine Thymidine and 2’-Deoxyuridine by LC-MS/MS for the Pharmacodynamic Evaluation of Erythrocyte Encapsulated Thymidine Phosphorylase in Patients with Mitochondrial Neurogastrointestinal Encephalomyopathy. Journal of Clinical Medicine. 2020; 9(3):788. https://doi.org/10.3390/jcm9030788
Chicago/Turabian StyleKipper, Karin, Max Hecht, Natalicia J. Antunes, Lynette D. Fairbanks, Michelle Levene, Sema Kalkan Uçar, Andrew Schaefer, Emma L. Blakely, and Bridget E. Bax. 2020. "Quantification of Plasma and Urine Thymidine and 2’-Deoxyuridine by LC-MS/MS for the Pharmacodynamic Evaluation of Erythrocyte Encapsulated Thymidine Phosphorylase in Patients with Mitochondrial Neurogastrointestinal Encephalomyopathy" Journal of Clinical Medicine 9, no. 3: 788. https://doi.org/10.3390/jcm9030788
APA StyleKipper, K., Hecht, M., Antunes, N. J., Fairbanks, L. D., Levene, M., Kalkan Uçar, S., Schaefer, A., Blakely, E. L., & Bax, B. E. (2020). Quantification of Plasma and Urine Thymidine and 2’-Deoxyuridine by LC-MS/MS for the Pharmacodynamic Evaluation of Erythrocyte Encapsulated Thymidine Phosphorylase in Patients with Mitochondrial Neurogastrointestinal Encephalomyopathy. Journal of Clinical Medicine, 9(3), 788. https://doi.org/10.3390/jcm9030788


