Body Composition, Serum Concentrations of Androgens and Insulin Resistance in Different Polycystic Ovary Syndrome Phenotypes

 , ,
, ,
Abstract
1. Introduction
2. Materials and Methods
2.1. Subjects
2.2. Study Protocol
2.3. Biochemical Analyses
2.4. Calculations
2.5. Body Composition Analysis
2.6. Statistical Analysis
3. Results
4. Discussion
5. Conclusions
Author Contributions
Funding
Conflicts of Interest
References
- Lizneva, D.; Suturina, L.; Walker, W.; Brakta, S.; Gavrilova-Jordan, L.; Azziz, R. Criteria, prevalence, and phenotypes of polycystic ovary syndrome. Fertil. Steril. 2016, 106, 6–15. [Google Scholar] [CrossRef] [PubMed]
- Diamanti-Kandarakis, E.; Dunaif, A. Insulin resistance and the polycystic ovary syndrome revisited: An update on mechanisms and implications. Endocr. Rev. 2012, 33, 981–1030. [Google Scholar] [CrossRef] [PubMed]
- Azziz, R.; Carmina, E.; Dewailly, D.; Diamanti-Kandarakis, E.; Escobar-Morreale, H.F.; Futterweit, W.; Janssen, O.E.; Legro, R.S.; Norman, R.J.; Taylor, A.E.; et al. Positions statement: Criteria for defining polycystic ovary syndrome as a predominantly hyperandrogenic syndrome: An Androgen Excess Society guideline. J. Clin. Endocrinol. Metab. 2006, 91, 4237–4245. [Google Scholar] [CrossRef] [PubMed]
- Ehrmann, D.A. Polycystic ovary syndrome. N. Engl. J. Med. 2005, 352, 1223–1236. [Google Scholar] [CrossRef]
- Wehr, E.; Möller, R.; Horejsi, R.; Giuliani, A.; Kopera, D.; Schweighofer, N.; Groselj-Strele, A.; Pieber, T.R.; Obermayer-Pietsch, B. Subcutaneous adipose tissue topography and metabolic disturbances in polycystic ovary syndrome. Wien. Klin. Wochenschr. 2009, 121, 262–269. [Google Scholar] [CrossRef]
- Rotterdam ESHRE/ASRM-Sponsored PCOS Consensus Workshop Group. Revised 2003 consensus on diagnostic criteria and long-term health risks related to polycystic ovary syndrome (PCOS). Hum. Reprod. 2004, 19, 41–47. [Google Scholar] [CrossRef]
- Clark, N.M.; Podolski, A.J.; Brooks, E.D.; Chizen, D.R.; Pierson, R.A.; Lehotay, D.C.; Lujan, M.E. Prevalence of Polycystic Ovary Syndrome Phenotypes Using Updated Criteria for Polycystic Ovarian Morphology: An Assessment of Over 100 Consecutive Women Self-reporting Features of Polycystic Ovary Syndrome. Reprod. Sci. 2014, 21, 1034–1043. [Google Scholar] [CrossRef]
- Moghetti, P.; Tosi, F.; Bonin, C.; Di Sarra, D.; Fiers, T.; Kaufman, J.M.; Giagulli, V.A.; Signori, C.; Zambotti, F.; Dall’Alda, M.; et al. Divergences in insulin resistance between the different phenotypes of the polycystic ovary syndrome. J. Clin. Endocrinol. Metab. 2013, 98, E628–E637. [Google Scholar] [CrossRef]
- Legro, R.S.; Bentley-Lewis, R.; Driscoll, D.; Wang, S.C.; Dunaif, A. Insulin resistance in the sisters of women with polycystic ovary syndrome: Association with hyperandrogenemia rather than menstrual irregularity. J. Clin. Endocrinol. Metab. 2002, 87, 2128–2133. [Google Scholar] [CrossRef]
- Kirchengast, S.; Huber, J. Body composition characteristics and body fat distribution in lean women with polycystic ovary syndrome. Hum. Reprod. 2001, 16, 1255–1260. [Google Scholar] [CrossRef]
- Kozakowski, J.; Zgliczyński, W. Body composition, glucose metabolism markers and serum androgens—Association in women with polycystic ovary syndrome. Endokrynol. Pol. 2013, 64, 94–100. [Google Scholar] [PubMed]
- Yucel, A.; Noyan, V.; Sagsoz, N. The association of serum androgens and insulin resistance with fat distribution in polycystic ovary syndrome. Eur. J. Obstet. Gynecol. Reprod. Biol. 2006, 126, 81–86. [Google Scholar] [CrossRef] [PubMed]
- Park, Y.W.; Heymsfield, S.B.; Gallagher, D. Are dual-energy X-ray absorptiometry regional estimates associated with visceral adipose tissue mass? Int. J. Obes. Relat. Metab. Disord. 2002, 26, 978–983. [Google Scholar] [CrossRef] [PubMed]
- Azziz, R. Controversy in clinical endocrinology: Diagnosis of polycystic ovarian syndrome: The Rotterdam criteria are premature. J. Clin. Endocrinol. Metab. 2006, 91, 781–785. [Google Scholar] [CrossRef] [PubMed]
- Swanson, M.; Sauerbrei, E.E.; Cooperberg, P.L. Medical implications of ultrasonically detected polycystic ovaries. J. Clin. Ultrasound 1981, 9, 219–222. [Google Scholar] [CrossRef]
- Matthews, D.R.; Hosker, J.P.; Rudenski, A.S.; Naylor, B.A.; Treacher, D.F.; Turner, R.C. Homeostasis model assessment: Insulin resistance and beta-cell function from fasting plasma glucose and insulin concentrations in man. Diabetologia 1985, 28, 412–419. [Google Scholar] [CrossRef]
- Carmina, E.; Bucchieri, S.; Mansueto, P.; Rini, G.; Ferin, M.; Lobo, R.A. Circulating levels of adipose products and differences in fat distribution in the ovulatory and anovulatory phenotypes of polycystic ovary syndrome. Fertil. Steril. 2009, 91, 1332–1335. [Google Scholar] [CrossRef]
- Carmina, E.; Bucchieri, S.; Esposito, A.; Del Puente, A.; Mansueto, P.; Orio, F.; Di Fede, G.; Rini, G. Abdominal fat quantity and distribution in women with polycystic ovary syndrome and extent of its relation to insulin resistance. J. Clin. Endocrinol. Metab. 2007, 92, 2500–2505. [Google Scholar] [CrossRef]
- O’Reilly, M.W.; Taylor, A.E.; Crabtree, N.J.; Hughes, B.A.; Capper, F.; Crowley, R.K.; Stewart, P.M.; Tomlinson, J.W.; Arlt, W. Hyperandrogenemia predicts metabolic phenotype in polycystic ovary syndrome: The utility of serum androstenedione. J. Clin. Endocrinol. Metab. 2014, 99, 1027–1036. [Google Scholar] [CrossRef]
- Wajchenberg, B.L. Subcutaneous and visceral adipose tissue: Their relation to the metabolic syndrome. Endocr. Rev. 2000, 21, 697–738. [Google Scholar] [CrossRef]
- Jacewicz-Święcka, M.; Kowalska, I. Polycystic ovary syndrome and the risk of cardiometabolic complications in longitudinal studies. Diabetes Metab. Res. Rev. 2018, 34, e3054. [Google Scholar] [CrossRef] [PubMed]
- Escobar-Morreale, H.F. Iron metabolism and the polycystic ovary syndrome. Trends Endocrinol. Metab. 2012, 23, 509–515. [Google Scholar] [CrossRef] [PubMed]
- Goverde, A.J.; van Koert, A.J.; Eijkemans, M.J.; Knauff, E.A.; Westerveld, H.E.; Fauser, B.C.; Broekmans, F.J. Indicators for metabolic disturbances in anovulatory women with polycystic ovary syndrome diagnosed according to the Rotterdam consensus criteria. Hum. Reprod. 2009, 24, 710–717. [Google Scholar] [CrossRef] [PubMed]
- Corbould, A.; Zhao, H.; Mirzoeva, S.; Aird, F.; Dunaif, A. Enhanced mitogenic signaling in skeletal muscle of women with polycystic ovary syndrome. Diabetes 2006, 55, 751–759. [Google Scholar] [CrossRef]
- Dunaif, A. Insulin resistance and the polycystic ovary syndrome: Mechanism and implications for pathogenesis. Endocr. Rev. 1997, 18, 774–800. [Google Scholar]
- Jamil, A.S.; Alalaf, S.K.; Al-Tawil, N.G.; Al-Shawaf, T. Comparison of clinical and hormonal characteristics among four phenotypes of polycystic ovary syndrome based on the Rotterdam criteria. Arch. Gynecol. Obstet. 2016, 293, 447–456. [Google Scholar] [CrossRef]
- Yilmaz, M.; Isaoglu, U.; Delibas, I.B.; Kadanali, S. Anthropometric, clinical and laboratory comparison of four phenotypes of polycystic ovary syndrome based on Rotterdam criteria. J. Obstet. Gynaecol. Res. 2011, 37, 1020–1026. [Google Scholar] [CrossRef]
- Wiltgen, D.; Spritzer, P.M. Variation in metabolic and cardiovascular risk in women with different polycystic ovary syndrome phenotypes. Fertil. Steril. 2010, 94, 2493–2496. [Google Scholar] [CrossRef]
- Mari, A.; Pacini, G.; Brazzale, A.R.; Ahren, B. Comparative evaluation of simple insulin sensitivity methods based on the oral glucose tolerance test. Diabetologia 2005, 48, 748–751. [Google Scholar] [CrossRef]
- Mari, A.; Ahrén, B.; Pacini, G. Assessment of insulin secretion in relation to insulin resistance. Curr. Opin. Clin. Nutr. Metab. Care 2005, 8, 529–533. [Google Scholar] [CrossRef]
- Matsuda, M.; DeFronzo, R.A. Insulin sensitivity indices obtained from oral glucose tolerance testing: Comparison with the euglycemic insulin clamp. Diabetes Care 1999, 22, 1462–1470. [Google Scholar] [CrossRef] [PubMed]


| Control Group (n = 57) | Phenotype A (n = 34) | Phenotype B (n = 20) | Phenotype C (n = 20) | Phenotype D (n = 15) | p Value | |
|---|---|---|---|---|---|---|
| Age (years) | 25 (23–28) | 24 (22–27) | 24 (23–27.5) | 24 (21.5–27.5) | 26 (22–28) | 0.60 |
| BMI (kg/m2) | 22.4 (21.7–24.3) | 23.7 (21.1–29.4) | 24.9 (22.2–29.5) | 23.1 (21.6–25.2) | 23.4 (20.5–27.1) | 0.60 |
| WC (cm) | 80 (74–84) | 80 (73–96) | 81.5 (77.5–97) | 78.5 (73.5–89) | 82 (69–91) | 0.72 |
| Ferriman-Gallwey score | 3 (2–5) | 9 (4–12) 1,2 | 11 (9–15) 3,6 | 9 (3–11) 4,5 | 1 (1–5) 2,3,5 | <0.01 |
| FSH (IU/L) | 5.40 (4.4–6.3) | 5.61 (3.62–6.39) | 4.76 (3.91–6.02) | 5.67 (5.14–6.57) | 5.19 (4.34–6.6) | 0.41 |
| LH (IU/L) | 3.70 (2.7–4.7) | 4.66 (3.1–7.2) | 3.66 (2.57–4.56) | 3.71 (2.95–4.91) | 4.42 (3.58–5.95) | 0.07 |
| TT (ng/mL) | 0.56 (0.42–0.69) | 0.72 (0.63–0.94) 1,2 | 0.78 (0.59–0.88) 3 | 0.80 (0.65–0.89) 4,5 | 0.51 (0.41–0.59) | <0.01 |
| SHBG (nmol/L) | 66.9 (54.6–92.5) | 43.2 (27.2–51.8) 1 | 34.7 (25.8–86.6) 6 | 56.3 (36.7–73.4) | 57.5 (51.5–79.7) | <0.01 |
| FAI | 2.70 (1.7–3.8) | 6.18 (4.34–9.73) 1,2 | 5.38 (2.69–8.94) 4 | 4.65 (3.19–6.59) 6 | 2.58 (2.04–3.5) | <0.01 |
| Androstenedione (ng/mL) | 3.10 (2.49–4.04) | 4.60 (3.3–5.1)1 | 3.73 (3.2–4.62) | 4.68 (3.26–5.85) 4 | 3.43 (2.9–4.95) | <0.01 |
| DHEA-S (ug/dL) | 230.1 (185.6–338) | 300.3 (256.9–368.6) 1 | 287.1 (222.8–400.6) | 358.6 (241.9–441.6) 4 | 238 (201.5–301.4) | <0.01 |
| Glucose 0′ OGTT (mg/dL) | 92 (88–97) | 95 (90–100) 7 | 96.5 (91–100) | 90 (84–92) | 90 (87–94) | 0.04 |
| Glucose 120′ OGTT (mg/dL) | 91 (75–101) | 98 (86–121) | 96.5 (85.5–111) | 85 (78–98) | 83 (77–95) | 0.03 |
| Insulin 0′ OGTT (uIU/mL) | 8.80 (7.2–11.6) | 10.60 (7.5–14.8) | 9.81 (6.6–14.2) | 8.36 (7.1–10.0) | 8.20 (6.8–13.5) | 0.38 |
| Insulin 120′ OGTT (uIU/mL) | 27.1 (18.7–38) | 41 (25.5–67.9) | 29.6 (25.8–46.6) | 23.8 (17.2–40.3) | 29.2 (19.2–57.1) | 0.04 |
| HOMA-IR | 2.06 (1.64–2.9) | 2.60 (1.91–3.49) | 2.35 (1.45–3.61) | 1.85 (1.46–2.3) | 1.92 (1.46–2.73) | 0.25 |
| Total cholesterol (mg/dL) | 171 (149–195) | 172 (157–199) | 169.5 (160–182) | 168 (157–179.5) | 174 (140–193) | 0.80 |
| HDL-cholesterol (mg/dL) | 63 (57–75) | 67 (49–75) | 60.5 (50.5–69.5) | 69.5 (59–77.5) | 69 (51–79) | 0.38 |
| LDL-cholesterol (mg/dL) | 90 (76–106) | 96.6 (81.2–110.6) | 91.3 (83.6–103) | 86.6 (68.8–91.6) | 90.8 (72–104) | 0.28 |
| TG (mg/dL) | 59 (42–81) | 67 (49–92) | 68 (51.5–102) | 60 (47.5–83.5) | 60 (50–76) | 0.30 |
| VAT mass (g) | 168 (68–336) | 242 (125–897) 1 | 220 (88–667) | 157 (57–356) | 219 (118–420) | 0.01 |
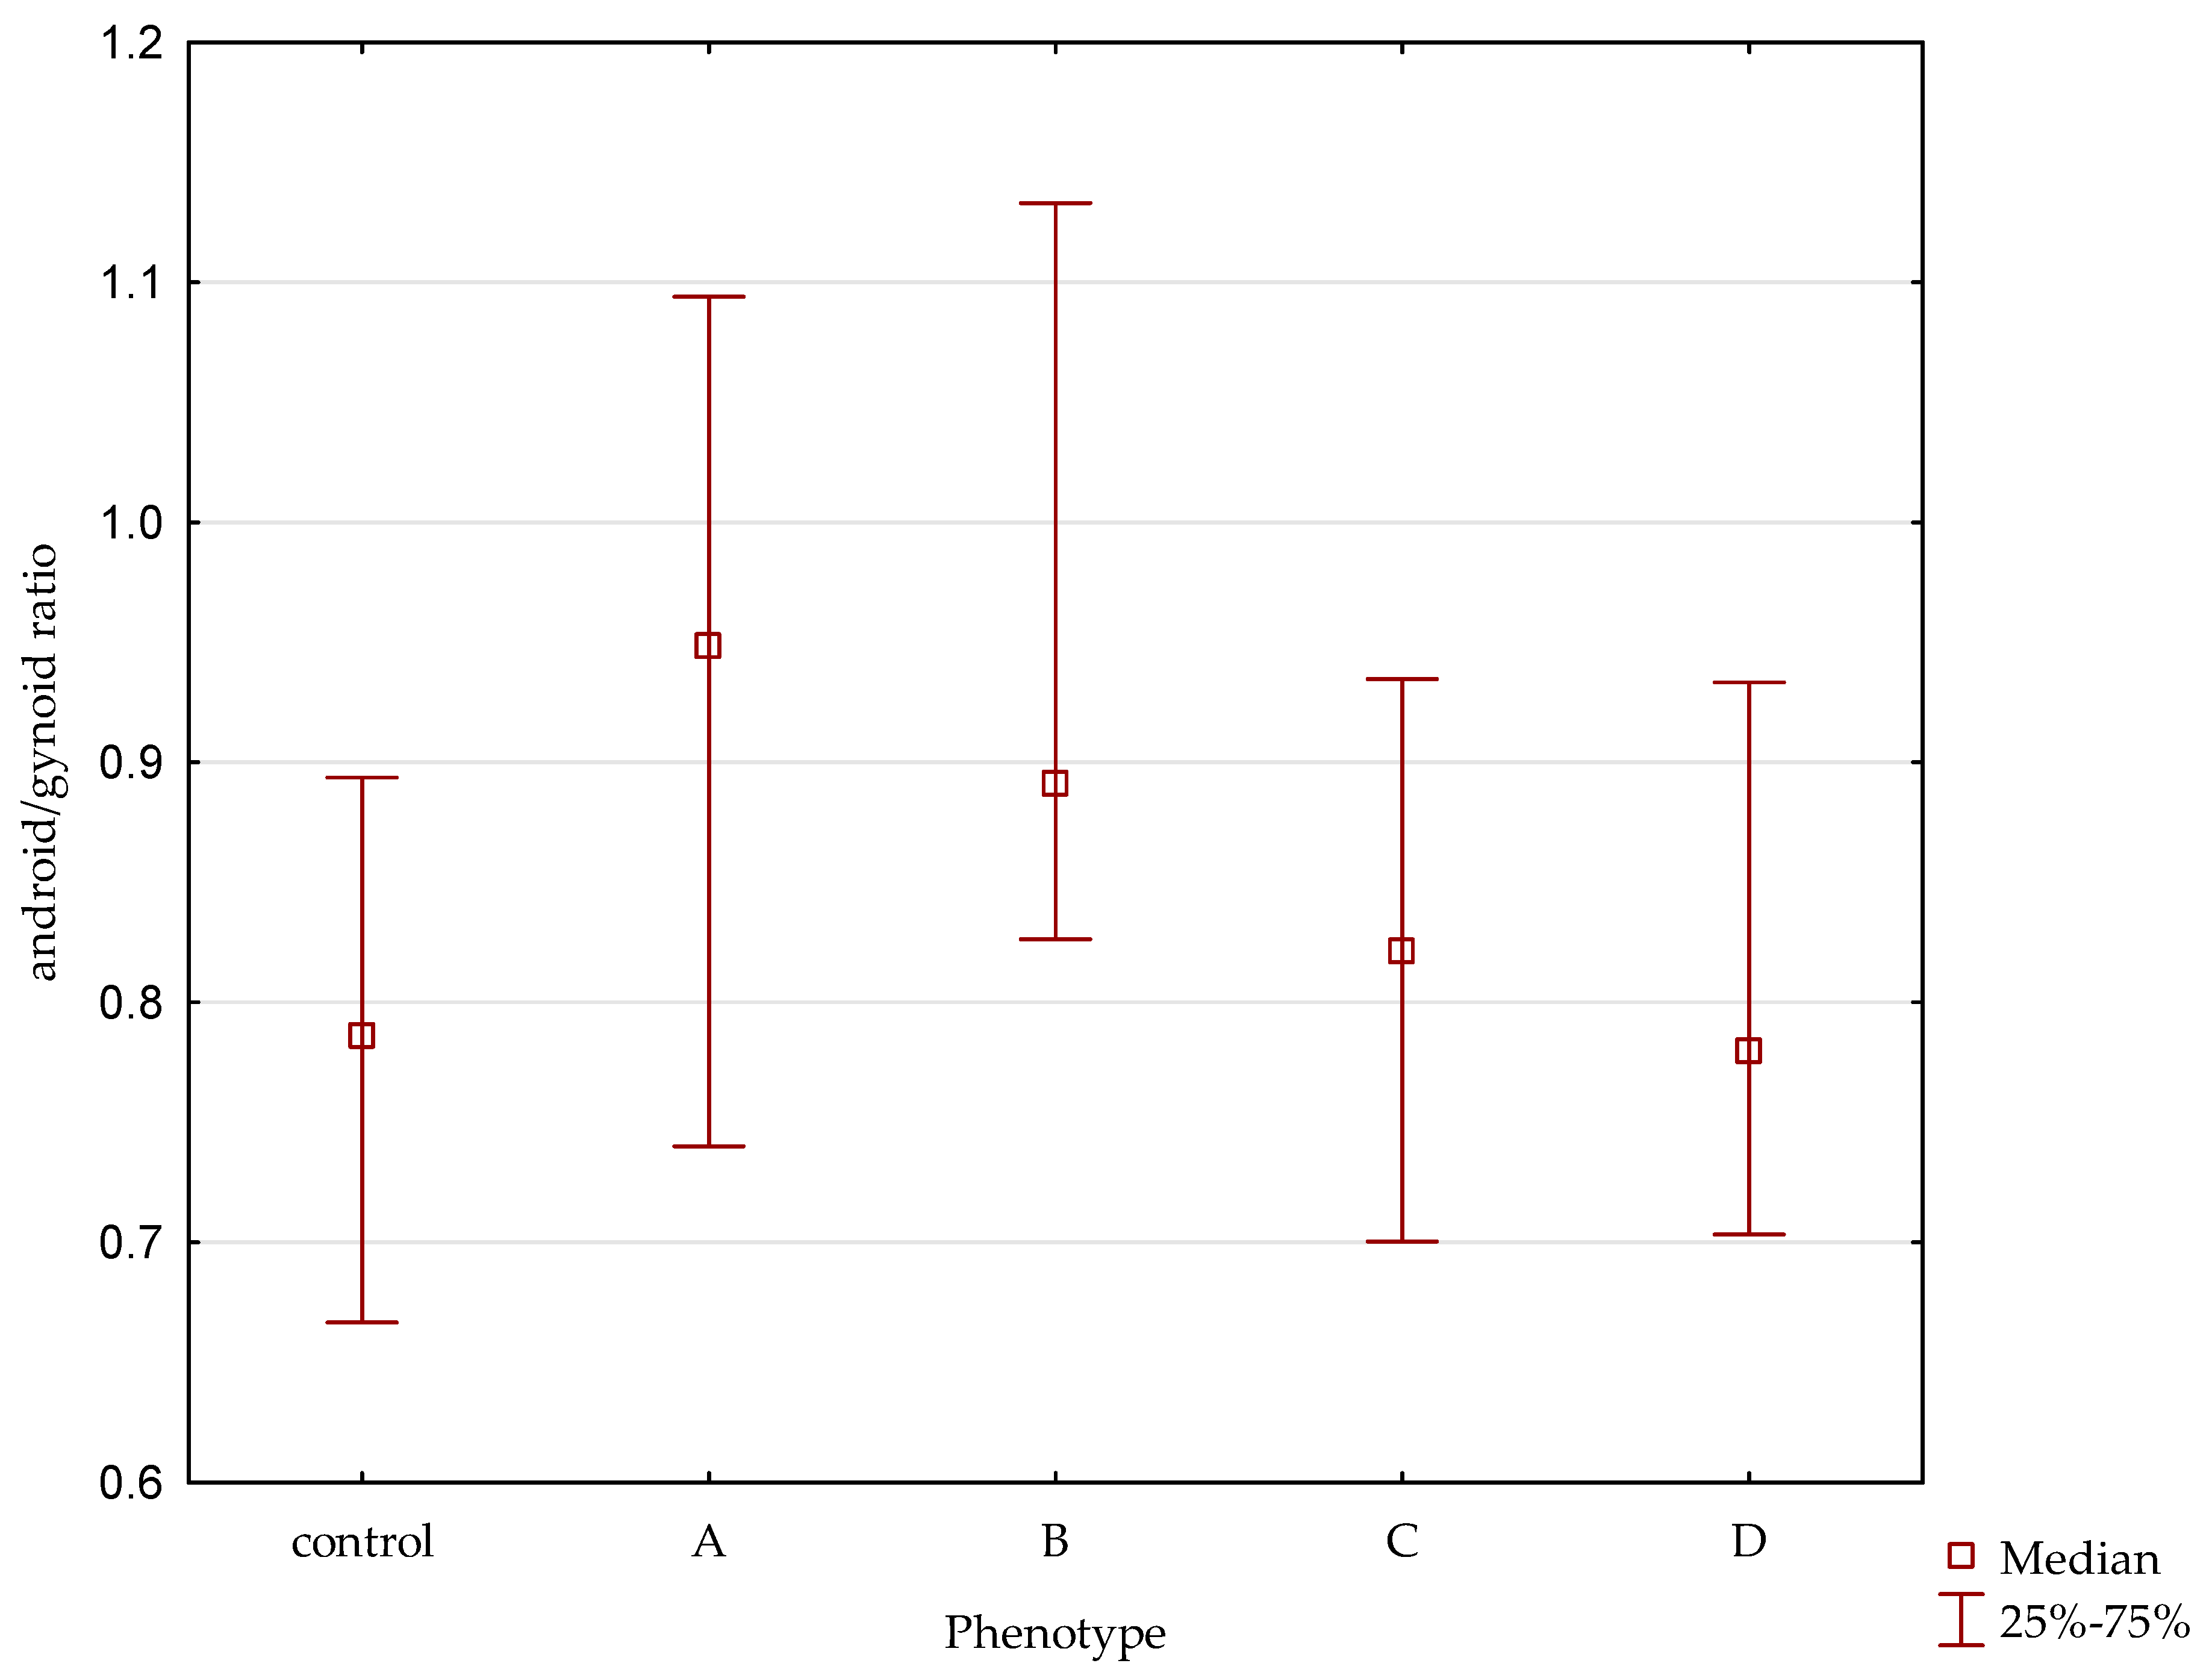
| A/G ratio | 0.79 (0.67–0.89) | 0.94 (0.74–1.09) 1 | 0.88 (0.78–1.13) | 0.82 (0.70–0.93) | 0.76 (0.69–0.93) | 0.005 |
| Control Group (n = 57) | Phenotype A (n = 34) | Phenotype B (n = 20) | Phenotype C (n = 20) | Phenotype D (n = 15) | |
|---|---|---|---|---|---|
| HOMA-IR | r = 0.12, p = 0.37 | r = 0.61, p < 0.01 * | r = 0.70, p < 0.01 * | r = 0.51, p = 0.02 * | r = 0.57, p = 0.03 * |
| TT (ng/mL) | r = 0.14, p = 0.27 | r = 0.20, p = 0.86 | r = 0.01, p = 0.94 | r = 0.13, p = 0.56 | r = 0.05, p = 0.85 |
| FAI | r = 0.22, p = 0.08 | r = 0.58, p < 0.01 * | r = 0.38, p = 0.10 | r = 0.44, p = 0.05 | r = 0.50, p = 0.06 |
| Androstenedione (ng/mL) | r = 0.18, p = 0.18 | r = 0.09, p = 0.58 | r = 0.11, p = 0.63 | r = 0.22, p = 0.43 | r = 0.11, p = 0.63 |
| DHEA-S (ug/dl) | r = 0.09, p = 0.50 | r = 0.12, p = 0.48 | r = 0.05, p = 0.84 | r = 0.21, p = 0.35 | r = 0.27, p = 0.34 |
| Control Group (n = 57) | Phenotype A (n = 34) | Phenotype B (n = 20) | Phenotype C (n = 20) | Phenotype D (n = 15) | |
|---|---|---|---|---|---|
| HOMA-IR | r = 0.12, p = 0.36 | r = 0.53, p < 0.01 * | r = 0.53, p = 0.01 * | r = 0.50, p = 0.02 * | r = 0.58, p = 0.02 * |
| TT (ng/mL) | r = 0.05, p = 0.67 | r = 0.16, p = 0.33 | r = 0.08, p = 0.74 | r = 0.51, p = 0.01 | r = 0.06, p = 0.82 |
| FAI | r = 0.26, p = 0.04 * | r = 0.53, p < 0.01 * | r = 0.50, p = 0.02 * | r = 0.61, p = 0.003 * | r = 0.52, p = 0.04 * |
| Androstendione (ng/mL) | r = 0.09, p = 0.48 | r = 0.02, p = 0.89 | r = -0.05, p = 0.83 | r = 0.53, p = 0.01 * | r = -0.05, p = 0.83 |
| DHEA-S (ug/dL) | r = 0.08, p = 0.55 | r = 0.002, p = 0.48 | r = 0.24, p = 0.30 | r = 0.46, p = 0.03 * | r = 0.48, p = 0.06 |
© 2020 by the authors. Licensee MDPI, Basel, Switzerland. This article is an open access article distributed under the terms and conditions of the Creative Commons Attribution (CC BY) license (http://creativecommons.org/licenses/by/4.0/).
Share and Cite
Polak, A.M.; Adamska, A.; Krentowska, A.; Łebkowska, A.; Hryniewicka, J.; Adamski, M.; Kowalska, I. Body Composition, Serum Concentrations of Androgens and Insulin Resistance in Different Polycystic Ovary Syndrome Phenotypes. J. Clin. Med. 2020, 9, 732. https://doi.org/10.3390/jcm9030732
Polak AM, Adamska A, Krentowska A, Łebkowska A, Hryniewicka J, Adamski M, Kowalska I. Body Composition, Serum Concentrations of Androgens and Insulin Resistance in Different Polycystic Ovary Syndrome Phenotypes. Journal of Clinical Medicine. 2020; 9(3):732. https://doi.org/10.3390/jcm9030732
Chicago/Turabian StylePolak, Aleksandra Maria, Agnieszka Adamska, Anna Krentowska, Agnieszka Łebkowska, Justyna Hryniewicka, Marcin Adamski, and Irina Kowalska. 2020. "Body Composition, Serum Concentrations of Androgens and Insulin Resistance in Different Polycystic Ovary Syndrome Phenotypes" Journal of Clinical Medicine 9, no. 3: 732. https://doi.org/10.3390/jcm9030732
APA StylePolak, A. M., Adamska, A., Krentowska, A., Łebkowska, A., Hryniewicka, J., Adamski, M., & Kowalska, I. (2020). Body Composition, Serum Concentrations of Androgens and Insulin Resistance in Different Polycystic Ovary Syndrome Phenotypes. Journal of Clinical Medicine, 9(3), 732. https://doi.org/10.3390/jcm9030732