Parafoveal and Peripapillary Perfusion Predict Visual Field Recovery in Chiasmal Compression due to Pituitary Tumors

Abstract
1. Introduction
2. Materials and Methods
3. Results
4. Discussion
Author Contributions
Funding
Conflicts of Interest
References
- Danesh-Meyer, H.V.; Carroll, S.C.; Foroozan, R.; Savino, P.J.; Fan, J.; Jiang, Y.; Vander Hoorn, S. Relationship between retinal nerve fiber layer and visual field sensitivity as measured by optical coherence tomography in chiasmal compression. Investig. Ophthalmol. Vis. Sci. 2006, 47, 4827–4835. [Google Scholar] [CrossRef] [PubMed]
- Danesh-Meyer, H.V.; Papchenko, T.; Savino, P.J.; Law, A.; Evans, J.; Gamble, G.D. In vivo retinal nerve fiber layer thickness measured by optical coherence tomography predicts visual recovery after surgery for parachiasmal tumors. Investig. Ophthalmol. Vis. Sci. 2008, 49, 1879–1885. [Google Scholar] [CrossRef] [PubMed]
- Moon, C.H.; Hwang, S.C.; Kim, B.T.; Ohn, Y.H.; Park, T.K. Visual prognostic value of optical coherence tomography and photopic negative response in chiasmal compression. Investig. Ophthalmol. Vis. Sci. 2011, 52, 8527–8533. [Google Scholar] [CrossRef] [PubMed]
- Garcia, T.; Sanchez, S.; Litre, C.F.; Radoi, C.; Delemer, B.; Rousseaux, P.; Ducasse, A.; Arndt, C. Prognostic value of retinal nerve fiber layer thickness for postoperative peripheral visual field recovery in optic chiasm compression. J. Neurosurg. 2014, 121, 165–169. [Google Scholar] [CrossRef]
- Jacob, M.; Raverot, G.; Jouanneau, E.; Borson-Chazot, F.; Perrin, G.; Rabilloud, M.; Tilikete, C.; Bernard, M.; Vighetto, A. Predicting visual outcome after treatment of pituitary adenomas with optical coherence tomography. Am. J. Ophthalmol. 2009, 147, 64–70.e62. [Google Scholar] [CrossRef]
- Barzaghi, L.R.; Medone, M.; Losa, M.; Bianchi, S.; Giovanelli, M.; Mortini, P. Prognostic factors of visual field improvement after trans-sphenoidal approach for pituitary macroadenomas: Review of the literature and analysis by quantitative method. Neurosurg. Rev. 2012, 35, 369–379. [Google Scholar] [CrossRef]
- Yu, F.F.; Chen, L.L.; Su, Y.H.; Huo, L.H.; Lin, X.X.; Liao, R.D. Factors influencing improvement of visual field after trans-sphenoidal resection of pituitary macroadenomas: A retrospective cohort study. Int. J. Ophthalmol. 2015, 8, 1224–1228. [Google Scholar]
- Ohkubo, S.; Higashide, T.; Takeda, H.; Murotani, E.; Hayashi, Y.; Sugiyama, K. Relationship between macular ganglion cell complex parameters and visual field parameters after tumor resection in chiasmal compression. Jpn. J. Ophthalmol. 2012, 56, 68–75. [Google Scholar] [CrossRef]
- Monteiro, M.L.; Hokazono, K.; Fernandes, D.B.; Costa-Cunha, L.V.; Sousa, R.M.; Raza, A.S.; Wang, D.L.; Hood, D.C. Evaluation of inner retinal layers in eyes with temporal hemianopic visual loss from chiasmal compression using optical coherence tomography. Investig. Ophthalmol. Vis. Sci. 2014, 55, 3328–3336. [Google Scholar] [CrossRef]
- Yarmohammadi, A.; Zangwill, L.M.; Diniz-Filho, A.; Suh, M.H.; Yousefi, S.; Saunders, L.J.; Belghith, A.; Manalastas, P.I.; Medeiros, F.A.; Weinreb, R.N. Relationship between Optical Coherence Tomography Angiography Vessel Density and Severity of Visual Field Loss in Glaucoma. Ophthalmology 2016, 123, 2498–2508. [Google Scholar] [CrossRef]
- Gaier, E.D.; Wang, M.; Gilbert, A.L.; Rizzo, J.F., 3rd; Cestari, D.M.; Miller, J.B. Quantitative analysis of optical coherence tomographic angiography (OCT-A) in patients with non-arteritic anterior ischemic optic neuropathy (NAION) corresponds to visual function. PLoS ONE 2018, 13, e0199793. [Google Scholar] [CrossRef] [PubMed]
- Kwapong, W.R.; Peng, C.; He, Z.; Zhuang, X.; Shen, M.; Lu, F. Altered Macular Microvasculature in Neuromyelitis Optica Spectrum Disorders. Am. J. Ophthalmol. 2018, 192, 47–55. [Google Scholar] [CrossRef] [PubMed]
- Park, J.J.; Soetikno, B.T.; Fawzi, A.A. Characterization of the middle capillary plexus using optical coherence tomography angiography in healthy and diabetic eyes. Retina 2016, 36, 2039–2050. [Google Scholar] [CrossRef] [PubMed]
- Al-Sheikh, M.; Tepelus, T.C.; Nazikyan, T.; Sadda, S.R. Repeatability of automated vessel density measurements using optical coherence tomography angiography. Br. J. Ophthalmol. 2017, 101, 449–452. [Google Scholar] [CrossRef]
- Forte, R.; Haulani, H.; Dyrda, A.; Jurgens, I. Swept source optical coherence tomography angiography in patients treated with hydroxychloroquine: Correlation with morphological and functional tests. Br. J. Ophthalmol. 2019. [Google Scholar] [CrossRef]
- Ghahari, E.; Bowd, C.; Zangwill, L.M.; Proudfoot, J.; Hasenstab, K.A.; Hou, H.; Penteado, R.C.; Manalastas, P.I.C.; Moghimi, S.; Shoji, T.; et al. Association of Macular and Circumpapillary Microvasculature with Visual Field Sensitivity in Advanced Glaucoma. Am. J. Ophthalmol. 2019, 204, 51–61. [Google Scholar] [CrossRef]
- Higashiyama, T.; Ichiyama, Y.; Muraki, S.; Nishida, Y.; Ohji, M. Optical Coherence Tomography Angiography of Retinal Perfusion in Chiasmal Compression. Ophthalmic Surg. Lasers Imaging Retin. 2016, 47, 724–729. [Google Scholar] [CrossRef]
- Ghasemi Falavarjani, K.; Tian, J.J.; Akil, H.; Garcia, G.A.; Sadda, S.R.; Sadun, A.A. Swept-source optical coherence tomography angiography of the optic disk in optic neuropathy. Retina 2016, 36, S168–S177. [Google Scholar] [CrossRef]
- Wang, X.; Jia, Y.; Spain, R.; Potsaid, B.; Liu, J.J.; Baumann, B.; Hornegger, J.; Fujimoto, J.G.; Wu, Q.; Huang, D. Optical coherence tomography angiography of optic nerve head and parafovea in multiple sclerosis. Br. J. Ophthalmol. 2014, 98, 1368–1373. [Google Scholar] [CrossRef]
- Feucht, N.; Maier, M.; Lepennetier, G.; Pettenkofer, M.; Wetzlmair, C.; Daltrozzo, T.; Scherm, P.; Zimmer, C.; Hoshi, M.M.; Hemmer, B.; et al. Optical coherence tomography angiography indicates associations of the retinal vascular network and disease activity in multiple sclerosis. Mult. Scler. 2019, 25, 224–234. [Google Scholar] [CrossRef]
- Lee, G.I.; Park, K.A.; Oh, S.Y.; Kong, D.S. Analysis of Optic Chiasmal Compression Caused by Brain Tumors Using Optical Coherence Tomography Angiography. Sci. Rep. 2020, 10, 2088. [Google Scholar] [CrossRef] [PubMed]
- Gnanalingham, K.K.; Bhattacharjee, S.; Pennington, R.; Ng, J.; Mendoza, N. The time course of visual field recovery following transphenoidal surgery for pituitary adenomas: Predictive factors for a good outcome. J. Neurol. Neurosurg. Psychiatry 2005, 76, 415–419. [Google Scholar] [CrossRef] [PubMed]
- Yoneoka, Y.; Hatase, T.; Watanabe, N.; Jinguji, S.; Okada, M.; Takagi, M.; Fujii, Y. Early morphological recovery of the optic chiasm is associated with excellent visual outcome in patients with compressive chiasmal syndrome caused by pituitary tumors. Neurol. Res. 2015, 37, 1–8. [Google Scholar] [CrossRef] [PubMed]
- Lee, S.; Kim, S.J.; Yu, Y.S.; Kim, Y.H.; Paek, S.H.; Kim, D.G.; Jung, H.W. Prognostic factors for visual recovery after transsphenoidal pituitary adenectomy. Br. J. Neurosurg. 2013, 27, 425–429. [Google Scholar] [CrossRef] [PubMed]
- Danesh-Meyer, H.V.; Wong, A.; Papchenko, T.; Matheos, K.; Stylli, S.; Nichols, A.; Frampton, C.; Daniell, M.; Savino, P.J.; Kaye, A.H. Optical coherence tomography predicts visual outcome for pituitary tumors. J. Clin. Neurosci. 2015, 22, 1098–1104. [Google Scholar] [CrossRef] [PubMed]
- Park, H.H.; Oh, M.C.; Kim, E.H.; Kim, C.Y.; Kim, S.H.; Lee, K.S.; Chang, J.H. Use of optical coherence tomography to predict visual outcome in parachiasmal meningioma. J. Neurosurg. 2015, 123, 1489–1499. [Google Scholar] [CrossRef]
- Blanch, R.J.; Micieli, J.A.; Oyesiku, N.M.; Newman, N.J.; Biousse, V. Optical coherence tomography retinal ganglion cell complex analysis for the detection of early chiasmal compression. Pituitary 2018, 21, 515–523. [Google Scholar] [CrossRef]
- Moon, C.H.; Hwang, S.C.; Ohn, Y.H.; Park, T.K. The time course of visual field recovery and changes of retinal ganglion cells after optic chiasmal decompression. Investig. Ophthalmol. Vis. Sci. 2011, 52, 7966–7973. [Google Scholar] [CrossRef]
- Yum, H.R.; Park, S.H.; Park, H.Y.; Shin, S.Y. Macular Ganglion Cell Analysis Determined by Cirrus HD Optical Coherence Tomography for Early Detecting Chiasmal Compression. PLoS ONE 2016, 11, e0153064. [Google Scholar] [CrossRef]


| Patients (n = 57) | Healthy Controls (n = 42) | p value | |
|---|---|---|---|
| Age | 49 ± 13 | 49 ± 11 | 0.749 * |
| Gender (M/F) | 22/35 | 17/25 | 1.000 † |
| Spherical equivalent | −1.14 ± 1.98 | −1.32 ± 1.84 | 0.316 ‡ |
| Symptom duration (mon) | 5 ± 11 | - | |
| Preoperative VF (MD) | −7.27 ± 6.20 | 0.07 ± 1.18 | <0.001 ‡ |
| Patients (n = 57) | Healthy Controls (n = 42) | p value * | |
|---|---|---|---|
| RNFL thickness (μm) | 90.76 ± 10.68 | 99.96 ± 8.30 | <0.001 |
| GCC thickness (μm) | 75.85 ± 8.37 | 83.77 ± 5.91 | <0.001 |
| Vessel densities of SRCP (%) | 47.46 ± 2.03 | 48.67 ± 2.39 | 0.007 |
| Vessel densities of DRCP (%) | 48.77 ± 2.16 | 49.42 ± 2.18 | 0.141 |
| Vessel densities of RPC (%) | 56.91 ± 3.41 | 58.41 ± 2.55 | 0.020 |
| Univariate Analysis | Estimate | Standard Error | p Value |
|---|---|---|---|
| Gender | 0.002 | 0.998 | 0.998 |
| Age | 0.005 | 0.031 | 0.863 |
| Spherical equivalent | −0.282 | 0.202 | 0.169 |
| Symptom duration | −0.066 | 0.039 | 0.093 |
| Preoperative VF defects | 0.194 | 0.06 | 0.002 |
| pRNFL thickness | |||
| Average | 0.059 | 0.037 | 0.122 |
| Temporal | 0.025 | 0.024 | 0.314 |
| Inferior | 0.034 | 0.025 | 0.167 |
| Nasal | 0.062 | 0.038 | 0.107 |
| Superior | 0.013 | 0.023 | 0.587 |
| GCC thickness | |||
| Average | 0.066 | 0.05 | 0.192 |
| Temporal | 0.019 | 0.063 | 0.765 |
| Inferior | 0.056 | 0.049 | 0.258 |
| Nasal | 0.060 | 0.038 | 0.123 |
| Superior | 0.078 | 0.04 | 0.058 |
| SRCP | |||
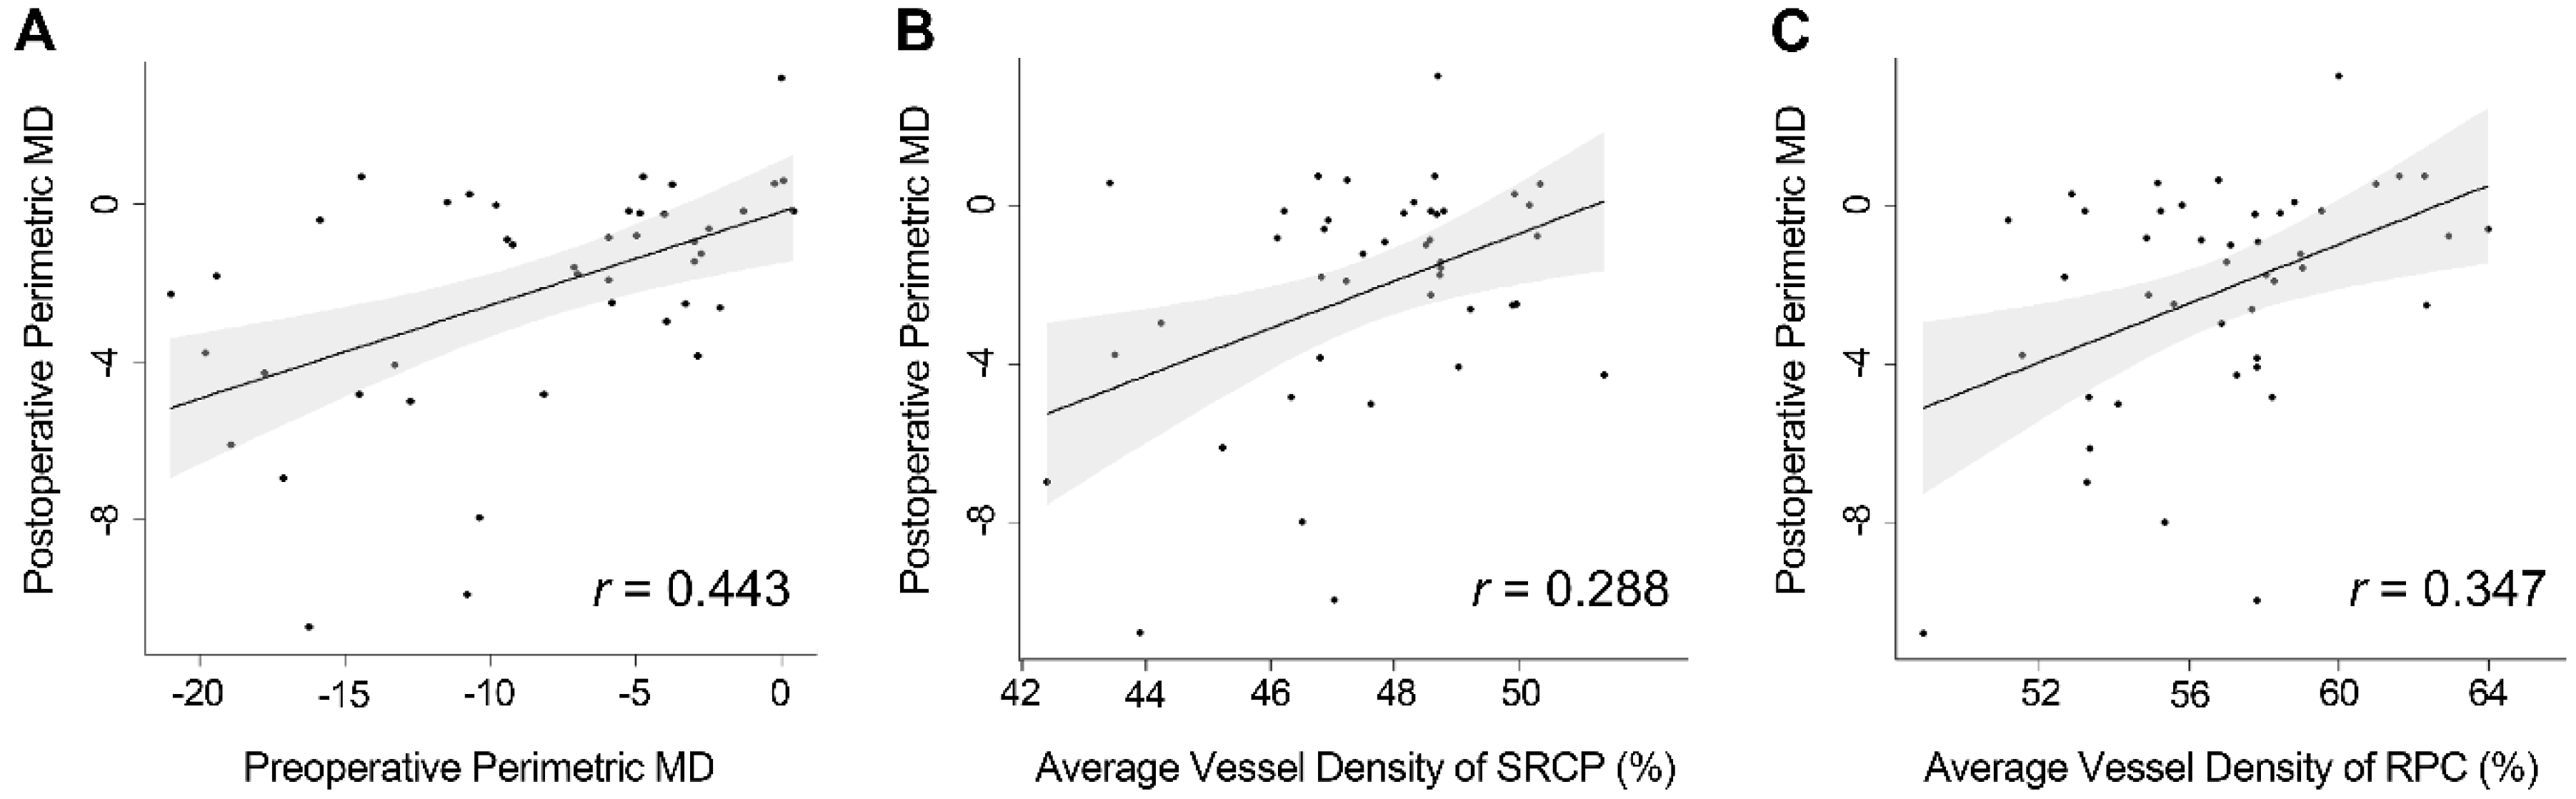
| Average | 0.468 | 0.19 | 0.017 |
| Temporal | 0.268 | 0.162 | 0.103 |
| Inferior | 0.232 | 0.126 | 0.072 |
| Nasal | 0.180 | 0.157 | 0.257 |
| Superior | 0.234 | 0.116 | 0.049 |
| DRCP | |||
| Average | 0.284 | 0.185 | 0.131 |
| Temporal | 0.123 | 0.141 | 0.386 |
| Inferior | 0.121 | 0.111 | 0.281 |
| Nasal | 0.159 | 0.130 | 0.227 |
| Superior | 0.109 | 0.125 | 0.388 |
| RPC | |||
| Average | 0.353 | 0.113 | 0.003 |
| Temporal | 0.142 | 0.082 | 0.088 |
| Inferior | 0.097 | 0.087 | 0.270 |
| Nasal | 0.129 | 0.064 | 0.051 |
| Superior | 0.138 | 0.063 | 0.032 |
| Model 1* | Model 2* | |||||
|---|---|---|---|---|---|---|
| Variables | Estimate | Standard Error | p Value | Estimate | Standard Error | p Value |
| Preoperative VF defects | 0.204 | 0.062 | 0.002 | 0.217 | 0.06 | 0.001 |
| Symptom duration | NS | NS | NS | NS | NS | NS |
| pRNFL thickness (nasal) | NS | NS | NS | NS | NS | NS |
| GCC thickness (superior) | NS | NS | NS | NS | NS | NS |
| RPC (average) (Model 1) | NS | NS | NS | - | - | - |
| RPC (superior) (Model 2) | - | - | - | NS | NS | NS |
| SRCP (average) (Model 1) | 0.444 | 0.191 | 0.025 | - | - | - |
| SRCP (superior) (Model 2) | - | - | - | 0.305 | 0.118 | 0.013 |
© 2020 by the authors. Licensee MDPI, Basel, Switzerland. This article is an open access article distributed under the terms and conditions of the Creative Commons Attribution (CC BY) license (http://creativecommons.org/licenses/by/4.0/).
Share and Cite
Lee, G.-I.; Park, K.-A.; Oh, S.Y.; Kong, D.-S. Parafoveal and Peripapillary Perfusion Predict Visual Field Recovery in Chiasmal Compression due to Pituitary Tumors. J. Clin. Med. 2020, 9, 697. https://doi.org/10.3390/jcm9030697
Lee G-I, Park K-A, Oh SY, Kong D-S. Parafoveal and Peripapillary Perfusion Predict Visual Field Recovery in Chiasmal Compression due to Pituitary Tumors. Journal of Clinical Medicine. 2020; 9(3):697. https://doi.org/10.3390/jcm9030697
Chicago/Turabian StyleLee, Ga-In, Kyung-Ah Park, Sei Yeul Oh, and Doo-Sik Kong. 2020. "Parafoveal and Peripapillary Perfusion Predict Visual Field Recovery in Chiasmal Compression due to Pituitary Tumors" Journal of Clinical Medicine 9, no. 3: 697. https://doi.org/10.3390/jcm9030697
APA StyleLee, G.-I., Park, K.-A., Oh, S. Y., & Kong, D.-S. (2020). Parafoveal and Peripapillary Perfusion Predict Visual Field Recovery in Chiasmal Compression due to Pituitary Tumors. Journal of Clinical Medicine, 9(3), 697. https://doi.org/10.3390/jcm9030697