Fourier-Domain OCT Imaging of the Ocular Surface and Tear Film Dynamics: A Review of the State of the Art and an Integrative Model of the Tear Behavior during the Inter-Blink Period and Visual Fixation

 ,
,  ,
,  , and
, and 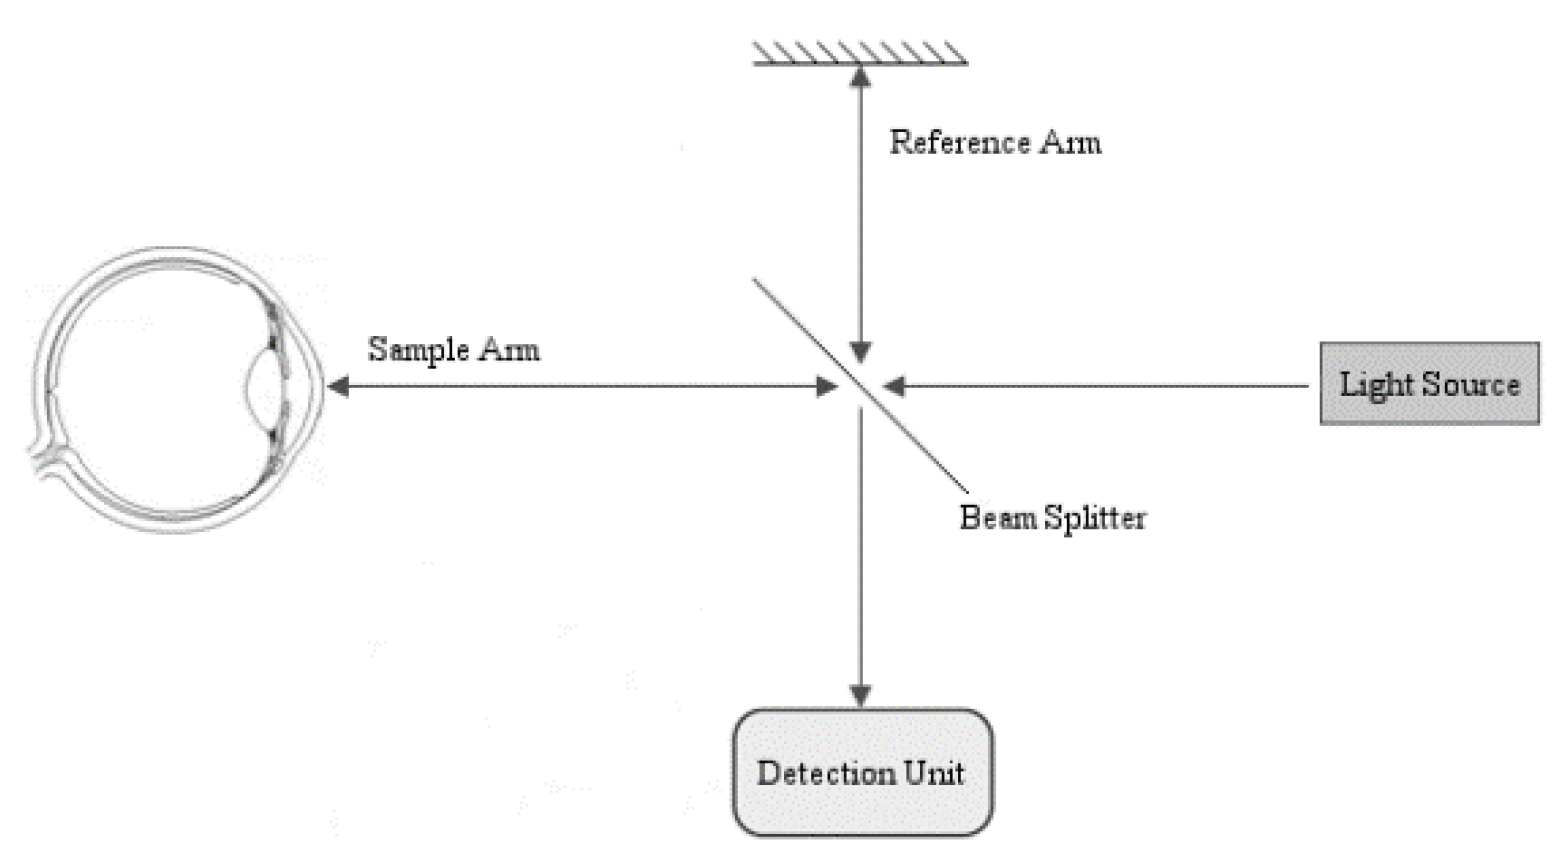
Abstract
1. Introduction
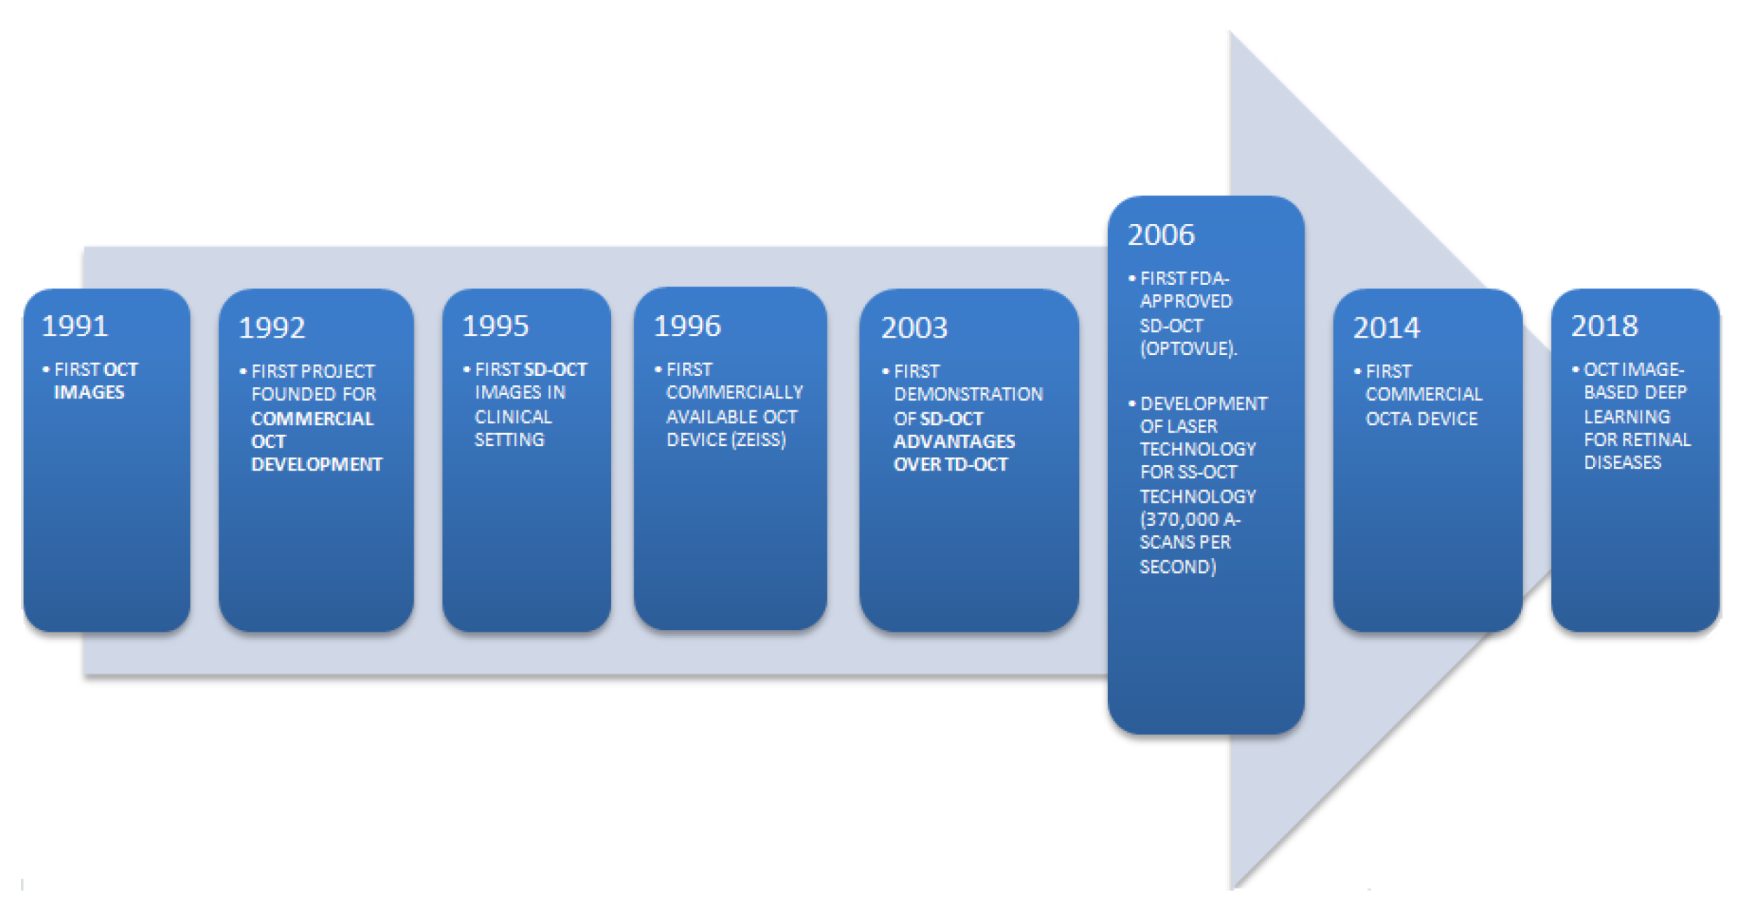
2. Literature Review
3. Technical Features of OCT Imaging
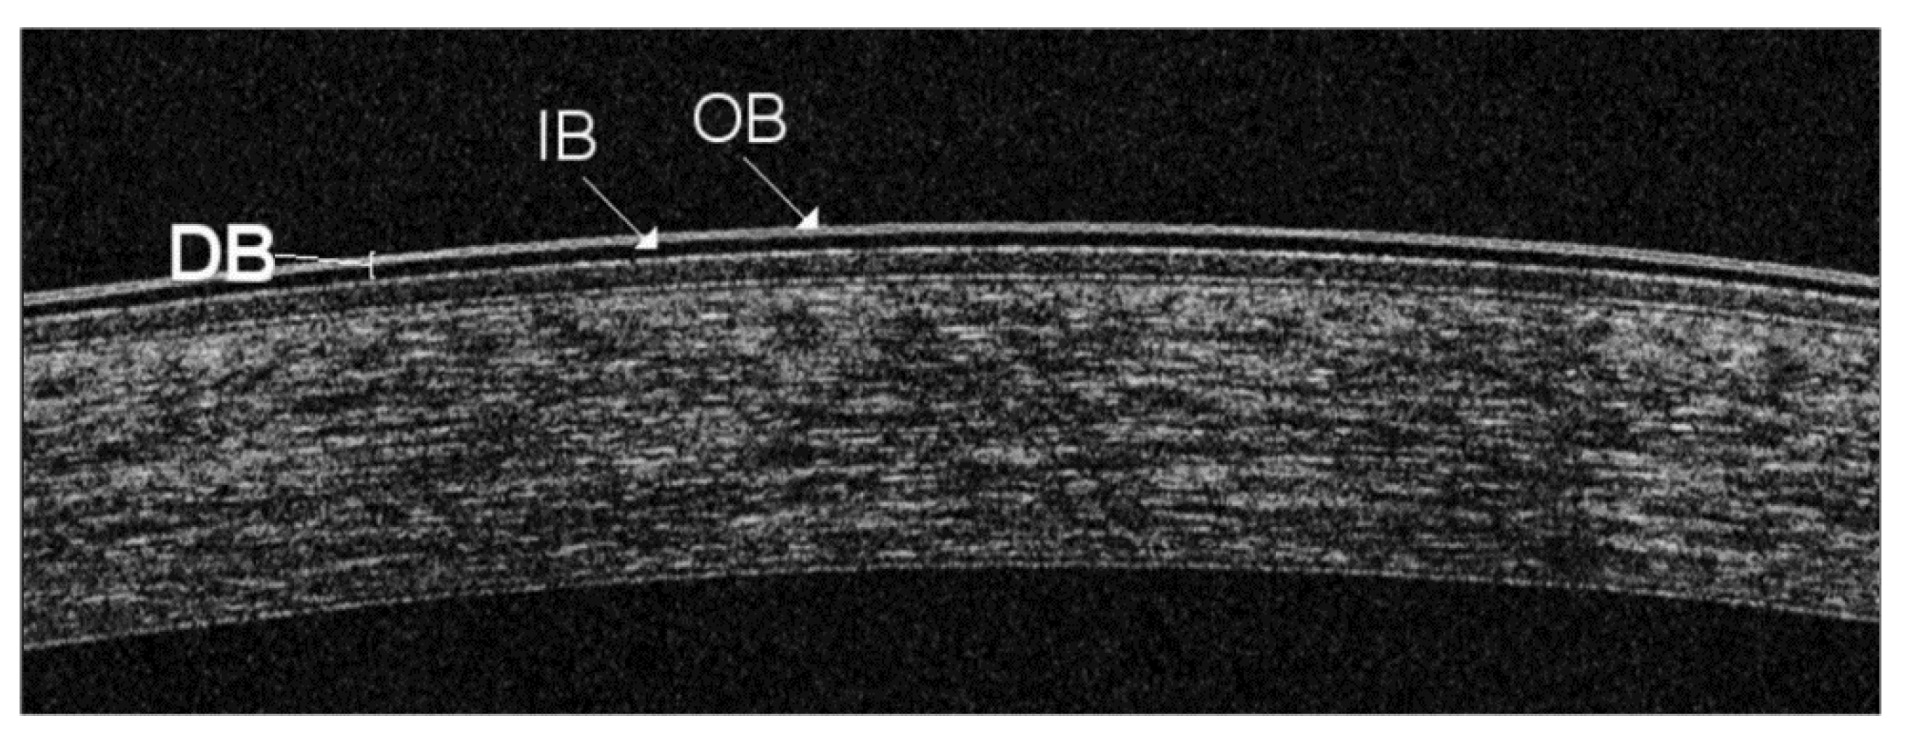
4. Structure and Appearance of the Tear Film
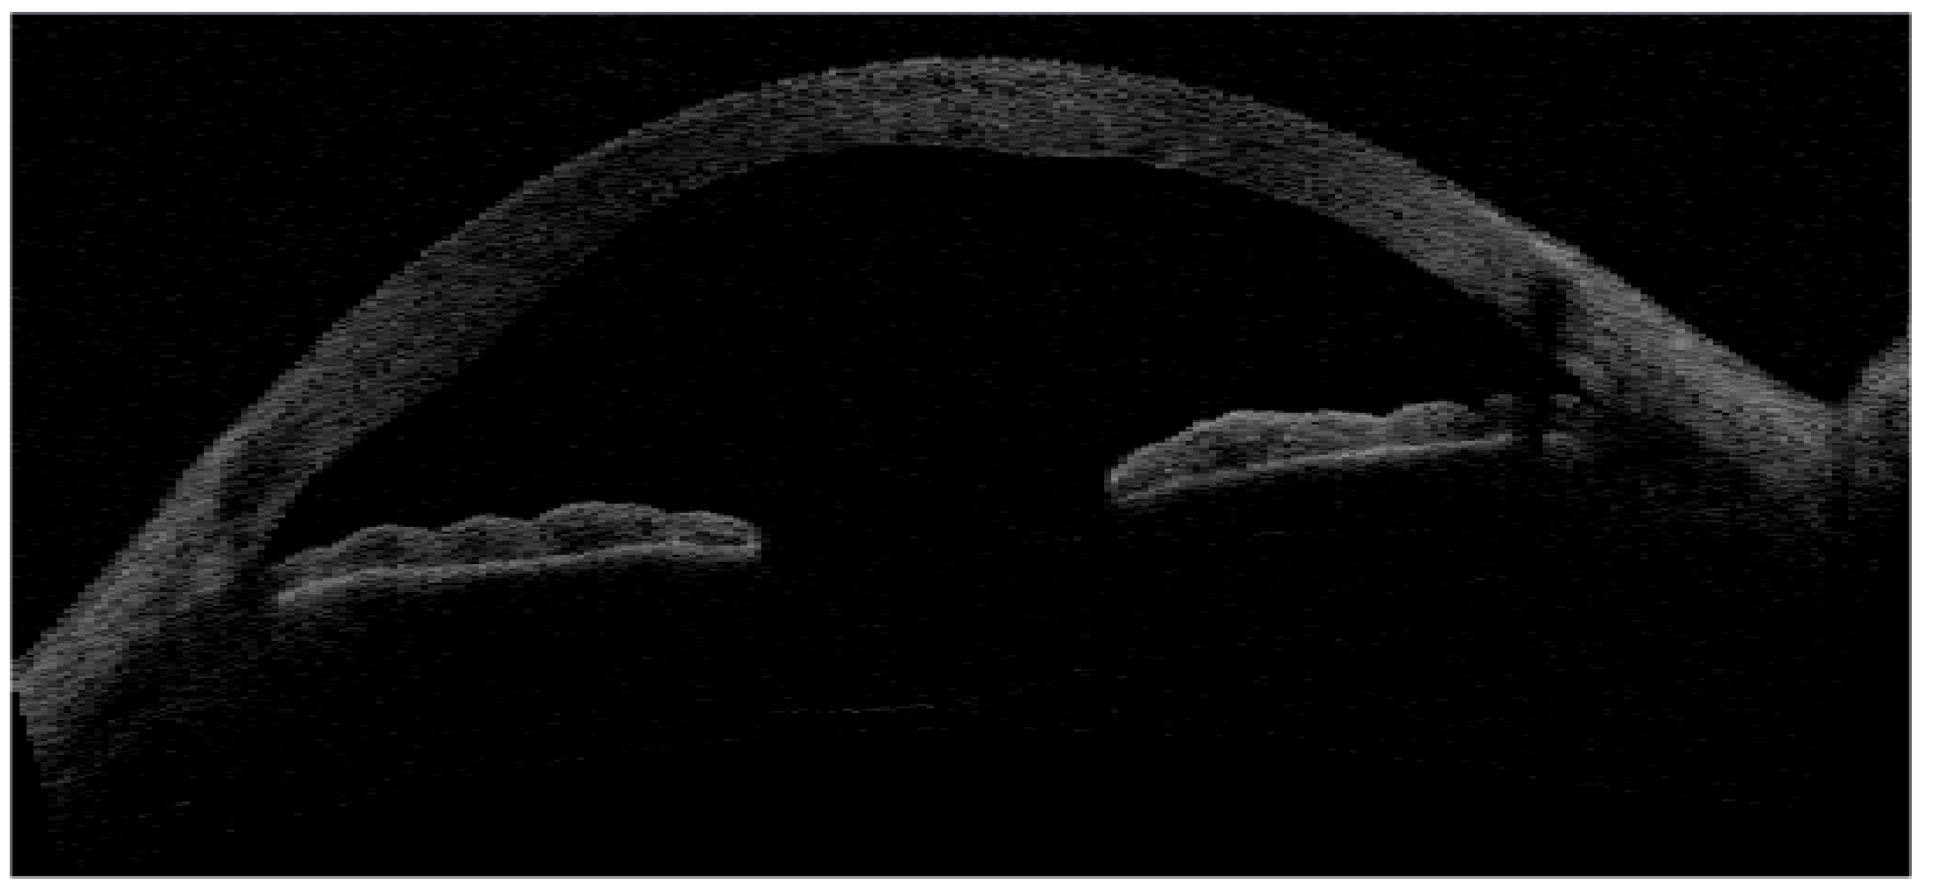
5. Tear Meniscus
6. Ocular Surface Epithelia
6.1. Cornea
6.2. Conjunctiva
6.3. Meibomian Glands
6.4. Other Structures of the Ocular Surface
7. Tear Film Dynamics
8. Integrative Model of Tear Film Behavior during the Inter-Blink Period
9. Conclusions and Future Directions
Author Contributions
Funding
Acknowledgments
Conflicts of Interest
References
- Barabino, S.; Chen, Y.; Chauhan, S.; Dana, R. Ocular surface immunity: Homeostatic mechanisms and their disruption in dry eye disease. Progr. Retin. Eye Res. 2012, 31, 271–285. [Google Scholar] [CrossRef] [PubMed]
- Bolanos-Jimenez, R.; Navas, A.; López-Lizárraga, E.P.; de Ribot, F.M.; Peña, A.; Graue-Hernández, E.O.; Garfias, Y. Ocular surface as barrier of innate immunity. Open Ophthalmol. J. 2015, 9, 49–55. [Google Scholar] [CrossRef] [PubMed]
- Foulks, G. Challenges and pitfalls in clinical trials of treatments for dry eye. Ocul. Surf. 2003, 1, 20–30. [Google Scholar] [CrossRef]
- Wolffsohn, J.S.; Arita, R.; Chalmers, R.; Djalilian, A.; Dogru, M.; Dumbleton, K.; Gupta, P.K.; Karpecki, P.; Lazreg, S.; Pult, H.; et al. TFOS DEWS II Diagnostic Methodology report. Ocul. Surf. 2017, 15, 539–574. [Google Scholar] [CrossRef]
- McGinnigle, S.; Naroo, S.A.; Eperjesi, F. Evaluation of dry eye. Surv. Ophthalmol. 2012, 57, 293–316. [Google Scholar] [CrossRef]
- Farci, R.; Napoli, P.E.; Fossarello, M. An uncommon case of intermittent Pourfour du Petit Syndrome associated with acute angle-closure glaucoma successfully treated by laser iridotomy. Int. Ophthalmol. 2018, 38, 1779–1781. [Google Scholar] [CrossRef]
- Iovino, C.; Fossarello, M.; Giannaccare, G.; Pellegrini, M.; Braghiroli, M.; Demarinis, G.; Napoli, P.E. Corneal endothelium features in Fuchs’ Endothelial Corneal Dystrophy: A preliminary 3D anterior segment optical coherence tomography study. PLoS ONE 2018, 13, e0207891. [Google Scholar] [CrossRef]
- Napoli, P.E.; Cuccu, A.; Farci, R.; Fossarello, M. Simultaneous occlusion of three cilioretinal arteries following scleral buckling surgery under local anesthesia. Int. Med. Case Rep. J. 2016, 9, 285. [Google Scholar] [CrossRef]
- de Boer, J.F.; Cense, B.; Park, B.H.; Pierce, M.C.; Tearney, G.J.; Bouma, B.E. Improved signal-to-noise ratio in spectral-domain compared with time-domain optical coherence tomography. Opt. Lett. 2003, 28, 2067–2069. [Google Scholar] [CrossRef]
- Leitgeb, R.; Hitzenberger, C.K.; Fercher, A.F. Performance of fourier domain vs. time domain optical coherence tomography. Opt. Express. 2003, 11, 889–894. [Google Scholar] [CrossRef]
- Kolb, J.P.; Klein, T.; Kufner, C.L.; Wieser, W.; Neubauer, A.S.; Huber, R. Ultrawidefield retinal MHz-OCT imaging with up to 100 degrees viewing angle. Biomed Optic. Express 2015, 6, 1534–1552. [Google Scholar] [CrossRef] [PubMed]
- Ang, M.; Baskaran, M.; Werkmeister, R.M.; Chua, J.; Schmidl, D.; Aranha Dos Santos, V.; Garhöfer, G.; Mehta, J.S.; Schmetterer, L. Anterior segment optical coherence tomography. Prog. Retin. Eye Res. 2018. [Google Scholar] [CrossRef] [PubMed]
- Huang, D.; Swanson, E.A.; Lin, C.P.; Schuman, J.S.; Stinson, W.G.; Chang, W.; Hee, M.R.; Flotte, T.; Gregory, K.; Puliafito, C.A.; et al. Optical coherence tomography. Science 1991, 254, 1178–1181. [Google Scholar] [CrossRef]
- Potsaid, B.; Baumann, B.; Huang, D.; Barry, S.; Cable, A.E.; Schuman, J.S.; Duker, J.S.; Fujimoto, J.G. Ultrahigh speed 1050nm swept source/Fourier domain OCT retinal and anterior segment imaging at 100,000 to 400,000 axial scans per second. Opt. Express 2010, 18, 20029–20048. [Google Scholar] [CrossRef]
- Galantuomo, M.S.; Fossarello, M.; Cuccu, A.; Farci, R.; Preising, M.N.; Lorenz, B.; Napoli, P.E. Rebound macular edema following oral acetazolamide therapy for juvenile X-linked retinoschisis in an Italian family. Clin. Ophthalmol. 2016, 10, 2377. [Google Scholar] [CrossRef]
- Giannaccare, G.; Pellegrini, M.A.; Sebastiani, S.T.; Bernabei, F.; Moscardelli, F.; Iovino, C.; Napoli, P.E.; Campos, E. Choroidal vascularity index quantification in geographic atrophy using binarization of enhanced-depth imaging optical coherence tomographic scans. Retina 2019. [Google Scholar] [CrossRef]
- Izatt, J.A.; Hee, M.R.; Swanson, E.A.; Lin, C.P.; Huang, D.; Schuman, J.S.; Puliafito, C.A.; Fujimoto, J.G. Micrometer-scale resolution imaging of the anterior eye in vivo with optical coherence tomography. Arch. Ophthalmol. 1994, 112, 1584–1589. [Google Scholar] [CrossRef]
- Rolando, M.; Zierhut, M. The ocular surface and tear film and their dysfunction in dry eye disease. Surv. Ophthalmol. 2001, 45, S203–S210. [Google Scholar] [CrossRef]
- Bron, A.J.; de Paiva, C.S.; Chauhan, S.K.; Bonini, S.; Gabison, E.E.; Jain, S.; Knop, E.; Markoulli, M.; Ogawa, Y.; Perez, V.; et al. Tfos dews II pathophysiology report. Ocular. Surf. 2017, 15, 438–510. [Google Scholar] [CrossRef]
- Liu, H.; Thibos, L.; Begley, C.G.; Bradley, A. Measurement of the time course of optical quality and visual deterioration during tear break-up. Invest. Ophthalmol. Vis. Sci. 2010, 51, 3318–3326. [Google Scholar] [CrossRef]
- Denoyer, A.; Rabut, G.; Baudouin, C. Tear film aberration dynamics and vision related quality of life in patients with dry eye disease. Ophthalmology 2012, 119, 1811–1818. [Google Scholar] [CrossRef] [PubMed]
- Wolff, E. The muco-cutaneous junction of the lid margin and the distribution of the tear fluid. Trans. Ophthalmol. Soc. UK 1946, 66, 291–308. [Google Scholar]
- Doane, M.G. Abnormalities of the structure of the superficial lipid layer on the in vivo dry-eye. Adv. Exp. Med. Biol. 1994, 350, 489–493. [Google Scholar] [PubMed]
- Willcox, M.D.P.; Argüeso, P.; Georgiev, G.A.; Holopainen, J.M.; Laurie, G.W.; Millar, T.J.; Papas, E.B.; Rolland, J.P.; Schmidt, T.A.; Stahl, U.; et al. TFOS DEWS II tear film report. Ocul. Surf. 2017, 15, 366–403. [Google Scholar] [CrossRef] [PubMed]
- Dilly, P.N. Structure and function of the tear film. Adv. Exp. Med. Biol. 1994, 350, 239–247. [Google Scholar] [PubMed]
- Cher, I. A new look at lubrication of the ocular surface: Fluid mechanics behind the blinking eyelids. Ocul. Surf. 2008, 6, 79–86. [Google Scholar] [CrossRef]
- Napoli, P.E.; Coronella, F.; Satta, G.M.; Zucca, I.A.; Fossarello, M. A novel OCT technique to measure in vivo the corneal adhesiveness for sodium carboxymethylcellulose in humans and its validity in the diagnosis of dry eye. Invest. Ophthalmol. Vis. Sci. 2014, 55, 3179–3185. [Google Scholar] [CrossRef][Green Version]
- Braun, R.J.; Fitt, A.D. Modelling drainage of the precorneal tear film after a blink. Math. Med. Biol. 2003, 20, 1–28. [Google Scholar] [CrossRef]
- Garrett, Q.; Simmons, P.A.; Xu, S. Carboxymethylcellulose binds to human corneal epithelial cells and is a modulator of corneal epithelial wound healing. Invest. Ophthalmol. Vis. Sci. 2007, 48, 1559–1567. [Google Scholar] [CrossRef]
- Napoli, P.E.; Coronella, F.; Satta, G.M.; Galantuomo, M.S.; Fossarello, M. Evaluation of the adhesive properties of the cornea by means of optical coherence tomography in patients with meibomian gland dysfunction and lacrimal tear deficiency. PLoS ONE 2014, 9, e115762. [Google Scholar] [CrossRef]
- Napoli, P.E.; Nioi, M.; d’Aloja, E.; Fossarello, M. The Bull’s eye pattern of the tear Film in Humans during Visual Fixation on en-Face optical Coherence tomography. Sci. Rep. 2019, 9, 1413. [Google Scholar] [CrossRef] [PubMed]
- Birt, B.; Cowling, I.; Coyne, S. UVR reflections at the surface of the eye. J. Photochem. Photobiol. 2004, 77, 71–77. [Google Scholar] [CrossRef] [PubMed]
- Kohlhaas, M. Kollagen-Crosslinking mit Riboflavin und UVA-LichtbeimKeratokonus. Der. Ophthalmol. 2008, 105, 785–796. [Google Scholar] [CrossRef] [PubMed]
- Kumar, A.; Mazzanti, M.; Mistrik, M.; Kosar, M.; Beznoussenko, G.V.; Mironov, A.A.; Garrè, M.; Parazzoli, D.; Shivashankar, G.V.; Scita, G.; et al. ATR mediates a checkpoint at the nuclear envelope in response to mechanical stress. Cell 2014, 158, 633–646. [Google Scholar] [CrossRef]
- Martinez-Conde, S.; Macknik, S.L.; Hubel, D.H. The role of fixational eye movements in visual perception. Nat. Rev. Neurosci. 2004, 5, 229–240. [Google Scholar] [CrossRef]
- Bai, Y.; Nichols, J.J. Advances in thickness measurements and dynamic visualization of the tear film using non-invasive optical approaches. Prog. Retin. Eye Res. 2017, 58, 28–44. [Google Scholar] [CrossRef]
- Wang, J.; Fonn, D.; Simpson, T.L.; Jones, L. Precorneal and pre- and postlens tear film thickness measured indirectly with optical coherence tomography. Invest Ophthalmol. Vis. Sci. 2003, 44, 2524–2528. [Google Scholar] [CrossRef]
- Wang, J.; Aquavella, J.; Palakuru, J.; Chung, S. Repeated measurements of dynamic tear distribution on the ocular surface after instillation of artificial tears. Invest Ophthalmol. Vis. Sci. 2006, 47, 3325–3329. [Google Scholar] [CrossRef]
- Yadav, R.; Lee, K.S.; Rolland, J.P.; Zavislan, J.M.; Aquavella, J.V.; Yoon, G. Micrometer axial resolution OCT for corneal imaging. Biomed Optic. Express 2011, 2, 3037–3046. [Google Scholar] [CrossRef]
- King-Smith, P.E.; Nichols, J.J.; Nichols, K.K.; Fink, B.A.; Braun, R.J. Contributions of evaporation and other mechanisms to tear film thinning and break-up. Optom. Vis. Sci. 2008, 85, 623–630. [Google Scholar] [CrossRef]
- Werkmeister, R.M.; Alex, A.; Kaya, S.; Unterhuber, A.; Hofer, B.; Riedl, J.; Bronhagl, M.; Vietauer, M.; Schmidl, D.; Schmoll, T.; et al. Measurement of tear film thickness using ultrahigh-resolution optical coherence tomography ultrahigh-resolution OCT measurement of tear film. Investig. Ophthalmol. Vis. Sci. 2013, 54, 5578–5583. [Google Scholar] [CrossRef] [PubMed]
- Napoli, P.E.; Satta, G.M.; Coronella, F.; Fossarello, M. Spectral-domain optical coherence tomography study on dynamic changes of human tears after instillation of artificial tears. Investig. Ophthalmol. Vis. Sci. 2014, 55, 4533–4540. [Google Scholar] [CrossRef][Green Version]
- Napoli, P.E.; Zucca, I.; Fossarello, M. Qualitative and quantitative analysis of filtering blebs with optical coherence tomography. Can. J. Ophthalmol. 2014, 49, 210–216. [Google Scholar] [CrossRef] [PubMed]
- Yokoi, N.; Bron, A.J.; Tiffany, J.M.; Maruyama, K.; Komuro, A.; Kinoshita, S. Relationship between tear volume and tear meniscus curvature. Arch. Ophthalmol. 2004, 122, 1265–1269. [Google Scholar] [CrossRef] [PubMed][Green Version]
- Wang, J.; Aquavella, J.; Palakuru, J.; Chung, S.; Feng, C. Relationships between central tear film thickness and tear menisci of the upper and lower eyelids. Invest. Ophthalmol. Vis. Sci. 2006, 47, 4349–4355. [Google Scholar] [CrossRef]
- Pellicer, J.; Garcia-Morales, V.; Hernandez, M.J. On the demonstration of the Young-Laplace equation in introductory physics courses. Phys. Educ. 2000, 35, 126. [Google Scholar] [CrossRef]
- Shen, M.; Li, J.; Wang, J.; Ma, H.; Cai, C.; Tao, A.; Yuan, Y.; Lu, F. Upper and lower tear menisci in the diagnosis of dry eye. Invest. Ophthalmol. Vis. Sci. 2009, 50, 2722–2726. [Google Scholar] [CrossRef]
- Chan, H.H.; Zhao, Y.; Tun, T.A.; Tong, L. Repeatability of tear meniscus evaluation using spectral-domain Cirrus(R) HD-OCT and time-domain Visante(R) OCT. Cont. Lens Anterior Eye 2015, 38, 368–372. [Google Scholar] [CrossRef]
- Ibrahim, O.M.; Dogru, M.; Takano, Y.; Satake, Y.; Wakamatsu, T.H.; Fukagawa, K.; Tsubota, K.; Fujishima, H. Application of visante optical coherence tomography tear meniscus height measurement in the diagnosis of dry eye disease. Ophthalmology 2010, 117, 1923–1929. [Google Scholar] [CrossRef]
- Pult, H.; Riede-Pult, B.H. Impact of conjunctival folds on central tear meniscus height. Invest. Ophthalmol. Vis. Sci. 2015, 56, 1459–1466. [Google Scholar] [CrossRef][Green Version]
- Tittler, E.H.; Bujak, M.C.; Nguyen, P.; Zhang, X.; Li, Y.; Yiu, S.C.; Huang, D. Between-grader repeatability of tear meniscus measurements using Fourier-domain OCT in patients with dry eye. Ophthalmic Surg. Lasers Imaging 2011, 42, 423–427. [Google Scholar] [CrossRef] [PubMed]
- Bartuzel, M.M.; Szczesna-Iskander, D.H.; Iskander, D.R. Automatic dynamic tear meniscus measurement in optical coherence tomography. Biomed Optic. Express 2014, 5, 2759–2768. [Google Scholar] [CrossRef]
- Zheng, X.; Kamao, T.; Yamaguchi, M.; Sakane, Y.; Goto, T.; Inoue, Y.; Shiraishi, A.; Ohashi, Y. New method for evaluation of early phase tear clearance by anterior segment optical coherence tomography. Acta Ophthalmol. 2014, 92, 105–111. [Google Scholar] [CrossRef] [PubMed]
- Raj, A.; Dhasmana, R.; Nagpal, R.C. Anterior segment optical coherence tomography for tear meniscus evaluation and its correlation with other tear variables in healthy individuals. J. Clin. Diagn. Res. 2016, 10, NC01–04. [Google Scholar] [CrossRef] [PubMed]
- Sizmaz, S.; Altan-Yaycioglu, R.; Bakiner, O.S.; Bozkirli, E.; Coban-Karatas, M.; Ulas, B. Assessment of tear meniscus with optical coherence tomography in thyroid-associated ophtalmopathy. Curr. Eye Res. 2014, 39, 323–328. [Google Scholar] [CrossRef]
- Tung, C.I.; Perin, A.F.; Gumus, K.; Pflugfelder, S.C. Tear meniscus dimensions in tear dysfunction and their correlation with clinical parameters. Am. J. Ophthalmol. 2014, 157, 301–310.e301. [Google Scholar] [CrossRef]
- Francoz, M.; Karamoko, I.; Baudouin, C.; Labbé, A. Ocular surface epithelial thickness evaluation with spectral-domain optical coherence tomography. Invest. Ophthalmol. Vis. Sci. 2011, 52, 9116–9123. [Google Scholar] [CrossRef]
- Rocha, K.M.; Perez-Straziota, C.E.; Stulting, R.D.; Randleman, J.B. SD-OCT analysis of regional epithelial thickness profiles in keratoconus, postoperative corneal ectasia, and normal eyes. J. Refract. Surg. 2013, 29, 173–179. [Google Scholar] [CrossRef]
- Napoli, P.E.; Nioi, M.; d’Aloja, E.; Fossarello, M. Post-mortem corneal thickness measurements with a portable optical coherence tomography system: A reliability study. Sci. Rep. 2016, 6, 30428. [Google Scholar] [CrossRef]
- Nioi, M.; Napoli, P.E.; Paribello, F.; Demontis, R.; De Giorgio, F.; Porru, E.; Fossarello, M.; d’Aloja, E. Use of Optical Coherence Tomography on detection of postmortem Ocular findings: Pilot data from two cases. J. Integr. OMICS 2018, 8, 5–7. [Google Scholar] [CrossRef]
- Nioi, M.; Napoli, P.E.; Demontis, R.; Locci, E.; Fossarello, M.; d’Aloja, E. Morphological analysis of corneal findings modifications after death: A preliminary OCT study on an animal model. Exp. Eye Res. 2018, 169, 20–27. [Google Scholar] [CrossRef] [PubMed]
- King-Smith, P.E.; Kimball, S.H.; Nichols, J.J. Tear film interferometry and corneal surface roughness. Invest. Ophthalmol. Vis. Sci. 2014, 55, 2614–2618. [Google Scholar] [CrossRef] [PubMed]
- Grieve, K.; Ghoubay, D.; Georgeon, C.; Latour, G.; Nahas, A.; Plamann, K.; Crotti, C.; Bocheux, R.; Borderie, M.; Nguyen, T.M.; et al. Stromal striae: A new insight into corneal physiology and mechanics. Sci. Rep. 2017, 7, 13584. [Google Scholar] [CrossRef]
- Nioi, M.; Napoli, P.E.; Mayerson, S.M.; Fossarello, M.; d’Aloja, E. Optical coherence tomography in forensic sciences: A review of the literature. Forensic Sci. Med. Pathol. 2019, 15, 445–452. [Google Scholar] [CrossRef]
- Fuentes, E.; Sandali, O.; El Sanharawi, M.; Basli, E.; Hamiche, T.; Goemaere, I.; Borderie, V.; Bouheraoua, N.; Laroche, L. Anatomic predictive factors of acute corneal hydrops in keratoconus: An optical coherence tomography study. Ophthalmology 2015, 122, 1653–1659. [Google Scholar] [CrossRef]
- Siebelmann, S.; Scholz, P.; Sonnenschein, S.; Bachmann, B.; Matthaei, M.; Cursiefen, C.; Heindl, L.M. Anterior segment optical coherence tomography for the diagnosis of corneal dystrophies according to the IC3D classification. Surv. Ophthalmol. 2018, 63, 365–380. [Google Scholar] [CrossRef]
- Nanji, A.A.; Sayyad, F.E.; Galor, A.; Dubovy, S.; Karp, C.L. High-resolution optical coherence tomography as an adjunctive tool in the diagnosis of corneal and conjunctival pathology. Ocul. Surf. 2015, 13, 226–235. [Google Scholar] [CrossRef]
- Chandapura, R.S.; Shetty, R.; Shroff, R.; Shilpy, N.; Francis, M.; Sinha Roy, A. OCT layered tomography of the cornea provides new insights on remodeling after photorefractive keratectomy. J. Biophot. 2018, 11, e201700027. [Google Scholar] [CrossRef]
- Bata, A.M.; Witkowska, K.J.; Wozniak, P.A.; Fondi, K.; Schmidinger, G.; Pircher, N.; Szegedi, S.; dos Santos, V.A.; Pantalon, A.; Werkmeister, R.M.; et al. Effect of a matrix therapy agent on corneal epithelial healing after standard collagen cross-linking in patients with keratoconus: A randomized clinical trial. JAMA Ophthalmol. 2016, 134, 1169–1176. [Google Scholar] [CrossRef]
- Napoli, P.E.; Nioi, M.; Iovino, C.; Sanna, R.; d’Aloja, E.; Fossarello, M. Ocular surface and respiratory tract damages from occupational, sub-chronic exposure to fluorspar: Case report and other considerations. Int.Ophthalmol. 2018, 39, 1175–1178. [Google Scholar] [CrossRef]
- Veres, A.; Tapasztó, B.; Kosina-Hagyó, K.; Somfai, G.M.; Németh, J. Imaging lid-parallel conjunctival folds with OCT and comparing its grading with the slit lamp classification in dry eye patients and normal subjects. Invest. Ophthalmol. Vis. Sci. 2011, 52, 2945–2951. [Google Scholar] [CrossRef] [PubMed][Green Version]
- Gumus, K.; Pflugfelder, S.C. Increasing prevalence and severity of conjunctivochalasis with aging detected by anterior segment optical coherence tomography. Am. J. Ophthalmol. 2013, 155, 238–242. [Google Scholar] [CrossRef] [PubMed]
- Qiu, W.; Zhang, M.; Xu, T.; Liu, Z.; Lv, H.; Wang, W.; Li, X. Evaluation of the effects of conjunctivochalasis excision on tear stability and contrast sensitivity. Sci. Rep. 2016, 6, 37570. [Google Scholar] [CrossRef] [PubMed]
- Kieval, J.Z.; Karp, C.L.; Shousha, M.A.; Galor, A.; Hoffman, R.A.; Dubovy, S.R.; Wang, J. Ultra-high resolution optical coherence tomography for differentiation of ocular surface squamous neoplasia and pterygia. Ophthalmology 2012, 119, 481–486. [Google Scholar] [CrossRef] [PubMed]
- Ong, S.S.; Vora, G.K.; Gupta, P.K. Anterior segment imaging in ocular surface squamous neoplasia. J. Ophthalmol. 2016, 2016, 5435092. [Google Scholar] [CrossRef]
- Sayed-Ahmed, I.O.; Palioura, S.; Galor, A.; Karp, C.L. Diagnosis and medical management of ocular surface squamous neoplasia. Expert. Rev. Ophthalmol. 2017, 12, 11–19. [Google Scholar] [CrossRef]
- Napoli, P.E.; Sanna, R.; Iovino, C.; Fossarello, M. Resolution of pinguecula-related dry eye disease after argon laser photocoagulation. Int. Med. Case Rep. J. 2017, 10, 247. [Google Scholar] [CrossRef]
- Knop, E.; Knop, N.; Millar, T.; Obata, H.; Sullivan, D.A. The international workshop on meibomian gland dysfunction: Report of the subcommittee on anatomy, physiology, and pathophysiology of the meibomian gland. Invest. Ophthalmol. Vis. Sci. 2011, 52, 1938–1978. [Google Scholar] [CrossRef]
- Cerretani, C.F.; Ho, N.H.; Radke, C.J. Water-evaporation reduction by duplex films: Application to the human tear film. Adv. Colloid Interface Sci. 2013, 197–198, 33–57. [Google Scholar] [CrossRef]
- Cwiklik, L. Tear film lipid layer: A molecular level view. Biochim. Biophys. Acta Biomembr. 2016, 1858, 2421–2430. [Google Scholar] [CrossRef]
- Dursun, D.; Monroy, D.; Knighton, R.; Tervo, T.; Vesaluoma, M.; Carraway, K.; Feuer, W.; Pflugfelder, S.C. The effects of experimental tear film removal on corneal surface regularity and barrier function. Ophthalmology 2000, 107, 1754–1760. [Google Scholar] [CrossRef]
- Wise, R.J.; Sobel, R.K.; Allen, R.C. Meibography: A review of techniques and technologies. Saudi J. Ophthalmol. 2012, 26, 349–356. [Google Scholar] [CrossRef] [PubMed]
- Hwang, H.S.; Park, C.W.; Joo, C.K. Novel noncontact meibography with anterior segment optical coherence tomography: Hosikmeibography. Cornea 2013, 32, 40–43. [Google Scholar] [CrossRef]
- Hwang, H.S.; Shin, J.G.; Lee, B.H.; Eom, T.J.; Joo, C.K. In vivo 3D meibography of the human eyelid using real time imaging Fourier-domain OCT. PLoS ONE 2013, 8, 67143. [Google Scholar] [CrossRef]
- Liang, Q.; Pan, Z.; Zhou, M.; Zhang, Y.; Wang, N.; Li, B.; Baudouin, C.; Labbé, A. Evaluation of optical coherence tomography meibography in patients with obstructive meibomian gland dysfunction. Cornea 2015, 34, 1193–1199. [Google Scholar] [CrossRef]
- Yoo, Y.S.; Na, K.S.; Byun, Y.S.; Shin, J.G.; Lee, B.H.; Yoon, G.; Eom, T.J.; Joo, C.K. Examination of gland dropout detected on infrared meibography by using optical coherence tomography meibography. Ocul. Surf. 2017, 15, 130–138. [Google Scholar] [CrossRef]
- Napoli, P.E.; Coronella, F.; Satta, G.M.; Iovino, C.; Sanna, R.; Fossarello, M. A simple novel technique of infrared meibography by means of spectral-domain optical coherence tomography: A cross-sectional clinical study. PLoS ONE 2016, 11, e0165558. [Google Scholar] [CrossRef]
- Doh, S.H.; Kim, E.C.; Chung, S.Y.; Kim, M.S.; Chung, S.K.; Shin, M.C.; Hwang, H.S. Optical coherence tomography imaging of human lacrimal glands: An in vivo study. Ophthalmology 2015, 122, 2364–2366. [Google Scholar] [CrossRef]
- Zheng, X.; Goto, T.; Shiraishi, A.; Nakaoka, Y. New method to analyze sagittal images of upper eyelid obtained by anterior segment optical coherence tomography. Orbit 2019, 18, 1–7. [Google Scholar] [CrossRef]
- Allam, R.S.; Ahmed, R.A. Evaluation of the lower punctum parameters and morphology using spectral domain anterior segment optical coherence tomography. J. Ophthalmol. 2015, 2015, 591845. [Google Scholar] [CrossRef]
- Bizheva, K.; Hutchings, N.; Sorbara, L.; Moayed, A.A.; Simpson, T. In vivo volumetric imaging of the human corneo-scleral limbus with spectral domain OCT. Biomed. Optic. Express 2011, 2, 1702–1794. [Google Scholar] [CrossRef] [PubMed]
- Ghouali, W.; Hassani, R.T.; Djerada, Z.; Liang, H.; El Sanharawi, M.; Labbé, A.; Baudouin, C. In vivo imaging of palisades of Vogt in dry eye versus normal subjects using en-face spectral-domain optical coherence tomography. PLoS ONE 2017, 12, e0187864. [Google Scholar] [CrossRef] [PubMed]
- Tomlinson, A.; Khanal, S. Assessment of tear film dynamics: Quantification approach. Ocular. Surf. 2005, 3, 81–95. [Google Scholar] [CrossRef]
- De Paiva, C.S.; Pflugfelder, S.C. Tear clearance implications for ocular surface health. Exp. Eye Res. 2004, 78, 395–397. [Google Scholar] [CrossRef]
- Garaszczuk, I.K.; Montes Mico, R.; Iskander, D.R.; Expósito, A.C. The tear turnover and tear clearance tests–a review. Expert Rev. Med. Devices 2018, 15, 219–229. [Google Scholar] [CrossRef] [PubMed]
- Macri, A.; Pflugfelder, S. Correlation of the Schirmer 1 and fluorescein clearance tests with the severity of corneal epithelial and eyelid disease. Arch. Ophthalmol. 2000, 118, 1632–1638. [Google Scholar] [CrossRef] [PubMed][Green Version]
- Prabhasawat, P.; Tseng, S.C. Frequent association of delayed tear clearance in ocular irritation. Br. J. Ophthalmol. 1998, 82, 666–675. [Google Scholar] [CrossRef] [PubMed]
- King-Smith, P.E.; Ramamoorthy, P.; Braun, R.J.; Nichols, J.J. Tear film images and breakup analyzed using fluorescent quenching. Invest. Ophthalmol. Vis. Sci. 2013, 54, 6003–6011. [Google Scholar] [CrossRef] [PubMed]
- Fahim, M.M.; Haji, S.; Koonapareddy, C.V.; Fan, V.C.; Asbelli, P.A. Fluorophotometry as a diagnostic tool for the evaluation of dry eye disease. BMC Ophthalmol. 2006, 6, 20. [Google Scholar] [CrossRef]
- Mochizuki, H.; Yamada, M.; Hatou, S.; Tsubota, K. Turnover rate of tear-film lipid layer determined by fluorophotometry. Br. J. Ophthalmol. 2009, 93, 1535–1538. [Google Scholar] [CrossRef]
- Garaszczuk, I.K.; Mousavi, M.; Exposito, A.C.; Bartuzel, M.M.; Montes-Micó, R.; Iskander, D.R. Evaluating tear clearance rate with optical coherence tomography. Contact Lens Anterior Eye 2018, 41, 54–59. [Google Scholar] [CrossRef] [PubMed]
- Napoli, P.E.; Coronella, F.; Satta, G.M.; Fossarello, M. A novel technique of contrast-enhanced optical coherence tomography imaging in evaluation of clearance of lipids in human tears. PLoS ONE 2014, 9, e109843. [Google Scholar] [CrossRef]
- Kermany, D.S.; Goldbaum, M.; Cai, W.; Valentim, C.C.; Liang, H.; Baxter, S.L.; McKeown, A.; Yang, G.; Wu, X.; Yan, F.; et al. Identifying medical diagnoses and treatable diseases by image-based deep learning. Cell 2018, 172, 1122–1131. [Google Scholar] [CrossRef] [PubMed]
- Kapoor, R.; Whigham, B.T.; Al-Aswad, L.A. Artificial intelligence and optical coherence tomography imaging. Asia Pac. J. Ophthalmol. 2019, 1, 187–194. [Google Scholar]
- Maloca, P.M.; Lee, A.Y.; de Carvalho, E.R.; Okada, M.; Fasler, K.; Leung, I.; Hörmann, B.; Kaiser, P.; Suter, S.; Hasler, P.W.; et al. Validation of automated artificial intelligence segmentation of optical coherence tomography images. PLoS ONE 2019, 14, e0220063. [Google Scholar] [CrossRef] [PubMed]


© 2020 by the authors. Licensee MDPI, Basel, Switzerland. This article is an open access article distributed under the terms and conditions of the Creative Commons Attribution (CC BY) license (http://creativecommons.org/licenses/by/4.0/).
Share and Cite
Napoli, P.E.; Nioi, M.; Mangoni, L.; Gentile, P.; Braghiroli, M.; d’Aloja, E.; Fossarello, M. Fourier-Domain OCT Imaging of the Ocular Surface and Tear Film Dynamics: A Review of the State of the Art and an Integrative Model of the Tear Behavior during the Inter-Blink Period and Visual Fixation. J. Clin. Med. 2020, 9, 668. https://doi.org/10.3390/jcm9030668
Napoli PE, Nioi M, Mangoni L, Gentile P, Braghiroli M, d’Aloja E, Fossarello M. Fourier-Domain OCT Imaging of the Ocular Surface and Tear Film Dynamics: A Review of the State of the Art and an Integrative Model of the Tear Behavior during the Inter-Blink Period and Visual Fixation. Journal of Clinical Medicine. 2020; 9(3):668. https://doi.org/10.3390/jcm9030668
Chicago/Turabian StyleNapoli, Pietro Emanuele, Matteo Nioi, Lorenzo Mangoni, Pietro Gentile, Mirco Braghiroli, Ernesto d’Aloja, and Maurizio Fossarello. 2020. "Fourier-Domain OCT Imaging of the Ocular Surface and Tear Film Dynamics: A Review of the State of the Art and an Integrative Model of the Tear Behavior during the Inter-Blink Period and Visual Fixation" Journal of Clinical Medicine 9, no. 3: 668. https://doi.org/10.3390/jcm9030668
APA StyleNapoli, P. E., Nioi, M., Mangoni, L., Gentile, P., Braghiroli, M., d’Aloja, E., & Fossarello, M. (2020). Fourier-Domain OCT Imaging of the Ocular Surface and Tear Film Dynamics: A Review of the State of the Art and an Integrative Model of the Tear Behavior during the Inter-Blink Period and Visual Fixation. Journal of Clinical Medicine, 9(3), 668. https://doi.org/10.3390/jcm9030668