Reliability and Validity of the Short-Form 12 Item Version 2 (SF−12v2) Health-Related Quality of Life Survey and Disutilities Associated with Relevant Conditions in the U.S. Older Adult Population


Abstract
1. Introduction
2. Research Design and Methods
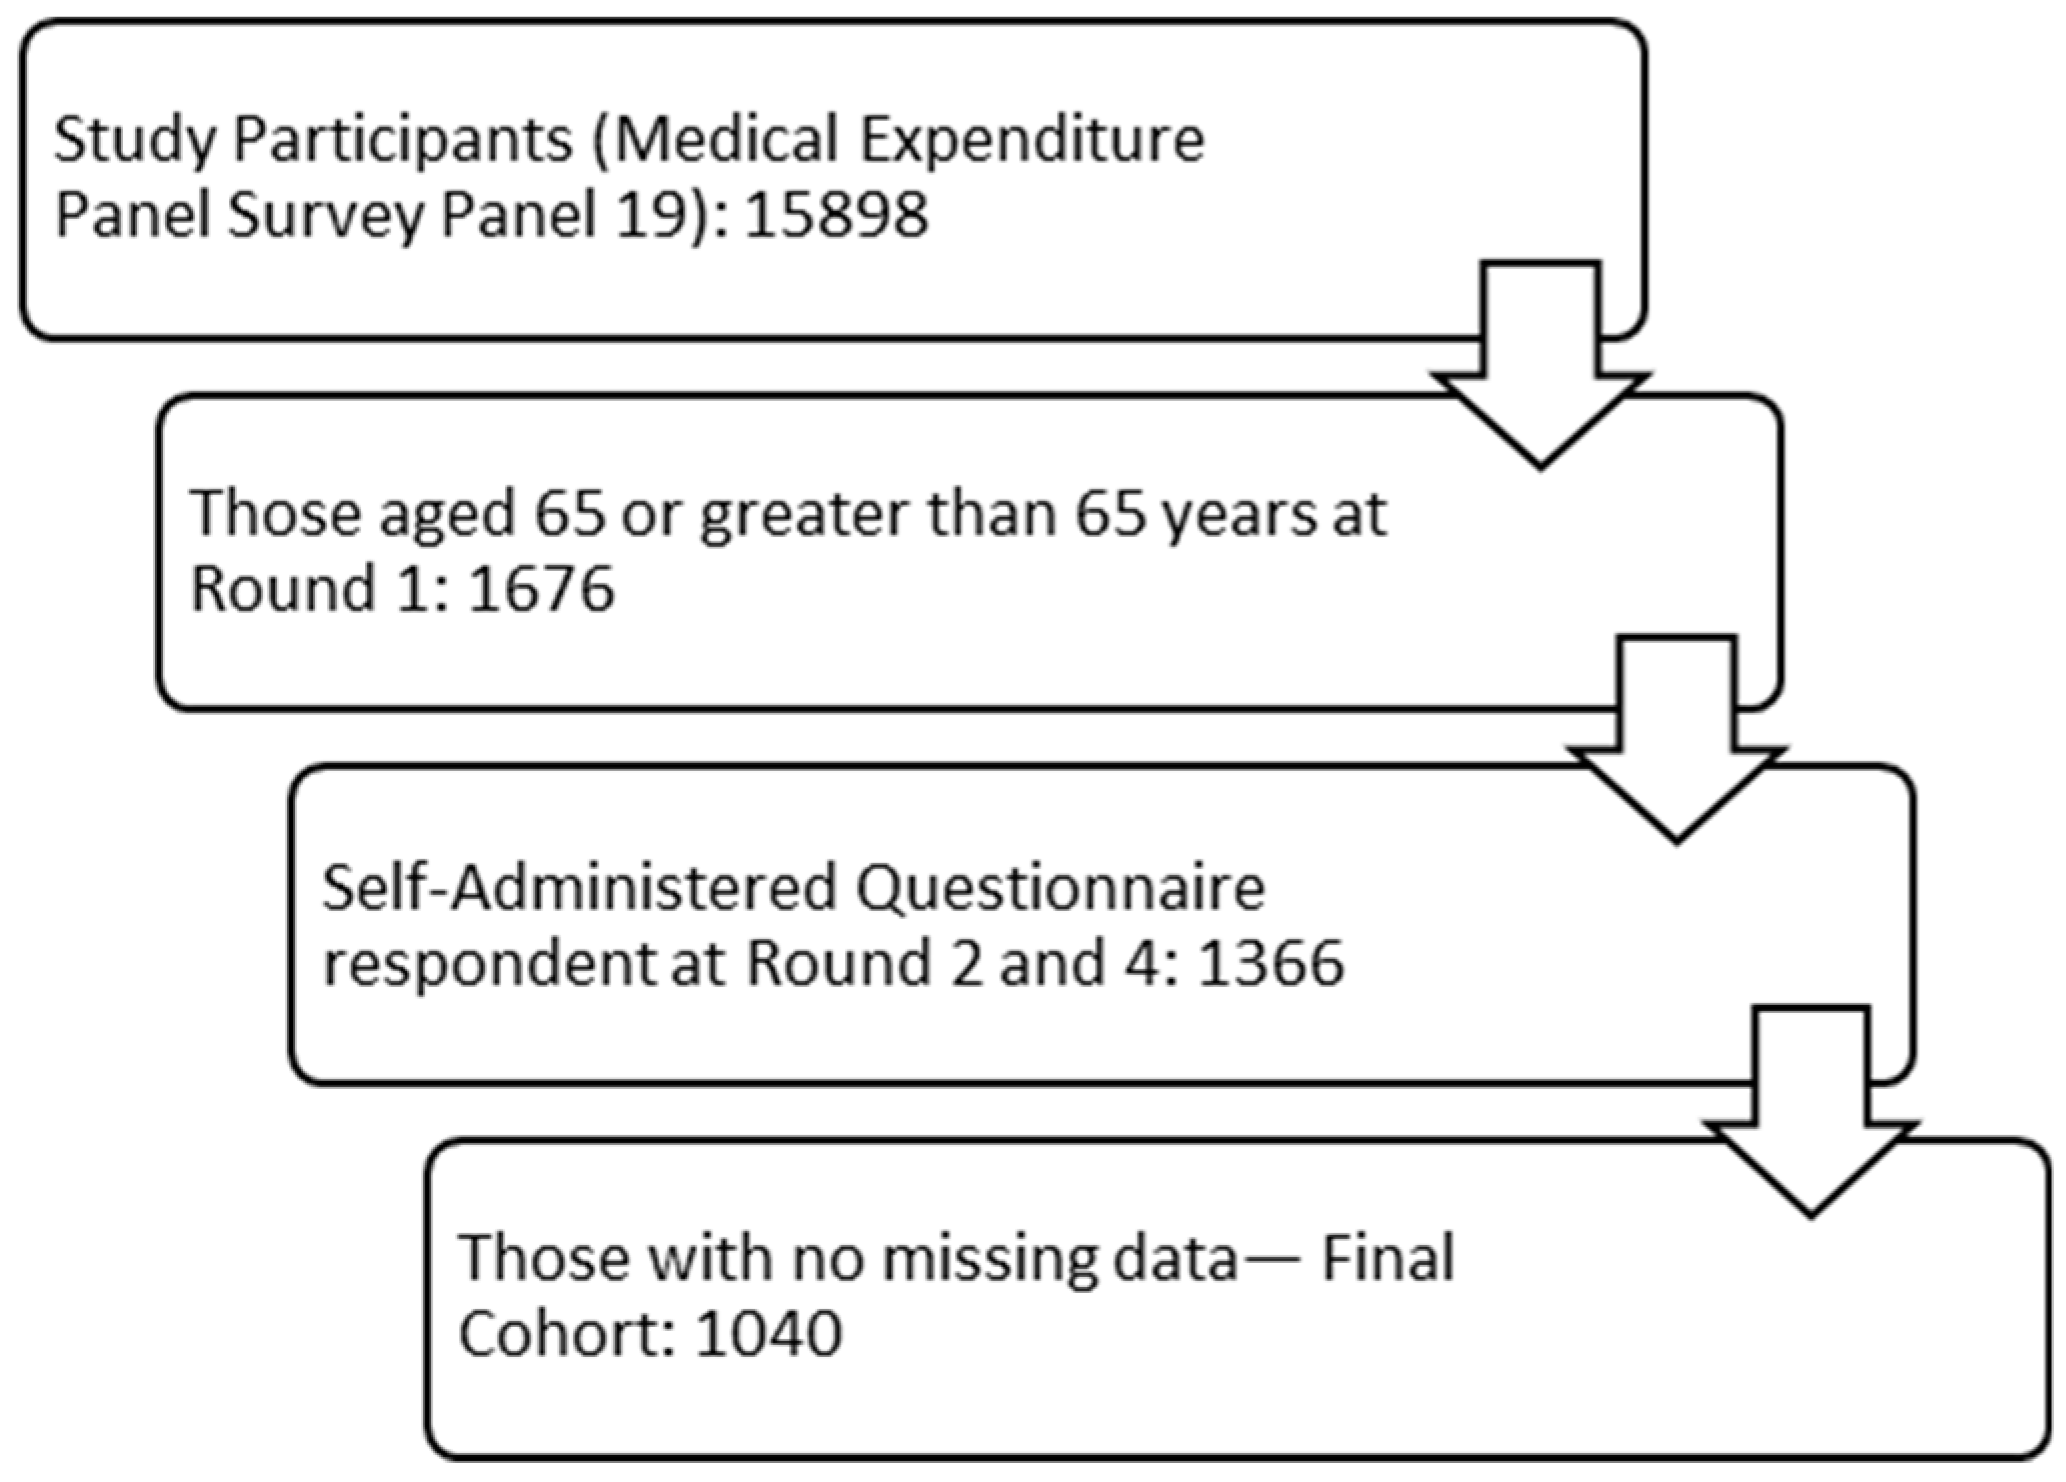
2.1. Data Source and Study Cohort
2.2. Demographic Information
2.3. Measures of Interest
2.3.1. Study Short-Form 12-Item Health Status Survey—Version 2
2.3.2. Short-Form Six-Dimension
2.3.3. Health-Related Quality of Life Comorbidity Index (HRQoL-CI)
2.3.4. Perceived Health and Perceived Mental Health
2.3.5. Patient Health Questionnaire—2
2.3.6. Kessler Scale
2.3.7. Social and Cognitive Limitations
2.3.8. Functional and Activity Limitations
2.4. Statistical Analyses
2.4.1. Reliability
2.4.2. Validity
2.4.3. Disutility
3. Results
3.1. Demographic Information
3.2. Reliability
3.3. Validity
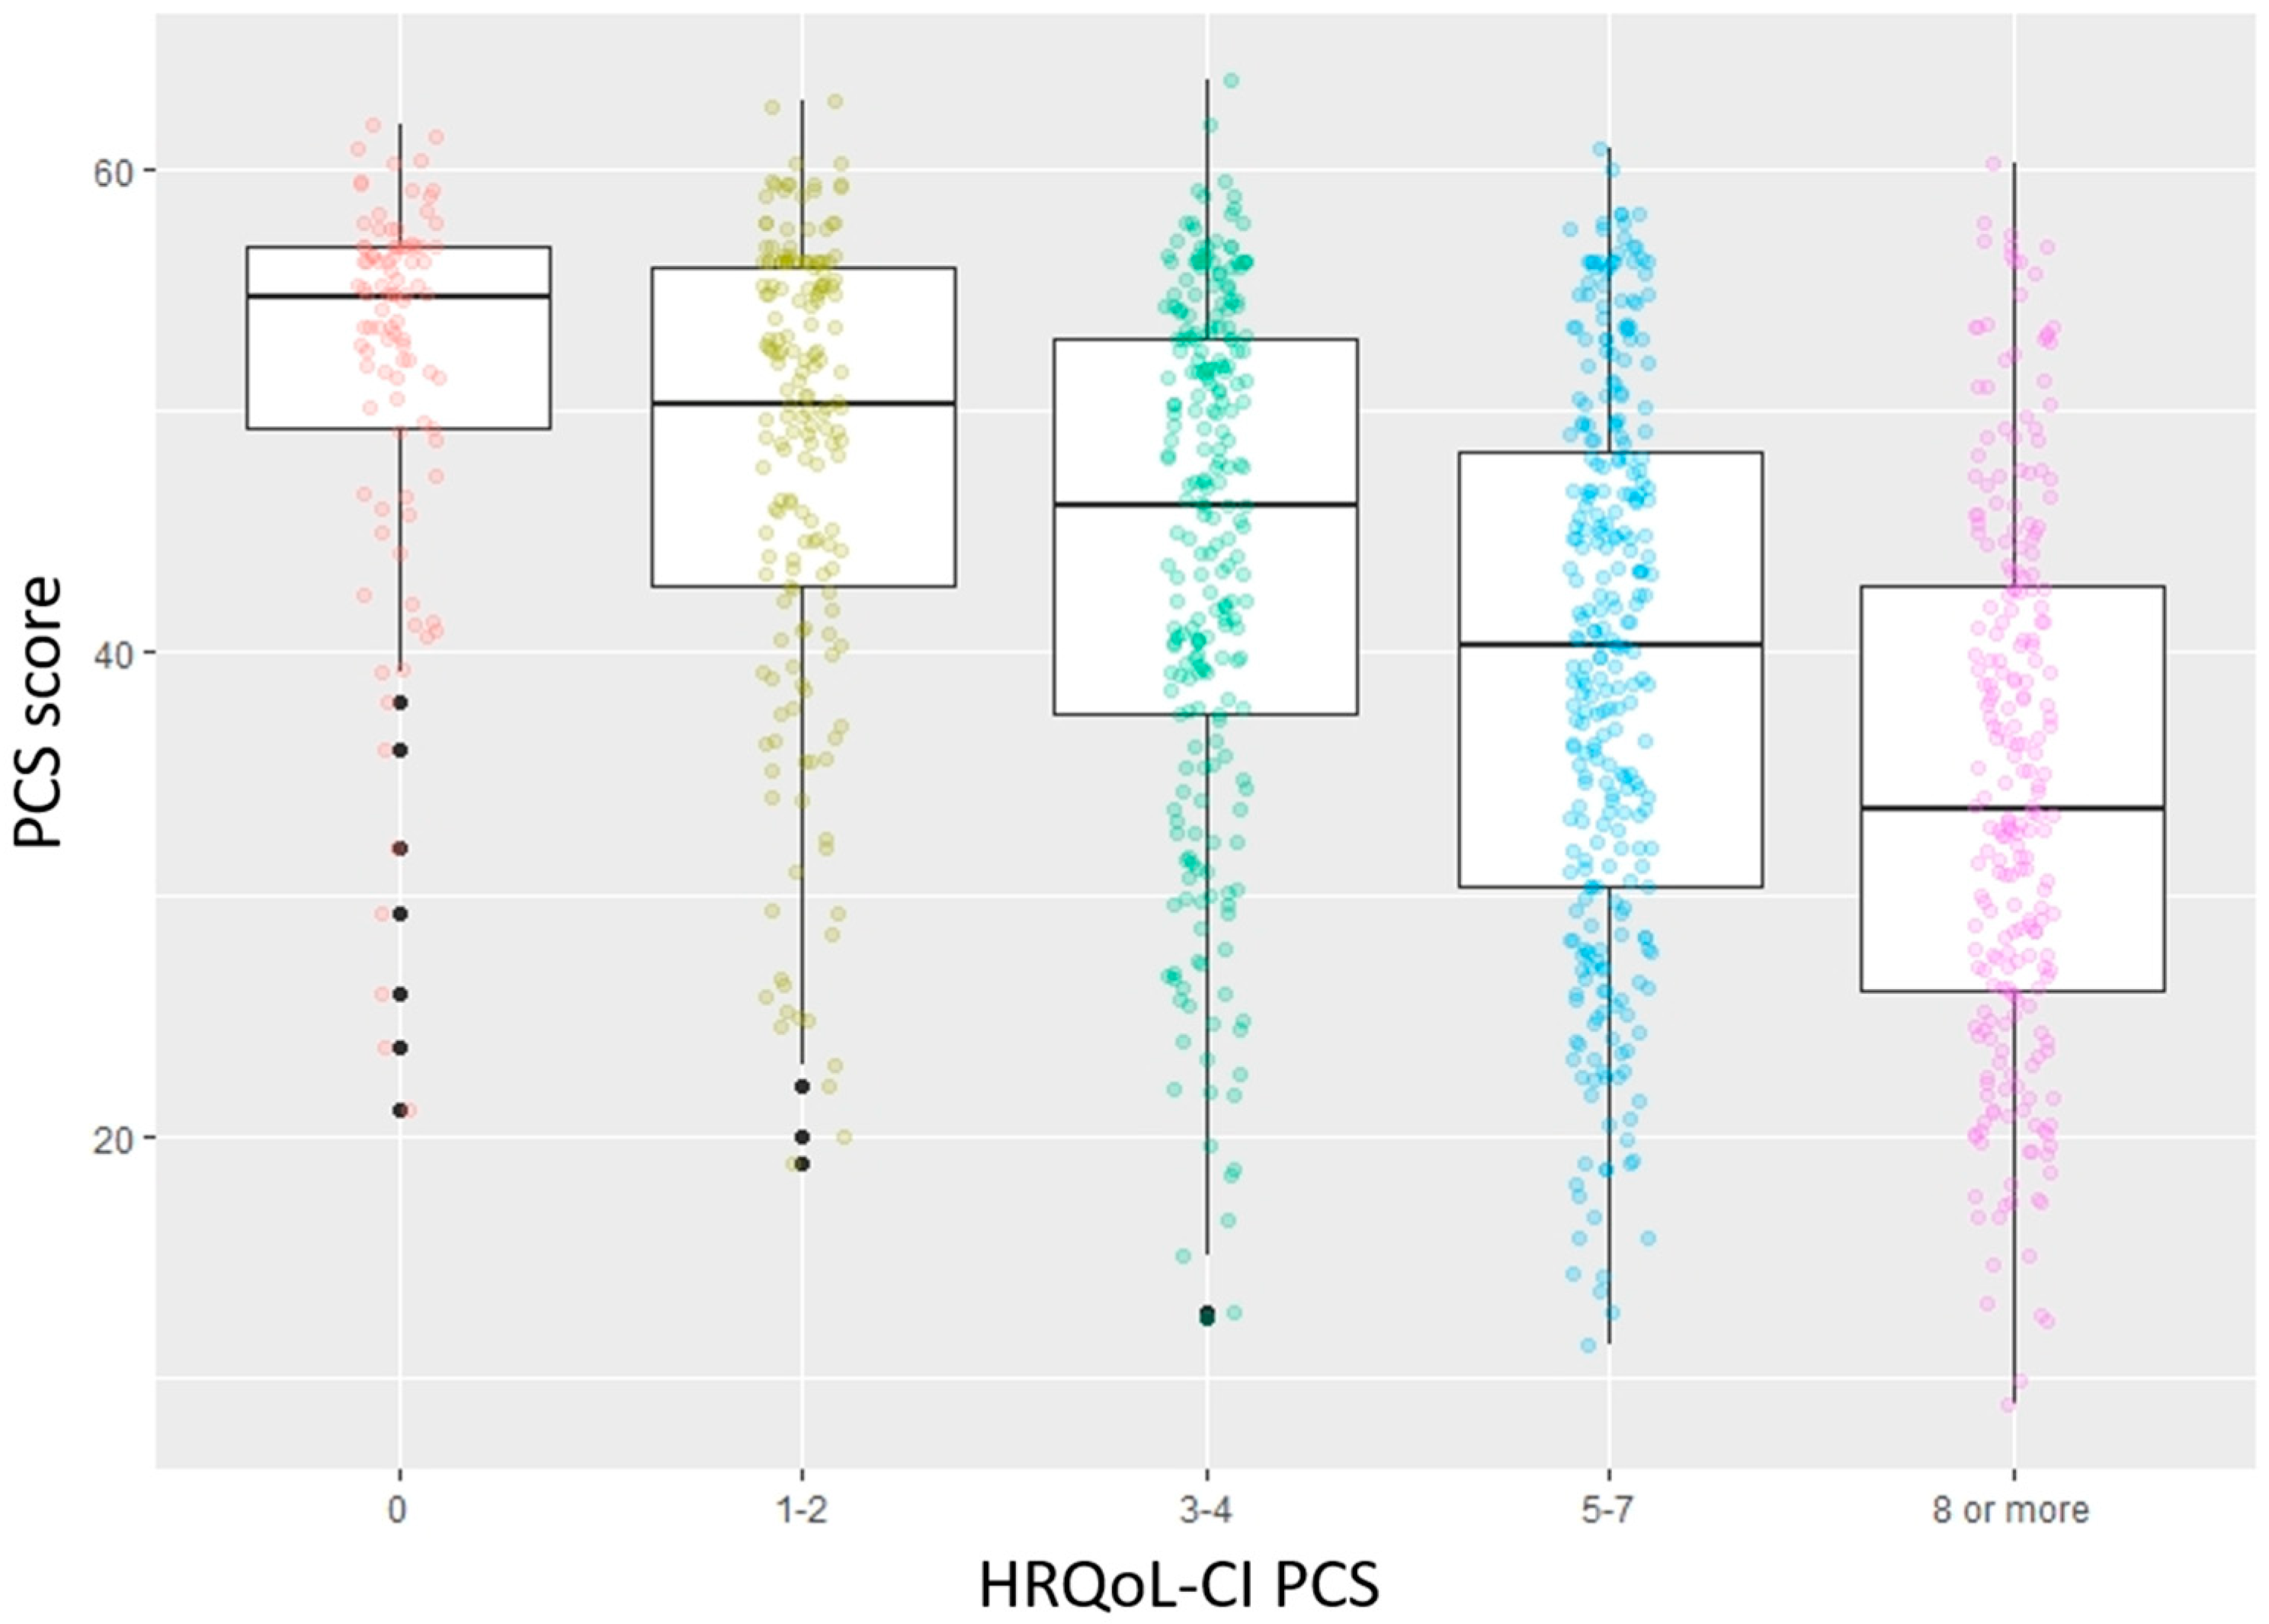
3.4. Disutility
4. Discussion
5. Conclusions
Author Contributions
Funding
Conflicts of Interest
Appendix A

| Type | Subtype | Measures Used |
|---|---|---|
| Reliability | Internal consistency | Cronbach alpha |
| Test-retest | Intra-class correlation | |
| Validity | ||
| Construct Validity | Convergent and discriminant | Spearman rank correlation |
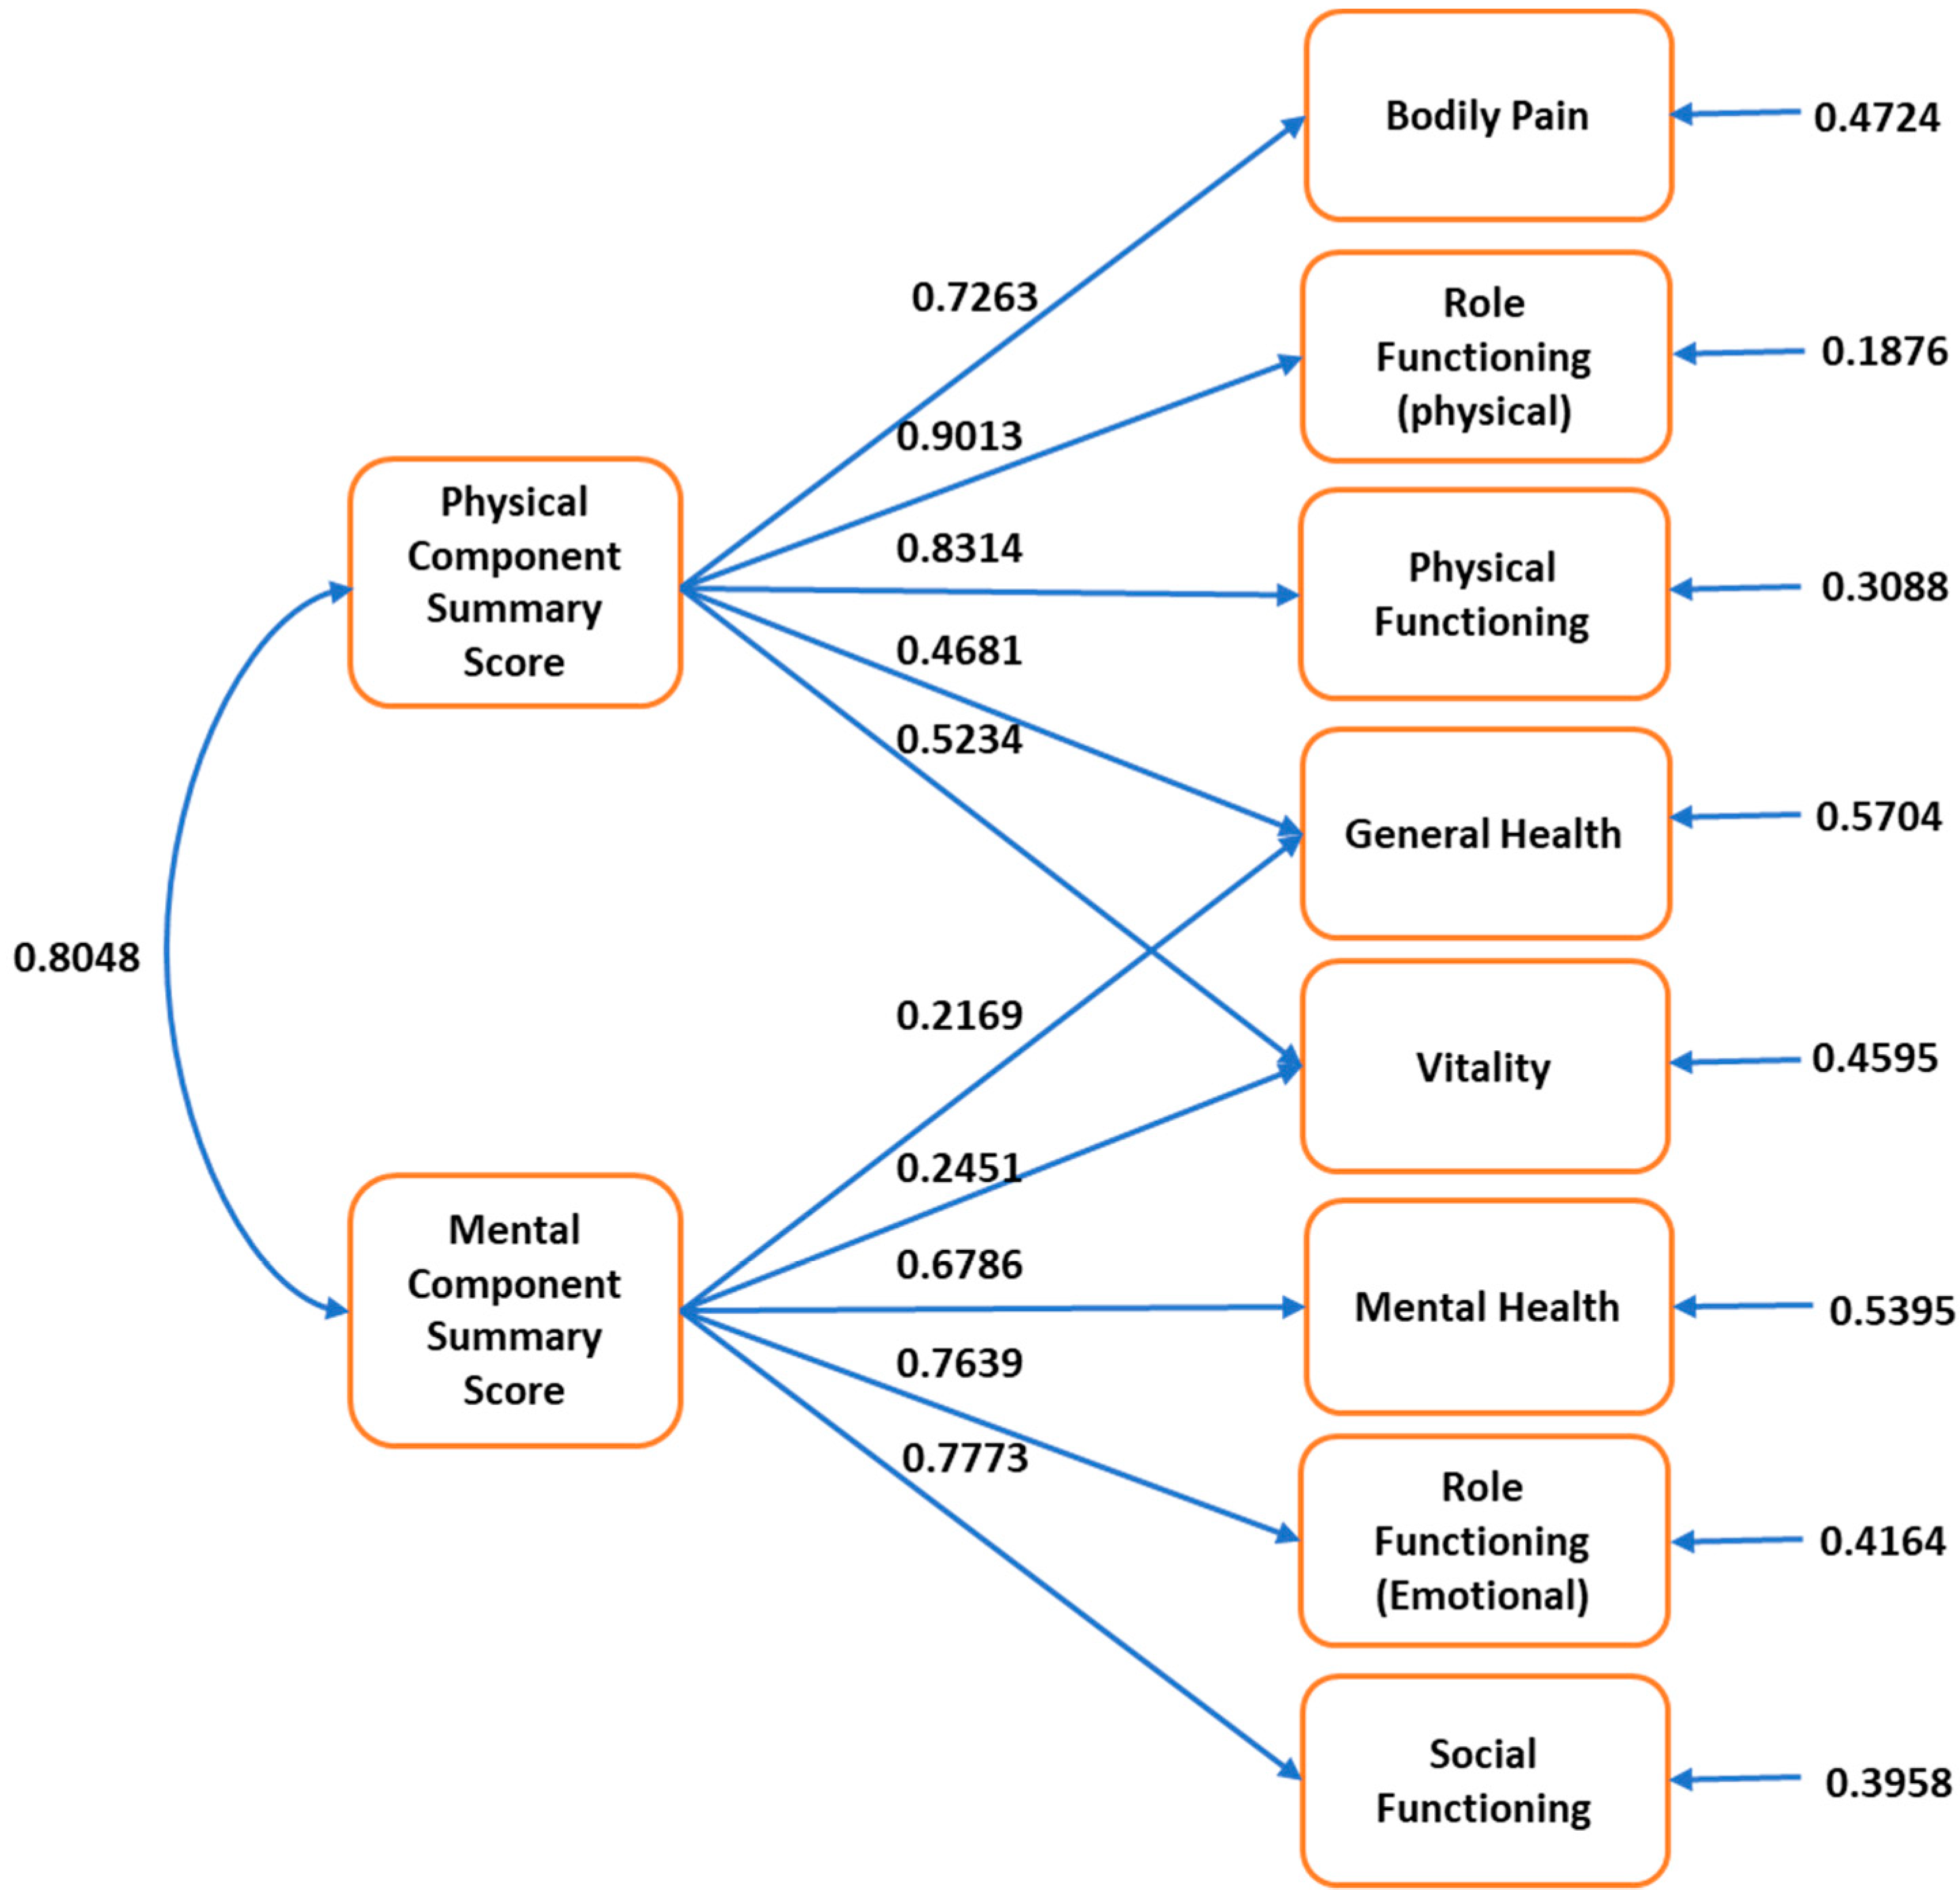
| Structural | Confirmatory factor analysis | |
| Criterion Validity | Concurrent | Analysis of variance, Tukey test |
| Predictive | Logistic regression |
References
- US Census Bureau Population Estimates Show Aging Across Race Groups Differs. Available online: https://www.census.gov/newsroom/press-releases/2019/estimates-characteristics.html (accessed on 12 July 2019).
- Stewart, A.; Ware, J.E. Measuring Functioning and Well-Being: The Medical Outcomes Study Approach; Duke University Press: Durham, NC, USA, 1992. [Google Scholar]
- Health-Related Quality of Life and Well-Being | Healthy People 2020. Available online: https://www.healthypeople.gov/2020/about/foundation-health-measures/Health-Related-Quality-of-Life-and-Well-Being (accessed on 13 February 2019).
- Weinstein, M.C.; Torrance, G.; McGuire, A. QALYs: The Basics. Value Health 2009, 12, S5–S9. [Google Scholar] [CrossRef]
- Clarke, P.; Gray, A.; Holman, R. Estimating Utility Values for Health States of Type 2 Diabetic Patients Using the EQ−5D (UKPDS 62). Med. Decis. Mak. 2002, 22, 340–349. [Google Scholar] [CrossRef]
- Bowling, A. Measuring Disease: A Review of Disease-Specific Quality of Life Measurement Scales, 2nd ed.; Open University Press: Buckingham, PI, USA, 2001; ISBN 978-0-335-20642-1. [Google Scholar]
- Patrick, D.L.; Erickson, P. Health Status and Health Policy: Quality of Life in Health Care Evaluation and Resource Allocation; Oxford University Press: New York, USA, 1993; ISBN 978. [Google Scholar]
- Ware, J.; Kosinski, M.; Keller, S.D. A 12-Item Short-Form Health Survey: Construction of scales and preliminary tests of reliability and validity. Med. Care 1996, 34, 220–233. [Google Scholar] [CrossRef]
- Ware, J.E.; Kosinski, M.; Turner-Bowker, D.M.; Gandek, B.; QualityMetric Incorporated; New England Medical Center Hospital; Health Assessment Lab. How to Score Version 2 of the SF-12 Health Survey (with a Supplement Documenting Version 1); QualityMetric Inc., Health Assessment Lab: Lincoln, RI, USA; Boston, MA, USA, 2002; ISBN 978-1-891810-10-7. [Google Scholar]
- Medical Expenditure Panel Survey Home. Available online: https://meps.ahrq.gov/mepsweb/ (accessed on 2 October 2018).
- Der-Martirosian, C.; Cordasco, K.M.; Washington, D.L. Health-related quality of life and comorbidity among older women veterans in the United States. Qual. Life Res. 2013, 22, 2749–2756. [Google Scholar] [CrossRef]
- Pulular, A.; Levy, R.; Stewart, R. Obsessive and compulsive symptoms in a national sample of older people: Prevalence, comorbidity, and associations with cognitive function. Am. J. Geriatr. Psychiatry 2013, 21, 263–271. [Google Scholar] [CrossRef]
- Coulton, S.; Clift, S.; Skingley, A.; Rodriguez, J. Effectiveness and cost-effectiveness of community singing on mental health-related quality of life of older people: Randomised controlled trial. Br. J. Psychiatry 2015, 207, 250–255. [Google Scholar] [CrossRef]
- Greaves, C.J.; Farbus, L. Effects of creative and social activity on the health and well-being of socially isolated older people: Outcomes from a multi-method observational study. J. R. Soc. Promot. Health 2006, 126, 134–142. [Google Scholar] [CrossRef]
- Cheng, Y.; Goodin, A.J.; Pahor, M.; Manini, T.; Brown, J.D. Healthcare Utilization and Physical Functioning in Older Adults in the United States. J. Am. Geriatr. Soc. 2020, 68, 266–271. [Google Scholar] [CrossRef]
- Cheak-Zamora, N.C.; Wyrwich, K.W.; McBride, T.D. Reliability and validity of the SF−12v2 in the medical expenditure panel survey. Qual. Life Res. 2009, 18, 727–735. [Google Scholar] [CrossRef]
- Montazeri, A.; Vahdaninia, M.; Mousavi, S.J.; Asadi-Lari, M.; Omidvari, S.; Tavousi, M. The 12-item medical outcomes study short form health survey version 2.0 (SF−12v2): A population-based validation study from Tehran, Iran. Health Qual. Life Outcomes 2011, 9, 12. [Google Scholar] [CrossRef]
- Kathe, N.; Hayes, C.J.; Bhandari, N.R.; Payakachat, N. Assessment of Reliability and Validity of SF−12v2 among a Diabetic Population. Value Health 2018, 21, 432–440. [Google Scholar] [CrossRef] [PubMed]
- Hayes, C.J.; Bhandari, N.R.; Kathe, N.; Payakachat, N. Reliability and Validity of the Medical Outcomes Study Short Form−12 Version 2 (SF−12v2) in Adults with Non-Cancer Pain. Healthcare 2017, 5, 22. [Google Scholar] [CrossRef] [PubMed]
- Gandhi, S.K.; Salmon, J.W.; Zhao, S.Z.; Lambert, B.L.; Gore, P.R.; Conrad, K. Psychometric evaluation of the 12-item short-form health survey (SF−12) in osteoarthritis and rheumatoid arthritis clinical trials. Clin. Ther. 2001, 23, 1080–1098. [Google Scholar] [CrossRef]
- Kontodimopoulos, N.; Pappa, E.; Niakas, D.; Tountas, Y. Validity of SF−12 summary scores in a Greek general population. Health Qual. Life Outcomes 2007, 5, 55. [Google Scholar] [CrossRef] [PubMed]
- Older Adults | Healthy People 2020. Available online: https://www.healthypeople.gov/2020/topics-objectives/topic/older-adults (accessed on 13 June 2019).
- Sixty-Five Plus in the United States. Available online: https://www.census.gov/population/socdemo/statbriefs/agebrief.html (accessed on 13 June 2019).
- SF−12 & SF−12v2 Health Survey. Available online: https://www.optum.com/solutions/life-sciences/answer-research/patient-insights/sf-health-surveys/sf−12v2-health-survey.html (accessed on 13 June 2019).
- Ware, J.E.; Kosinski, M.; Keller, S.D. SF−36 Physical and Mental Health Summary Scales: A User’s Manual; Health Assessment Lab, New England Medical Center: Boston, MA, USA, 1994. [Google Scholar]
- Hanmer, J. Predicting an SF−6D Preference-Based Score Using MCS and PCS Scores from the SF−12 or SF−36. Value Health 2009, 12, 958–966. [Google Scholar] [CrossRef] [PubMed]
- Hall, S.F. A user’s guide to selecting a comorbidity index for clinical research. J. Clin. Epidemiol. 2006, 59, 849–855. [Google Scholar] [CrossRef]
- Mukherjee, B.; Ou, H.-T.; Wang, F.; Erickson, S.R. A new comorbidity index: The health-related quality of life comorbidity index. J. Clin. Epidemiol. 2011, 64, 309–319. [Google Scholar] [CrossRef]
- Kroenke, K.; Spitzer, R.L.; Williams, J.D.B.W. The Patient Health Questionnaire-2: Validity of a two-item depression screener. Med. Care 2003, 41, 1284–1292. [Google Scholar] [CrossRef]
- Kessler, R.C.; Andrews, G.; Colpe, L.J.; Hiripi, E.; Mroczek, D.K.; Normand, S.-L.T.; Walters, E.E.; Zaslavsky, A.M. Short screening scales to monitor population prevalences and trends in non-specific psychological distress. Psychol. Med. 2002, 32, 959–976. [Google Scholar] [CrossRef]
- APA Dictionary of Psychology. Available online: https://www.apa.org/pubs/books/4311007 (accessed on 15 June 2019).
- Cronbach, L.J. Coefficient alpha and the internal structure of tests. Psychometrika 1951, 16, 297–334. [Google Scholar] [CrossRef]
- Deyo, R.A.; Diehr, P.; Patrick, D.L. Reproducibility and responsiveness of health status measures statistics and strategies for evaluation. Control. Clin. Trials 1991, 12, S142–S158. [Google Scholar] [CrossRef]
- Kimberlin, C.L.; Winterstein, A.G. Validity and reliability of measurement instruments used in research. Am. J. Health Syst. Pharm. 2008, 65, 2276–2284. [Google Scholar] [CrossRef] [PubMed]
- U.S. Department of Health and Human Services; Food and Drug Administration; Center for Drug Evaluation and Research (CDER); Center for Biologics Evaluation and Research (CBER); Center for Devices and Radiological Health (CDRH). Guidance for Industry Patient-Reported Outcome Measures: Use in Medical Product Development to Support Labeling Claims: draft guidance. Health Qual. Life Out. 2006, 4, 1–20. [Google Scholar] [CrossRef] [PubMed]
- Elkin, E.P. Are You in Need of Validation? Psychometric Evaluation of Questionnaires Using SAS®. SAS Glob. Forum 2012, 9, 1–9. [Google Scholar]
- Chan, Y.H. Biostatistics 104: Correlational analysis. Singapore Med. J. 2003, 44, 614–619. [Google Scholar]
- Mueller, R.O.; Hancock, G.R. Factor Analysis and Latent Structure, Confirmatory. In International Encyclopedia of the Social & Behavioral Sciences; Smelser, N.J., Baltes, P.B., Eds.; Pergamon: Oxford, UK, 2001; pp. 5239–5244. ISBN 978-0-08-043076-8. [Google Scholar]
- Fleishman, J.A.; Selim, A.J.; Kazis, L.E. Deriving SF−12v2 physical and mental health summary scores: A comparison of different scoring algorithms. Qual. Life Res. 2010, 19, 231–241. [Google Scholar] [CrossRef]
- Marsh, H.W.; Hau, K.-T.; Wen, Z. In Search of Golden Rules: Comment on Hypothesis-Testing Approaches to Setting Cutoff Values for Fit Indexes and Dangers in Overgeneralizing Hu and Bentler’s (1999) Findings. Struct. Equ. Modeling A Multidiscip. J. 2004, 11, 320–341. [Google Scholar] [CrossRef]
- Byrne, B.M. Structural equation modelling with EQS and EQS/Windows. J. R. Stat. Soc. Ser. Stat. Soc. 1996, 159, 343. [Google Scholar]
- Cohen, R.J.; Swerdlik, M.E.; Phillips, S.M. Psychological Testing and Assessment: An Introduction to Tests and Measurement, 3rd ed.; Mayfield Publishing Co: Mountain View, CA, USA, 1996; ISBN 978-1-55934-427-2. [Google Scholar]
- Piedmont, R.L. Criterion Validity. In Encyclopedia of Quality of Life and Well-Being Research; Michalos, A.C., Ed.; Springer Netherlands: Dordrecht, The Netherlands, 2014; p. 1348. ISBN 978-94-007-0753-5. [Google Scholar]
- SAS 9.4 Software. Available online: https://www.sas.com/en_us/software/sas9.html (accessed on 31 October 2019).
- R: The R Project for Statistical Computing. Available online: https://www.r-project.org/ (accessed on 21 September 2019).
- Nunnally, J.C. Psychometric Theory; McGraw-Hill: New York, USA, 1978; ISBN 978-0-07-047465-9. [Google Scholar]
- Koo, T.K.; Li, M.Y. A Guideline of Selecting and Reporting Intraclass Correlation Coefficients for Reliability Research. J. Chiropr. Med. 2016, 15, 155–163. [Google Scholar] [CrossRef]
- Allen, M.J.; Yen, W.M. Introduction to Measurement Theory Book; Brooks/Cole Publishing Company: Monterey, CA, USA, 1979; ISBN 0-8185-0283-5. [Google Scholar]
- Shou, J.; Ren, L.; Wang, H.; Yan, F.; Cao, X.; Wang, H.; Wang, Z.; Zhu, S.; Liu, Y. Reliability and validity of 12-item Short-Form health survey (SF−12) for the health status of Chinese community elderly population in Xujiahui district of Shanghai. Aging Clin. Exp. Res. 2016, 28, 339–346. [Google Scholar] [CrossRef]
- Jakobsson, U.; Westergren, A.; Lindskov, S.; Hagell, P. Construct validity of the SF−12 in three different samples. J. Eval. Clin. Pract. 2012, 18, 560–566. [Google Scholar] [CrossRef] [PubMed]


| Variable | Frequency (Total: 1040) | Percent (%)/Standard Deviation |
|---|---|---|
| Race | Percentage | |
| White | 710 | 68.3% |
| Black | 201 | 19.3% |
| Other | 129 | 12.4% |
| Region in round 1 | ||
| Northeast | 148 | 14.2% |
| Midwest | 205 | 19.7% |
| South | 429 | 41.3% |
| West | 258 | 24.8% |
| Marital status at round 1 | ||
| Never Married | 58 | 5.6% |
| Widowed/divorced/separated | 453 | 43.6% |
| Currently married | 529 | 50.8% |
| Insurance coverage for baseline year | ||
| Medicare only | 389 | 37.4% |
| Medicare and private | 468 | 45.0% |
| Medicare and other public | 174 | 16.7% |
| Uninsured | 6 | 0.6% |
| No Medicare and any public/private | 3 | 0.3% |
| Sex | ||
| Female | 595 | 57.2% |
| Male | 445 | 42.8% |
| Limitation in work/housework/school activities at round 1 | ||
| Yes | 206 | 19.8% |
| No | 834 | 80.2% |
| Limitation in physical functioning at round 1 | ||
| Yes | 370 | 35.6% |
| No | 670 | 64.4% |
| Continuous Variables | Mean | Standard deviation |
| Age at round 1 (years) | 74.09 | 6.19 |
| PCS score a | 41.90 | 12.11 |
| MCS score b | 53.10 | 9.30 |
| Short-Form Six-Dimension (SF−6D) score | 0.77 | 0.14 |
| HRQoL-CI-PCS score a | 5.00 | 3.51 |
| HRQoL-CI- MCS score b | 1.40 | 1.68 |
| Measure | Perceived Mental Health | Perceived Health | Patient Health Questionnaire—2 | Kessler Scale | Mental Component Summary Score |
|---|---|---|---|---|---|
| Physical Component Summary Score | 0.35 | 0.58 | −0.33 | −0.39 | 0.12 |
| Mental Component Summary Score | 0.37 | 0.31 | −0.59 | −0.66 | - |
| Measure | Value |
|---|---|
| Goodness of Fit Index | 0.9588 |
| Adjusted Goodness of Fit Index | 0.9128 |
| Root Means Square Error of Approximation | 0.1004 |
| Bentler Comparative Fit Index | 0.9596 |
| Bentler–Bonett Normed Fit Index | 0.9578 |
| Subpopulation | Yes | No | Disutility |
|---|---|---|---|
| Activity limitation | 0.62 | 0.80 | 0.18 |
| Functional limitation | 0.67 | 0.82 | 0.15 |
| Arthritis | 0.80 | 0.74 | 0.06 |
| Coronary Heart Disease | 0.78 | 0.71 | 0.07 |
| Diabetes | 0.78 | 0.71 | 0.07 |
| Myocardial infarction | 0.77 | 0.71 | 0.06 |
| Stroke | 0.78 | 0.69 | 0.09 |
| Angina | 0.77 | 0.71 | 0.06 |
| High Blood Pressure | 0.82 | 0.74 | 0.08 |
© 2020 by the authors. Licensee MDPI, Basel, Switzerland. This article is an open access article distributed under the terms and conditions of the Creative Commons Attribution (CC BY) license (http://creativecommons.org/licenses/by/4.0/).
Share and Cite
Shah, C.H.; Brown, J.D. Reliability and Validity of the Short-Form 12 Item Version 2 (SF−12v2) Health-Related Quality of Life Survey and Disutilities Associated with Relevant Conditions in the U.S. Older Adult Population. J. Clin. Med. 2020, 9, 661. https://doi.org/10.3390/jcm9030661
Shah CH, Brown JD. Reliability and Validity of the Short-Form 12 Item Version 2 (SF−12v2) Health-Related Quality of Life Survey and Disutilities Associated with Relevant Conditions in the U.S. Older Adult Population. Journal of Clinical Medicine. 2020; 9(3):661. https://doi.org/10.3390/jcm9030661
Chicago/Turabian StyleShah, Chintal H., and Joshua D. Brown. 2020. "Reliability and Validity of the Short-Form 12 Item Version 2 (SF−12v2) Health-Related Quality of Life Survey and Disutilities Associated with Relevant Conditions in the U.S. Older Adult Population" Journal of Clinical Medicine 9, no. 3: 661. https://doi.org/10.3390/jcm9030661
APA StyleShah, C. H., & Brown, J. D. (2020). Reliability and Validity of the Short-Form 12 Item Version 2 (SF−12v2) Health-Related Quality of Life Survey and Disutilities Associated with Relevant Conditions in the U.S. Older Adult Population. Journal of Clinical Medicine, 9(3), 661. https://doi.org/10.3390/jcm9030661