A Method for the Prediction of Clinical Outcome Using Diffusion Magnetic Resonance Imaging: Application on Parkinson’s Disease

 ,
,
Abstract
1. Introduction
2. Material and Methods
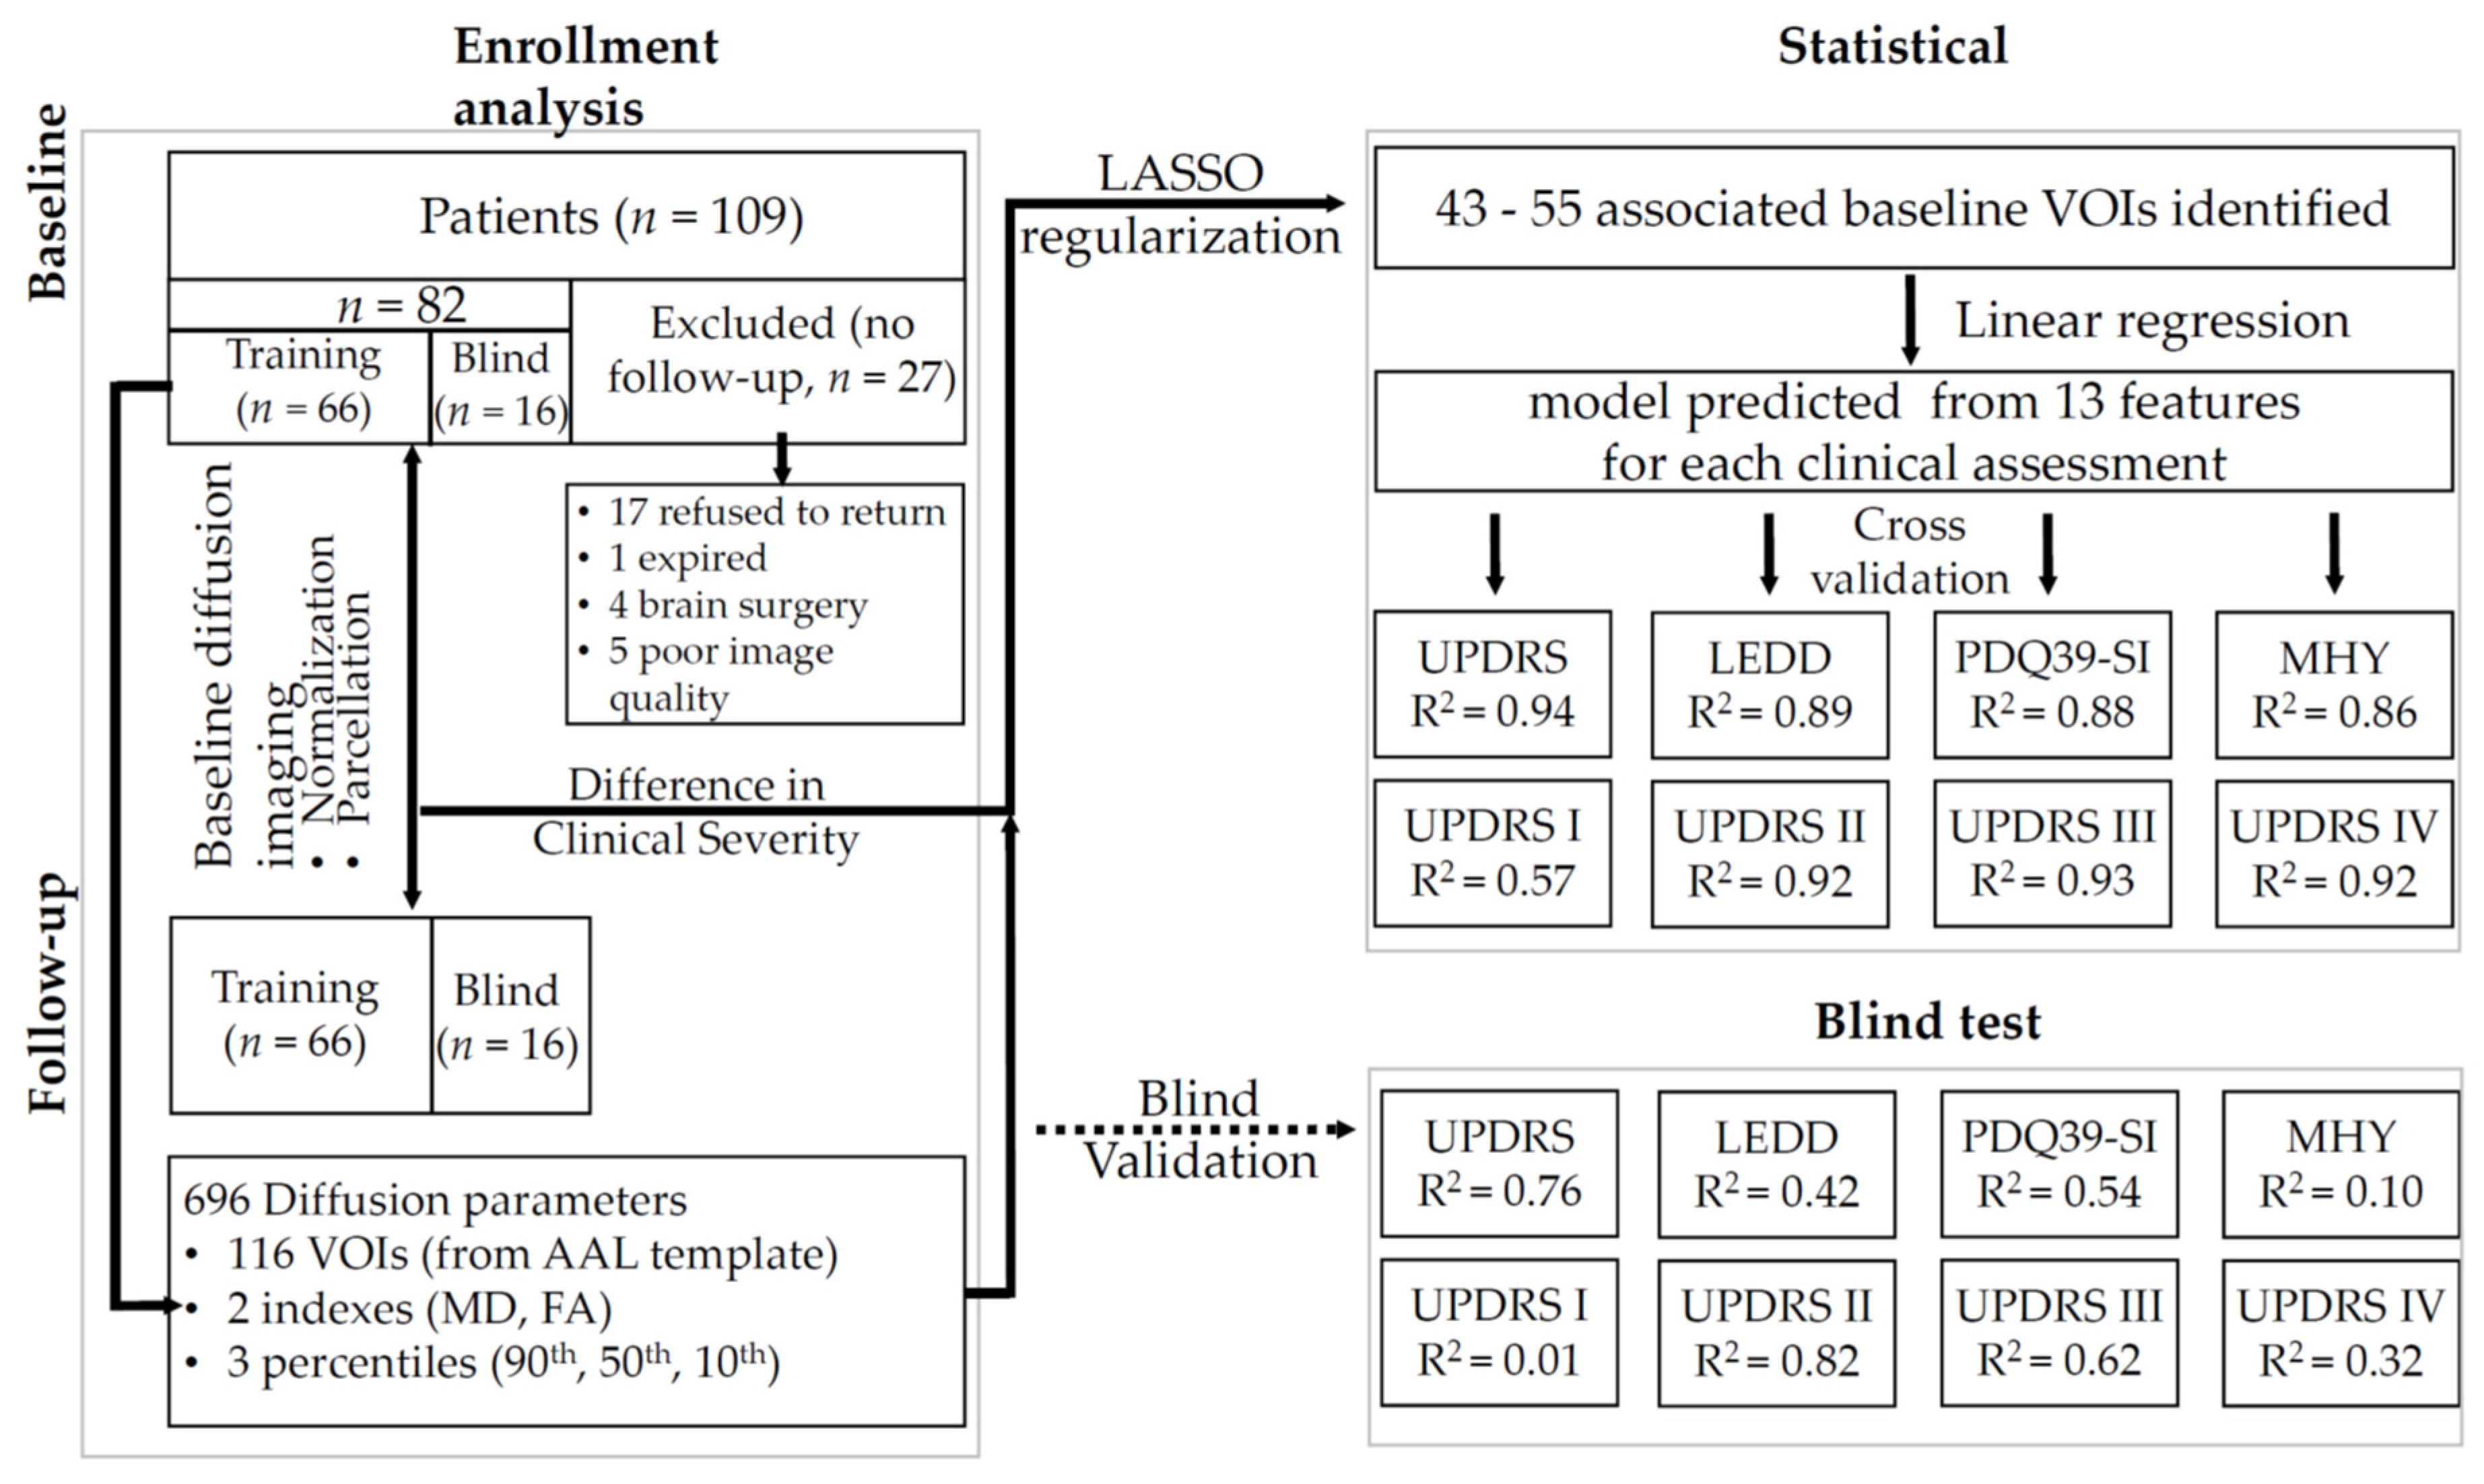
2.1. Patients
2.2. Imaging
2.2.1. Image Post-Processing
2.2.2. Statistical Analysis
3. Results
3.1. Changes over the Study Period
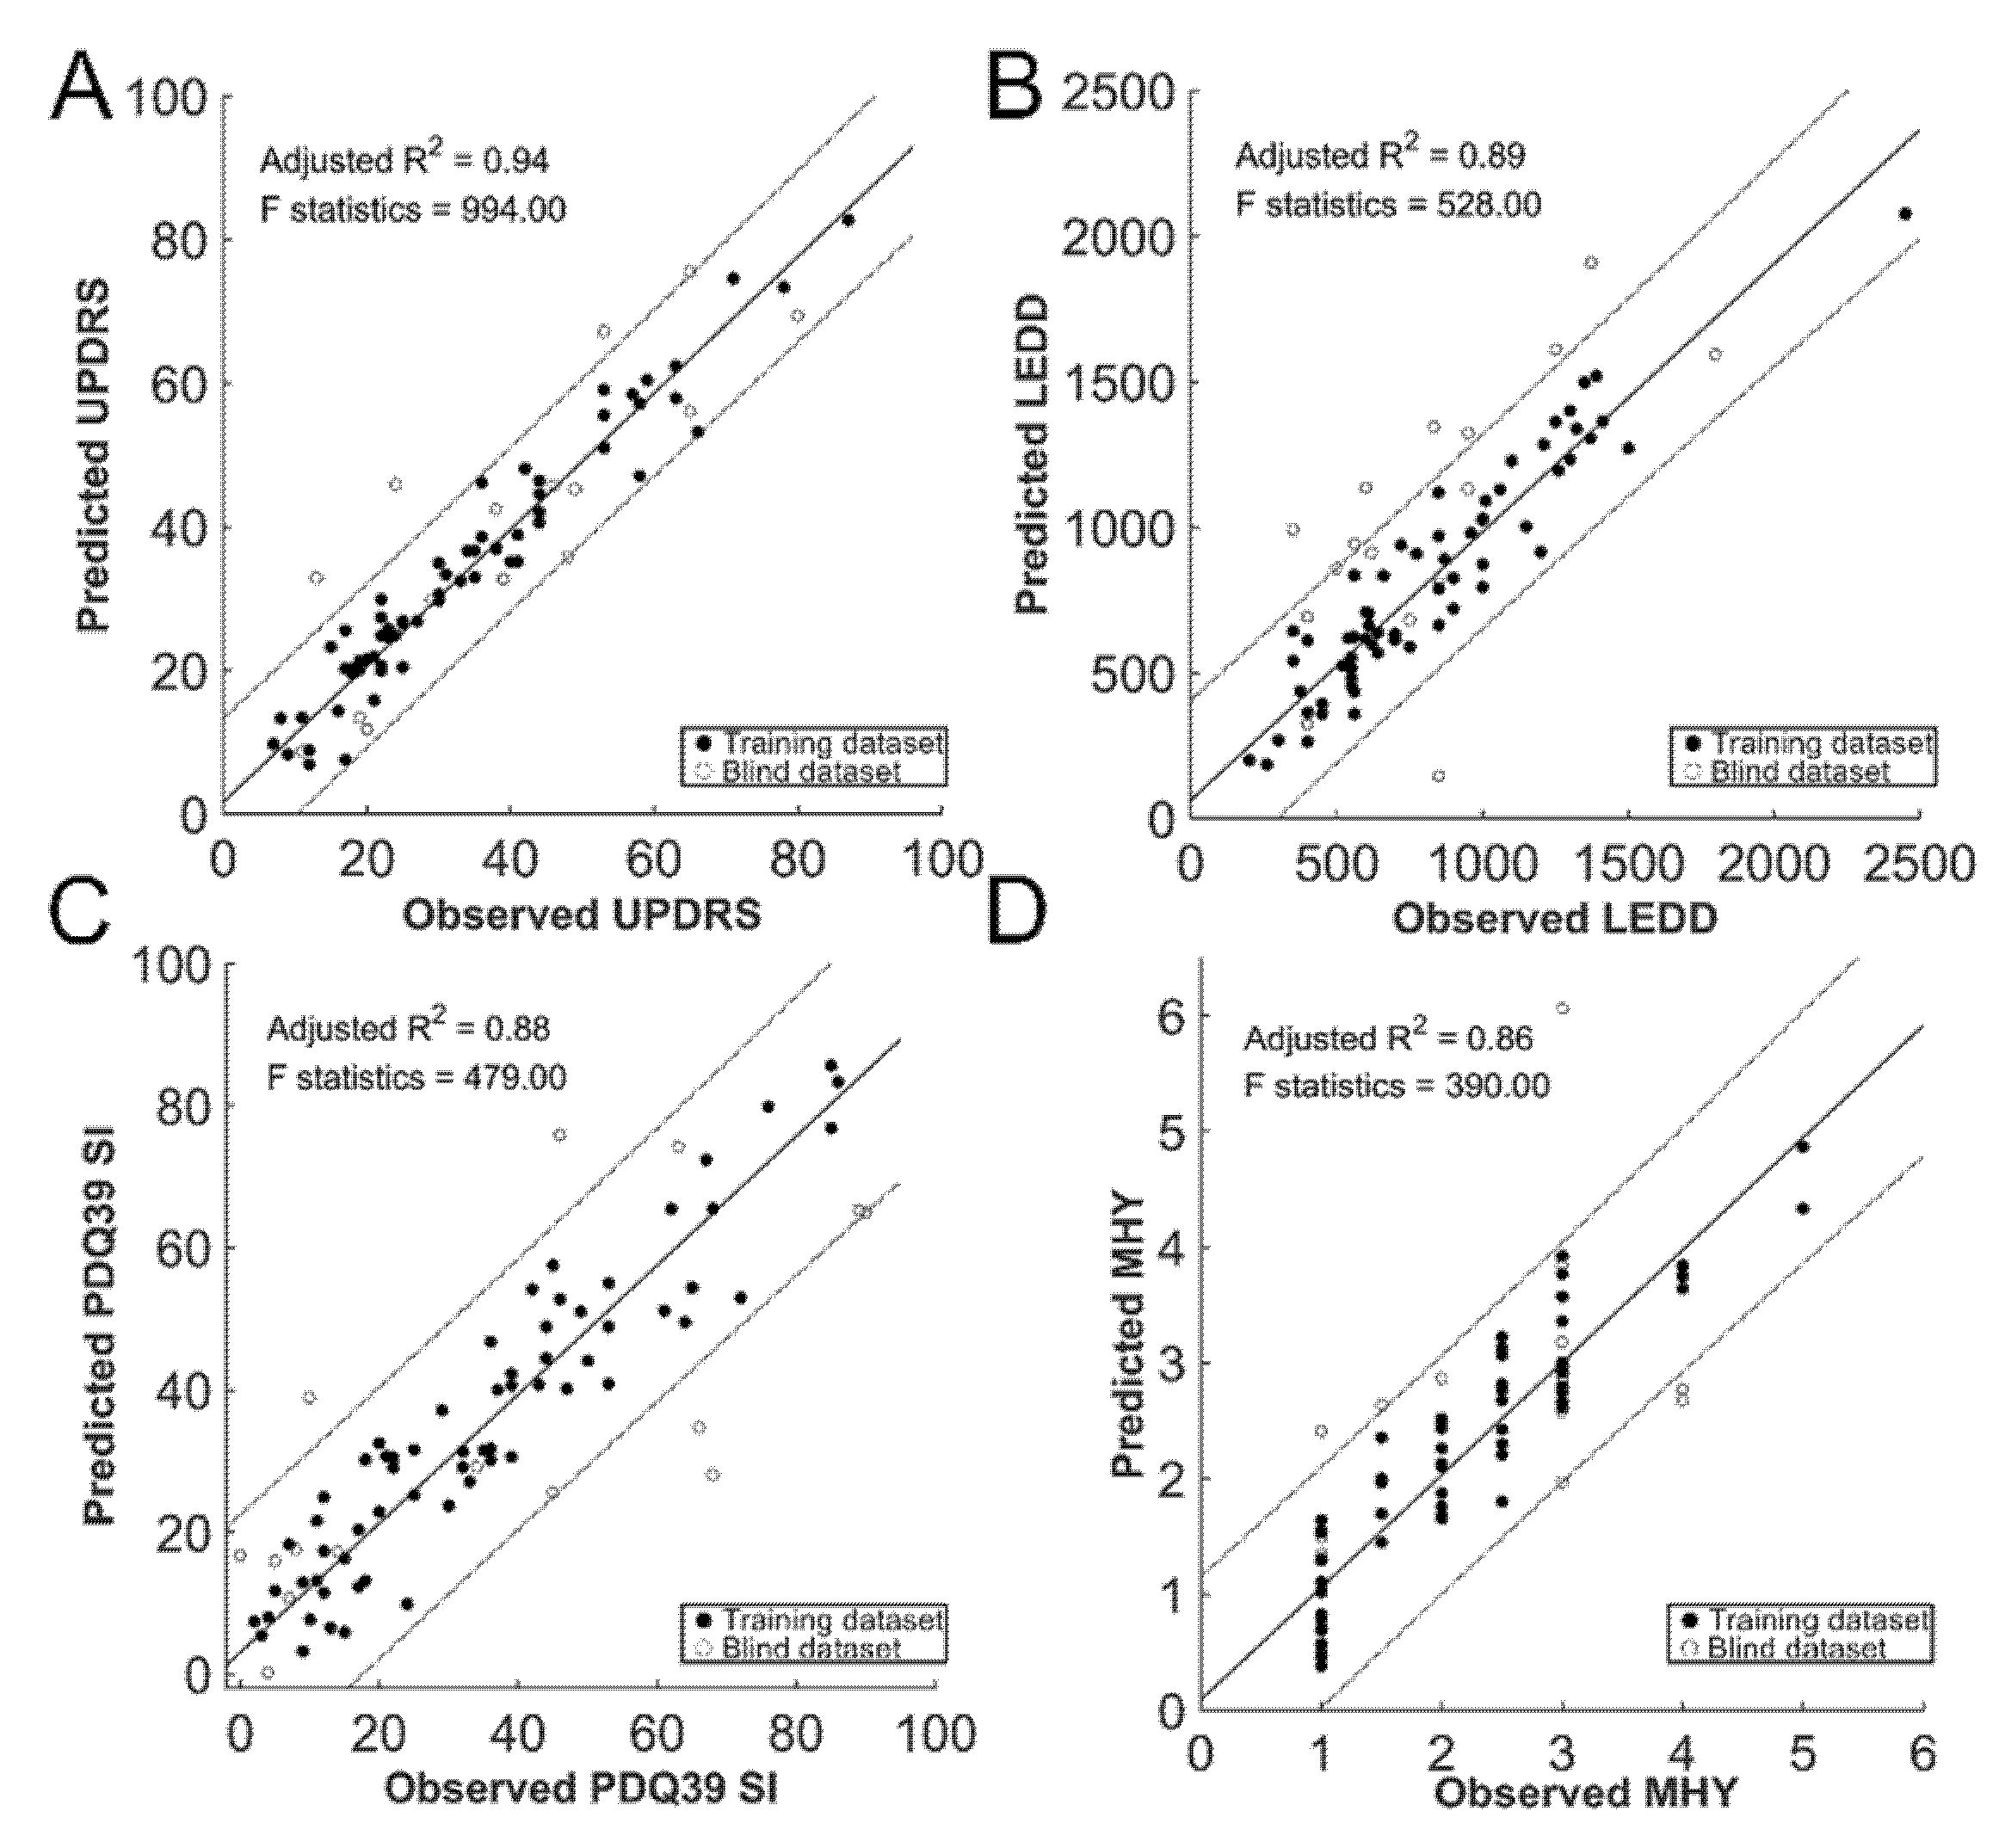
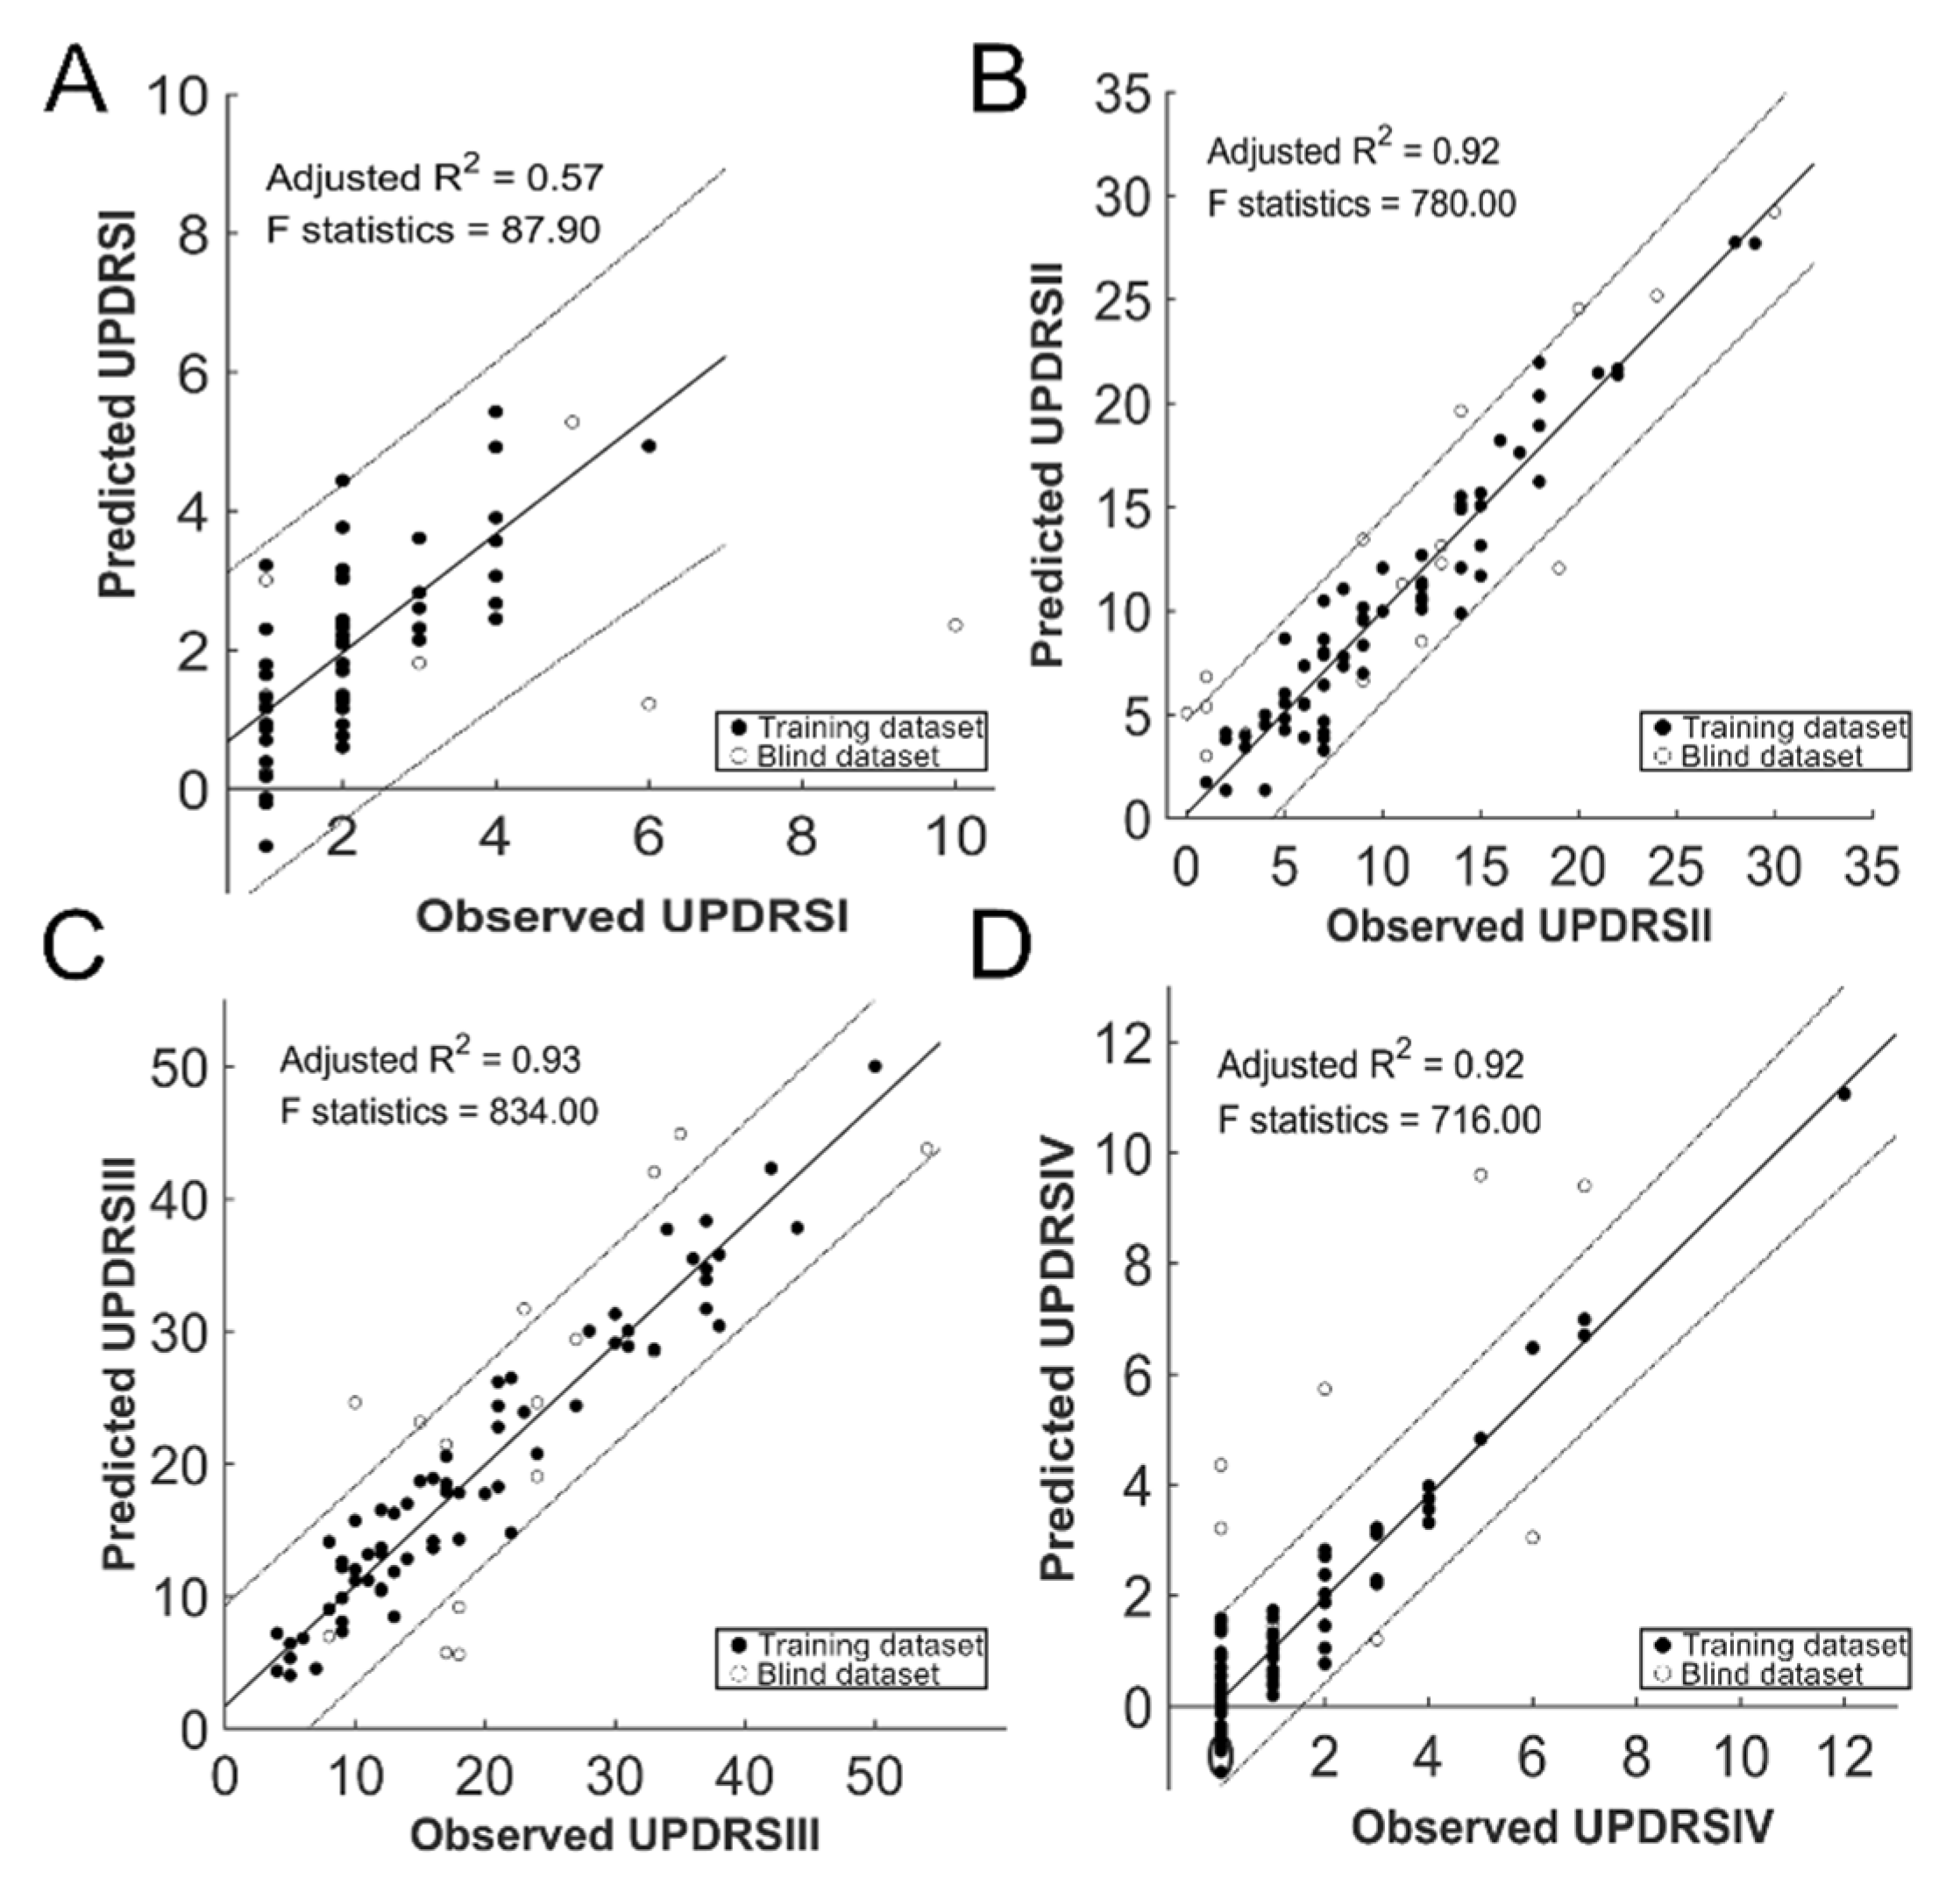
3.2. Summary of Regression Analysis
3.3. Prediction of the Clinical Outcome
4. Discussion
4.1. Major Findings and Clinical Impacts
4.2. Prediction of Motor Function
4.3. Prediction of Non-Motor Functions
4.4. Study Limitation
5. Conclusions
Author Contributions
Funding
Acknowledgments
Conflicts of Interest
References
- Litvan, K.P.; Bhatia, D.J.; Burn, C.G.; Goetz, A.E.; Lang, I.; McKeith, N.; Quinn, K.D.; Sethi, C.; Shults, G.K.; Wenning, C. Movement Disorders Society Scientific Issues, Movement Disorders Society Scientific Issues Committee report: SIC Task Force appraisal of clinical diagnostic criteria for Parkinsonian disorders. Mov. Disord. 2003, 18, 467–486. [Google Scholar] [CrossRef]
- Morrish, P.K.; Rakshi, J.S.; Bailey, D.L.; Sawle, G.V.; Brooks, D.J. Measuring the rate of progression and estimating the preclinical period of Parkinson’s disease with [18F]dopa PET. J. Neurol. Neurosurg. Psychiatry 1998, 64, 314–319. [Google Scholar] [CrossRef]
- Louis, E.D.; Marder, K.; Cote, L.; Tang, M.; Mayeux, R. Mortality from Parkinson disease. Arch. Neurol. 1997, 54, 260–264. [Google Scholar] [CrossRef]
- Menon, B.; Nayar, R.; Kumar, S.; Cherkil, S.; Venkatachalam, A.; Surendran, K.; Deepak, K.S. Parkinson’s Disease, Depression, and Quality-of-Life. Indian J. Psychol. Med. 2015, 37, 144–148. [Google Scholar] [CrossRef] [PubMed]
- Burton, E.J.; McKeith, I.G.; Burn, D.J.; Williams, E.D.; O’Brien, J.T. Cerebral atrophy in Parkinson’s disease with and without dementia: A comparison with Alzheimer’s disease, dementia with Lewy bodies and controls. Brain J. Neurol. 2004, 127, 791–800. [Google Scholar] [CrossRef] [PubMed]
- Garg, A.; Appel-Cresswell, S.; Popuri, K.; McKeown, M.J.; Beg, M.F. Morphological alterations in the caudate, putamen, pallidum, and thalamus in Parkinson’s disease. Front Neurosci. 2015, 9, 101. [Google Scholar] [CrossRef] [PubMed]
- Hou, Y.; Luo, C.; Yang, J.; Ou, R.; Song, W.; Wei, Q.; Cao, B.; Zhao, B.; Wu, Y.; Shang, H.F.; et al. Prediction of individual clinical scores in patients with Parkinson’s disease using resting-state functional magnetic resonance imaging. J. Neurol. Sci. 2016, 366, 27–32. [Google Scholar] [CrossRef]
- Ofori, E.; Pasternak, O.; Planetta, P.J.; Li, H.; Burciu, R.G.; Snyder, A.F.; Lai, S.; Okun, M.S.; Vaillancourt, D.E. Longitudinal changes in free-water within the substantia nigra of Parkinson’s disease. Brain J. Neurol. 2015, 138, 2322–2331. [Google Scholar] [CrossRef]
- Burciu, R.G.; Ofori, E.; Archer, D.B.; Wu, S.S.; Pasternak, O.; McFarland, N.R.; Okun, M.S.; Vaillancourt, D.E. Progression marker of Parkinson’s disease: A 4-year multi-site imaging study. Brain J. Neurol. 2017, 140, 2183–2192. [Google Scholar] [CrossRef]
- Lu, C.S.; Ng, S.H.; Weng, Y.H.; Cheng, J.S.; Lin, W.Y.; Wai, Y.Y.; Chen, Y.L.; Wang, J.J. Alterations of diffusion tensor MRI parameters in the brains of patients with Parkinson’s disease compared with normal brains: Possible diagnostic use. Eur. Radiol. 2016, 26, 3978–3988. [Google Scholar] [CrossRef]
- Rau, Y.A.; Wang, S.M.; Tournier, J.D.; Lin, S.H.; Lu, C.S.; Weng, Y.H.; Chen, Y.L.; Ng, S.H.; Yu, S.W.; Wu, Y.M.; et al. A longitudinal fixel-based analysis of white matter alterations in patients with Parkinson’s disease. Neuroimage. Clin. 2019, 24, 102098. [Google Scholar] [CrossRef] [PubMed]
- Johnstone, I.M.; Titterington, D.M. Statistical challenges of high-dimensional data. Philos. Trans. A Math. Phys. Eng. Sci. 2009, 367, 4237–4253. [Google Scholar] [CrossRef] [PubMed]
- Yin, P.; Mao, N.; Zhao, C.; Wu, J.; Sun, C.; Chen, L.; Hong, N. Comparison of radiomics machine-learning classifiers and feature selection for differentiation of sacral chordoma and sacral giant cell tumour based on 3D computed tomography features. Eur. Radiol. 2018, 29, 1841–1847. [Google Scholar] [CrossRef] [PubMed]
- Gelb, D.J.; Oliver, E.; Gilman, S. Diagnostic criteria for Parkinson disease. Arch. Neurol. 1999, 56, 33–39. [Google Scholar] [CrossRef] [PubMed]
- Shyu, Y.I.; Lu, J.F.; Liang, J. Evaluation of Medical Outcomes Study Short Form-36 Taiwan version in assessing elderly patients with hip fracture, Osteoporosis international: A journal established as result of cooperation between the European Foundation for Osteoporosis and the National Osteoporosis Foundation of the USA. Osteoporos. Int. 2004, 15, 575–582. [Google Scholar]
- Tabesh, A.; Jensen, J.H.; Ardekani, B.A.; Helpern, J.A. Estimation of tensors and tensor-derived measures in diffusional kurtosis imaging. Magn. Reson. Med. 2011, 65, 823–836. [Google Scholar] [CrossRef]
- Lo, C.Y.; Wang, P.N.; Chou, K.H.; Wang, J.; He, Y.; Lin, C.P. Diffusion tensor tractography reveals abnormal topological organization in structural cortical networks in Alzheimer’s disease. J. Neurosci. 2010, 30, 16876–16885. [Google Scholar] [CrossRef]
- Tzourio-Mazoyer, N.; Landeau, B.; Papathanassiou, D.; Crivello, F.; Etard, O.; Delcroix, N.; Mazoyer, B.; Joliot, M. Automated anatomical labeling of activations in SPM using a macroscopic anatomical parcellation of the MNI MRI single-subject brain. Neuroimage 2002, 15, 273–289. [Google Scholar] [CrossRef]
- Harvey, H.B.; Sotardi, S.T. The Pareto Principle. J. Am. Coll. Radiol. 2018, 15, 931. [Google Scholar] [CrossRef]
- Senders, J.T.; Karhade, A.V.; Cote, D.J.; Mehrtash, A.; Lamba, N.; DiRisio, A.; Muskens, I.S.; Gormley, W.B.; Smith, T.R.; Broekman, M.L.D.; et al. Natural Language Processing for Automated Quantification of Brain Metastases Reported in Free-Text Radiology Reports. JCO Clin. Cancer Inform. 2019, 3, 1–9. [Google Scholar] [CrossRef]
- Tibshirani, R. Regression Shrinkage and Selection via the Lasso. J. R. Stat. Soc. 1996, 58, 267–288. [Google Scholar] [CrossRef]
- Chen, Y.L.; Zhao, X.A.; Ng, S.H.; Lu, C.S.; Lin, Y.C.; Cheng, J.S.; Tsai, C.C.; Wang, J.J. Prediction of the Clinical Severity of Progressive Supranuclear Palsy by Diffusion Tensor Imaging. J. Clin. Med. 2019, 9, 40. [Google Scholar] [CrossRef] [PubMed]
- Austin, P.C.; Steyerberg, E.W. The number of subjects per variable required in linear regression analyses. J. Clin. Epidemiol. 2015, 68, 627–636. [Google Scholar] [CrossRef] [PubMed]
- Vittinghoff, E.; McCulloch, C.E. Relaxing the rule of ten events per variable in logistic and Cox regression. Am. J. Epidemiol. 2007, 165, 710–718. [Google Scholar] [CrossRef]
- Chen, Y.L.; Lin, Y.J.; Lin, S.H.; Tsai, C.C.; Lin, Y.C.; Cheng, J.S.; Wang, J.J. The effect of spatial resolution on the reproducibility of diffusion imaging when controlled signal to noise ratio. Biomed. J. 2019, 42, 268–276. [Google Scholar] [CrossRef]
- Gibb, W.R.; Lees, A.J. The relevance of the Lewy body to the pathogenesis of idiopathic Parkinson’s disease. J. Neurol. Neurosurg. Psychiatry 1988, 51, 745–752. [Google Scholar] [CrossRef]
- Vaillancourt, D.E.; Spraker, M.B.; Prodoehl, J.; Abraham, I.; Corcos, D.M.; Zhou, X.J.; Comella, C.L.; Little, D.M. High-resolution diffusion tensor imaging in the substantia nigra of de novo Parkinson disease. Neurology 2009, 72, 1378–1384. [Google Scholar] [CrossRef]
- Deng, X.Y.; Wang, L.; Yang, T.T.; Li, R.; Yu, G. A meta-analysis of diffusion tensor imaging of substantia nigra in patients with Parkinson’s disease. Sci. Rep. 2018, 8, 2941. [Google Scholar] [CrossRef] [PubMed]
- Zhong, Z.; Merkitch, D.; Karaman, M.M.; Zhang, J.; Sui, Y.; Goldman, J.G.; Zhou, X.J. High-Spatial-Resolution Diffusion MRI in Parkinson Disease: Lateral Asymmetry of the Substantia Nigra. Radiology 2019, 291, 149–157. [Google Scholar] [CrossRef]
- Cochrane, C.J.; Ebmeier, K.P. Diffusion tensor imaging in parkinsonian syndromes: A systematic review and meta-analysis. Neurology 2013, 80, 857–864. [Google Scholar] [CrossRef]
- Bostan, A.C.; Dum, R.P.; Strick, P.L. The basal ganglia communicate with the cerebellum. Proc. Natl. Acad. Sci. USA 2010, 107, 8452–8456. [Google Scholar] [CrossRef] [PubMed]
- Benninger, D.H.; Thees, S.; Kollias, S.S.; Bassetti, C.L.; Waldvogel, D. Morphological differences in Parkinson’s disease with and without rest tremor. J. Neurol. 2009, 256, 256–263. [Google Scholar] [CrossRef] [PubMed]
- Tessitore, A.; Russo, A.; de Micco, R.; Fratello, M.; Caiazzo, G.; Giordano, A.; Cirillo, M.; Tedeschi, G.; Esposito, F. Central pain processing in “drug-naive” pain-free patients with Parkinson’s disease. Hum. Brain Mapp. 2018, 39, 932–940. [Google Scholar] [CrossRef] [PubMed]
- Wu, T.; Hallett, M. The cerebellum in Parkinson’s disease. Brain J. Neurol. 2013, 136, 696–709. [Google Scholar] [CrossRef]
- Wu, T.; Wang, L.; Chen, Y.; Zhao, C.; Li, K.; Chan, P. Changes of functional connectivity of the motor network in the resting state in Parkinson’s disease. Neurosci. Lett. 2009, 460, 6–10. [Google Scholar] [CrossRef]
- Middleton, F.A.; Strick, P.L. Basal ganglia and cerebellar loops: Motor and cognitive circuits. Brain Res. Rev. 2000, 31, 236–250. [Google Scholar] [CrossRef]
- Aarsland, D.; Andersen, K.; Larsen, J.P.; Lolk, A.; Nielsen, H.; Kragh-Sorensen, P. Risk of dementia in Parkinson’s disease: A community-based, prospective study. Neurology 2001, 56, 730–736. [Google Scholar] [CrossRef]
- Adolphs, R.; Tranel, D.; Buchanan, T.W. Amygdala damage impairs emotional memory for gist but not details of complex stimuli. Nat. Neurosci. 2005, 8, 512–518. [Google Scholar] [CrossRef]
- Adolphs, R.; Tranel, D.; Damasio, H.; Damasio, A. Impaired recognition of emotion in facial expressions following bilateral damage to the human amygdala. Nature 1994, 372, 669–672. [Google Scholar] [CrossRef]
- Olson, I.R.; Plotzker, A.; Ezzyat, Y. The Enigmatic temporal pole: A review of findings on social and emotional processing. Brain J. Neurol. 2007, 130, 1718–1731. [Google Scholar] [CrossRef]
- Chaudhuri, K.R.; Healy, D.G.; Schapira, A.H.E. National Institute for Clinical, Non-motor symptoms of Parkinson’s disease: Diagnosis and management. Lancet Neurol. 2006, 5, 235–245. [Google Scholar] [CrossRef]
- Leung, I.H.; Walton, C.C.; Hallock, H.; Lewis, S.J.; Valenzuela, M.; Lampit, A. Cognitive training in Parkinson disease: A systematic review and meta-analysis. Neurology 2015, 85, 1843–1851. [Google Scholar] [CrossRef] [PubMed]
- Nicoletti, A.; Luca, A.; Baschi, R.; Cicero, C.E.; Mostile, G.; Davi, M.; Pilati, L.; Restivo, V.; Zappia, M.; Monastero, R. Incidence of Mild Cognitive Impairment and Dementia in Parkinson’s Disease: The Parkinson’s Disease Cognitive Impairment Study. Front. Aging Neurosci. 2019, 11, 21. [Google Scholar] [CrossRef] [PubMed]
- Mamikonyan, E.; Xie, S.X.; Melvin, E.; Weintraub, D. Rivastigmine for mild cognitive impairment in Parkinson disease: A placebo-controlled study. Mov. Disord. 2015, 30, 912–918. [Google Scholar] [CrossRef] [PubMed]
- Dibilio, V.; Nicoletti, A.; Mostile, G.; Portaro, G.; Luca, A.; Patti, F.; Zappia, M. Computer-assisted cognitive rehabilitation on freezing of gait in Parkinson’s disease: A pilot study. Neurosci. Lett. 2017, 654, 38–41. [Google Scholar] [CrossRef]


| Entire cohort (n = 82) | ||
|---|---|---|
| Sex (Male/Female) | 45/37 | |
| Age, years | 60.9 (7.3) | |
| Disease duration, years | 6.4 (5.4) | |
| BMI | 23.9 (3.2) | |
| Education | 10.4 (4.3) | |
| Baseline | Follow-up | |
| LEDD | 686.8 (349.2) | 821.0 (395.2) † |
| UPDRS | 27.6 (16.4) | 33.7 (19.2) † |
| I | 1.6 (1.9) | 1.8 (1.7) |
| II | 7.1 (4.9) | 10.5 (6.6) † |
| III | 17.3 (10.7) | 19.8 (11.7) † |
| IV | 1.6 (2.1) | 1.6 (2.2) |
| MHY | 1.9 (0.8) | 2.2 (1.0) † |
| 1 | 31 | 23 |
| 1.5 | 9 | 6 |
| 2 | 9 | 16 |
| 2.5 | 18 | 10 |
| 3 | 15 | 19 |
| 4 | 0 | 6 |
| 5 | 0 | 2 |
| ADL | 0.9 (0.1) | 0.8 (0.1) † |
| PDQ39SI | 22.7 (18.8) | 33.9 (24.5) † |
| SF36SI | 100.5 (6.2) | 95.9 (7.9) † |
| FA | MD | |||||||||||
|---|---|---|---|---|---|---|---|---|---|---|---|---|
| 90th Percentile | 50th Percentile | 10th Percentile | 90th Percentile | 50th Percentile | 10th Percentile | |||||||
| Brain Region | Baseline | Follow-Up | Baseline | Follow-Up | Baseline | Follow-Up | Baseline | Follow-Up | Baseline | Follow-Up | Baseline | Follow-Up |
| Precentral L | 0.71 ± 0.05 | 0.70 ± 0.05 | 0.33 ± 0.04 | 0.30 ± 0.04 ** | 0.11 ± 0.01 | 0.10 ± 0.04 | 1.60 ± 0.14 | 1.71 ± 0.12 ** | 0.71 ± 0.04 | 0.74 ± 0.03 ** | 0.37 ± 0.06 | 0.36 ± 0.05 |
| Precentral R | 0.67 ± 0.05 | 0.67 ± 0.05 | 0.29 ± 0.04 | 0.26 ± 0.04 ** | 0.10 ± 0.01 | 0.10 ± 0.03 | 1.74 ± 0.15 | 1.83 ± 0.11 ** | 0.76 ± 0.04 | 0.80 ± 0.04 ** | 0.40 ± 0.05 | 0.38 ± 0.04 ** |
| SuperiorFrontal L | 0.64 ± 0.06 | 0.61 ± 0.06 ** | 0.30 ± 0.04 | 0.26 ± 0.04 ** | 0.11 ± 0.02 | 0.10 ± 0.03 | 1.58 ± 0.18 | 1.73 ± 0.12 ** | 0.73 ± 0.04 | 0.77 ± 0.05 ** | 0.41 ± 0.05 | 0.42 ± 0.04 |
| SuperiorFrontal R | 0.60 ± 0.05 | 0.59 ± 0.05 | 0.28 ± 0.04 | 0.26 ± 0.04 ** | 0.11 ± 0.02 | 0.10 ± 0.03 | 1.58 ± 0.19 | 1.71 ± 0.11 ** | 0.76 ± 0.04 | 0.78 ± 0.04 ** | 0.44 ± 0.05 | 0.43 ± 0.04 |
| SuperiorFrontal, Orbital L | 0.58 ± 0.15 | 0.55 ± 0.09 | 0.27 ± 0.11 | 0.23 ± 0.05 | 0.11 ± 0.04 | 0.10 ± 0.04 | 1.50 ± 0.29 | 1.67 ± 0.24 ** | 0.76 ± 0.11 | 0.83 ± 0.07 ** | 0.45 ± 0.08 | 0.43 ± 0.08 |
| SuperiorFrontal, Orbital R | 0.53 ± 0.16 | 0.51 ± 0.09 | 0.26 ± 0.09 | 0.22 ± 0.04 | 0.11 ± 0.04 | 0.10 ± 0.04 | 1.50 ± 0.23 | 1.66 ± 0.22 ** | 0.79 ± 0.08 | 0.86 ± 0.06 ** | 0.47 ± 0.12 | 0.47 ± 0.08 |
| MiddleFrontal L | 0.59 ± 0.05 | 0.57 ± 0.05 | 0.26 ± 0.04 | 0.23 ± 0.04 ** | 0.10 ± 0.01 | 0.10 ± 0.04 | 1.57 ± 0.16 | 1.74 ± 0.11 ** | 0.76 ± 0.04 | 0.80 ± 0.04 ** | 0.44 ± 0.04 | 0.43 ± 0.04 |
| MiddleFrontal R | 0.55 ± 0.04 | 0.54 ± 0.05 | 0.24 ± 0.03 | 0.22 ± 0.04 | 0.10 ± 0.01 | 0.10 ± 0.04 | 1.58 ± 0.16 | 1.73 ± 0.13 ** | 0.80 ± 0.04 | 0.83 ± 0.05 ** | 0.48 ± 0.04 | 0.47 ± 0.04 |
| MiddleFrontal, Orbital L | 0.58 ± 0.14 | 0.52 ± 0.06 | 0.27 ± 0.06 | 0.24 ± 0.04 | 0.11 ± 0.02 | 0.11 ± 0.03 | 1.44 ± 0.41 | 1.46 ± 0.20 | 0.79 ± 0.21 | 0.80 ± 0.05 | 0.44 ± 0.09 | 0.46 ± 0.05 |
| MiddleFrontal, Orbital R | 0.51 ± 0.15 | 0.45 ± 0.07 | 0.23 ± 0.05 | 0.21 ± 0.05 | 0.10 ± 0.02 | 0.10 ± 0.04 | 1.51 ± 0.43 | 1.56 ± 0.21 | 0.88 ± 0.30 | 0.87 ± 0.06 | 0.48 ± 0.13 | 0.52 ± 0.06 |
| InferiorFrontal, Opercular L | 0.59 ± 0.08 | 0.62 ± 0.07 | 0.25 ± 0.05 | 0.26 ± 0.05 | 0.10 ± 0.01 | 0.10 ± 0.04 | 1.83 ± 0.43 | 1.74 ± 0.16 | 0.88 ± 0.33 | 0.80 ± 0.06 | 0.45 ± 0.07 | 0.43 ± 0.06 |
| InferiorFrontal, Opercular R | 0.53 ± 0.06 | 0.55 ± 0.07 | 0.23 ± 0.04 | 0.24 ± 0.05 | 0.10 ± 0.01 | 0.10 ± 0.04 | 1.78 ± 0.39 | 1.72 ± 0.17 | 0.88 ± 0.13 | 0.85 ± 0.07 | 0.50 ± 0.05 | 0.48 ± 0.05 |
| InferiorFrontal, Triangular L | 0.59 ± 0.08 | 0.57 ± 0.05 | 0.25 ± 0.03 | 0.24 ± 0.05 | 0.10 ± 0.01 | 0.10 ± 0.04 | 1.72 ± 0.30 | 1.73 ± 0.14 | 0.80 ± 0.07 | 0.81 ± 0.05 | 0.43 ± 0.07 | 0.44 ± 0.04 |
| InferiorFrontal, Triangular R | 0.58 ± 0.10 | 0.55 ± 0.05 | 0.25 ± 0.04 | 0.24 ± 0.04 | 0.10 ± 0.01 | 0.10 ± 0.04 | 1.71 ± 0.28 | 1.74 ± 0.15 | 0.82 ± 0.10 | 0.83 ± 0.04 | 0.44 ± 0.09 | 0.46 ± 0.05 |
| InferiorFrontal, Orbital L | 0.57 ± 0.13 | 0.56 ± 0.08 | 0.27 ± 0.08 | 0.25 ± 0.04 | 0.12 ± 0.02 | 0.12 ± 0.04 | 1.57 ± 0.29 | 1.59 ± 0.15 | 0.79 ± 0.10 | 0.82 ± 0.04 | 0.45 ± 0.09 | 0.44 ± 0.08 |
| InferiorFrontal, Orbital R | 0.55 ± 0.14 | 0.56 ± 0.10 | 0.25 ± 0.08 | 0.24 ± 0.05 | 0.12 ± 0.03 | 0.11 ± 0.04 | 1.64 ± 0.29 | 1.68 ± 0.18 | 0.84 ± 0.10 | 0.85 ± 0.05 | 0.45 ± 0.12 | 0.43 ± 0.10 |
| RolandicOperculum L | 0.58 ± 0.08 | 0.61 ± 0.08 | 0.25 ± 0.04 | 0.28 ± 0.05 ** | 0.11 ± 0.02 | 0.12 ± 0.04 | 1.82 ± 0.39 | 1.61 ± 0.23 ** | 0.88 ± 0.26 | 0.77 ± 0.07 | 0.42 ± 0.06 | 0.40 ± 0.06 |
| RolandicOperculum R | 0.53 ± 0.07 | 0.55 ± 0.06 | 0.24 ± 0.03 | 0.26 ± 0.05 | 0.11 ± 0.01 | 0.12 ± 0.04 | 1.76 ± 0.41 | 1.57 ± 0.24 ** | 0.84 ± 0.10 | 0.79 ± 0.06 ** | 0.45 ± 0.05 | 0.44 ± 0.05 |
| SupplementaryMotorArea L | 0.61 ± 0.08 | 0.60 ± 0.07 | 0.27 ± 0.03 | 0.27 ± 0.04 | 0.11 ± 0.01 | 0.11 ± 0.03 | 1.72 ± 0.24 | 1.66 ± 0.16 | 0.80 ± 0.06 | 0.79 ± 0.05 | 0.43 ± 0.06 | 0.40 ± 0.07 ** |
| SupplementaryMotorArea R | 0.62 ± 0.07 | 0.62 ± 0.05 | 0.30 ± 0.03 | 0.29 ± 0.04 | 0.12 ± 0.01 | 0.12 ± 0.04 | 1.58 ± 0.23 | 1.57 ± 0.15 | 0.76 ± 0.04 | 0.77 ± 0.03 | 0.43 ± 0.06 | 0.41 ± 0.05 ** |
| Olfactory L | 0.49 ± 0.17 | 0.45 ± 0.09 | 0.27 ± 0.12 | 0.23 ± 0.05 | 0.13 ± 0.02 | 0.12 ± 0.04 | 1.37 ± 0.33 | 1.39 ± 0.26 | 0.79 ± 0.15 | 0.83 ± 0.07 | 0.52 ± 0.14 | 0.55 ± 0.07 |
| Olfactory R | 0.52 ± 0.17 | 0.50 ± 0.10 | 0.29 ± 0.09 | 0.27 ± 0.05 | 0.14 ± 0.03 | 0.14 ± 0.04 | 1.17 ± 0.29 | 1.18 ± 0.22 | 0.77 ± 0.12 | 0.79 ± 0.07 | 0.51 ± 0.13 | 0.53 ± 0.07 |
| SuperiorFrontal, Medial L | 0.50 ± 0.08 | 0.50 ± 0.05 | 0.21 ± 0.03 | 0.22 ± 0.04 | 0.09 ± 0.01 | 0.10 ± 0.04 | 1.87 ± 0.25 | 1.86 ± 0.14 | 0.85 ± 0.09 | 0.83 ± 0.04 | 0.46 ± 0.08 | 0.46 ± 0.04 |
| SuperiorFrontal, Medial R | 0.51 ± 0.07 | 0.51 ± 0.06 | 0.24 ± 0.02 | 0.23 ± 0.04 | 0.10 ± 0.01 | 0.10 ± 0.04 | 1.65 ± 0.20 | 1.78 ± 0.18 ** | 0.80 ± 0.04 | 0.82 ± 0.05 | 0.46 ± 0.07 | 0.46 ± 0.05 |
| SuperiorFrontal, MedialOrbital L | 0.48 ± 0.14 | 0.44 ± 0.07 | 0.22 ± 0.10 | 0.19 ± 0.05 | 0.10 ± 0.04 | 0.10 ± 0.04 | 1.75 ± 0.32 | 1.91 ± 0.26 ** | 0.85 ± 0.13 | 0.90 ± 0.08 | 0.50 ± 0.08 | 0.51 ± 0.06 |
| SuperiorFrontal, MedialOrbital R | 0.51 ± 0.14 | 0.47 ± 0.06 | 0.24 ± 0.08 | 0.22 ± 0.04 | 0.11 ± 0.03 | 0.10 ± 0.03 | 1.51 ± 0.26 | 1.63 ± 0.26 ** | 0.79 ± 0.10 | 0.83 ± 0.06 | 0.50 ± 0.07 | 0.51 ± 0.05 |
| Rectus L | 0.60 ± 0.15 | 0.54 ± 0.08 | 0.29 ± 0.09 | 0.24 ± 0.05 | 0.13 ± 0.03 | 0.11 ± 0.04 | 1.50 ± 0.26 | 1.65 ± 0.25 ** | 0.76 ± 0.10 | 0.83 ± 0.07 ** | 0.42 ± 0.09 | 0.43 ± 0.06 |
| Rectus R | 0.59 ± 0.14 | 0.54 ± 0.07 | 0.29 ± 0.08 | 0.25 ± 0.04 | 0.13 ± 0.03 | 0.12 ± 0.04 | 1.28 ± 0.26 | 1.45 ± 0.30 ** | 0.76 ± 0.09 | 0.80 ± 0.06 ** | 0.43 ± 0.10 | 0.44 ± 0.06 |
| Insula L | 0.49 ± 0.06 | 0.48 ± 0.05 | 0.24 ± 0.02 | 0.22 ± 0.04 | 0.11 ± 0.01 | 0.11 ± 0.04 | 1.69 ± 0.43 | 1.73 ± 0.21 | 0.84 ± 0.08 | 0.87 ± 0.06 | 0.48 ± 0.04 | 0.49 ± 0.04 |
| Insula R | 0.45 ± 0.07 | 0.43 ± 0.05 | 0.21 ± 0.03 | 0.20 ± 0.05 | 0.11 ± 0.01 | 0.10 ± 0.04 | 1.90 ± 0.34 | 1.97 ± 0.19 | 0.95 ± 0.13 | 1.04 ± 0.12 ** | 0.51 ± 0.05 | 0.52 ± 0.04 |
| Cingulum, Anterior L | 0.50 ± 0.10 | 0.43 ± 0.06 ** | 0.21 ± 0.02 | 0.20 ± 0.05 | 0.10 ± 0.01 | 0.10 ± 0.04 | 1.72 ± 0.30 | 1.76 ± 0.19 | 0.87 ± 0.09 | 0.88 ± 0.06 | 0.52 ± 0.08 | 0.54 ± 0.04 |
| Cingulum, Anterior R | 0.50 ± 0.07 | 0.47 ± 0.05 | 0.23 ± 0.02 | 0.23 ± 0.04 | 0.11 ± 0.01 | 0.11 ± 0.04 | 1.44 ± 0.33 | 1.39 ± 0.24 | 0.80 ± 0.05 | 0.80 ± 0.05 | 0.53 ± 0.05 | 0.53 ± 0.04 |
| Cingulum, Middle L | 0.68 ± 0.08 | 0.60 ± 0.07 ** | 0.27 ± 0.04 | 0.24 ± 0.05 | 0.12 ± 0.02 | 0.11 ± 0.04 | 1.62 ± 0.41 | 1.65 ± 0.19 | 0.91 ± 0.46 | 0.83 ± 0.05 | 0.46 ± 0.09 | 0.46 ± 0.04 |
| Cingulum, Middle R | 0.69 ± 0.08 | 0.60 ± 0.06 ** | 0.29 ± 0.05 | 0.26 ± 0.04 | 0.13 ± 0.02 | 0.12 ± 0.04 | 1.48 ± 0.46 | 1.53 ± 0.19 | 0.88 ± 0.45 | 0.79 ± 0.04 | 0.45 ± 0.09 | 0.45 ± 0.04 |
| Cingulum, Posterior L | 0.83 ± 0.08 | 0.77 ± 0.09 ** | 0.37 ± 0.08 | 0.33 ± 0.06 | 0.15 ± 0.02 | 0.14 ± 0.05 | 1.46 ± 0.38 | 1.38 ± 0.24 | 0.77 ± 0.17 | 0.75 ± 0.06 | 0.40 ± 0.07 | 0.43 ± 0.06 |
| Cingulum, Posterior R | 0.91 ± 0.07 | 0.90 ± 0.08 | 0.50 ± 0.13 | 0.47 ± 0.09 | 0.19 ± 0.04 | 0.18 ± 0.04 | 1.31 ± 0.46 | 1.19 ± 0.21 | 0.74 ± 0.28 | 0.66 ± 0.06 | 0.35 ± 0.07 | 0.35 ± 0.07 |
| Hippocampus L | 0.49 ± 0.09 | 0.47 ± 0.06 | 0.26 ± 0.03 | 0.26 ± 0.05 | 0.14 ± 0.01 | 0.14 ± 0.04 | 1.77 ± 0.26 | 1.84 ± 0.27 | 0.99 ± 0.14 | 1.00 ± 0.17 | 0.55 ± 0.10 | 0.56 ± 0.05 |
| Hippocampus R | 0.50 ± 0.10 | 0.48 ± 0.07 | 0.26 ± 0.03 | 0.25 ± 0.05 | 0.14 ± 0.02 | 0.14 ± 0.04 | 1.79 ± 0.24 | 1.88 ± 0.24 ** | 0.99 ± 0.17 | 1.02 ± 0.15 | 0.54 ± 0.11 | 0.56 ± 0.06 |
| ParaHippocampus L | 0.71 ± 0.10 | 0.68 ± 0.07 | 0.33 ± 0.03 | 0.34 ± 0.04 | 0.16 ± 0.01 | 0.17 ± 0.03 | 1.62 ± 0.31 | 1.60 ± 0.21 | 0.75 ± 0.09 | 0.74 ± 0.05 | 0.35 ± 0.08 | 0.37 ± 0.06 |
| ParaHippocampus R | 0.70 ± 0.11 | 0.68 ± 0.07 | 0.33 ± 0.05 | 0.34 ± 0.04 | 0.16 ± 0.02 | 0.17 ± 0.04 | 1.39 ± 0.29 | 1.30 ± 0.21 | 0.72 ± 0.09 | 0.71 ± 0.05 | 0.36 ± 0.08 | 0.36 ± 0.06 |
| Amygdala L | 0.51 ± 0.08 | 0.53 ± 0.09 | 0.29 ± 0.04 | 0.30 ± 0.05 | 0.16 ± 0.02 | 0.16 ± 0.04 | 1.66 ± 0.30 | 1.67 ± 0.29 | 0.80 ± 0.12 | 0.78 ± 0.07 | 0.48 ± 0.08 | 0.47 ± 0.08 |
| Amygdala R | 0.54 ± 0.08 | 0.54 ± 0.08 | 0.31 ± 0.04 | 0.31 ± 0.05 | 0.17 ± 0.02 | 0.17 ± 0.04 | 1.47 ± 0.24 | 1.49 ± 0.31 | 0.77 ± 0.05 | 0.76 ± 0.06 | 0.47 ± 0.07 | 0.47 ± 0.08 |
| Calcarine L | 0.49 ± 0.07 | 0.50 ± 0.06 | 0.19 ± 0.02 | 0.20 ± 0.05 | 0.09 ± 0.01 | 0.09 ± 0.04 | 1.75 ± 0.17 | 1.80 ± 0.17 | 0.92 ± 0.08 | 0.94 ± 0.09 | 0.50 ± 0.06 | 0.51 ± 0.05 |
| Calcarine R | 0.57 ± 0.07 | 0.57 ± 0.06 | 0.24 ± 0.03 | 0.25 ± 0.04 | 0.10 ± 0.01 | 0.10 ± 0.04 | 1.60 ± 0.19 | 1.64 ± 0.20 | 0.83 ± 0.06 | 0.84 ± 0.06 | 0.48 ± 0.06 | 0.49 ± 0.04 |
| Cuneus L | 0.49 ± 0.05 | 0.50 ± 0.04 | 0.18 ± 0.02 | 0.19 ± 0.04 | 0.08 ± 0.01 | 0.08 ± 0.03 | 1.76 ± 0.17 | 1.78 ± 0.16 | 0.91 ± 0.08 | 0.91 ± 0.07 | 0.50 ± 0.04 | 0.51 ± 0.04 |
| Cuneus R | 0.57 ± 0.05 | 0.57 ± 0.05 | 0.24 ± 0.03 | 0.23 ± 0.05 | 0.09 ± 0.01 | 0.09 ± 0.04 | 1.60 ± 0.20 | 1.65 ± 0.20 | 0.80 ± 0.06 | 0.81 ± 0.06 | 0.47 ± 0.05 | 0.47 ± 0.04 |
| Lingual L | 0.54 ± 0.06 | 0.55 ± 0.05 | 0.26 ± 0.03 | 0.26 ± 0.04 | 0.12 ± 0.01 | 0.12 ± 0.04 | 1.45 ± 0.23 | 1.51 ± 0.20 | 0.80 ± 0.09 | 0.80 ± 0.05 | 0.48 ± 0.05 | 0.46 ± 0.04 |
| Lingual R | 0.61 ± 0.08 | 0.63 ± 0.06 | 0.30 ± 0.04 | 0.29 ± 0.04 | 0.13 ± 0.02 | 0.13 ± 0.04 | 1.39 ± 0.28 | 1.48 ± 0.22 | 0.77 ± 0.12 | 0.77 ± 0.05 | 0.42 ± 0.07 | 0.39 ± 0.06 |
| SuperiorOccipital L | 0.58 ± 0.06 | 0.56 ± 0.05 | 0.26 ± 0.05 | 0.22 ± 0.05 ** | 0.09 ± 0.01 | 0.08 ± 0.04 | 1.54 ± 0.20 | 1.70 ± 0.21 ** | 0.78 ± 0.05 | 0.83 ± 0.05 ** | 0.48 ± 0.06 | 0.48 ± 0.05 |
| SuperiorOccipital R | 0.62 ± 0.06 | 0.60 ± 0.06 | 0.26 ± 0.05 | 0.22 ± 0.05 ** | 0.09 ± 0.01 | 0.08 ± 0.04 | 1.54 ± 0.21 | 1.70 ± 0.20 ** | 0.77 ± 0.04 | 0.83 ± 0.06 ** | 0.47 ± 0.05 | 0.46 ± 0.05 |
| MiddleOccipital L | 0.53 ± 0.05 | 0.47 ± 0.04 ** | 0.23 ± 0.04 | 0.20 ± 0.04 ** | 0.09 ± 0.01 | 0.08 ± 0.04 | 1.38 ± 0.19 | 1.54 ± 0.19 ** | 0.78 ± 0.04 | 0.83 ± 0.05 ** | 0.53 ± 0.04 | 0.55 ± 0.03 ** |
| MiddleOccipital R | 0.51 ± 0.06 | 0.48 ± 0.05 ** | 0.22 ± 0.03 | 0.19 ± 0.04 ** | 0.09 ± 0.01 | 0.09 ± 0.04 | 1.43 ± 0.20 | 1.58 ± 0.20 ** | 0.80 ± 0.05 | 0.86 ± 0.06 ** | 0.51 ± 0.05 | 0.52 ± 0.04 |
| InferiorOccipital L | 0.50 ± 0.06 | 0.47 ± 0.05 ** | 0.26 ± 0.04 | 0.23 ± 0.04 ** | 0.11 ± 0.02 | 0.10 ± 0.04 | 1.20 ± 0.29 | 1.37 ± 0.20 ** | 0.78 ± 0.13 | 0.80 ± 0.04 | 0.54 ± 0.07 | 0.55 ± 0.04 |
| InferiorOccipital R | 0.51 ± 0.09 | 0.50 ± 0.09 | 0.24 ± 0.04 | 0.23 ± 0.05 | 0.11 ± 0.01 | 0.11 ± 0.04 | 1.31 ± 0.26 | 1.45 ± 0.20 ** | 0.78 ± 0.09 | 0.83 ± 0.08 | 0.50 ± 0.09 | 0.49 ± 0.07 |
| Fusiform L | 0.57 ± 0.06 | 0.55 ± 0.05 | 0.29 ± 0.03 | 0.28 ± 0.04 | 0.14 ± 0.02 | 0.14 ± 0.03 | 1.24 ± 0.29 | 1.32 ± 0.18 | 0.76 ± 0.05 | 0.77 ± 0.04 | 0.45 ± 0.07 | 0.46 ± 0.05 |
| Fusiform R | 0.65 ± 0.08 | 0.63 ± 0.06 | 0.32 ± 0.04 | 0.31 ± 0.04 | 0.15 ± 0.02 | 0.15 ± 0.04 | 1.17 ± 0.31 | 1.25 ± 0.20 | 0.71 ± 0.06 | 0.73 ± 0.05 | 0.37 ± 0.09 | 0.39 ± 0.05 |
| Postcentral L | 0.67 ± 0.05 | 0.65 ± 0.05 ** | 0.28 ± 0.04 | 0.25 ± 0.04 ** | 0.10 ± 0.01 | 0.10 ± 0.04 | 1.76 ± 0.17 | 1.81 ± 0.13 | 0.79 ± 0.04 | 0.83 ± 0.04 ** | 0.39 ± 0.05 | 0.38 ± 0.05 |
| Postcentral R | 0.64 ± 0.05 | 0.61 ± 0.05 ** | 0.25 ± 0.04 | 0.22 ± 0.05 ** | 0.09 ± 0.01 | 0.09 ± 0.04 | 1.77 ± 0.15 | 1.83 ± 0.13 | 0.82 ± 0.05 | 0.88 ± 0.06 ** | 0.42 ± 0.05 | 0.41 ± 0.05 |
| SuperiorParietal L | 0.59 ± 0.06 | 0.53 ± 0.05 ** | 0.25 ± 0.05 | 0.20 ± 0.04 ** | 0.08 ± 0.02 | 0.08 ± 0.04 | 1.69 ± 0.19 | 1.83 ± 0.13 ** | 0.81 ± 0.04 | 0.88 ± 0.05 ** | 0.47 ± 0.05 | 0.47 ± 0.05 |
| SuperiorParietal R | 0.57 ± 0.07 | 0.52 ± 0.07 ** | 0.22 ± 0.06 | 0.19 ± 0.05 | 0.08 ± 0.01 | 0.08 ± 0.04 | 1.81 ± 0.17 | 1.82 ± 0.12 | 0.86 ± 0.08 | 0.90 ± 0.06 ** | 0.46 ± 0.05 | 0.46 ± 0.07 |
| InferiorParietal L | 0.56 ± 0.05 | 0.53 ± 0.05 ** | 0.24 ± 0.04 | 0.20 ± 0.04 ** | 0.09 ± 0.01 | 0.08 ± 0.04 | 1.64 ± 0.19 | 1.77 ± 0.15 ** | 0.81 ± 0.05 | 0.87 ± 0.04 ** | 0.48 ± 0.04 | 0.47 ± 0.05 |
| InferiorParietal R | 0.54 ± 0.07 | 0.52 ± 0.06 | 0.20 ± 0.05 | 0.18 ± 0.05 | 0.08 ± 0.01 | 0.08 ± 0.04 | 1.68 ± 0.20 | 1.79 ± 0.17 ** | 0.85 ± 0.08 | 0.91 ± 0.09 ** | 0.48 ± 0.06 | 0.48 ± 0.06 |
| SupraMarginal L | 0.54 ± 0.05 | 0.52 ± 0.06 | 0.24 ± 0.03 | 0.23 ± 0.05 | 0.10 ± 0.01 | 0.10 ± 0.04 | 1.59 ± 0.31 | 1.66 ± 0.20 | 0.82 ± 0.08 | 0.84 ± 0.06 | 0.47 ± 0.05 | 0.48 ± 0.05 |
| SupraMarginal R | 0.51 ± 0.06 | 0.50 ± 0.05 | 0.20 ± 0.02 | 0.19 ± 0.04 | 0.09 ± 0.01 | 0.08 ± 0.04 | 1.69 ± 0.24 | 1.74 ± 0.14 | 0.84 ± 0.05 | 0.87 ± 0.05 ** | 0.48 ± 0.06 | 0.49 ± 0.05 |
| Angular L | 0.52 ± 0.05 | 0.48 ± 0.05 ** | 0.23 ± 0.04 | 0.20 ± 0.04 ** | 0.08 ± 0.01 | 0.08 ± 0.04 | 1.45 ± 0.20 | 1.62 ± 0.18 ** | 0.81 ± 0.05 | 0.85 ± 0.06 ** | 0.56 ± 0.04 | 0.56 ± 0.04 |
| Angular R | 0.52 ± 0.06 | 0.50 ± 0.06 | 0.21 ± 0.03 | 0.19 ± 0.04 | 0.09 ± 0.01 | 0.08 ± 0.04 | 1.51 ± 0.19 | 1.64 ± 0.15 ** | 0.82 ± 0.06 | 0.87 ± 0.05 ** | 0.53 ± 0.05 | 0.53 ± 0.06 |
| Precuneus L | 0.50 ± 0.06 | 0.52 ± 0.05 | 0.20 ± 0.02 | 0.20 ± 0.04 | 0.09 ± 0.01 | 0.09 ± 0.04 | 1.74 ± 0.17 | 1.71 ± 0.16 | 0.87 ± 0.04 | 0.86 ± 0.04 | 0.50 ± 0.05 | 0.49 ± 0.05 |
| Precuneus R | 0.57 ± 0.07 | 0.57 ± 0.05 | 0.23 ± 0.03 | 0.23 ± 0.04 | 0.09 ± 0.01 | 0.09 ± 0.04 | 1.65 ± 0.18 | 1.69 ± 0.15 | 0.82 ± 0.05 | 0.83 ± 0.04 | 0.46 ± 0.05 | 0.46 ± 0.04 |
| Paracentralobule L | 0.65 ± 0.07 | 0.65 ± 0.07 | 0.31 ± 0.03 | 0.29 ± 0.04 | 0.11 ± 0.01 | 0.10 ± 0.03 | 1.63 ± 0.21 | 1.70 ± 0.19 | 0.74 ± 0.04 | 0.76 ± 0.04 | 0.40 ± 0.07 | 0.37 ± 0.07 |
| Paracentralobule R | 0.60 ± 0.08 | 0.59 ± 0.08 | 0.26 ± 0.04 | 0.25 ± 0.05 | 0.10 ± 0.01 | 0.10 ± 0.04 | 1.70 ± 0.25 | 1.74 ± 0.21 | 0.79 ± 0.08 | 0.81 ± 0.08 | 0.39 ± 0.08 | 0.37 ± 0.08 |
| Caudate L | 0.66 ± 0.10 | 0.58 ± 0.10 ** | 0.29 ± 0.05 | 0.26 ± 0.06 ** | 0.13 ± 0.02 | 0.12 ± 0.05 | 1.90 ± 0.42 | 2.17 ± 0.37 ** | 0.81 ± 0.14 | 0.96 ± 0.25 ** | 0.36 ± 0.08 | 0.42 ± 0.11 ** |
| Caudate R | 0.62 ± 0.10 | 0.59 ± 0.10 | 0.30 ± 0.04 | 0.28 ± 0.06 | 0.14 ± 0.02 | 0.14 ± 0.05 | 1.66 ± 0.44 | 1.82 ± 0.49 | 0.75 ± 0.08 | 0.84 ± 0.22 ** | 0.37 ± 0.09 | 0.41 ± 0.10 |
| Putamen L | 0.83 ± 0.09 | 0.82 ± 0.09 | 0.46 ± 0.08 | 0.48 ± 0.06 | 0.24 ± 0.05 | 0.25 ± 0.04 | 0.96 ± 0.40 | 0.86 ± 0.10 | 0.58 ± 0.09 | 0.57 ± 0.08 | 0.22 ± 0.09 | 0.24 ± 0.09 |
| Putamen R | 0.76 ± 0.08 | 0.75 ± 0.07 | 0.43 ± 0.06 | 0.44 ± 0.05 | 0.23 ± 0.04 | 0.24 ± 0.03 | 1.00 ± 0.36 | 0.89 ± 0.08 | 0.64 ± 0.08 | 0.63 ± 0.06 | 0.29 ± 0.09 | 0.31 ± 0.08 |
| Pallidum L | 0.94 ± 0.15 | 0.98 ± 0.06 | 0.65 ± 0.16 | 0.68 ± 0.08 | 0.33 ± 0.09 | 0.36 ± 0.06 | 0.95 ± 0.56 | 0.79 ± 0.12 | 0.47 ± 0.29 | 0.40 ± 0.12 | 0.13 ± 0.17 | 0.08 ± 0.09 |
| Pallidum R | 0.92 ± 0.15 | 0.96 ± 0.07 | 0.60 ± 0.15 | 0.63 ± 0.09 | 0.31 ± 0.08 | 0.32 ± 0.06 | 0.99 ± 0.48 | 0.84 ± 0.13 | 0.50 ± 0.21 | 0.45 ± 0.11 | 0.13 ± 0.14 | 0.09 ± 0.07 |
| Thalamus L | 0.83 ± 0.06 | 0.80 ± 0.05 | 0.48 ± 0.05 | 0.46 ± 0.05 | 0.24 ± 0.04 | 0.22 ± 0.04 | 1.14 ± 0.51 | 1.27 ± 0.36 | 0.59 ± 0.08 | 0.61 ± 0.05 | 0.24 ± 0.06 | 0.27 ± 0.05 |
| Thalamus R | 0.82 ± 0.05 | 0.81 ± 0.05 | 0.48 ± 0.05 | 0.47 ± 0.05 | 0.25 ± 0.04 | 0.23 ± 0.04 | 1.07 ± 0.48 | 1.14 ± 0.33 | 0.60 ± 0.10 | 0.60 ± 0.05 | 0.25 ± 0.05 | 0.25 ± 0.05 |
| Heschl L | 0.63 ± 0.12 | 0.61 ± 0.13 | 0.28 ± 0.08 | 0.26 ± 0.08 | 0.13 ± 0.03 | 0.12 ± 0.05 | 1.81 ± 0.33 | 1.93 ± 0.28 | 0.92 ± 0.22 | 1.00 ± 0.29 | 0.38 ± 0.12 | 0.37 ± 0.12 |
| Heschl R | 0.64 ± 0.14 | 0.66 ± 0.12 | 0.28 ± 0.09 | 0.28 ± 0.08 | 0.13 ± 0.04 | 0.12 ± 0.05 | 1.76 ± 0.40 | 1.87 ± 0.38 | 0.89 ± 0.25 | 0.87 ± 0.27 | 0.33 ± 0.11 | 0.32 ± 0.12 |
| SuperiorTemporal L | 0.64 ± 0.06 | 0.62 ± 0.05 | 0.27 ± 0.03 | 0.25 ± 0.05 | 0.11 ± 0.01 | 0.11 ± 0.04 | 1.67 ± 0.19 | 1.77 ± 0.16 ** | 0.78 ± 0.06 | 0.79 ± 0.05 | 0.37 ± 0.05 | 0.37 ± 0.04 |
| SuperiorTemporal R | 0.62 ± 0.06 | 0.61 ± 0.05 | 0.26 ± 0.02 | 0.26 ± 0.04 | 0.11 ± 0.01 | 0.11 ± 0.04 | 1.55 ± 0.15 | 1.63 ± 0.15 ** | 0.75 ± 0.04 | 0.77 ± 0.04 ** | 0.40 ± 0.05 | 0.41 ± 0.04 |
| SuperiorTemporalPole L | 0.46 ± 0.11 | 0.44 ± 0.06 | 0.21 ± 0.04 | 0.21 ± 0.04 | 0.10 ± 0.02 | 0.10 ± 0.04 | 1.99 ± 0.27 | 2.03 ± 0.19 | 0.93 ± 0.15 | 0.91 ± 0.08 | 0.48 ± 0.09 | 0.50 ± 0.06 |
| SuperiorTemporalPole R | 0.46 ± 0.11 | 0.46 ± 0.06 | 0.23 ± 0.06 | 0.23 ± 0.04 | 0.11 ± 0.01 | 0.11 ± 0.04 | 1.75 ± 0.23 | 1.77 ± 0.18 | 0.84 ± 0.09 | 0.84 ± 0.06 | 0.49 ± 0.06 | 0.49 ± 0.06 |
| MiddleTemporal L | 0.57 ± 0.06 | 0.54 ± 0.04 ** | 0.25 ± 0.02 | 0.23 ± 0.04 | 0.11 ± 0.01 | 0.10 ± 0.04 | 1.40 ± 0.18 | 1.52 ± 0.16 ** | 0.77 ± 0.04 | 0.80 ± 0.04 ** | 0.44 ± 0.06 | 0.46 ± 0.04 |
| MiddleTemporal R | 0.52 ± 0.08 | 0.50 ± 0.06 | 0.22 ± 0.02 | 0.22 ± 0.04 | 0.10 ± 0.01 | 0.10 ± 0.04 | 1.42 ± 0.17 | 1.52 ± 0.16 ** | 0.79 ± 0.05 | 0.82 ± 0.05 ** | 0.46 ± 0.09 | 0.48 ± 0.05 |
| MiddleTemporalPole L | 0.52 ± 0.14 | 0.47 ± 0.06 | 0.27 ± 0.10 | 0.25 ± 0.04 | 0.13 ± 0.05 | 0.12 ± 0.04 | 1.40 ± 0.29 | 1.44 ± 0.24 | 0.78 ± 0.13 | 0.81 ± 0.06 | 0.49 ± 0.09 | 0.51 ± 0.06 |
| MiddleTemporalPole R | 0.56 ± 0.13 | 0.49 ± 0.08 | 0.29 ± 0.10 | 0.25 ± 0.04 | 0.13 ± 0.03 | 0.12 ± 0.03 | 1.28 ± 0.21 | 1.36 ± 0.21 | 0.75 ± 0.11 | 0.80 ± 0.05 | 0.47 ± 0.10 | 0.50 ± 0.07 |
| InferiorTemporal L | 0.68 ± 0.11 | 0.61 ± 0.05 ** | 0.31 ± 0.04 | 0.28 ± 0.04 ** | 0.13 ± 0.01 | 0.13 ± 0.04 | 1.17 ± 0.25 | 1.26 ± 0.18 ** | 0.71 ± 0.06 | 0.75 ± 0.04 ** | 0.39 ± 0.08 | 0.42 ± 0.04 |
| InferiorTemporal R | 0.62 ± 0.13 | 0.57 ± 0.06 | 0.28 ± 0.06 | 0.26 ± 0.04 | 0.12 ± 0.01 | 0.12 ± 0.04 | 1.27 ± 0.28 | 1.37 ± 0.17 | 0.73 ± 0.09 | 0.78 ± 0.04 ** | 0.43 ± 0.06 | 0.44 ± 0.04 |
| SupeiorSemilunar L | 0.36 ± 0.06 | 0.37 ± 0.07 | 0.19 ± 0.02 | 0.20 ± 0.04 | 0.10 ± 0.01 | 0.11 ± 0.04 | 1.80 ± 0.22 | 1.73 ± 0.18 | 0.97 ± 0.09 | 0.90 ± 0.11 ** | 0.57 ± 0.07 | 0.57 ± 0.05 |
| SupeiorSemilunar R | 0.45 ± 0.11 | 0.41 ± 0.09 | 0.21 ± 0.02 | 0.22 ± 0.04 | 0.11 ± 0.01 | 0.12 ± 0.03 | 1.78 ± 0.25 | 1.67 ± 0.21 | 0.92 ± 0.09 | 0.88 ± 0.13 | 0.49 ± 0.10 | 0.54 ± 0.12 |
| InfeiorSemilunar L | 0.39 ± 0.12 | 0.37 ± 0.10 | 0.21 ± 0.03 | 0.21 ± 0.06 | 0.11 ± 0.02 | 0.12 ± 0.04 | 1.63 ± 0.24 | 1.58 ± 0.30 | 0.84 ± 0.07 | 0.91 ± 0.24 | 0.54 ± 0.10 | 0.60 ± 0.17 |
| InfeiorSemilunar R | 0.42 ± 0.11 | 0.37 ± 0.12 | 0.22 ± 0.04 | 0.21 ± 0.05 | 0.12 ± 0.02 | 0.12 ± 0.04 | 1.67 ± 0.26 | 1.63 ± 0.37 | 0.86 ± 0.23 | 1.00 ± 0.39 | 0.50 ± 0.11 | 0.64 ± 0.38 |
| Alae L | 0.51 ± 0.18 | 0.47 ± 0.13 | 0.25 ± 0.10 | 0.23 ± 0.06 | 0.14 ± 0.05 | 0.13 ± 0.05 | 2.17 ± 0.43 | 2.14 ± 0.24 | 1.19 ± 0.35 | 1.31 ± 0.31 | 0.51 ± 0.18 | 0.60 ± 0.22 |
| Alae R | 0.55 ± 0.18 | 0.56 ± 0.14 | 0.28 ± 0.10 | 0.27 ± 0.06 | 0.15 ± 0.06 | 0.14 ± 0.04 | 2.02 ± 0.42 | 2.02 ± 0.28 | 1.02 ± 0.32 | 1.08 ± 0.29 | 0.43 ± 0.16 | 0.43 ± 0.14 |
| Quadrangular L | 0.50 ± 0.14 | 0.50 ± 0.07 | 0.27 ± 0.09 | 0.26 ± 0.04 | 0.13 ± 0.02 | 0.14 ± 0.03 | 1.68 ± 0.25 | 1.58 ± 0.24 | 0.85 ± 0.12 | 0.80 ± 0.08 | 0.47 ± 0.09 | 0.45 ± 0.06 |
| Quadrangular R | 0.51 ± 0.16 | 0.51 ± 0.08 | 0.28 ± 0.10 | 0.27 ± 0.05 | 0.14 ± 0.02 | 0.15 ± 0.04 | 1.79 ± 0.25 | 1.64 ± 0.25 ** | 0.89 ± 0.15 | 0.83 ± 0.09 | 0.47 ± 0.10 | 0.45 ± 0.07 |
| LobulusSimplex L | 0.39 ± 0.09 | 0.38 ± 0.05 | 0.22 ± 0.04 | 0.22 ± 0.04 | 0.12 ± 0.02 | 0.12 ± 0.03 | 1.60 ± 0.22 | 1.53 ± 0.20 | 0.89 ± 0.10 | 0.83 ± 0.07 | 0.55 ± 0.07 | 0.54 ± 0.04 |
| LobulusSimplex R | 0.44 ± 0.11 | 0.43 ± 0.05 | 0.25 ± 0.05 | 0.25 ± 0.04 | 0.13 ± 0.02 | 0.14 ± 0.03 | 1.53 ± 0.20 | 1.39 ± 0.19 ** | 0.84 ± 0.10 | 0.78 ± 0.06 ** | 0.51 ± 0.08 | 0.50 ± 0.05 |
| Biventral L | 0.51 ± 0.11 | 0.39 ± 0.12 ** | 0.29 ± 0.07 | 0.23 ± 0.07 ** | 0.16 ± 0.04 | 0.14 ± 0.05 | 1.08 ± 0.48 | 1.48 ± 0.51 ** | 0.70 ± 0.11 | 0.96 ± 0.38 ** | 0.49 ± 0.10 | 0.65 ± 0.33 |
| Biventral R | 0.54 ± 0.13 | 0.41 ± 0.15 ** | 0.29 ± 0.06 | 0.24 ± 0.07 ** | 0.16 ± 0.04 | 0.13 ± 0.05 | 1.13 ± 0.47 | 1.47 ± 0.47 ** | 0.73 ± 0.19 | 0.95 ± 0.37 ** | 0.47 ± 0.12 | 0.63 ± 0.32 |
| Biventral L | 0.66 ± 0.11 | 0.52 ± 0.13 ** | 0.38 ± 0.06 | 0.28 ± 0.07 ** | 0.18 ± 0.04 | 0.15 ± 0.04 | 1.08 ± 0.38 | 1.32 ± 0.43 | 0.64 ± 0.07 | 0.81 ± 0.29 ** | 0.40 ± 0.08 | 0.51 ± 0.21 |
| Biventral R | 0.72 ± 0.12 | 0.62 ± 0.16 | 0.41 ± 0.07 | 0.34 ± 0.09 ** | 0.20 ± 0.03 | 0.18 ± 0.06 | 0.92 ± 0.27 | 1.12 ± 0.34 | 0.61 ± 0.09 | 0.71 ± 0.24 | 0.34 ± 0.08 | 0.43 ± 0.23 |
| Tonsil L | 0.76 ± 0.11 | 0.64 ± 0.13 ** | 0.39 ± 0.07 | 0.31 ± 0.07 ** | 0.17 ± 0.03 | 0.16 ± 0.04 | 1.52 ± 0.33 | 1.74 ± 0.30 ** | 0.69 ± 0.15 | 0.83 ± 0.23 ** | 0.32 ± 0.09 | 0.40 ± 0.17 |
| Tonsil R | 0.76 ± 0.12 | 0.66 ± 0.14 ** | 0.40 ± 0.06 | 0.33 ± 0.07 ** | 0.18 ± 0.03 | 0.16 ± 0.04 | 1.41 ± 0.24 | 1.64 ± 0.31 ** | 0.66 ± 0.10 | 0.80 ± 0.22 ** | 0.31 ± 0.12 | 0.36 ± 0.16 |
| Flocculus L | 0.86 ± 0.19 | 0.60 ± 0.20 ** | 0.58 ± 0.17 | 0.29 ± 0.09 ** | 0.23 ± 0.10 | 0.14 ± 0.05 ** | 1.54 ± 0.50 | 2.00 ± 0.39 ** | 0.69 ± 0.27 | 1.08 ± 0.35 ** | 0.35 ± 0.22 | 0.47 ± 0.28 |
| Flocculus R | 0.84 ± 0.16 | 0.57 ± 0.20 ** | 0.53 ± 0.18 | 0.25 ± 0.10 ** | 0.20 ± 0.12 | 0.13 ± 0.05 ** | 1.67 ± 0.51 | 2.02 ± 0.43 ** | 0.75 ± 0.28 | 1.15 ± 0.30 ** | 0.40 ± 0.23 | 0.51 ± 0.21 |
| Lingula | 0.44 ± 0.17 | 0.47 ± 0.15 | 0.23 ± 0.08 | 0.26 ± 0.08 | 0.13 ± 0.06 | 0.15 ± 0.07 | 1.92 ± 0.46 | 1.90 ± 0.32 | 1.25 ± 0.40 | 1.25 ± 0.36 | 0.75 ± 0.35 | 0.75 ± 0.31 |
| CentralLobule | 0.49 ± 0.13 | 0.50 ± 0.11 | 0.23 ± 0.04 | 0.24 ± 0.05 | 0.12 ± 0.02 | 0.13 ± 0.04 | 2.16 ± 0.26 | 2.07 ± 0.15 | 1.22 ± 0.38 | 1.11 ± 0.19 | 0.50 ± 0.12 | 0.49 ± 0.12 |
| Culmen | 0.43 ± 0.11 | 0.44 ± 0.07 | 0.22 ± 0.05 | 0.22 ± 0.05 | 0.12 ± 0.02 | 0.12 ± 0.04 | 1.85 ± 0.27 | 1.79 ± 0.17 | 0.99 ± 0.14 | 0.95 ± 0.09 | 0.55 ± 0.10 | 0.54 ± 0.07 |
| Declive | 0.38 ± 0.09 | 0.35 ± 0.07 | 0.18 ± 0.03 | 0.18 ± 0.05 | 0.10 ± 0.02 | 0.10 ± 0.05 | 2.05 ± 0.28 | 1.89 ± 0.16 ** | 1.20 ± 0.20 | 1.11 ± 0.13 | 0.62 ± 0.11 | 0.63 ± 0.08 |
| FoliumTuber | 0.33 ± 0.07 | 0.41 ± 0.07 ** | 0.19 ± 0.03 | 0.23 ± 0.05 ** | 0.10 ± 0.02 | 0.12 ± 0.04 | 1.75 ± 0.29 | 1.55 ± 0.29 ** | 1.07 ± 0.21 | 0.86 ± 0.11 ** | 0.67 ± 0.13 | 0.57 ± 0.09 ** |
| Pyramid | 0.49 ± 0.09 | 0.54 ± 0.10 | 0.27 ± 0.04 | 0.30 ± 0.06 ** | 0.14 ± 0.02 | 0.16 ± 0.04 | 1.22 ± 0.41 | 1.10 ± 0.20 | 0.78 ± 0.24 | 0.69 ± 0.06 | 0.48 ± 0.08 | 0.45 ± 0.07 |
| Uvula | 0.68 ± 0.12 | 0.61 ± 0.13 | 0.39 ± 0.08 | 0.33 ± 0.07 ** | 0.21 ± 0.05 | 0.17 ± 0.06 ** | 1.01 ± 0.45 | 1.37 ± 0.32 ** | 0.65 ± 0.25 | 0.71 ± 0.11 | 0.36 ± 0.11 | 0.37 ± 0.11 |
| Nodule | 0.66 ± 0.16 | 0.53 ± 0.19 ** | 0.35 ± 0.10 | 0.24 ± 0.06 ** | 0.18 ± 0.05 | 0.13 ± 0.03 ** | 1.71 ± 0.51 | 2.19 ± 0.31 ** | 0.79 ± 0.26 | 1.30 ± 0.41 ** | 0.37 ± 0.16 | 0.62 ± 0.33 ** |
| UPDRS_TOTAL | LEDD | PDQ39 SI | MHY | UPDRSI | UPDRSII | UPDRSIII | UPDRSIV | |
|---|---|---|---|---|---|---|---|---|
| Adjusted R2 | 0.94 | 0.89 | 0.88 | 0.86 | 0.57 | 0.92 | 0.93 | 0.92 |
| F Test | 994 | 528 | 479 | 390 | 87.9 | 780 | 834 | 716 |
| LOOCV | ||||||||
| Mean Adjusted R2 | 0.939 ± 0.002 | 0.891 ± 0.004 | 0.881 ± 0.004 | 0.871 ± 0.003 | 0.573 ± 0.012 | 0.923 ± 0.003 | 0.928 ± 0.002 | 0.917 ± 0.006 |
| MAE | 4.39 ± 3.57 | 138.70 ± 112.38 | 8.08 ± 5.39 | 0.40 ± 0.25 | 0.97 ± 0.76 | 1.74 ± 1.31 | 3.21 ± 2.31 | 0.61 ± 0.48 |
| 5-fold CV | ||||||||
| Mean Adjusted R2 | 0.944 ± 0.011 | 0.898 ± 0.006 | 0.882 ± 0.013 | 0.877 ± 0.009 | 0.592 ± 0.051 | 0.930 ± 0.007 | 0.933 ± 0.005 | 0.919 ± 0.021 |
| MAE | 4.94 ± 1.67 | 135.64 ± 23.99 | 7.15 ± 1.32 | 0.39 ± 0.07 | 1.06 ± 0.15 | 2.05 ± 0.46 | 3.35 ± 0.33 | 0.67 ± 0.12 |
| Blind validation | ||||||||
| Adjusted R2 | 0.76 | 0.42 | 0.54 | 0.1 | 0.01 | 0.82 | 0.62 | 0.32 |
| MAE | 8.72 ± 6.24 | 348.17 ± 202.22 | 17.44 ± 11.44 | 1.02 ± 0.93 | 2.19 ± 2.28 | 3.06 ± 2.24 | 7.46 ± 4.07 | 2.10 ± 1.77 |
| MAE in % | 4.38 ± 3.14 | 53.09 ± 44.45 | 11.18 ± 7.33 | 20.40 ± 18.63 | 13.66 ± 14.27 | 5.88 ± 4.31 | 6.90 ± 3.77 | 9.11 ± 7.68 |
| UPDRS_TOTAL = | ||
| +67.84 * Nodule(FA50) | +48.82 * Tonsil L(MD10) | +11.53 * Lingula(MD10) |
| +79.50 * RolandicOperculum R(FA50) | +19.28 * Rectus L(MD90) | +222.21 * Quadrangular R(FA10) |
| −23.12 * Amygdala L(FA90) | +10.08 * Heschl L(MD90) | −7.38 * Flocculus R(MD90) |
| −80.25 * ParaHippocampus L(FA50) | +57.31 * Biventral R(FA10) | +60.29 * Cuneus R(FA50) |
| +6.09 * Alae R(MD50) | −118.61 | |
| UPDRS_I = | ||
| +3.64 * Hippocampus L(MD90) | +18.70 * Olfactory R(FA10) | +36.22 * SuperiorSemilunar R(FA10) |
| −1.83 * SuperiorFrontal, Medial R(MD90) | +12.01 * Thalamus R(MD10) | −31.55 * RolandicOperculum L(FA10) |
| +3.89 * Biventral R(FA90) | +19.83 * FoliumTuber(FA10) | −8.39 * SuperiorTemporalPole R(FA50) |
| −2.72 * SuperiorFrontal, Orbital L(MD90) | −44.07 * InferiorParietal R(FA10) | −6.69 * Culmen(MD10) |
| −3.82 * InferiorFrontal, Orbital R(FA90) | +1.74 | |
| UPDRS_II = | ||
| +8.87 * Nodule(FA50) | −9.99 * Lingual L(MD10) | −21.90 * Thalamus R(FA50) |
| +63.89 * RolandicOperculum R(FA50) | +60.38 * Quadrangular R(FA10) | −54.70 * Insula L(FA50) |
| +78.06 * Cingulum, Middle R(FA10) | +21.55 * Bivnetral R(FA10) | +4.78 * Hippocampus L(MD90) |
| −19.08 * Uvula(FA10) | +3.03 * Rectus L(MD90) | −4.79 * Heschl L(FA90) |
| +1.20 * Lingula(MD10) | −15.43 | |
| UPDRS_III = | ||
| +44.92 * Nodule(FA50) | +33.65 * Tonsil L(MD10) | −17.12 * Heschl R(FA90) |
| +2.39 * Lingula(MD50) | −6.27 * Flocculus R(MD90) | +18.90 * SuperiorTemporalPole R(MD50) |
| +93.69 * Quadrangular R(FA10) | −55.96 * ParaHippocampus L(FA50) | +8.14 * Heschl L(MD90) |
| −23.69 * Caudate R(MD10) | +11.13 * Rectus L(MD90) | +58.03 * Cuneus R(FA50) |
| +5.47 * Lingula(MD10) | −56.224 | |
| UPDRS_IV = | ||
| −0.87 * FoliumTuber(MD90) | −4.84 * CentralLobule (MD10) | −11.18 * Postcentral R(FA90) |
| +9.65 * InferiorOccipital R(FA50) | +28.43 * InferiorFrontal, Orbital L(FA10) | −23.17 * Caudate L(FA10) |
| +21.73 * RolandicOperculum R(FA10) | −31.30 * MiddleFrontal, Orbital R(FA10) | −1.34 * SuperiorFrontal, Orbital L(MD90) |
| −23.42 * LobulusSimplex L(FA10) | +11.19 * Cuneus L(FA50) | +16.83 * Cingulum, Anterior R(FA50) |
| −21.21 * InferiorFrontal, Opercular R(FA10) | +10.32 | |
| LEDD = | ||
| +1347.19 * ParacentralLobule R(MD10) | +3997.05 * InferiorFrontal, Opercular L(FA10) | +728.10 * Tonsil R(MD50) |
| +372.00 * Heschl L(FA90) | −1602.36 * Biventral L(FA10) | −753.08 * MiddleFrontal R(MD90) |
| +2118.39 * Postcentral R(MD50) | −1431.37 * SuperiorOccipital L(MD50) | +2573.81 * Cuneus R(FA50) |
| +486.64 * SuperiorFrontal, MedialOrbital R(MD90) | −1853.35 * Thalamus L(FA50) | +1547.72 * InferiorFrontal, Triangular R(FA50) |
| +298.36 * Alae R(MD10) | −1597.47 | |
| PDQ39SI = | ||
| +370.38 * Quadrangular R(FA10) | +208.71 * RolandicOperculum R(FA50) | +44.90 * SuperiorTemporal R(MD90) |
| +125.00 * Cingulum, Anterior R(MD10) | −10.77 * Biventral L(MD90) | +46.65 * Cingulum, Posterior R(MD10) |
| +10.55 * Lingula(MD50) | −107.68 * MiddleOccipital L(MD10) | +78.75 * Biventral R(FA10) |
| +73.82 * ParacentralLobule L(MD10) | −28.89 * Caudate L(MD10) | −71.872 * Insula R(MD10) |
| +279.08 * SuperiorFrontal, Medial R(FA10) | −211.64 | |
| MHY = | ||
| +8.02 * Nodule(FA50) | +10.74 * Angular L(MD50) | +1.99 * RolandicOperculum L(FA90) |
| −2.70 * ParacentralLobule R(FA90) | +9.83 * Cuneus L(FA50) | +0.55 * Lingula(MD50) |
| +1.37 * Heschl L(MD10) | −6.39 * Insula R(MD10) | +2.22 * Amygdala R(MD10) |
| +0.56 * Caudate L(MD90) | −1.43 * SuperiorFrontal, Orbital R(MD90) | +9.87 * FoliumTuber(FA10) |
| −5.85 * Rectus R(FA10) | −9.14 | |
© 2020 by the authors. Licensee MDPI, Basel, Switzerland. This article is an open access article distributed under the terms and conditions of the Creative Commons Attribution (CC BY) license (http://creativecommons.org/licenses/by/4.0/).
Share and Cite
Tsai, C.-C.; Lin, Y.-C.; Ng, S.-H.; Chen, Y.-L.; Cheng, J.-S.; Lu, C.-S.; Weng, Y.-H.; Lin, S.-H.; Chen, P.-Y.; Wu, Y.-M.; et al. A Method for the Prediction of Clinical Outcome Using Diffusion Magnetic Resonance Imaging: Application on Parkinson’s Disease. J. Clin. Med. 2020, 9, 647. https://doi.org/10.3390/jcm9030647
Tsai C-C, Lin Y-C, Ng S-H, Chen Y-L, Cheng J-S, Lu C-S, Weng Y-H, Lin S-H, Chen P-Y, Wu Y-M, et al. A Method for the Prediction of Clinical Outcome Using Diffusion Magnetic Resonance Imaging: Application on Parkinson’s Disease. Journal of Clinical Medicine. 2020; 9(3):647. https://doi.org/10.3390/jcm9030647
Chicago/Turabian StyleTsai, Chih-Chien, Yu-Chun Lin, Shu-Hang Ng, Yao-Liang Chen, Jur-Shan Cheng, Chin-Song Lu, Yi-Hsin Weng, Sung-Han Lin, Po-Yuan Chen, Yi-Ming Wu, and et al. 2020. "A Method for the Prediction of Clinical Outcome Using Diffusion Magnetic Resonance Imaging: Application on Parkinson’s Disease" Journal of Clinical Medicine 9, no. 3: 647. https://doi.org/10.3390/jcm9030647
APA StyleTsai, C.-C., Lin, Y.-C., Ng, S.-H., Chen, Y.-L., Cheng, J.-S., Lu, C.-S., Weng, Y.-H., Lin, S.-H., Chen, P.-Y., Wu, Y.-M., & Wang, J.-J. (2020). A Method for the Prediction of Clinical Outcome Using Diffusion Magnetic Resonance Imaging: Application on Parkinson’s Disease. Journal of Clinical Medicine, 9(3), 647. https://doi.org/10.3390/jcm9030647