Is Interleukin 17 (IL-17) Expression A Common Point in the Pathogenesis of Depression and Obesity?

 ,
,  ,
, 
Abstract
1. Introduction
2. Experimental Section
2.1. Participants and Data Collection
2.2. Interleukin 17–Protein Expression
2.2.1. Determination of Protein Concentration
2.2.2. Enzyme-Linked Immunosorbent Assay (ELISA)
2.3. Interleukin 17 Gene–mRNA Expression
2.3.1. Total RNA Isolation
2.3.2. Quality Analysis of Isolated RNA
2.3.3. RT-PCR Reverse Transcription
2.3.4. Real-Time PCR Reaction
2.4. Statistical Analysis
3. Results
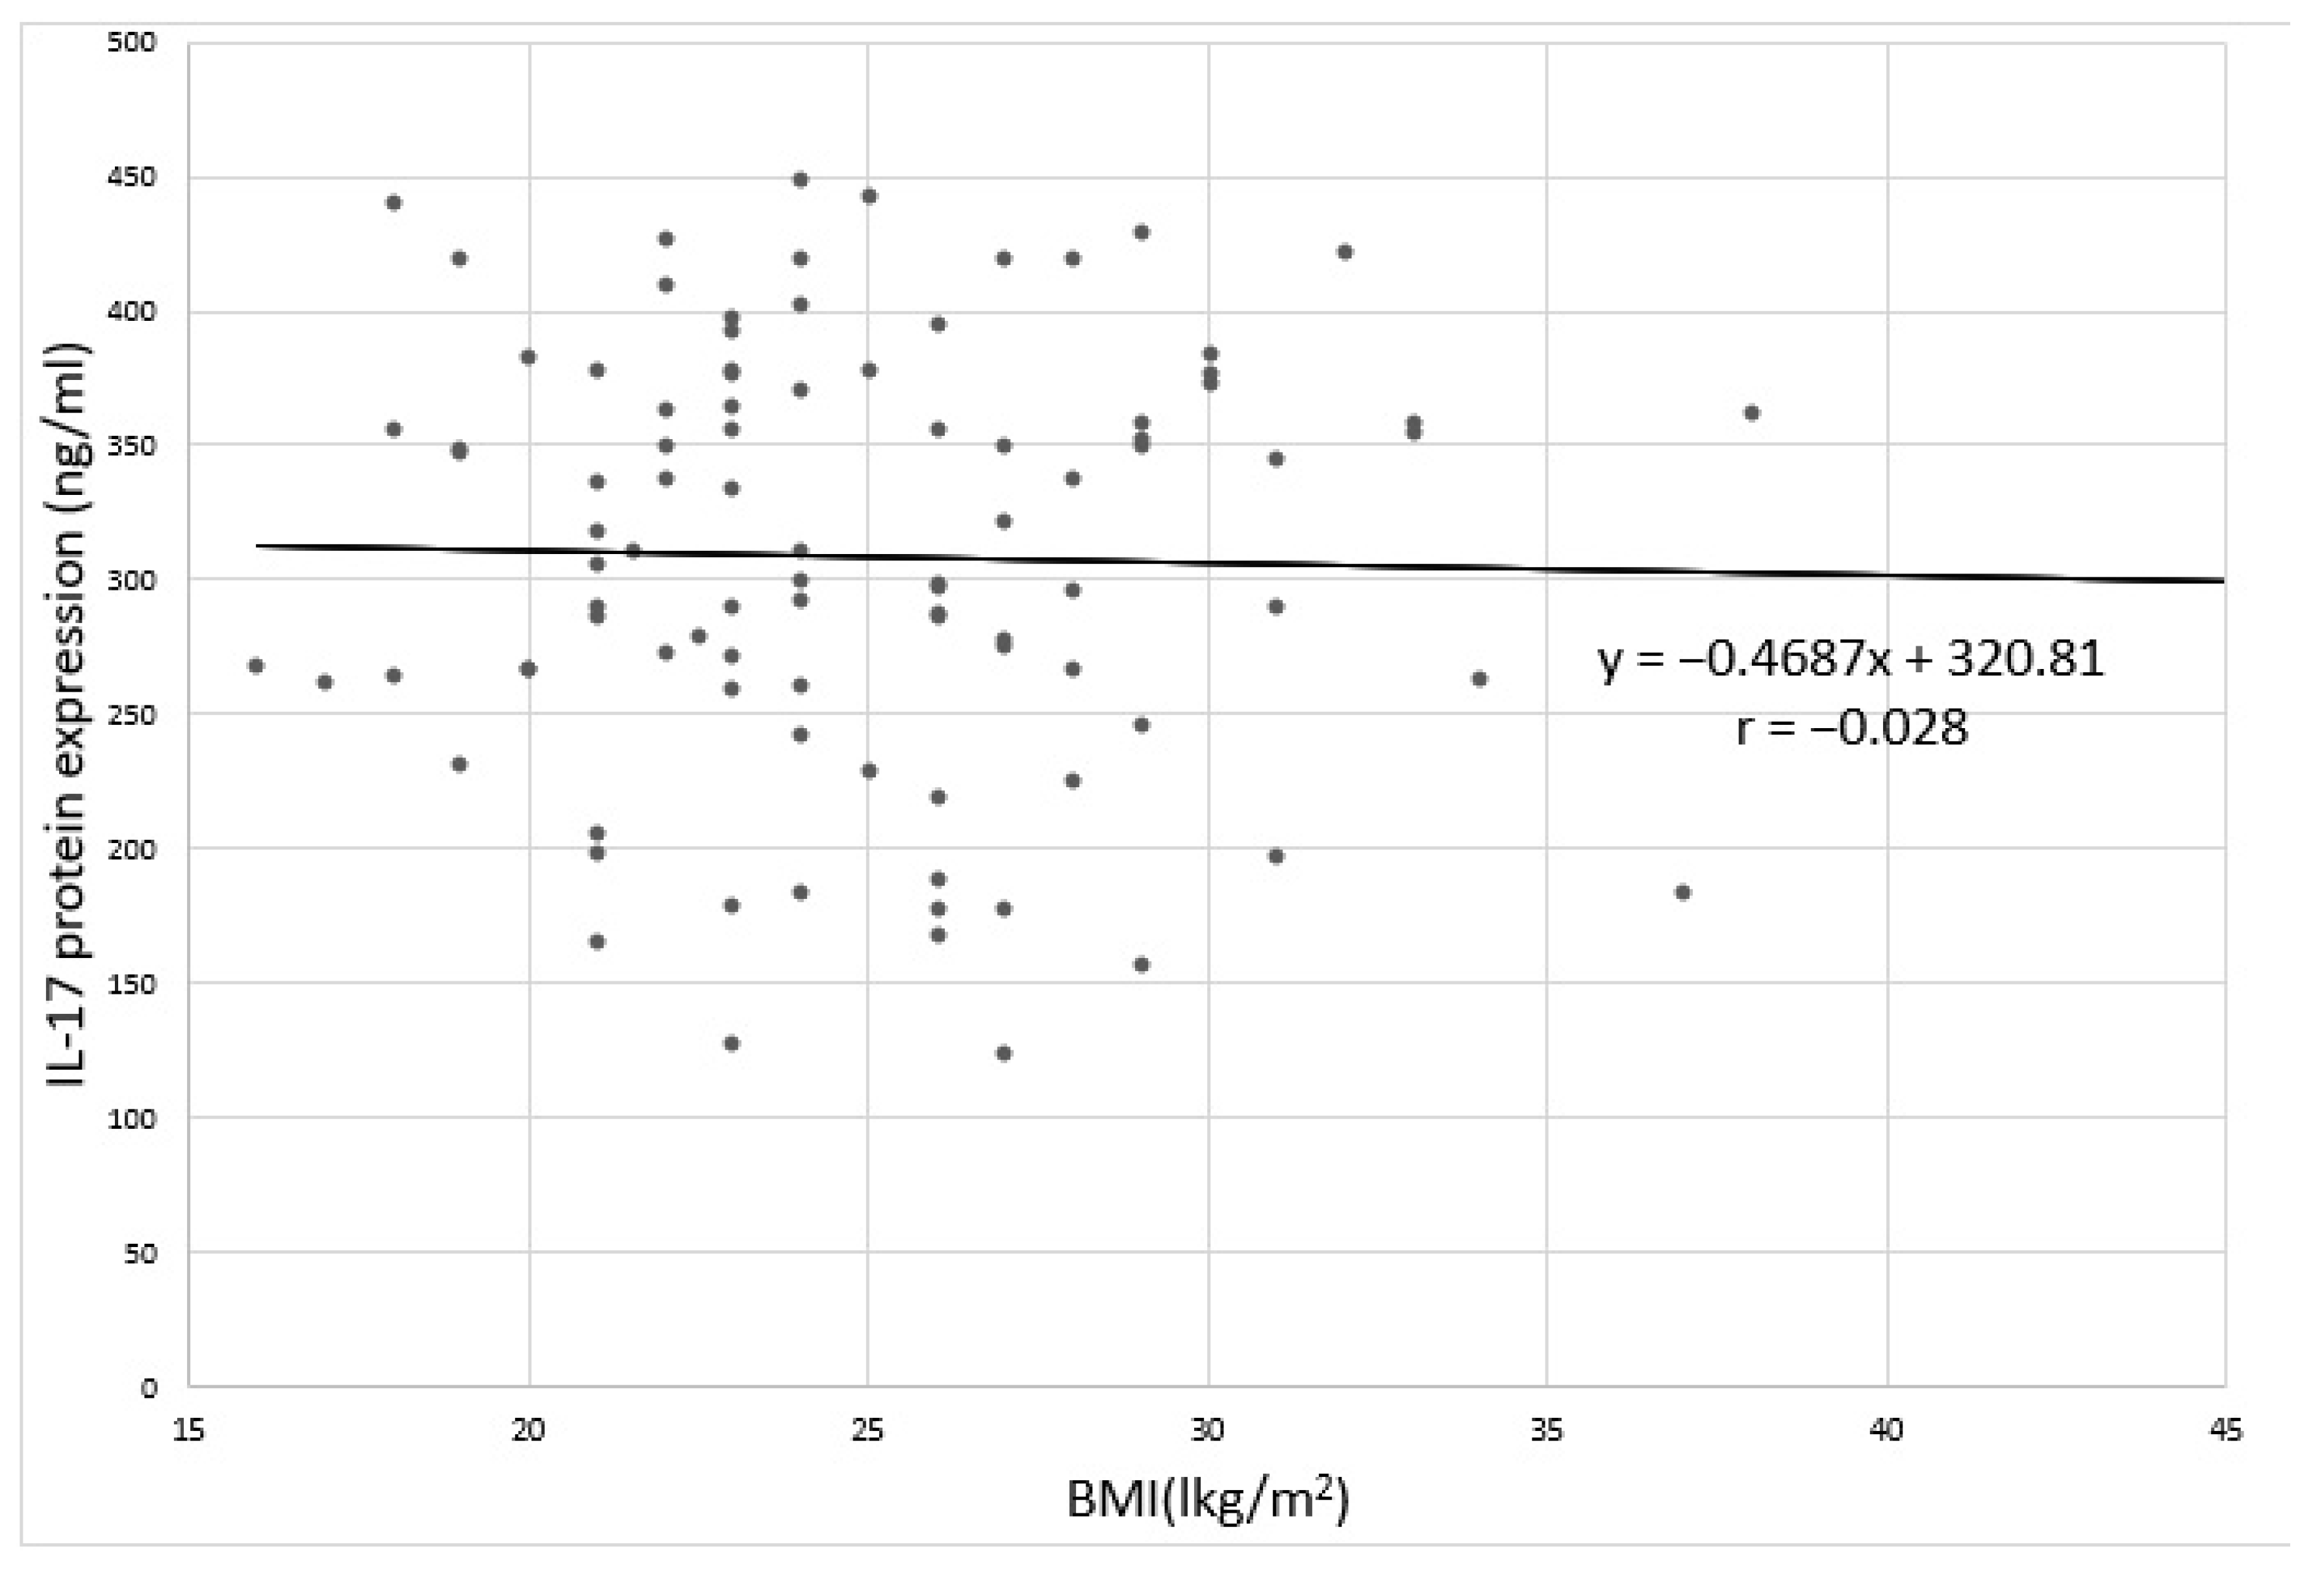
3.1. Body Mass Index (BMI)
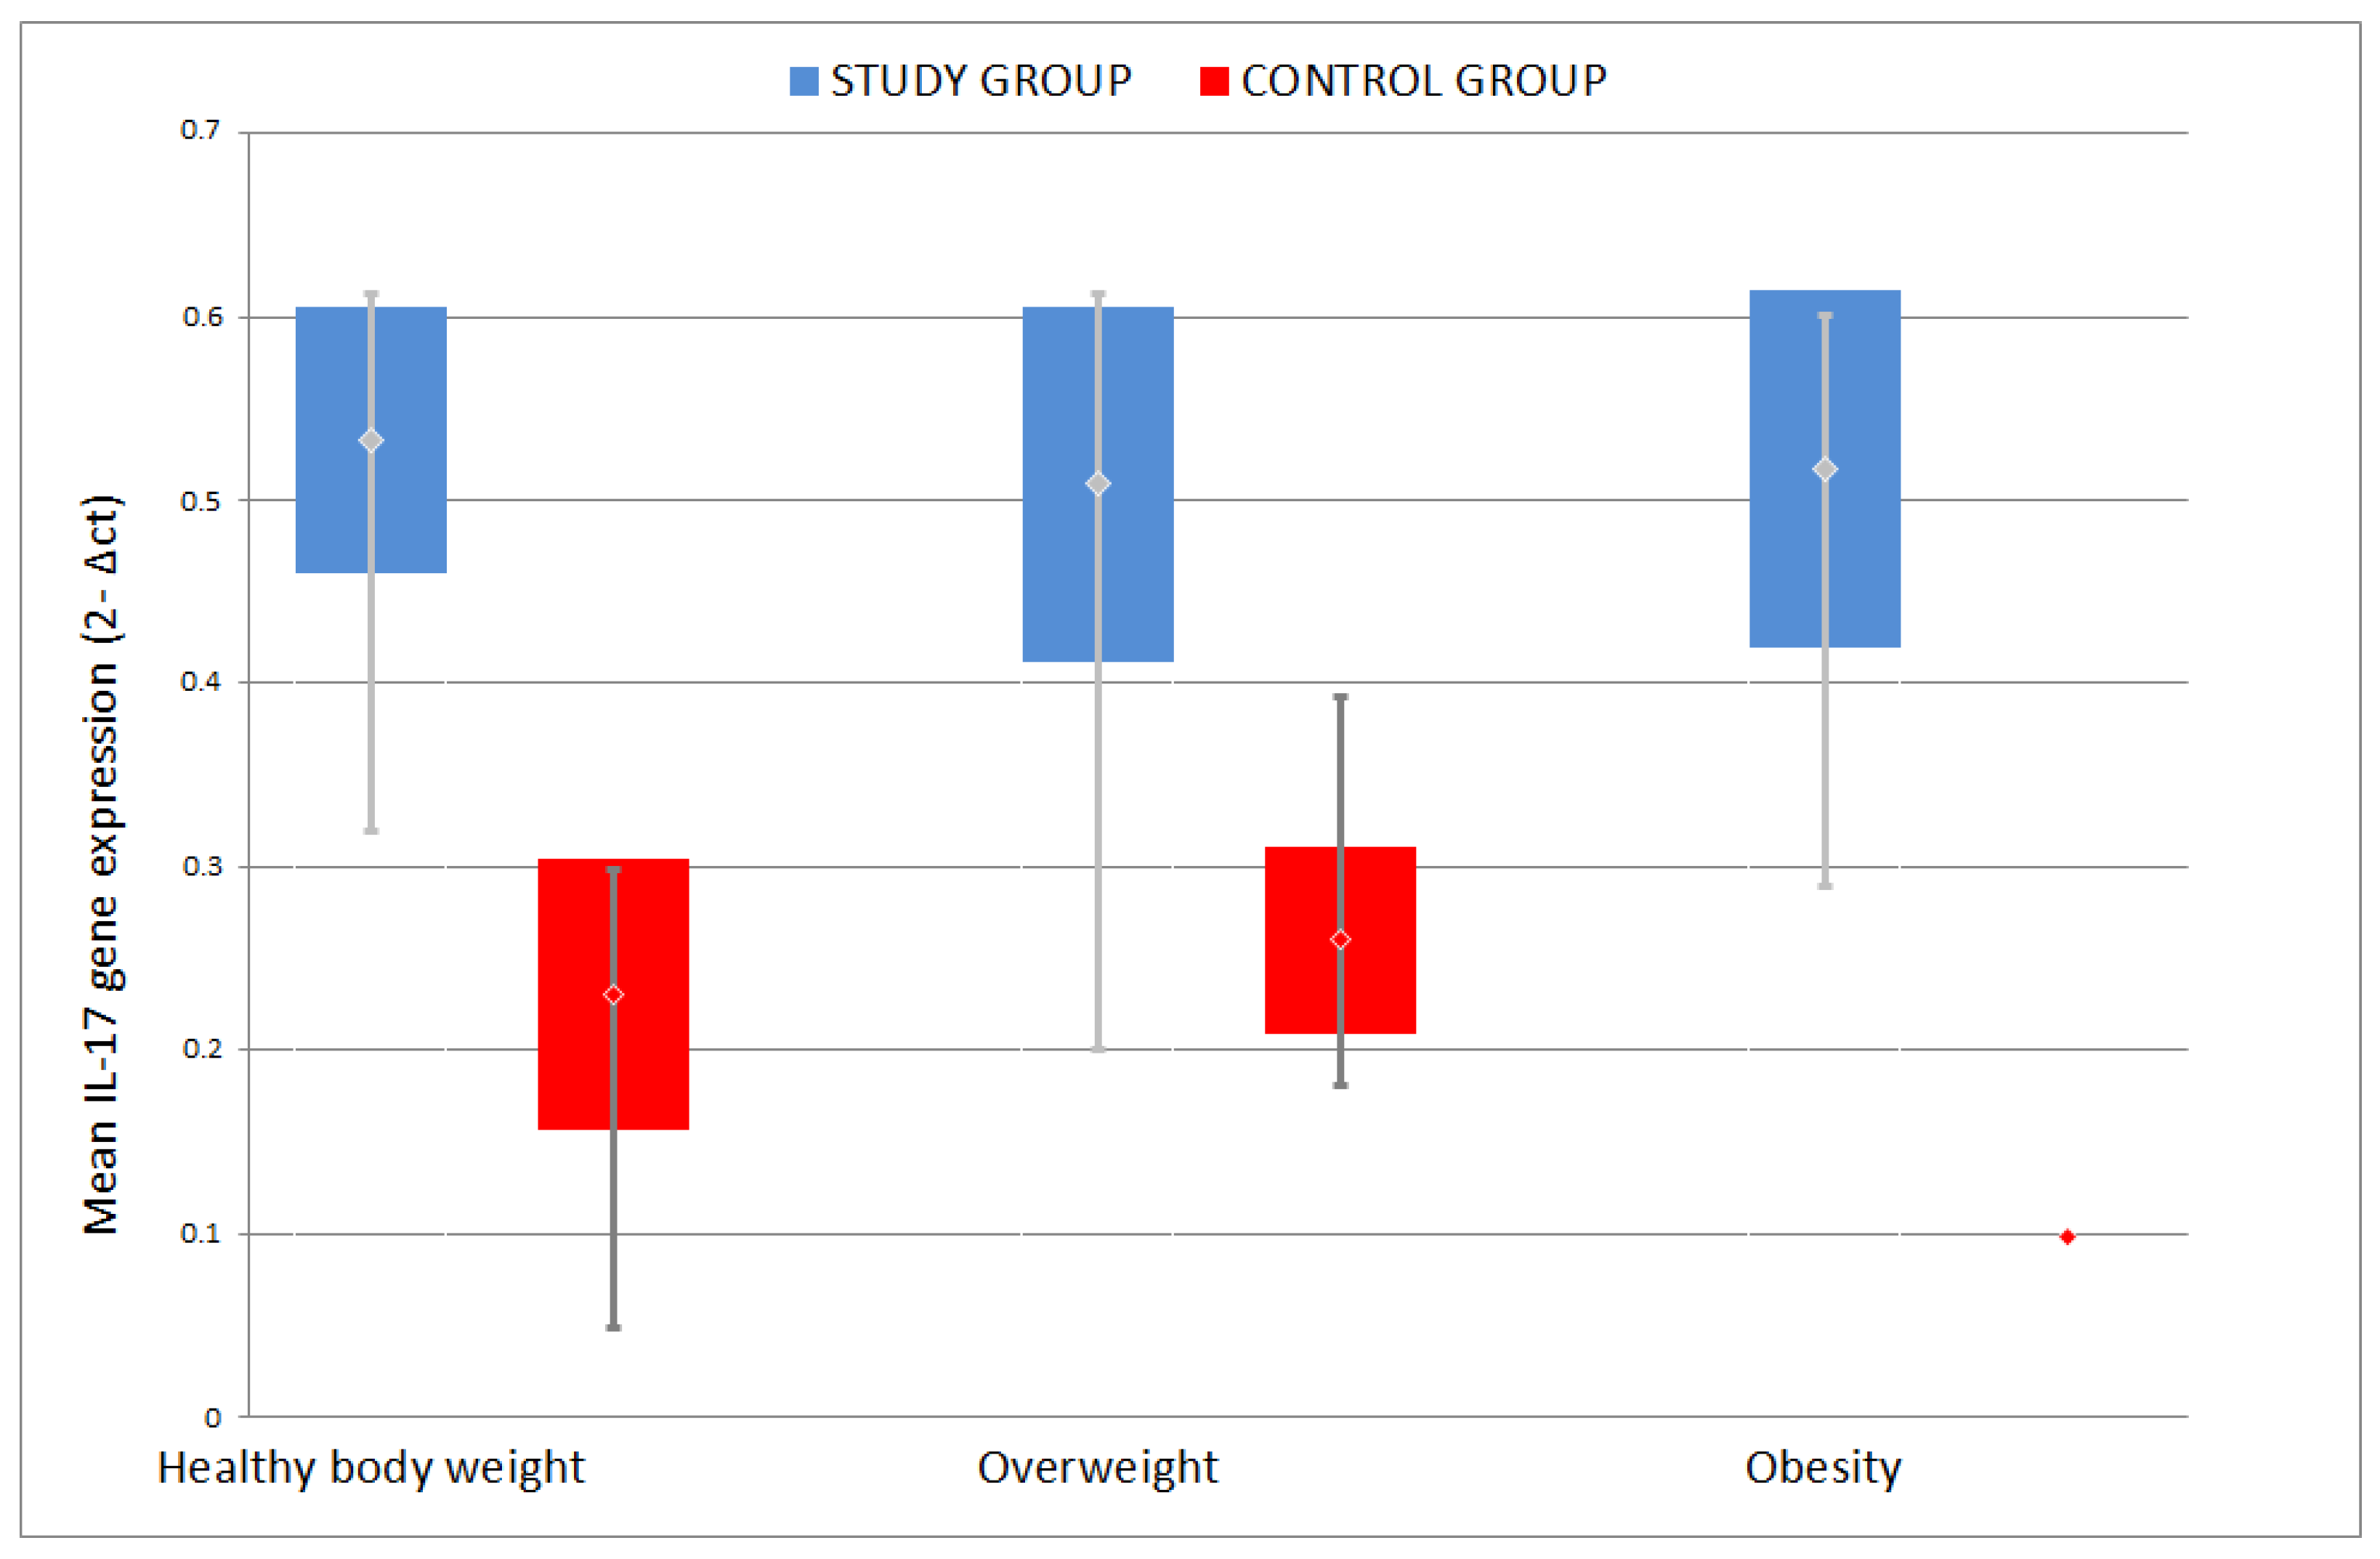
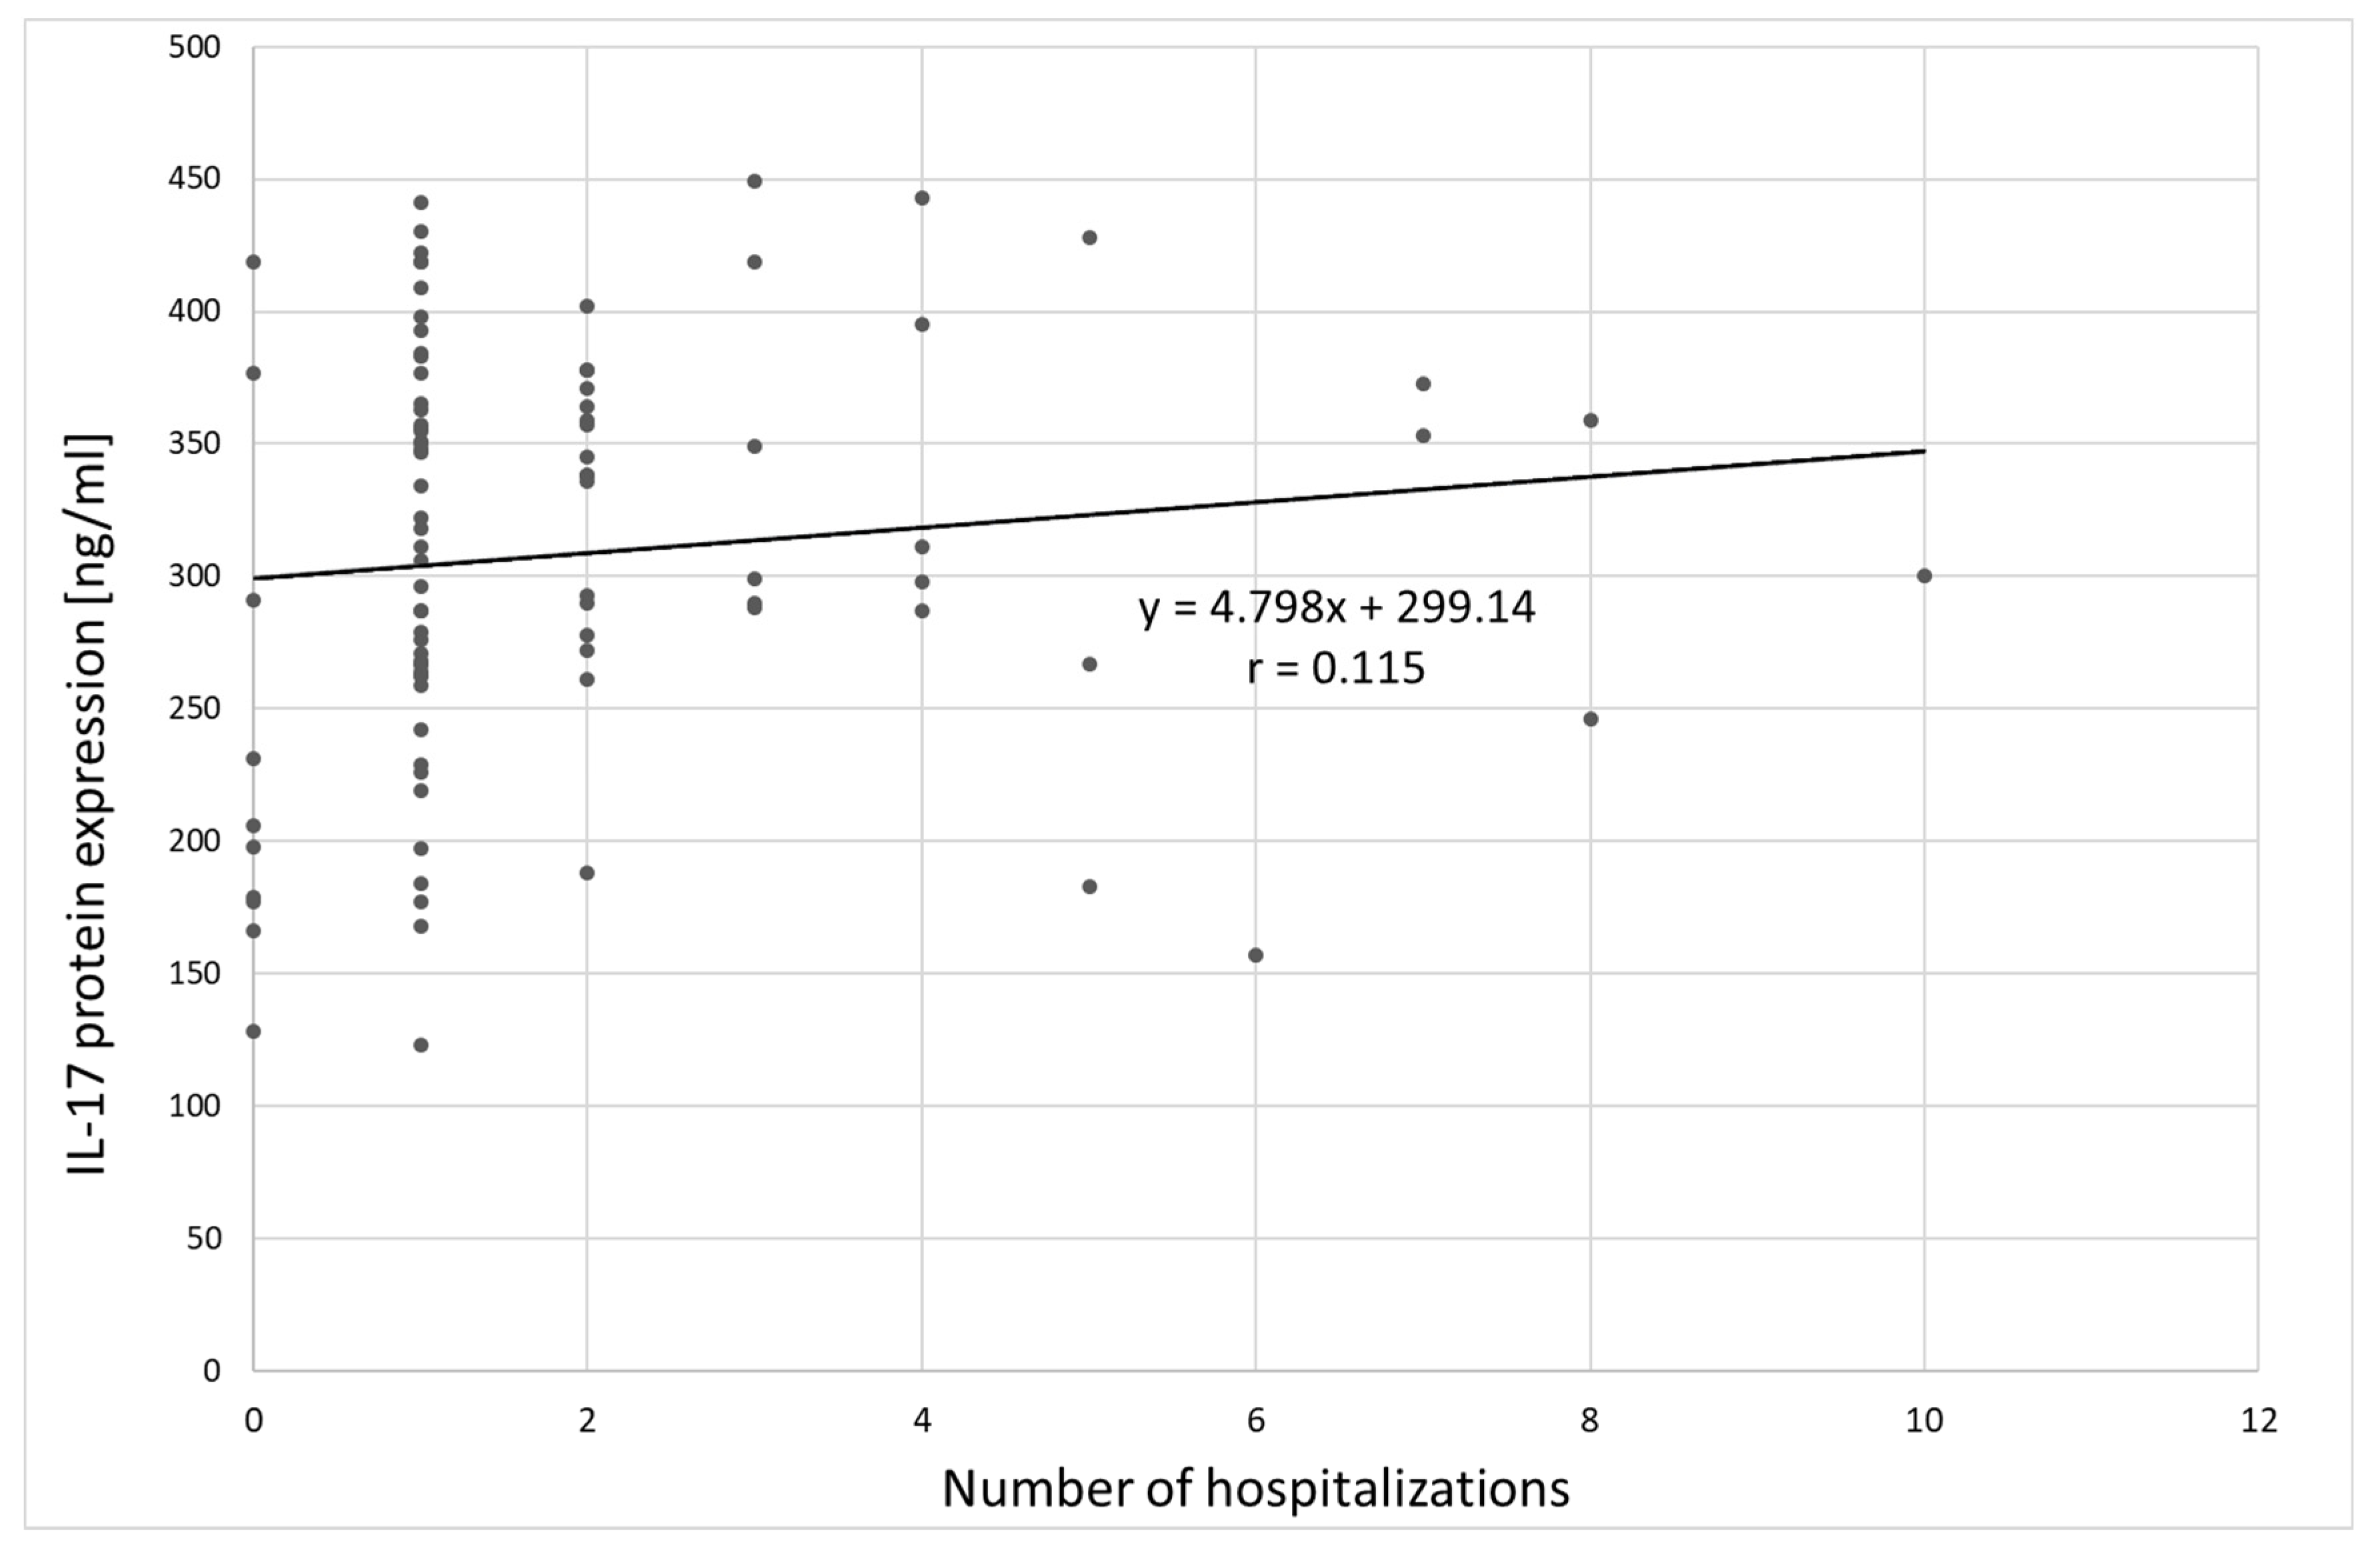
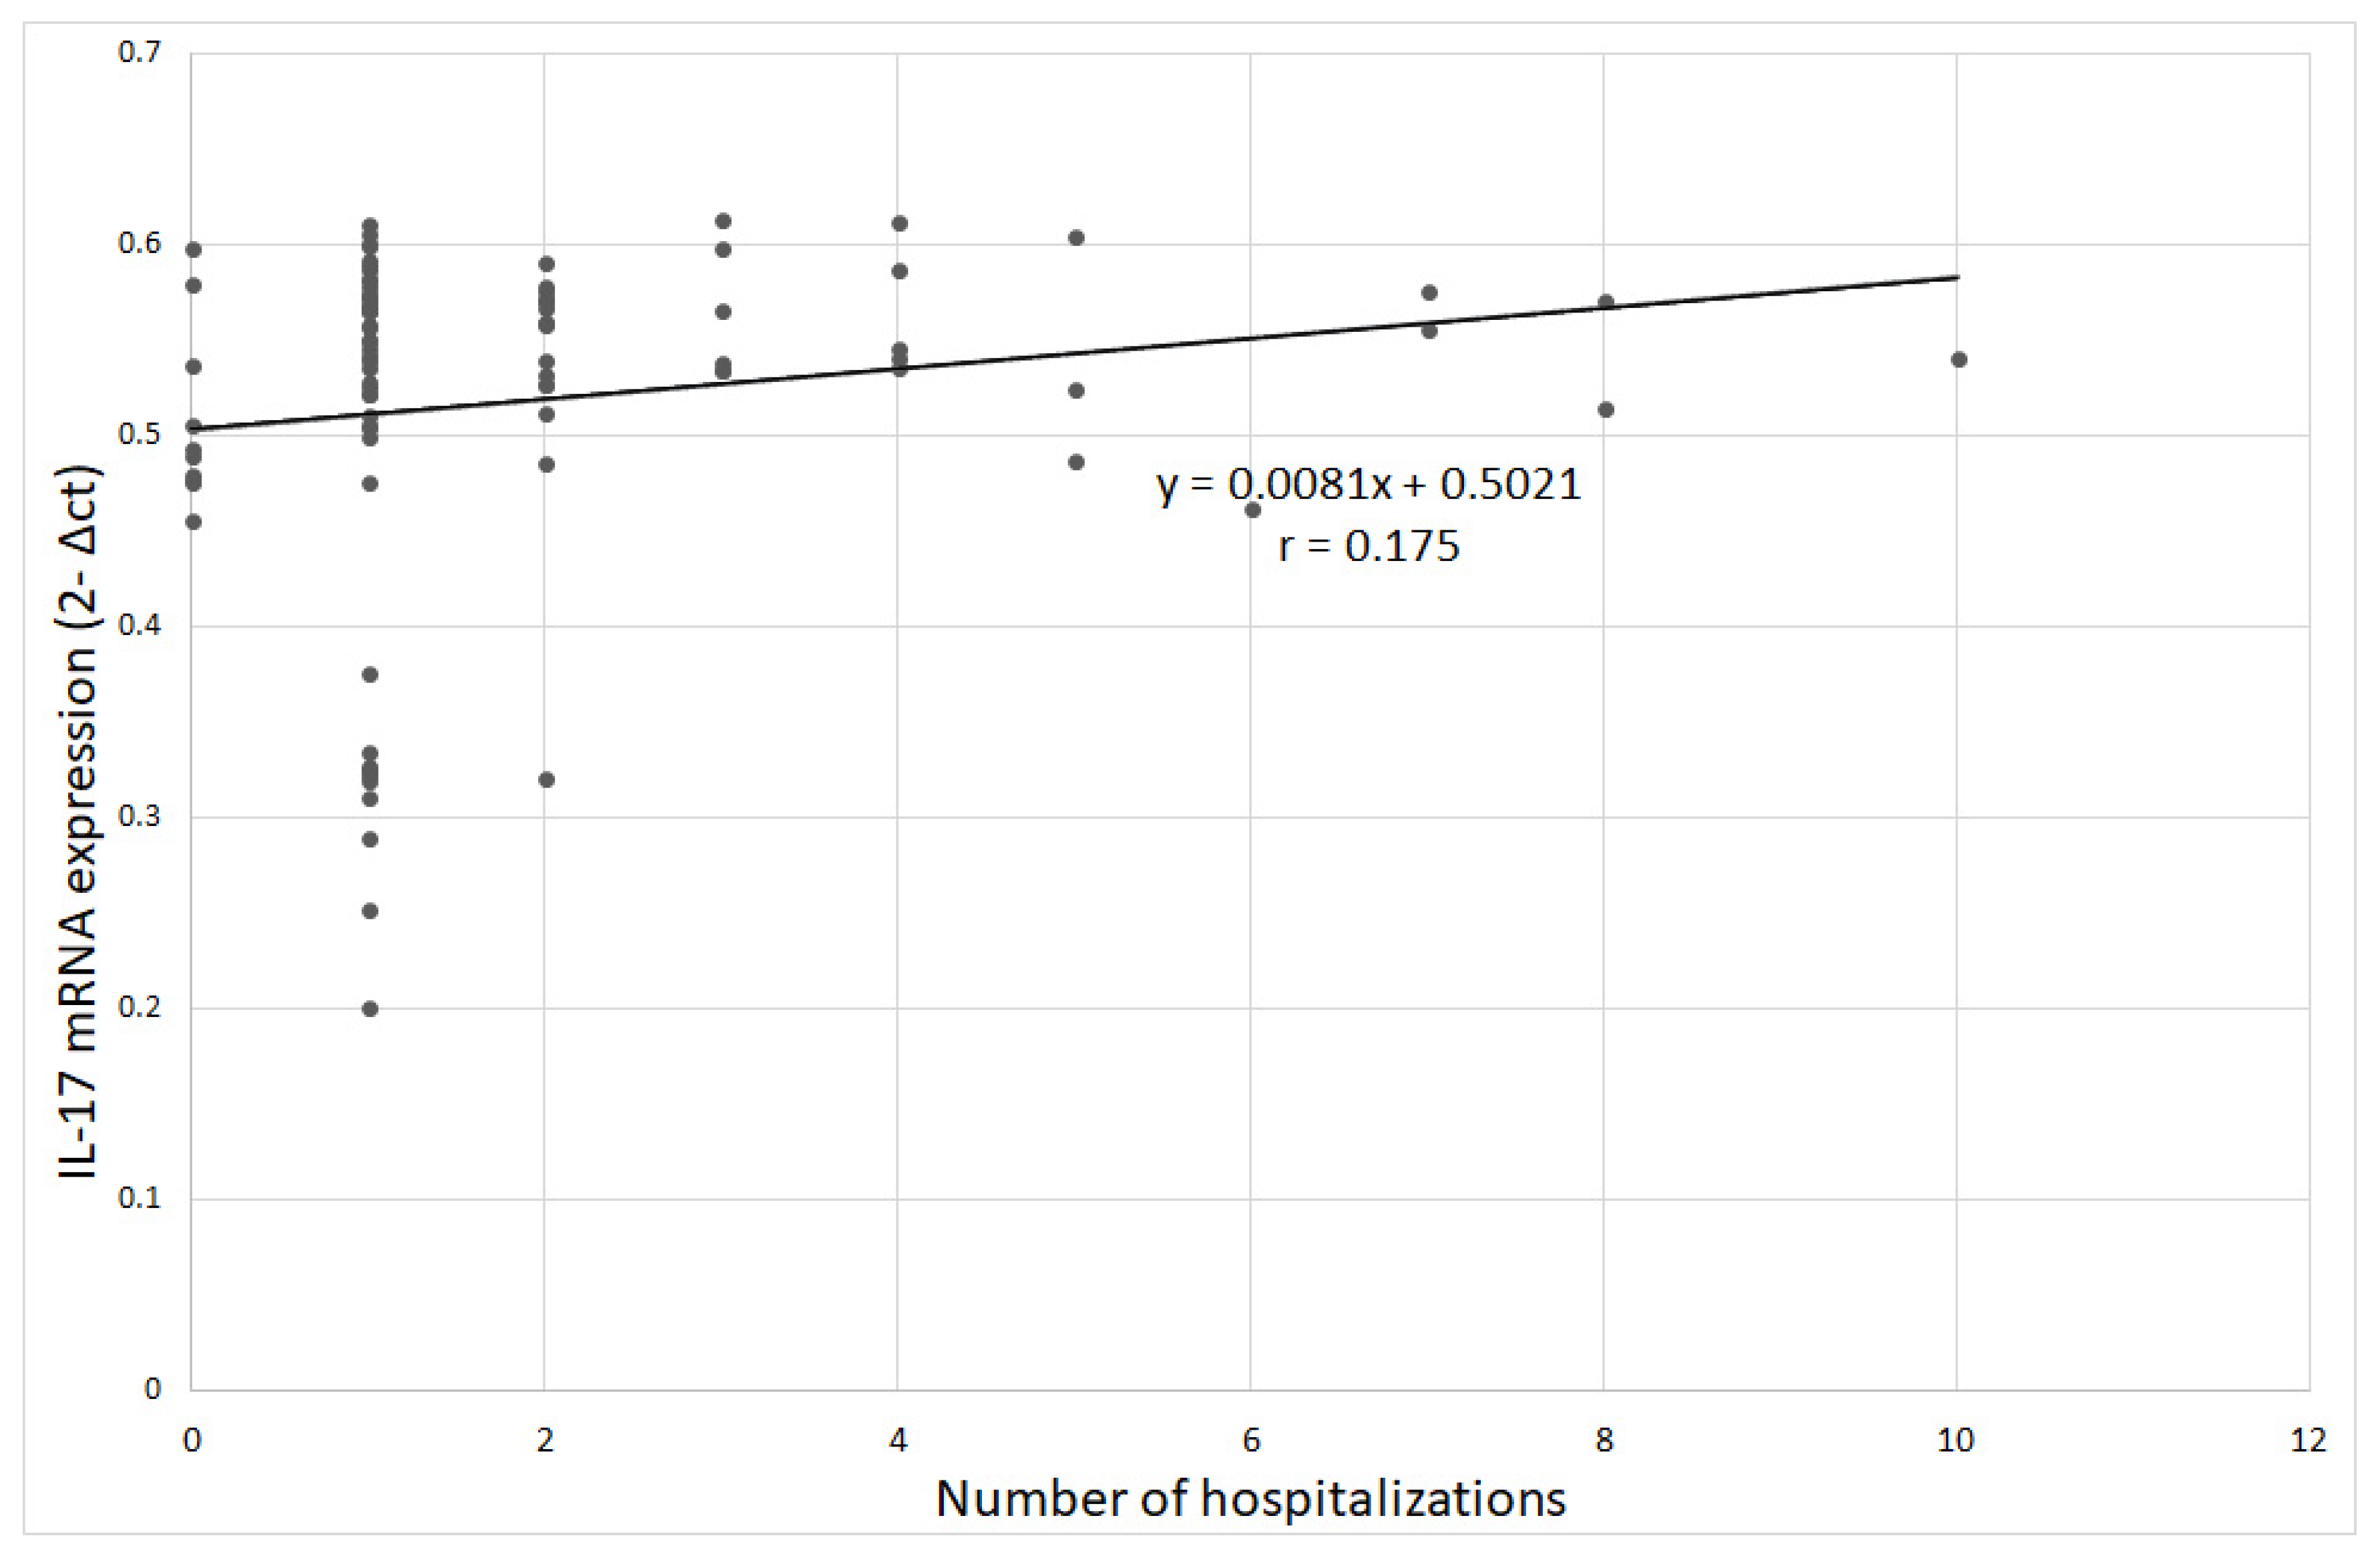
3.2. Interleukin 17 Expression
4. Discussion
5. Conclusions
Author Contributions
Funding
Conflicts of Interest
References
- Ufnal, M.; Wolynczyk-Gmaj, D. The brain and cytokines—The mutual origin of depression, obesity and cardiovascular diseases? Postępy Hig. Med. Dosw. 2011, 65, 228–235. [Google Scholar] [CrossRef] [PubMed]
- Nelson, J.C.; Pikalov, A.; Berman, R.M. Augmentation treatment in major depressive disorder: Focus on aripiprazole. Neuropsychiatr. Dis. Treat. 2008, 4, 937–948. [Google Scholar] [CrossRef] [PubMed][Green Version]
- Calamaro, C.J.; Waite, R. Depression and Obesity in Adolescents. J. Nurse Pract. 2009, 5, 255–261. [Google Scholar] [CrossRef]
- Angst, J.; Gamma, A.; Sellaro, R.; Zhang, H.; Merikangas, K. Toward validation of atypical depression in the community: Results of the Zurich cohort study. J. Affect. Disord. 2002, 72, 125–138. [Google Scholar] [CrossRef]
- Thase, M.E. Atypical depression: Useful concept, but it’s time to revise the DSM-IV criteria. Neuropsychophar Macol. 2009, 34, 2633–2641. [Google Scholar] [CrossRef] [PubMed]
- Güngör, B.B.; AKGÜL, A.I.; Taymur, I.; Demirci, H.; Inel, A. Evaluation of Eating Attitudes, Anger and Impulsivity in Atypical and Non-Atypical Depression and Assessment of Comorbidity of Binge Eating. Psychiatr. Danub. 2020, 32, 105–114. [Google Scholar] [CrossRef]
- World Health Organization. Depression; Fact Sheet No. 369; World Health Organization: Geneva, Switzerland, 2012; Available online: http://wwwwhoint/mediacentre/factsheets/fs369/en/indexhtml (accessed on 30 March 2018).
- World Health Organization. Obesity and Overweight; Fact Sheet No. 311; World Health Organization: Geneva, Switzerland, 2013; Available online: http://wwwwhoint/mediacentre/factsheets/fs311/en/ (accessed on 30 March 2018).
- Karakus, M.C.; Okunade, A.A. Obesity with Comorbid Depression and Early Retirement (June 2007). In Proceedings of the IHEA 2007 6th World Congress: Explorations in Health Economics, Copenhagen, Denmark, 8–11 July 2007; Available online: https://ssrn.com/abstract=992241 (accessed on 3 March 2018).
- Fostick, L.; Silberman, A.; Beckman, M.; Spivak, B.; Amital, D. The economic impact of depression: Resistance or severity? Eur. Neuropsychopharmacol. 2010, 20, 671–675. [Google Scholar] [CrossRef]
- Garg, R.; Saxena, S.K.; Bashi, S. Is obesity a risk to depression? A cross-sectional study. Ind. Psychiatry J. 2019, 28, 130–134. [Google Scholar]
- Hryhorczuk, C.; Sharma, S.; Fulton, S.E. Metabolic disturbances connecting obesity and depression. Front. Neurosci. 2013, 7, 177. [Google Scholar] [CrossRef]
- de Melo, L.G.P.; Nunes, S.O.V.; Anderson, G.; Vargas, H.O.; Barbosa, D.S.; Galecki, P.; Carvalho, A.F.; Maes, M. Shared metabolic and immune-inflammatory, oxidative and nitrosative stress pathways in the metabolic syndrome and mood disorders. Prog. Neuro-psychopharmacol. Biol. Psychiatry 2017, 78, 34–50. [Google Scholar] [CrossRef]
- Nieuwenhuizen, A.G.; Rutters, F. The hypothalamic-pituitary-adrenal axis in the regulation of energy balance. Physiol. Behav. 2008, 94, 169–177. [Google Scholar] [CrossRef] [PubMed]
- Kuo, L.E.; Kitlinska, J.B.; Tilan, J.U.; Li, L.; Baker, S.B.; Johnson, M.D.; Lee, E.W.; Burnett, M.S.; Fricke, S.T.; Kvetnansky, R.; et al. Neuropeptide Y acts directly in the periphery on fat tissue and mediates stress-induced obesity and metabolic syndrome. Nat. Med. 2007, 13, 803–811. [Google Scholar] [CrossRef] [PubMed]
- Abima, R.S. Adipose tissue as an endocrine organ. Obesity (Silver Spring) 2006, 14 (Suppl. 5), 242S–249S. [Google Scholar] [CrossRef]
- Shelton, R.C.; Miller, A.H. Inflammation in depression is adiposity a cause? Dialogues Clin. Neurosci. 2011, 13, 41–53. [Google Scholar]
- Aguilar-Valles, A.; Inoue, W.; Rummel, C.; Luheshi, G.N. Obesity, adipokines and neuroinflammation. Neuropharmacology 2015, 96, 124–134. [Google Scholar] [CrossRef]
- Odegaard, J.J.; Chawla, A. Pleotropic actions of insulin resistance and inflammation in metabolic homeostatis. Science 2013, 339, 172–177. [Google Scholar] [CrossRef]
- Chehim, M.; Vidal, H.; Elijaafari, A. Pathogenic Role of IL-17-Producing Immune Cells in Obesity, and Related Inflammatory. Dis. J. Clin. Med. 2017, 6, 68. [Google Scholar] [CrossRef]
- Winer, S.; Chan, Y.; Paltser, G.; Truong, D.; Tsui, H.; Bahrami, J.; Dorfman, R.; Wang, Y.; Zielenski, J.; Mastronardi, F.; et al. Normalization of obesity-associated insulin resitance though immunotherapy. Nat. Med. 2009, 15, 921–929. [Google Scholar] [CrossRef]
- Varricchi, G.; Granata, F.; Loffredo, S.; Genovese, A.; Marone, G. Angiogenesis and lymphangiogenesis in inflammatory skin disorders. J. Am. Acad. Dermatol. 2015, 73, 144–153. [Google Scholar] [CrossRef]
- Ryan, C.; Kirby, B. Psoriasis is a systemic disease with multiple cardiovascular and metabolic comorbidities. Dermatol. Clin. 2015, 33, 41–55. [Google Scholar] [CrossRef]
- Cao, Y. Angiogenesis modulates adipogenesis and obesity. J. Clin. Investig. 2007, 117, 2362–2368. [Google Scholar] [CrossRef] [PubMed]
- Voiculescu, V.M.; Lupu, M.; Papagheorghe, L.; Giurcaneanu, C.; Micu, E. Psoriasis and Metabolic Syndrome—Scientific evidence and therapeutic implications. J. Med. Life 2014, 7, 468–471. [Google Scholar] [PubMed]
- Guillemot-Legris, O.; Muccioli, G.G. Obesity-induced neuroinflammation: Beyond the hypothalamus. Trends Neurosci. 2017, 40, 237–253. [Google Scholar] [CrossRef] [PubMed]
- Sforzini, L.; Nettis, M.A.; Mondelli, V.; Pariante, C.M. Inflammation in cancer and depression: A starring role for the kynurenine pathway. Psychopharmacology 2019, 236, 2997–3011. [Google Scholar] [CrossRef] [PubMed]
- Ogyu, K.; Kubo, K.; Noda, Y.; Iwata, Y.; Tsugawa, S.; Omura, Y.; Wada, M.; Tarumi, R.; Plitman, E.; Moriguchi, S.; et al. Kynurenine pathway in depression: A systematic review and meta-analysis. Neurosci. Biobehav. Rev. 2018, 6, 16–25. [Google Scholar] [CrossRef] [PubMed]
- Kowalczyk, M.; Szemraj, J.; Bliźniewska, K.; Maes, M.; Berk, M.; Su, K.P.; Gałecki, P. An immune gate of depression—Early neuroimmune development in the formation of the underlying depressive disorder. Pharmacol. Rep. 2019, 71, 1299–1307. [Google Scholar] [CrossRef] [PubMed]
- World Health Organization. International Statistical Classification of Diseases and Related Health Problems; 10th Revision; World Health Organization: Geneva, Switzerland, 2015. [Google Scholar]
- Lim, J.U.; Lee, J.H.; Kim, J.S.; Hwang, Y.I.; Kim, T.-H.; Lim, S.Y.; Yoo, K.H.; Jung, K.-S.; Kim, Y.K.; Rhee, C.K. Comparison of World Health Organization and Asia-Pacific body mass index classifications in COPD patients. Int. J. Chronic Obs. Pulm. Dis. 2017, 12, 2465–2475. [Google Scholar] [CrossRef]
- Patten, S. Performance of the Composite International Diagnostic Interview Short Form for major depression in community and clinical samples. Chronic Dis. Can. 1997, 3, 18–24. [Google Scholar]
- Hamilton, M. A rating scale for depression. J. Neurol. Neurosurg. Psychiatry 1960, 23, 56–62. [Google Scholar] [CrossRef]
- Demyttenaere, K.; De Fruyt, J. Getting what you ask for: On the selectivity of depression rating scales. Psychother. Psychosom. 2003, 72, 61–70. [Google Scholar] [CrossRef]
- Schmittgen, T.D.; Livak, K.J. Analyzing real-time PCR data by the comparative CT method. Nat. Protoc. 2008, 3, 1101–1108. [Google Scholar] [CrossRef] [PubMed]
- Livak, K.J.; Schmittgen, T.D. Analysis of relative gene expression data using real-time quantitative PCR and the 2−ΔΔCT method. Methods 2001, 25, 402–408. [Google Scholar] [CrossRef] [PubMed]
- Maes, M.; Carvalho, A.F. The Compensatory Immune-Regulatory Reflex System (CIRS) in Depression and Bipolar Disorder. Mol. Neurobiol. 2018, 55, 8885–8903. [Google Scholar] [CrossRef] [PubMed]
- Ouakinin, S.R.; Barreira, D.P.; Gois, C.J. Depression and obesity: Integrating the role of stres, neuroendorine dysfunction and inflammatory pathways. Front. Endocrinol. 2018, 9, 431. [Google Scholar] [CrossRef] [PubMed]
- Li, Y.C.; Chou, Y.C.; Chen, H.C.; Lu, C.C.; Chang, D.M. Interleukin-6 and interleukin-17 are related to depression in patients with rheumatoid arthritis. Int. J. Rheum. Dis. 2019, 22, 980–985. [Google Scholar] [CrossRef] [PubMed]
- Tsuboi, H.; Sakakibara, H.; Minamida, Y.; Tsujiguchi, H.; Matsunaga, M.; Hara, A.; Nakamura, H. Elevated Levels of Serum IL-17A in Community-Dwelling Women with Higher Depressive Symptoms. Behav. Sci. 2018, 8, 102. [Google Scholar] [CrossRef]
- Chen, Y.; Jiang, T.; Chen, P.; Ouyang, J.; Xu, G.; Zeng, Z.; Sun, Y. Emerging tendency towards autoimmune process in major depressive patients: A novel insight from Th17 cells. Psychiatry Res. 2011, 188, 224–230. [Google Scholar] [CrossRef]
- Davami, M.H.; Baharlou, R.; Ahmadi Vasmehjani, A.; Ghanizadeh, A.; Keshtkar, M.; Dezhkam, I.; Atashzar, M.R. Elevated IL-17 and TGF-beta Serum Levels: A Positive Correlation between T-helper 17 Cell-Related Pro-Inflammatory Responses with Major Depressive Disorder. Basic Clin. Neurosci. 2016, 7, 137–142. [Google Scholar]
- Luppino, F.S.; de Wit, L.M.; Bouvy, P.F.; Stijnen, T.; Cuijpers, P.; Penninx, B.W.; Zitman, F.G. Overweight, obesity, and depression: A systematic review and meta-analysis of longitudinal studies. Arch. Gen. Psychiatry 2010, 67, 220–229. [Google Scholar] [CrossRef]
- Markowitz, S.; Friedman, M.A.; Arent, S.M. Understanding the relation between obesity and depression: Causal mechanisms and implications for treatment. Clin. Psychol. Sci. Pract. 2008, 15, 1–20. [Google Scholar] [CrossRef]
- Simon, G.E.; Ludman, E.J.; Linde, J.A.; Operskalski, B.H.; Ichikawa, L.; Rohde, P.; Finch, E.A.; Jeffery, R.W. Association between obesity and depression in middle-aged women. Gen. Hosp. Psychiatry 2008, 30, 32–39. [Google Scholar] [CrossRef] [PubMed]
- Ahmed, M.; Gaffen, S.L. IL-17 in obesity and adipogenesis. Cytokine Growth Factor Rev. 2010, 21, 449–453. [Google Scholar] [CrossRef] [PubMed]
- Sumarac-Dumanovic, M.; Stevanovic, D.; Ljubic, A.; Jorga, J.; Simic, M.; Stamenkovic-Pejkovic, D.; Starcevic, V.; Trajkovic, V.; Micic, D. Increased activity of interleukin-23/interleukin-17 proinflammatory axis in obese women. Int. J. Obes. 2009, 33, 151–156. [Google Scholar] [CrossRef] [PubMed]
- Bugge, E.; Wynn, R.; Mollnes, T.E.; Reitan, S.K.; Gronli, O.K. Cytokine profiles and diagnoses in elderly, hospitalized psychiatric patients. BMC Psychiatry 2018, 18, 315. [Google Scholar] [CrossRef] [PubMed]
- Benros, M.E.; Waltoft, B.L.; Nordentoft, M.; Ostergaard, S.D.; Eaton, W.W.; Krogh, J.; Mortensen, P.B. Autoimmune diseases and severe infections as risk factors for mood disorders: A nationwide study. JAMA Psychiatry 2013, 70, 812–820. [Google Scholar] [CrossRef]
- Loft, N.D.; Halling, A.-S.; Egeberg, A.; Skov, L. Efficacy of a second IL-17 inhibitor in patients with psoriasis: A systematic review and meta-analysis. J. Am. Acad. Dermatol. 2020. [Google Scholar] [CrossRef]
- Deodhar, A.; Mease, P.; McInnes, I.B.; Baraliakos, X.; Reich, K.; Blauvelt, A.; Leonardi, C.; Porter, B.; Das Gupta, A.; Widmer, A.; et al. Long-term safety of secukinumab inpatients with moderate-to-severe plaque psoriasis, psoriatic arthritis, and ankylosing spondylitis: Integrated pooled clinical trial and post-marketing surveillance data. Arthritis Res. Ther. 2019, 21, 111. [Google Scholar] [CrossRef]
- Nothdurfter, C.; Milenkovic, V.M.; Sarubin, N.; Hilbert, S.; Manook, A.; Weigl, J.; Almeqbaali, K.; Wetzel, C.H.; Rupprecht, R.; Baghai, T.C. The cytokine IL-17A as a marker of treatment resistance in major depressive disorder? Eur. J. Neurosci. 2019. [Google Scholar] [CrossRef]
- Esposito, M.; Giunta, A.; Del Duca, E.; Manfreda, V.; Troisi, A.; Bianchi, L.; Fargnoli, M.C. Long-term safety and efficacy of secukinumab in patients with psoriasis and major psychiatric disorders: A case series. Postgrad. Med. 2020, 132, 172–175. [Google Scholar] [CrossRef]
- Albeltagy, E.S.; Elaziz, S.Y.A.; Abozaid, S.Y.; El Zomor, H.M.; Elhamed, S.S.A. Interleukin 6, interleukin 17, disease-related and contextual factor association with depression, and its severity in patients with rheumatoid arthritis. Clin. Rheumatol. 2020, 13. [Google Scholar] [CrossRef]
- Krueger, J.G.; Brunner, P.M. Interleukin-17 alters the biology of many cell types involved in the genesis of psoriasis, systemic inflammation and associated comorbidities. Exp. Dermatol. 2018, 27, 115–123. [Google Scholar] [CrossRef] [PubMed]


| Variable | Group | Means Comparison | ||||||||||
|---|---|---|---|---|---|---|---|---|---|---|---|---|
| Study | Control | |||||||||||
| Gender | n | % | n | % | χ2 = 0.298; p = 0.585 | |||||||
| M | 27 | 28.4 | 7 | 23.3 | ||||||||
| F | 68 | 71.6 | 23 | 76.7 | ||||||||
| min | max | SD | V(%) | min | max | SD | V(%) | Z = 4.208;p= 0.000 * | ||||
| AGE [yrs] | 18 | 63 | 47.2 | 10.5 | 22.3 | 23 | 53 | 37.7 | 10.5 | 27.7 | ||
| BMI [kg/m2] | 16 | 48 | 25.1 | 4.9 | 19.5 | 19.3 | 33.9 | 24.5 | 3.9 | 15.9 | Z = 0.402; p = 0.688 | |
| Duration of depression [yrs] | 1 | 30 | 5.5 | 5.8 | 105.8 | |||||||
| No. Depressive episodes | 1 | 20 | 4.2 | 4.4 | 105.6 | |||||||
| No. hospitalizations | 0 | 10 | 1.9 | 1.9 | 100.1 | |||||||
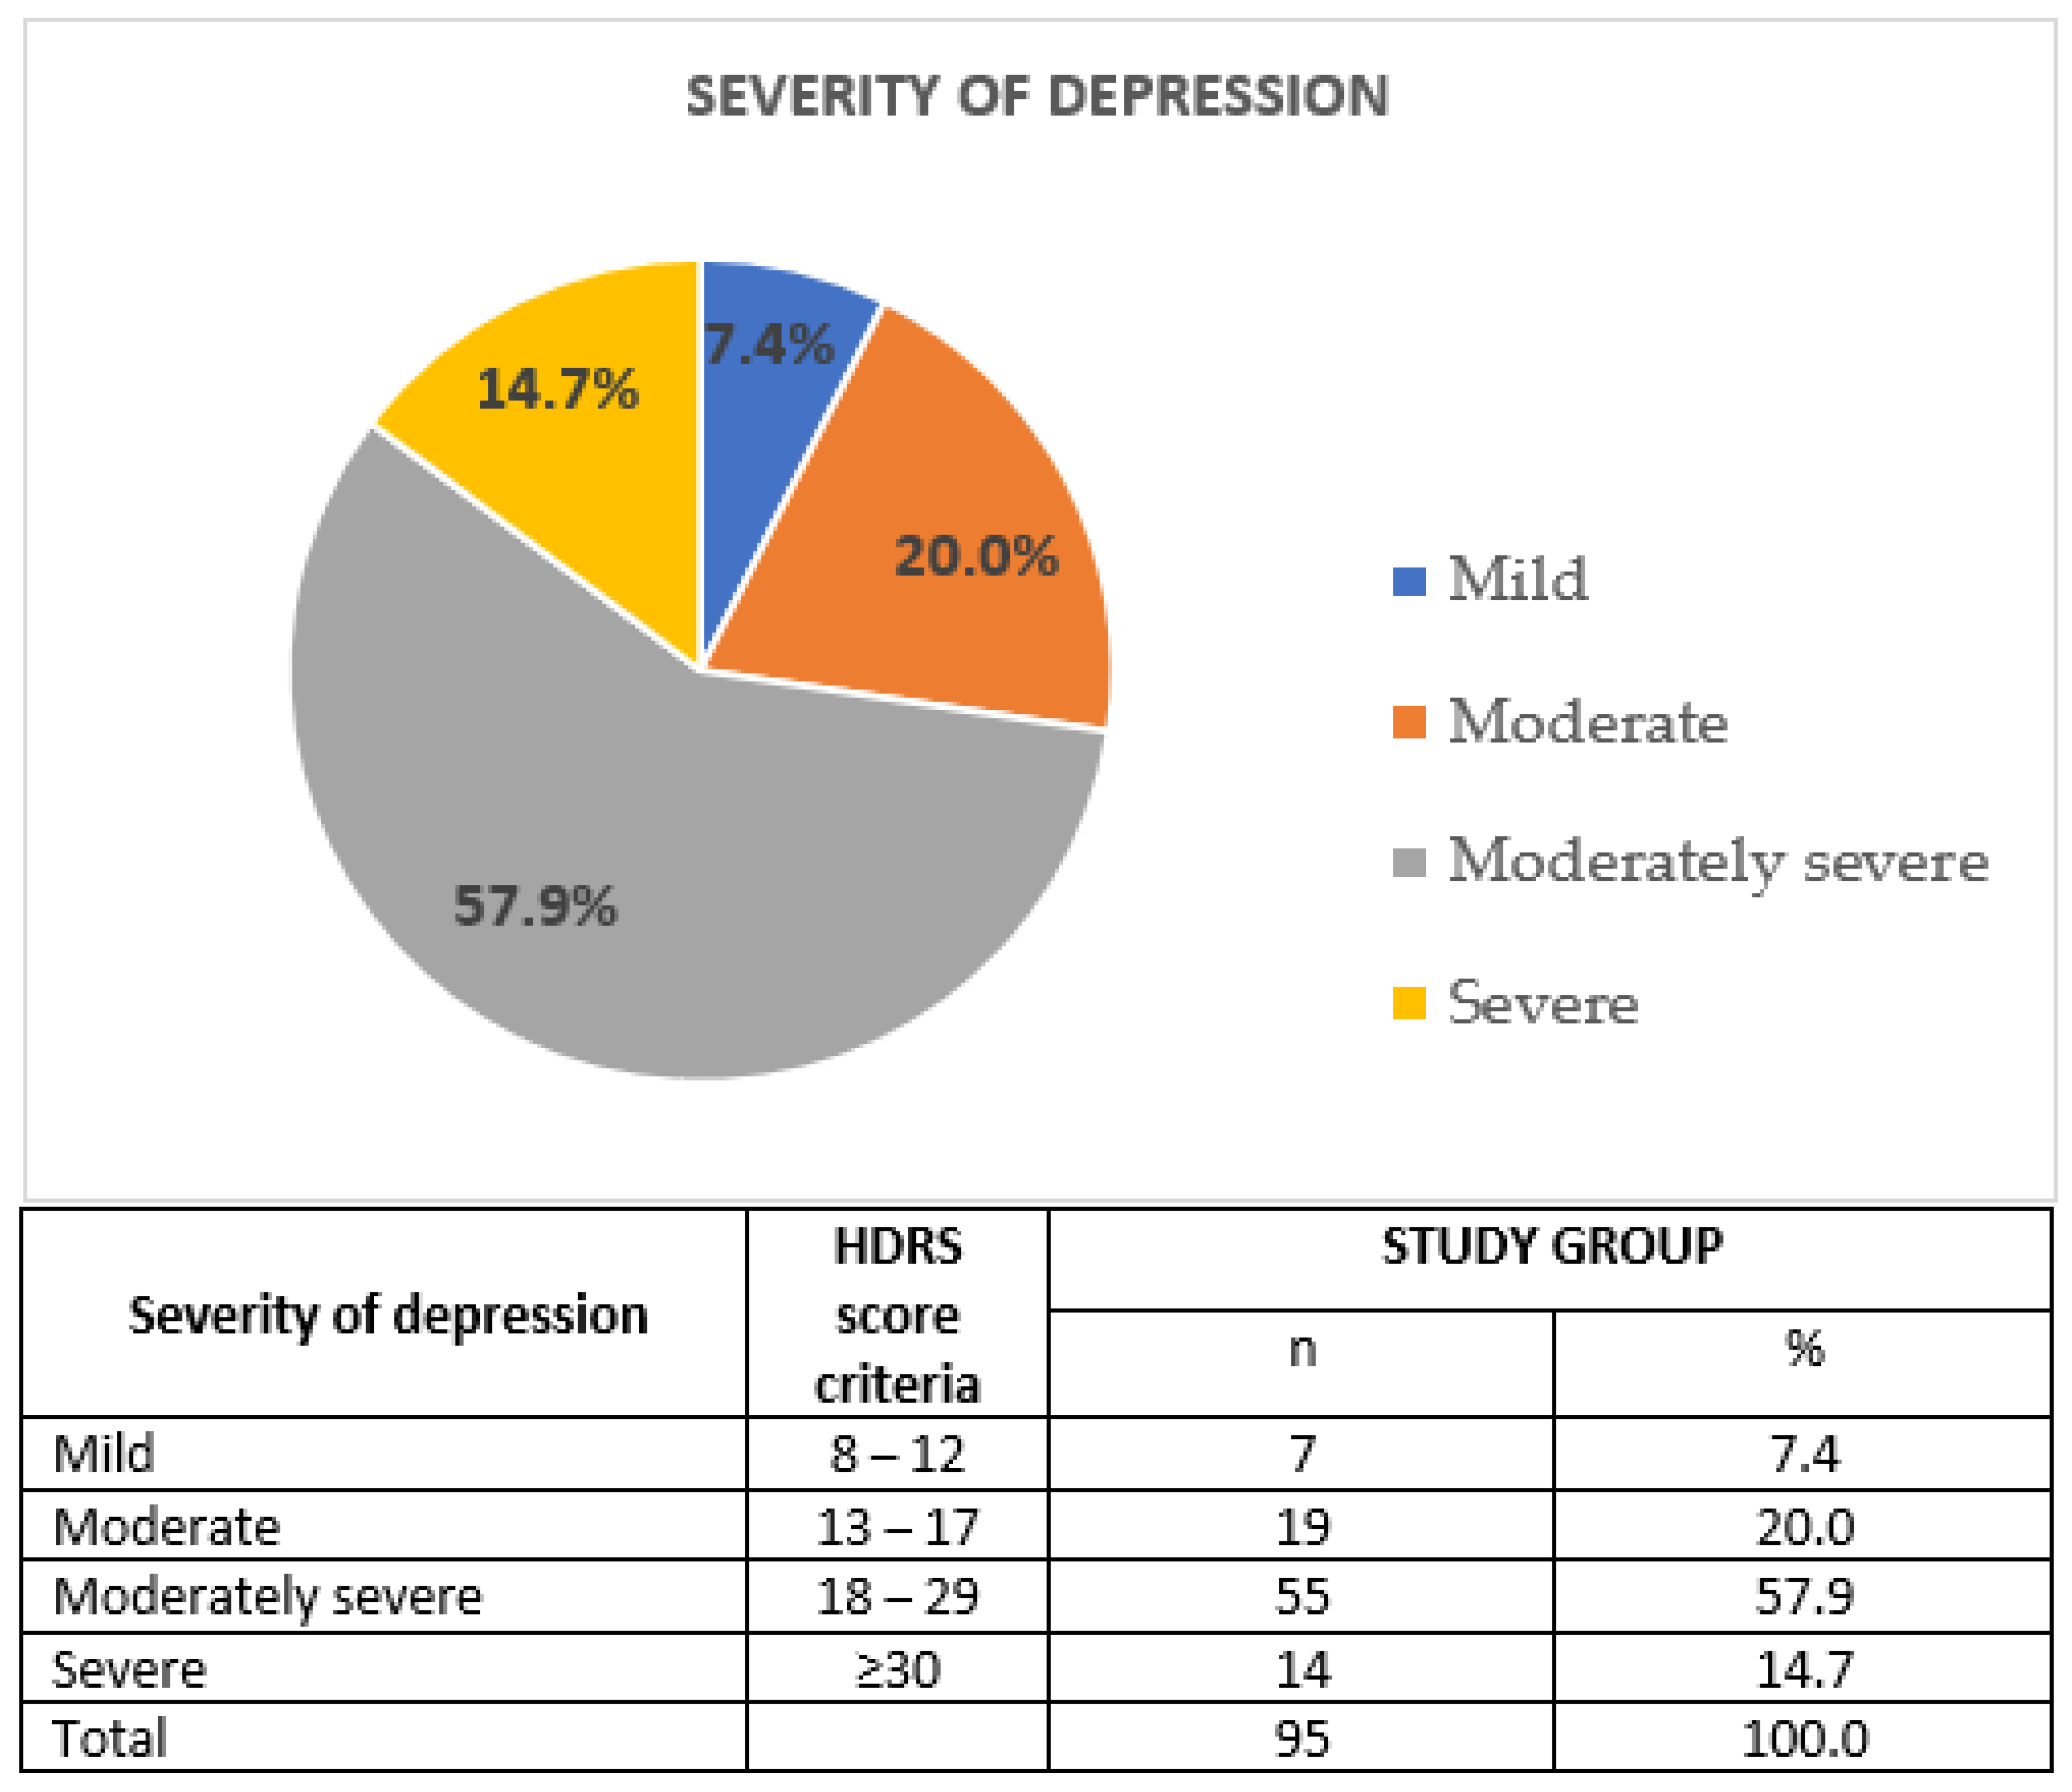
| HDRS | 7 | 37 | 21.9 | 6.8 | 30.8 | |||||||
| Variable | Group | Means Comparison | |||||||||
|---|---|---|---|---|---|---|---|---|---|---|---|
| STUDY | CONTROL | ||||||||||
| min | max | SD | V(%) | min | max | SD | V(%) | ||||
| IL-17 mRNA (2-Δct) | 0.201 | 0.613 | 0.518 | 0.089 | 17.2 | 0.048 | 0.393 | 0.238 | 0.070 | 29.5 | Z = 7.934; p = 0.000 * |
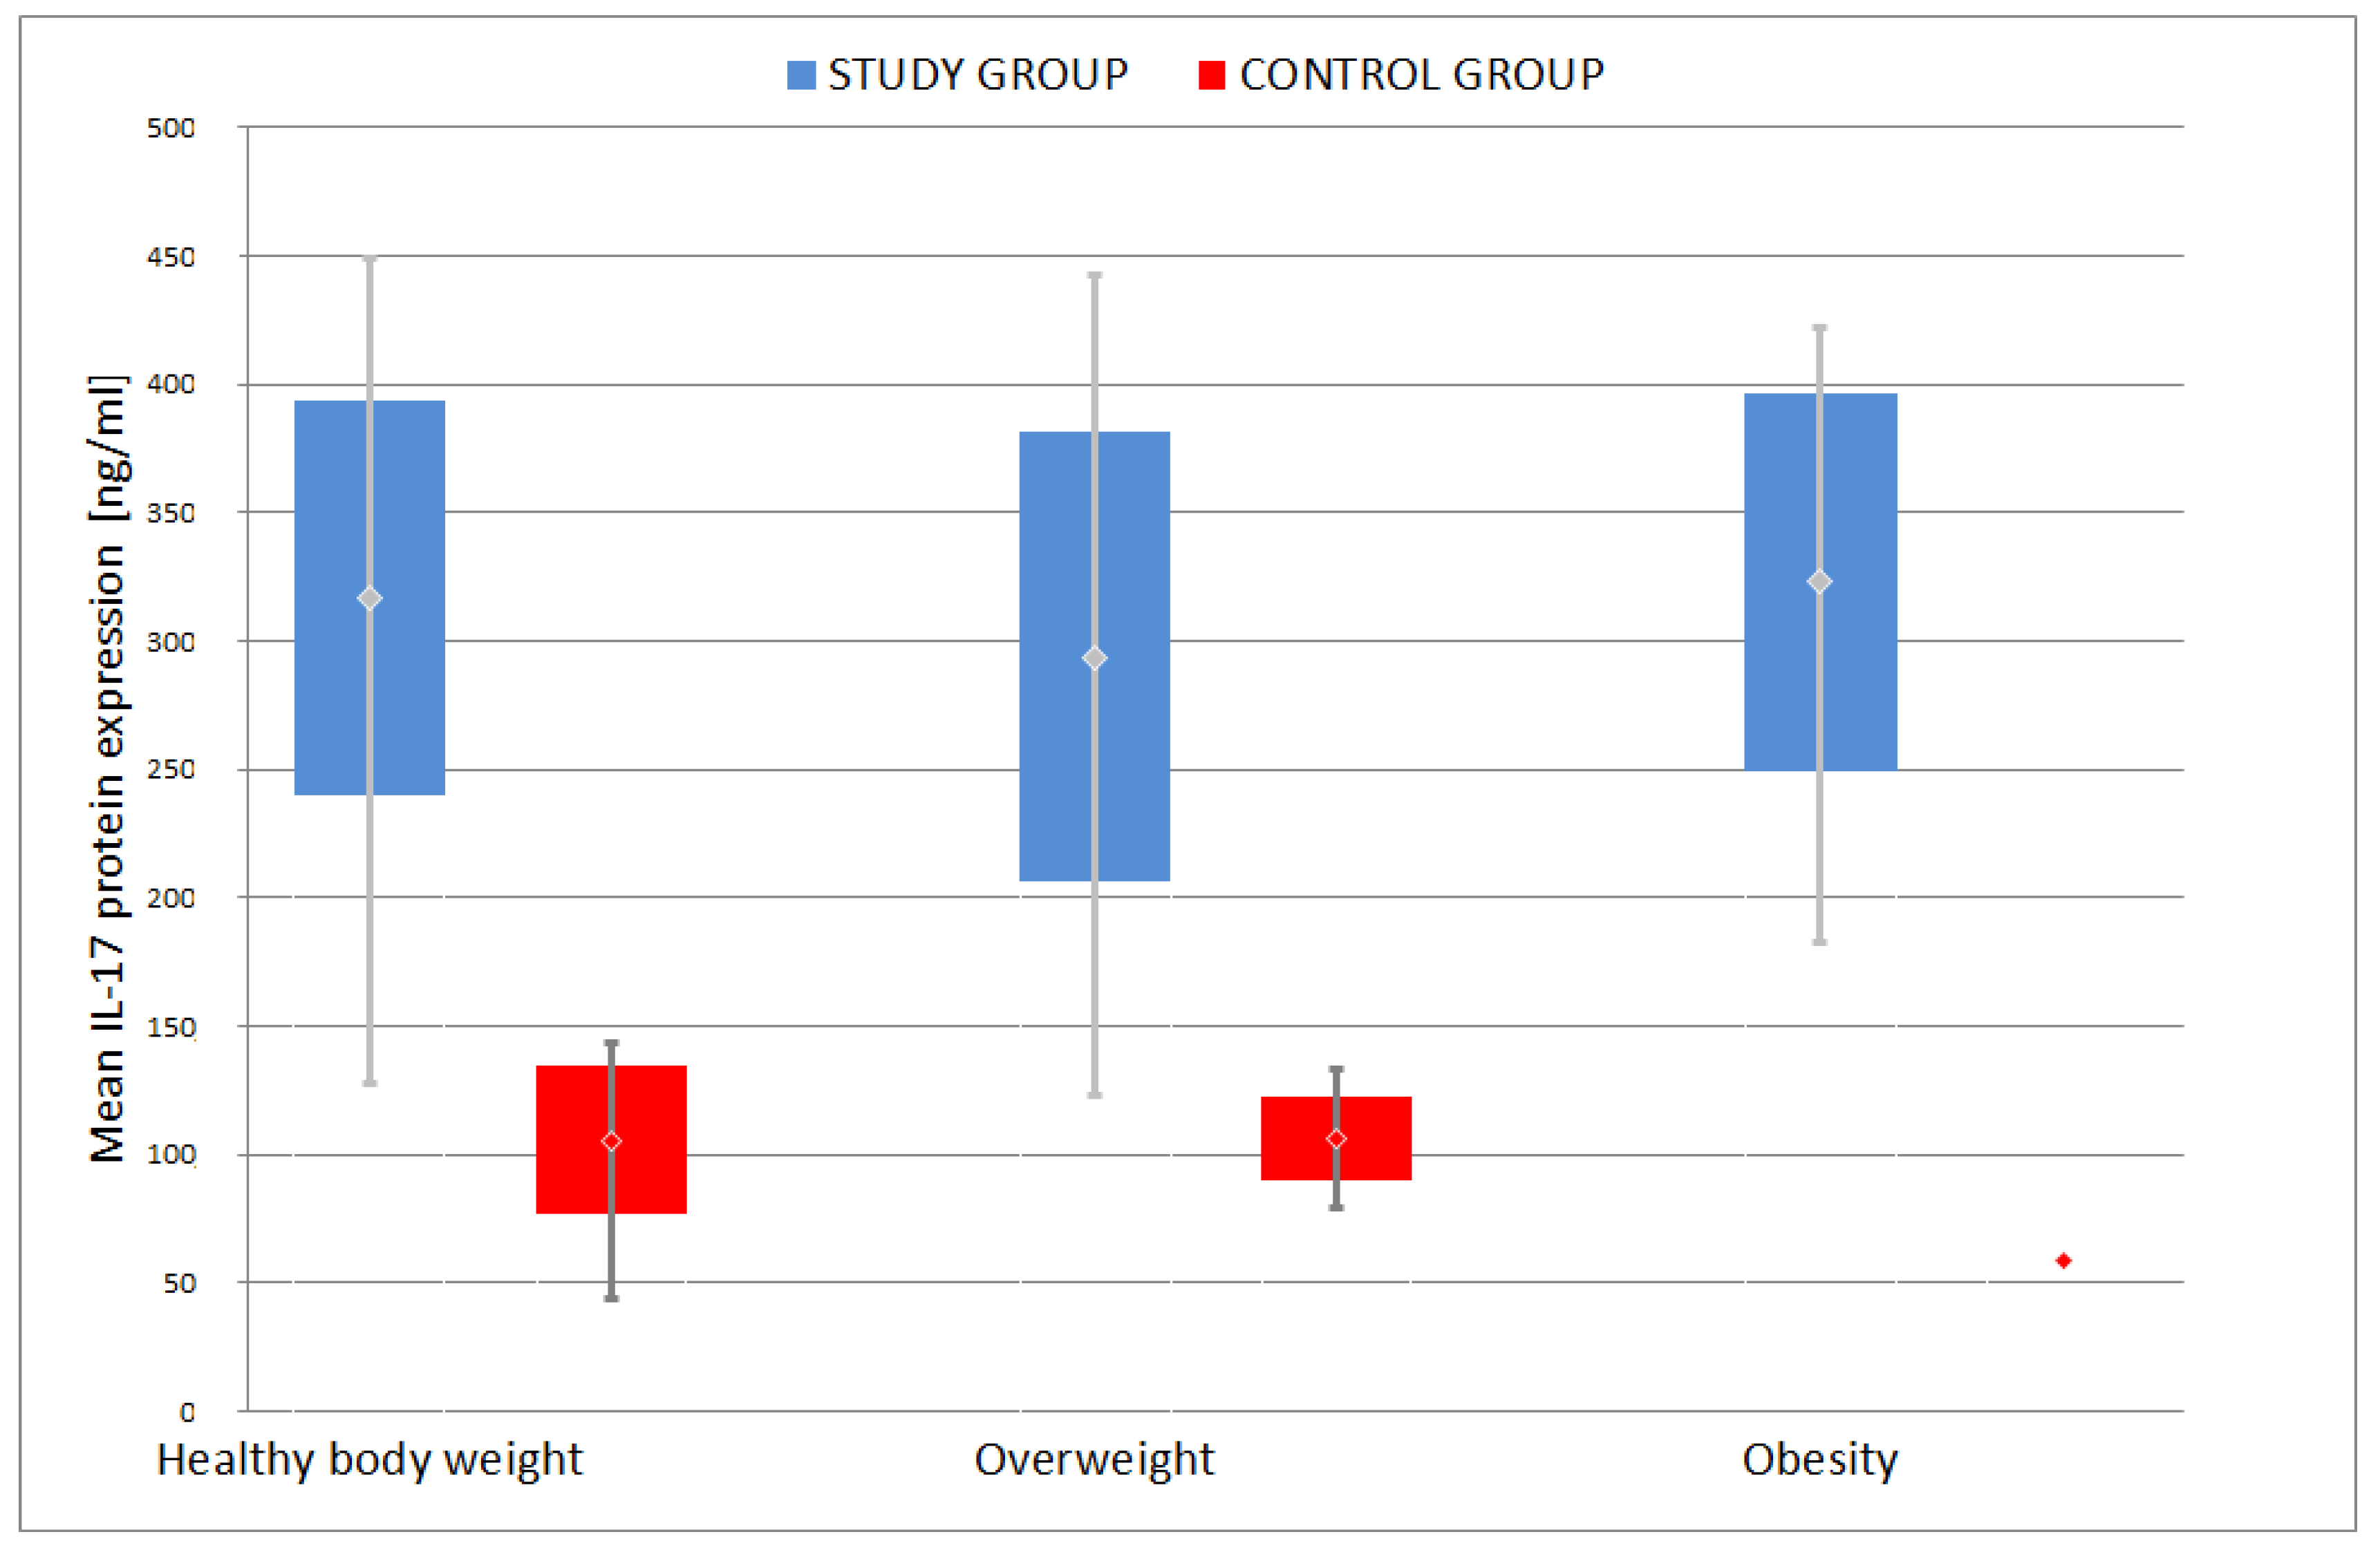
| IL-17 (ng/mL) | 123 | 449 | 309.1 | 79.5 | 25.7 | 44 | 143 | 104.2 | 25.1 | 24.1 | Z = 8.151; p = 0.000 * |
Publisher’s Note: MDPI stays neutral with regard to jurisdictional claims in published maps and institutional affiliations. |
© 2020 by the authors. Licensee MDPI, Basel, Switzerland. This article is an open access article distributed under the terms and conditions of the Creative Commons Attribution (CC BY) license (http://creativecommons.org/licenses/by/4.0/).
Share and Cite
Bliźniewska-Kowalska, K.; Szewczyk, B.; Gałecka, M.; Su, K.-P.; Maes, M.; Szemraj, J.; Gałecki, P. Is Interleukin 17 (IL-17) Expression A Common Point in the Pathogenesis of Depression and Obesity? J. Clin. Med. 2020, 9, 4018. https://doi.org/10.3390/jcm9124018
Bliźniewska-Kowalska K, Szewczyk B, Gałecka M, Su K-P, Maes M, Szemraj J, Gałecki P. Is Interleukin 17 (IL-17) Expression A Common Point in the Pathogenesis of Depression and Obesity? Journal of Clinical Medicine. 2020; 9(12):4018. https://doi.org/10.3390/jcm9124018
Chicago/Turabian StyleBliźniewska-Kowalska, Katarzyna, Bernadeta Szewczyk, Małgorzata Gałecka, Kuan-Pin Su, Michael Maes, Janusz Szemraj, and Piotr Gałecki. 2020. "Is Interleukin 17 (IL-17) Expression A Common Point in the Pathogenesis of Depression and Obesity?" Journal of Clinical Medicine 9, no. 12: 4018. https://doi.org/10.3390/jcm9124018
APA StyleBliźniewska-Kowalska, K., Szewczyk, B., Gałecka, M., Su, K.-P., Maes, M., Szemraj, J., & Gałecki, P. (2020). Is Interleukin 17 (IL-17) Expression A Common Point in the Pathogenesis of Depression and Obesity? Journal of Clinical Medicine, 9(12), 4018. https://doi.org/10.3390/jcm9124018