Relationship between N95 Amplitude of Pattern Electroretinogram and Optical Coherence Tomography Angiography in Open-Angle Glaucoma

 ,
,  ,
,
Abstract
1. Introduction
2. Methods
2.1. Patients
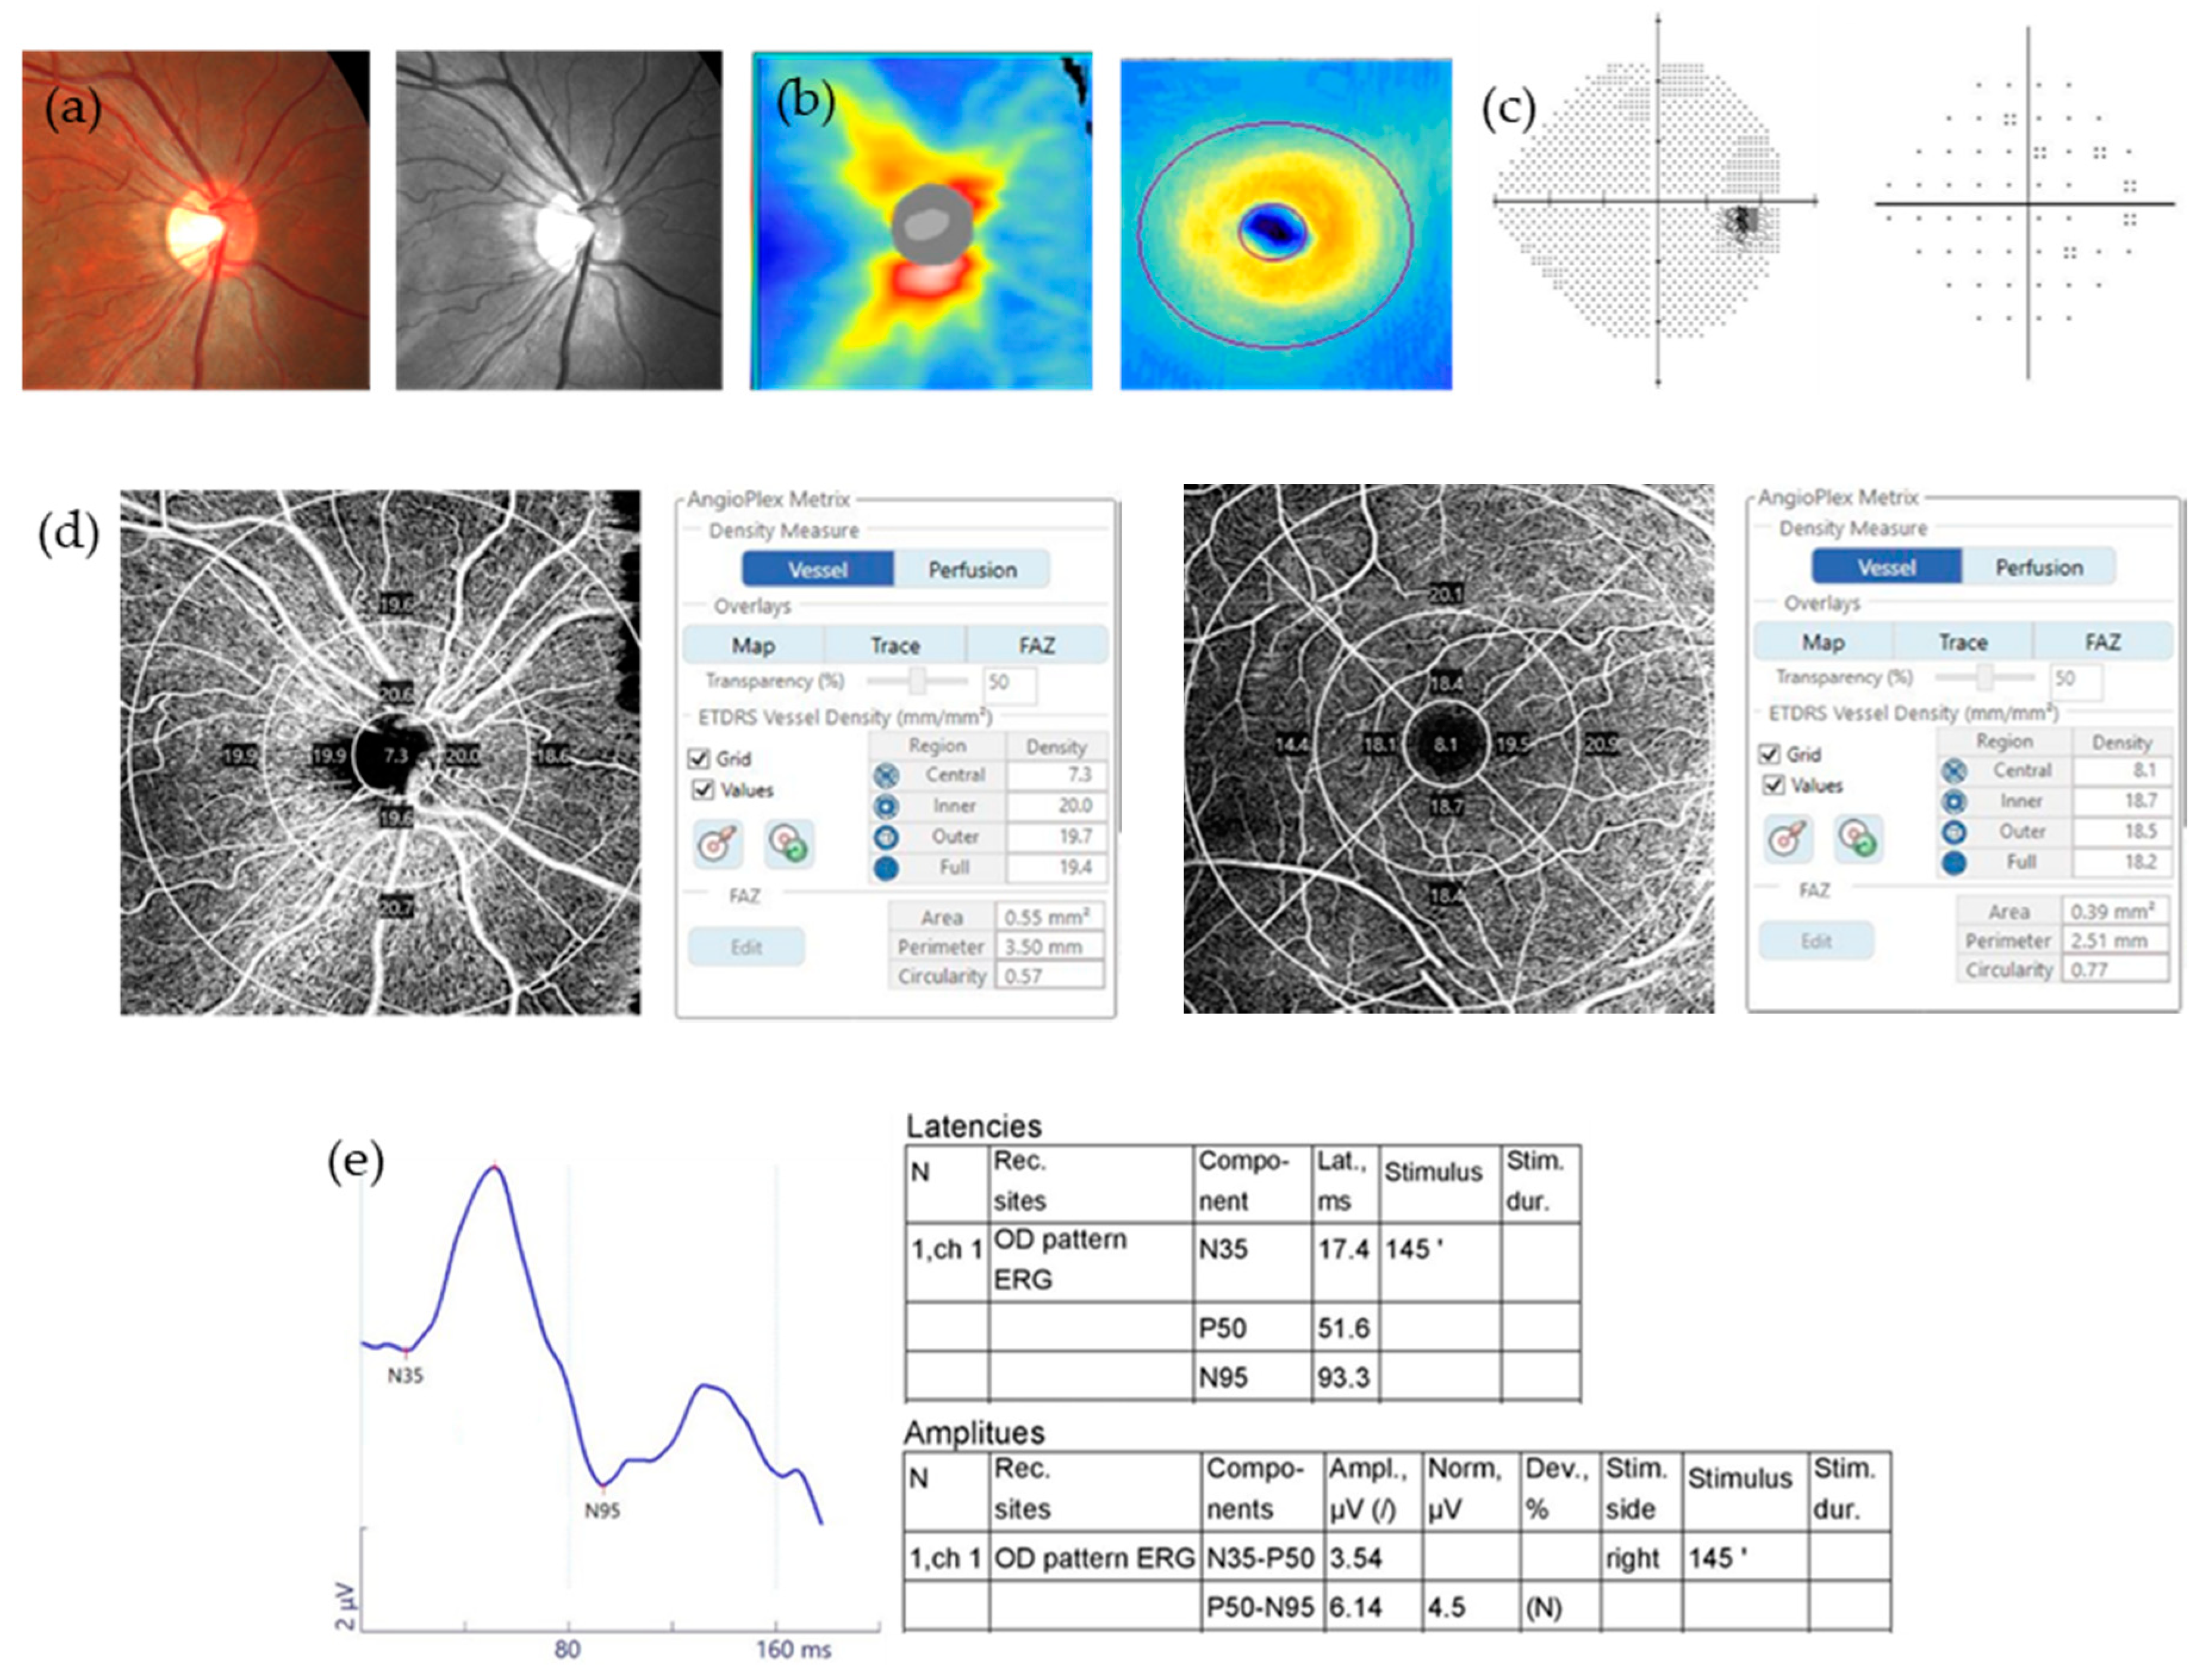
2.2. Pattern Electroretinogram
2.3. Optical Coherence Tomography Angiography
2.4. Optical Coherence Tomography
2.5. Standard Automated Perimetry
2.6. Statistical Analysis
3. Results
4. Discussion
5. Conclusions
Supplementary Materials
Author Contributions
Funding
Conflicts of Interest
References
- Weinreb, R.N.; Khaw, P.T. Primary open-angle glaucoma. Lancet 2004, 363, 1711–1720. [Google Scholar] [CrossRef]
- Aldebasi, Y.H.; Drasdo, N.; Morgan, J.E.; North, R.V. S-cone, l + m-cone, and pattern, electroretinograms in ocular hypertension and glaucoma. Vis. Res. 2004, 44, 2749–2756. [Google Scholar] [CrossRef][Green Version]
- Bach, M.; Unsoeld, A.S.; Philippin, H.; Staubach, F.; Maier, P.; Walter, H.S.; Bomer, T.G.; Funk, J. Pattern erg as an early glaucoma indicator in ocular hypertension: A long-term, prospective study. Investig. Ophthalmol. Vis. Sci. 2006, 47, 4881–4887. [Google Scholar] [CrossRef]
- Hood, D.C.; Xu, L.; Thienprasiddhi, P.; Greenstein, V.C.; Odel, J.G.; Grippo, T.M.; Liebmann, J.M.; Ritch, R. The pattern electroretinogram in glaucoma patients with confirmed visual field deficits. Investig. Ophthalmol. Vis. Sci. 2005, 46, 2411–2418. [Google Scholar] [CrossRef]
- Salgarello, T.; Colotto, A.; Falsini, B.; Buzzonetti, L.; Cesari, L.; Iarossi, G.; Scullica, L. Correlation of pattern electroretinogram with optic disc cup shape in ocular hypertension. Investig. Ophthalmol. Vis. Sci. 1999, 40, 1989–1997. [Google Scholar]
- Tafreshi, A.; Racette, L.; Weinreb, R.N.; Sample, P.A.; Zangwill, L.M.; Medeiros, F.A.; Bowd, C. Pattern electroretinogram and psychophysical tests of visual function for discriminating between healthy and glaucoma eyes. Am. J. Ophthalmol. 2010, 149, 488–495. [Google Scholar] [CrossRef] [PubMed][Green Version]
- Bowd, C.; Vizzeri, G.; Tafreshi, A.; Zangwill, L.M.; Sample, P.A.; Weinreb, R.N. Diagnostic accuracy of pattern electroretinogram optimized for glaucoma detection. Ophthalmology 2009, 116, 437–443. [Google Scholar] [CrossRef] [PubMed]
- Ventura, L.M.; Golubev, I.; Feuer, W.J.; Porciatti, V. Pattern electroretinogram progression in glaucoma suspects. J. Glaucoma 2013, 22, 219–225. [Google Scholar] [CrossRef] [PubMed]
- Bode, S.F.; Jehle, T.; Bach, M. Pattern electroretinogram in glaucoma suspects: New findings from a longitudinal study. Investig. Ophthalmol. Vis. Sci. 2011, 52, 4300–4306. [Google Scholar] [CrossRef] [PubMed]
- Jia, Y.; Wei, E.; Wang, X.; Zhang, X.; Morrison, J.C.; Parikh, M.; Lombardi, L.H.; Gattey, D.M.; Armour, R.L.; Edmunds, B.; et al. Optical coherence tomography angiography of optic disc perfusion in glaucoma. Ophthalmology 2014, 121, 1322–1332. [Google Scholar] [CrossRef]
- Yarmohammadi, A.; Zangwill, L.M.; Diniz-Filho, A.; Saunders, L.J.; Suh, M.H.; Wu, Z.; Manalastas, P.I.C.; Akagi, T.; Medeiros, F.A.; Weinreb, R.N. Peripapillary and macular vessel density in patients with glaucoma and single-hemifield visual field defect. Ophthalmology 2017, 124, 709–719. [Google Scholar] [CrossRef] [PubMed]
- Liu, L.; Jia, Y.; Takusagawa, H.L.; Pechauer, A.D.; Edmunds, B.; Lombardi, L.; Davis, E.; Morrison, J.C.; Huang, D. Optical coherence tomography angiography of the peripapillary retina in glaucoma. JAMA Ophthalmol. 2015, 133, 1045–1052. [Google Scholar] [CrossRef] [PubMed]
- Bojikian, K.D.; Chen, C.L.; Wen, J.C.; Zhang, Q.; Xin, C.; Gupta, D.; Mudumbai, R.C.; Johnstone, M.A.; Wang, R.K.; Chen, P.P. Optic disc perfusion in primary open angle and normal tension glaucoma eyes using optical coherence tomography-based microangiography. PLoS ONE 2016, 11, e0154691. [Google Scholar] [CrossRef]
- Rao, H.L.; Pradhan, Z.S.; Weinreb, R.N.; Reddy, H.B.; Riyazuddin, M.; Dasari, S.; Palakurthy, M.; Puttaiah, N.K.; Rao, D.A.; Webers, C.A. Regional comparisons of optical coherence tomography angiography vessel density in primary open-angle glaucoma. Am. J. Ophthalmol. 2016, 171, 75–83. [Google Scholar] [CrossRef]
- Triolo, G.; Rabiolo, A.; Shemonski, N.D.; Fard, A.; Di Matteo, F.; Sacconi, R.; Bettin, P.; Magazzeni, S.; Querques, G.; Vazquez, L.E.; et al. Optical coherence tomography angiography macular and peripapillary vessel perfusion density in healthy subjects, glaucoma suspects, and glaucoma patients. Investig. Ophthalmol. Vis. Sci. 2017, 58, 5713–5722. [Google Scholar] [CrossRef]
- Ghahari, E.; Bowd, C.; Zangwill, L.M.; Proudfoot, J.; Hasenstab, K.A.; Hou, H.; Penteado, R.C.; Manalastas, P.I.C.; Moghimi, S.; Shoji, T.; et al. Association of macular and circumpapillary microvasculature with visual field sensitivity in advanced glaucoma. Am. J. Ophthalmol. 2019, 204, 51–61. [Google Scholar] [CrossRef] [PubMed]
- Kim, G.N.; Lee, E.J.; Kim, H.; Kim, T.W. Dynamic range of the peripapillary retinal vessel density for detecting glaucomatous visual field damage. Ophthalmol. Glaucoma 2019, 2, 103–110. [Google Scholar] [CrossRef]
- Park, H.Y.; Shin, D.Y.; Jeon, S.J.; Park, C.K. Association between parapapillary choroidal vessel density measured with optical coherence tomography angiography and future visual field progression in patients with glaucoma. JAMA Ophthalmol. 2019, 137, 681–688. [Google Scholar] [CrossRef] [PubMed]
- Yarmohammadi, A.; Zangwill, L.M.; Manalastas, P.I.C.; Fuller, N.J.; Diniz-Filho, A.; Saunders, L.J.; Suh, M.H.; Hasenstab, K.; Weinreb, R.N. Peripapillary and macular vessel density in patients with primary open-angle glaucoma and unilateral visual field loss. Ophthalmology 2018, 125, 578–587. [Google Scholar] [CrossRef]
- Bach, M.; Brigell, M.G.; Hawlina, M.; Holder, G.E.; Johnson, M.A.; McCulloch, D.L.; Meigen, T.; Viswanathan, S. Iscev standard for clinical pattern electroretinography (perg): 2012 update. Doc. Ophthalmol. 2013, 126, 1–7. [Google Scholar] [CrossRef]
- Elgohary, A.M.; Elbedewy, H.A.; Saad, H.A.; Eid, T.M. Pattern electroretinogram changes in patients with primary open-angle glaucoma in correlation with visual field and optical coherence tomography changes. Eur. J. Ophthalmol. 2019. [Google Scholar] [CrossRef] [PubMed]
- Jeon, S.J.; Park, H.L.; Jung, K.I.; Park, C.K. Relationship between pattern electroretinogram and optic disc morphology in glaucoma. PLoS ONE 2019, 14, e0220992. [Google Scholar] [CrossRef] [PubMed]
- Turkey, E.; Elsanabary, Z.S.E.; Elshazly, L.H.M.; Osman, M.H. Role of pattern electroretinogram in ocular hypertension and early glaucoma. J. Glaucoma 2019, 28, 871–877. [Google Scholar] [CrossRef] [PubMed]
- Jung, K.I.; Jeon, S.; Shin, D.Y.; Lee, J.; Park, C.K. Pattern electroretinograms in preperimetric and perimetric glaucoma. Am. J. Ophthalmol. 2020, 215, 118–126. [Google Scholar] [CrossRef] [PubMed]
- Ventura, L.M.; Sorokac, N.; De Los Santos, R.; Feuer, W.J.; Porciatti, V. The relationship between retinal ganglion cell function and retinal nerve fiber thickness in early glaucoma. Investig. Ophthalmol. Vis. Sci. 2006, 47, 3904–3911. [Google Scholar] [CrossRef] [PubMed]
- Honda, H.; Anraku, A.; Ishida, K.; Enomoto, N.; Tomita, G. Relationship between macular vessel density and focal electroretinograms in early normal tension glaucoma. Curr. Eye Res. 2019, 44, 753–759. [Google Scholar] [CrossRef] [PubMed]
- Viswanathan, S.; Frishman, L.J.; Robson, J.G.; Harwerth, R.S.; Smith, E.L., 3rd. The photopic negative response of the macaque electroretinogram: Reduction by experimental glaucoma. Investig. Ophthalmol. Vis. Sci. 1999, 40, 1124–1136. [Google Scholar]
- Yarmohammadi, A.; Zangwill, L.M.; Diniz-Filho, A.; Suh, M.H.; Manalastas, P.I.; Fatehee, N.; Yousefi, S.; Belghith, A.; Saunders, L.J.; Medeiros, F.A.; et al. Optical coherence tomography angiography vessel density in healthy, glaucoma suspect, and glaucoma eyes. Investig. Ophthalmol. Vis. Sci. 2016, 57, OCT451–OCT459. [Google Scholar] [CrossRef]
- Rao, H.L.; Pradhan, Z.S.; Weinreb, R.N.; Riyazuddin, M.; Dasari, S.; Venugopal, J.P.; Puttaiah, N.K.; Rao, D.A.; Devi, S.; Mansouri, K.; et al. A comparison of the diagnostic ability of vessel density and structural measurements of optical coherence tomography in primary open angle glaucoma. PLoS ONE 2017, 12, e0173930. [Google Scholar] [CrossRef]
- Shin, J.W.; Lee, J.; Kwon, J.; Choi, J.; Kook, M.S. Regional vascular density-visual field sensitivity relationship in glaucoma according to disease severity. Br. J. Ophthalmol. 2017, 101, 1666–1672. [Google Scholar] [CrossRef]
- Kumar, R.S.; Anegondi, N.; Chandapura, R.S.; Sudhakaran, S.; Kadambi, S.V.; Rao, H.L.; Aung, T.; Sinha Roy, A. Discriminant function of optical coherence tomography angiography to determine disease severity in glaucoma. Investig. Ophthalmol. Vis. Sci. 2016, 57, 6079–6088. [Google Scholar] [CrossRef] [PubMed]
- Shin, J.W.; Kwon, J.; Lee, J.; Kook, M.S. Relationship between vessel density and visual field sensitivity in glaucomatous eyes with high myopia. Br. J. Ophthalmol. 2018. [Google Scholar] [CrossRef] [PubMed]
- Rao, H.L.; Riyazuddin, M.; Dasari, S.; Puttaiah, N.K.; Pradhan, Z.S.; Weinreb, R.N.; Mansouri, K.; Webers, C.A.B. Diagnostic abilities of the optical microangiography parameters of the 3x3 mm and 6x6 mm macular scans in glaucoma. J. Glaucoma 2018, 27, 496–503. [Google Scholar] [CrossRef] [PubMed]
- Takusagawa, H.L.; Liu, L.; Ma, K.N.; Jia, Y.; Gao, S.S.; Zhang, M.; Edmunds, B.; Parikh, M.; Tehrani, S.; Morrison, J.C.; et al. Projection-resolved optical coherence tomography angiography of macular retinal circulation in glaucoma. Ophthalmology 2017, 124, 1589–1599. [Google Scholar] [CrossRef] [PubMed]
- Venugopal, J.P.; Rao, H.L.; Weinreb, R.N.; Dasari, S.; Riyazuddin, M.; Pradhan, Z.S.; Puttaiah, N.K.; Devi, S.; Mansouri, K.; Webers, C.A.B. Repeatability and comparability of peripapillary vessel density measurements of high-density and non-high-density optical coherence tomography angiography scans in normal and glaucoma eyes. Br. J. Ophthalmol. 2019, 103, 949–954. [Google Scholar] [CrossRef]
- Rao, H.L.; Pradhan, Z.S.; Weinreb, R.N.; Reddy, H.B.; Riyazuddin, M.; Sachdeva, S.; Puttaiah, N.K.; Jayadev, C.; Webers, C.A.B. Determinants of peripapillary and macular vessel densities measured by optical coherence tomography angiography in normal eyes. J. Glaucoma 2017, 26, 491–497. [Google Scholar] [CrossRef]
- Lim, H.B.; Kim, Y.W.; Kim, J.M.; Jo, Y.J.; Kim, J.Y. The importance of signal strength in quantitative assessment of retinal vessel density using optical coherence tomography angiography. Sci. Rep. 2018, 8, 12897. [Google Scholar] [CrossRef]
- Lim, H.B.; Kim, Y.W.; Nam, K.Y.; Ryu, C.K.; Jo, Y.J.; Kim, J.Y. Signal strength as an important factor in the analysis of peripapillary microvascular density using optical coherence tomography angiography. Sci. Rep. 2019, 9, 16299. [Google Scholar] [CrossRef]


| Normal Group (n = 102) | OAG Group (n = 95) | p-Value | |
|---|---|---|---|
| Age (years) | 47.1 ± 15.9 | 56.9 ± 14.0 | <0.001 |
| Male (%) | 53 (52%) | 49 (51.6%) | 0.957 |
| HTN (%) | 23 (22.5%) | 31 (32.6%) | 0.113 |
| DM (%) | 6 (5.9%) | 10 (10.5%) | 0.233 |
| Pseudophakia (%) | 6 (5.9%) | 11 (11.6%) | 0.155 |
| BCVA (logMAR) | 0.02 ± 0.06 | 0.05 ± 0.07 | 0.010 |
| IOP (mmHg) | 15.6 ± 4.6 | 15.5 ± 3.3 | 0.840 |
| AXL (mm) | 24.7 ± 1.6 | 24.8 ± 1.5 | 0.501 |
| SE (diopter) | −1.7 ± 2.8 | −1.9 ± 3.0 | 0.745 |
| Average RNFL thickness (μm) | 92.3 ± 8.3 | 74.5 ± 12.0 | <0.001 |
| Average GCIPL thickness (μm) | 80.2 ± 4.5 | 70.7 ± 9.1 | <0.001 |
| Minimum GCIPL thickness (μm) | 78.2 ± 5.3 | 63.3 ± 11.6 | <0.001 |
| MD (decibel) | 0.0 ± 8.5 | −5.4 ± 5.4 | <0.001 |
| VFI (%) | 98.2 ± 3.1 | 87.9 ± 15.9 | <0.001 |
| Glaucoma severity (%) | |||
| Early | 65 (68.5%) | ||
| Moderate | 19 (20.0%) | ||
| Severe | 11 (10.5%) |
| Normal Group (n = 102) | OAG Group (n = 95) | p-Value | ||
|---|---|---|---|---|
| PERG | ||||
| Latency (ms) | N35 | 23.6 ± 5.9 | 23.2 ± 7.4 | 0.637 |
| P50 | 48.5 ± 5.5 | 50.0 ± 5.3 | 0.051 | |
| N95 | 100.6 ± 9.9 | 100.1 ± 12.5 | 0.750 | |
| Amplitude (μV) | P50 | 2.9 ± 1.1 | 2.5 ± 1.3 | 0.010 |
| N95 | 5.7 ± 1.7 | 4.4 ± 1.8 | <0.001 | |
| OCTA | ||||
| Peripapillary | ||||
| Signal strength | 8.7 ± 1.0 | 8.6 ± 1.0 | 0.394 | |
| VD (mm−1) | Center | 2.5 ± 3.3 | 1.0 ± 1.6 | <0.001 |
| Inner | 16.4 ± 2.4 | 14.6 ± 2.7 | <0.001 | |
| Outer | 18.2 ± 1.6 | 17.1 ± 1.7 | <0.001 | |
| Full | 17.3 ± 1.4 | 16.1 ± 1.7 | <0.001 | |
| Macula | ||||
| Signal strength | 8.7 ± 1.0 | 8.5 ± 1.0 | 0.221 | |
| VD (mm−1) | Center | 7.7 ± 2.8 | 8.0 ± 3.0 | 0.437 |
| Inner | 17.5 ± 4.5 | 16.7 ± 1.8 | 0.144 | |
| Outer | 17.4 ± 1.7 | 16.1 ± 1.9 | <0.001 | |
| Full | 17.0 ± 1.6 | 16.0 ± 1.8 | <0.001 | |
| FAZ area (mm2) | 0.27 ± 0.10 | 0.23 ± 0.11 | 0.015 | |
| N95 Amplitude | After Adjusting Confounding Factors | ||||
|---|---|---|---|---|---|
| r a | p-Value | r’ b | p-Value | ||
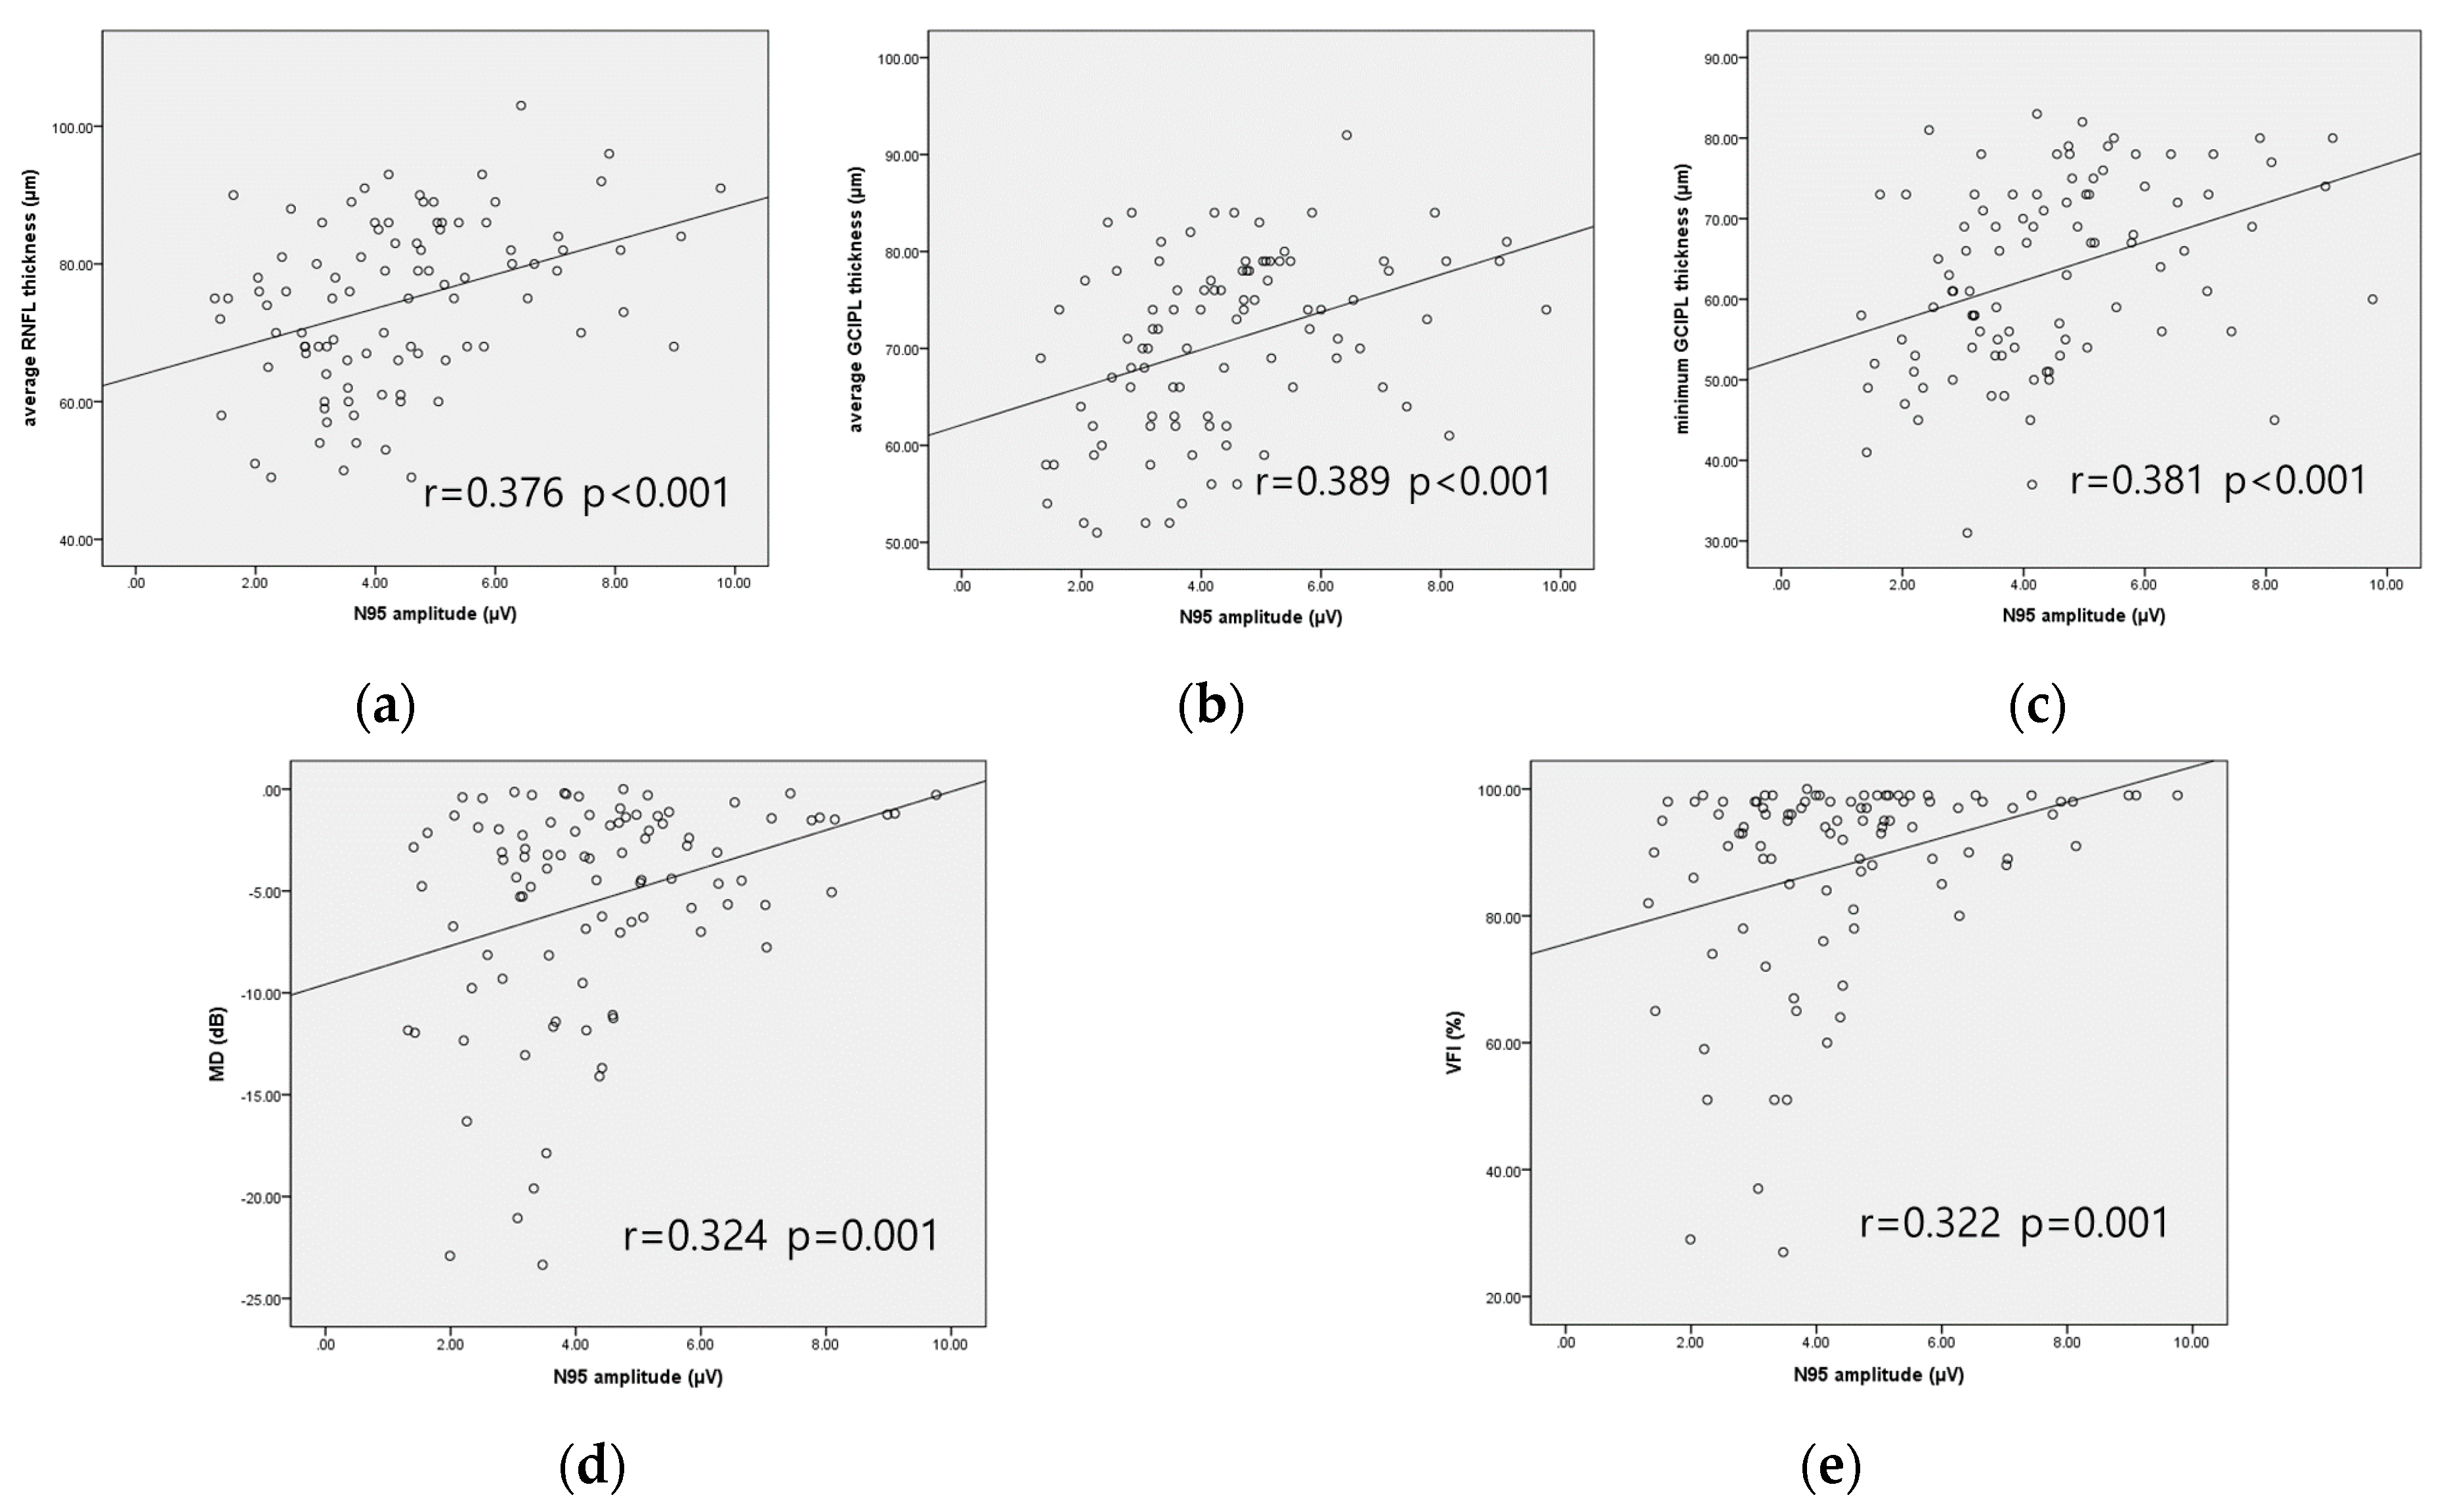
| Average RNFL thickness | 0.376 | <0.001 | 0.280 | 0.008 | |
| Average GCIPL thickness | 0.389 | <0.001 | 0.331 | 0.002 | |
| Minimum GCIPL thickness | 0.381 | <0.001 | 0.328 | 0.002 | |
| MD | 0.324 | 0.001 | 0.282 | 0.008 | |
| VFI | 0.322 | 0.001 | 0.290 | 0.006 | |
| Peripapillary VD | Center | 0.130 | 0.209 | ||
| Inner | 0.214 | 0.037 | 0.091 | 0.397 | |
| Outer | 0.408 | <0.001 | 0.322 | 0.002 | |
| Full | 0.392 | <0.001 | 0.279 | 0.008 | |
| Macular VD | Center | −0.100 | 0.336 | ||
| Inner | 0.354 | 0.117 | |||
| Outer | 0.399 | <0.001 | 0.339 | 0.001 | |
| Full | 0.354 | <0.001 | 0.292 | 0.006 | |
| FAZ area | 0.135 | 0.193 | |||
| N95 Amplitude | After Adjusting Confounding Factors | ||||
|---|---|---|---|---|---|
| r a | p-Value | r’ b | p-Value | ||
| Average RNFL thickness | 0.295 | 0.017 | 0.126 | 0.344 | |
| Average GCIPL thickness | 0.273 | 0.028 | 0.212 | 0.107 | |
| Minimum GCIPL thickness | 0.237 | 0.057 | |||
| MD | 0.065 | 0.605 | |||
| VFI | 0.058 | 0.647 | |||
| Peripapillary VD | Center | 0.071 | 0.571 | ||
| Inner | 0.079 | 0.533 | |||
| Outer | 0.338 | 0.006 | 0.234 | 0.077 | |
| Full | 0.290 | 0.019 | 0.150 | 0.262 | |
| Macular VD | Center | −0.136 | 0.280 | ||
| Inner | 0.161 | 0.201 | |||
| Outer | 0.376 | 0.002 | 0.311 | 0.017 | |
| Full | 0.345 | 0.005 | 0.271 | 0.040 | |
| FAZ area | 0.108 | 0.391 | |||
Publisher’s Note: MDPI stays neutral with regard to jurisdictional claims in published maps and institutional affiliations. |
© 2020 by the authors. Licensee MDPI, Basel, Switzerland. This article is an open access article distributed under the terms and conditions of the Creative Commons Attribution (CC BY) license (http://creativecommons.org/licenses/by/4.0/).
Share and Cite
Lee, T.; Seo, D.R.; Kim, J.Y.; Choi, W.; Lee, S.Y.; Lee, J.M.; Seong, G.J.; Kim, C.Y.; Bae, H.W. Relationship between N95 Amplitude of Pattern Electroretinogram and Optical Coherence Tomography Angiography in Open-Angle Glaucoma. J. Clin. Med. 2020, 9, 3854. https://doi.org/10.3390/jcm9123854
Lee T, Seo DR, Kim JY, Choi W, Lee SY, Lee JM, Seong GJ, Kim CY, Bae HW. Relationship between N95 Amplitude of Pattern Electroretinogram and Optical Coherence Tomography Angiography in Open-Angle Glaucoma. Journal of Clinical Medicine. 2020; 9(12):3854. https://doi.org/10.3390/jcm9123854
Chicago/Turabian StyleLee, Taekjune, Du Ri Seo, Joo Yeon Kim, Wungrak Choi, Sang Yeop Lee, Jun Mo Lee, Gong Je Seong, Chan Yun Kim, and Hyoung Won Bae. 2020. "Relationship between N95 Amplitude of Pattern Electroretinogram and Optical Coherence Tomography Angiography in Open-Angle Glaucoma" Journal of Clinical Medicine 9, no. 12: 3854. https://doi.org/10.3390/jcm9123854
APA StyleLee, T., Seo, D. R., Kim, J. Y., Choi, W., Lee, S. Y., Lee, J. M., Seong, G. J., Kim, C. Y., & Bae, H. W. (2020). Relationship between N95 Amplitude of Pattern Electroretinogram and Optical Coherence Tomography Angiography in Open-Angle Glaucoma. Journal of Clinical Medicine, 9(12), 3854. https://doi.org/10.3390/jcm9123854