The Added Value of Radiographs in Diagnosing Knee Osteoarthritis Is Similar for General Practitioners and Secondary Care Physicians; Data from the CHECK Early Osteoarthritis Cohort

 , , , ,
Abstract
1. Introduction
2. Methods
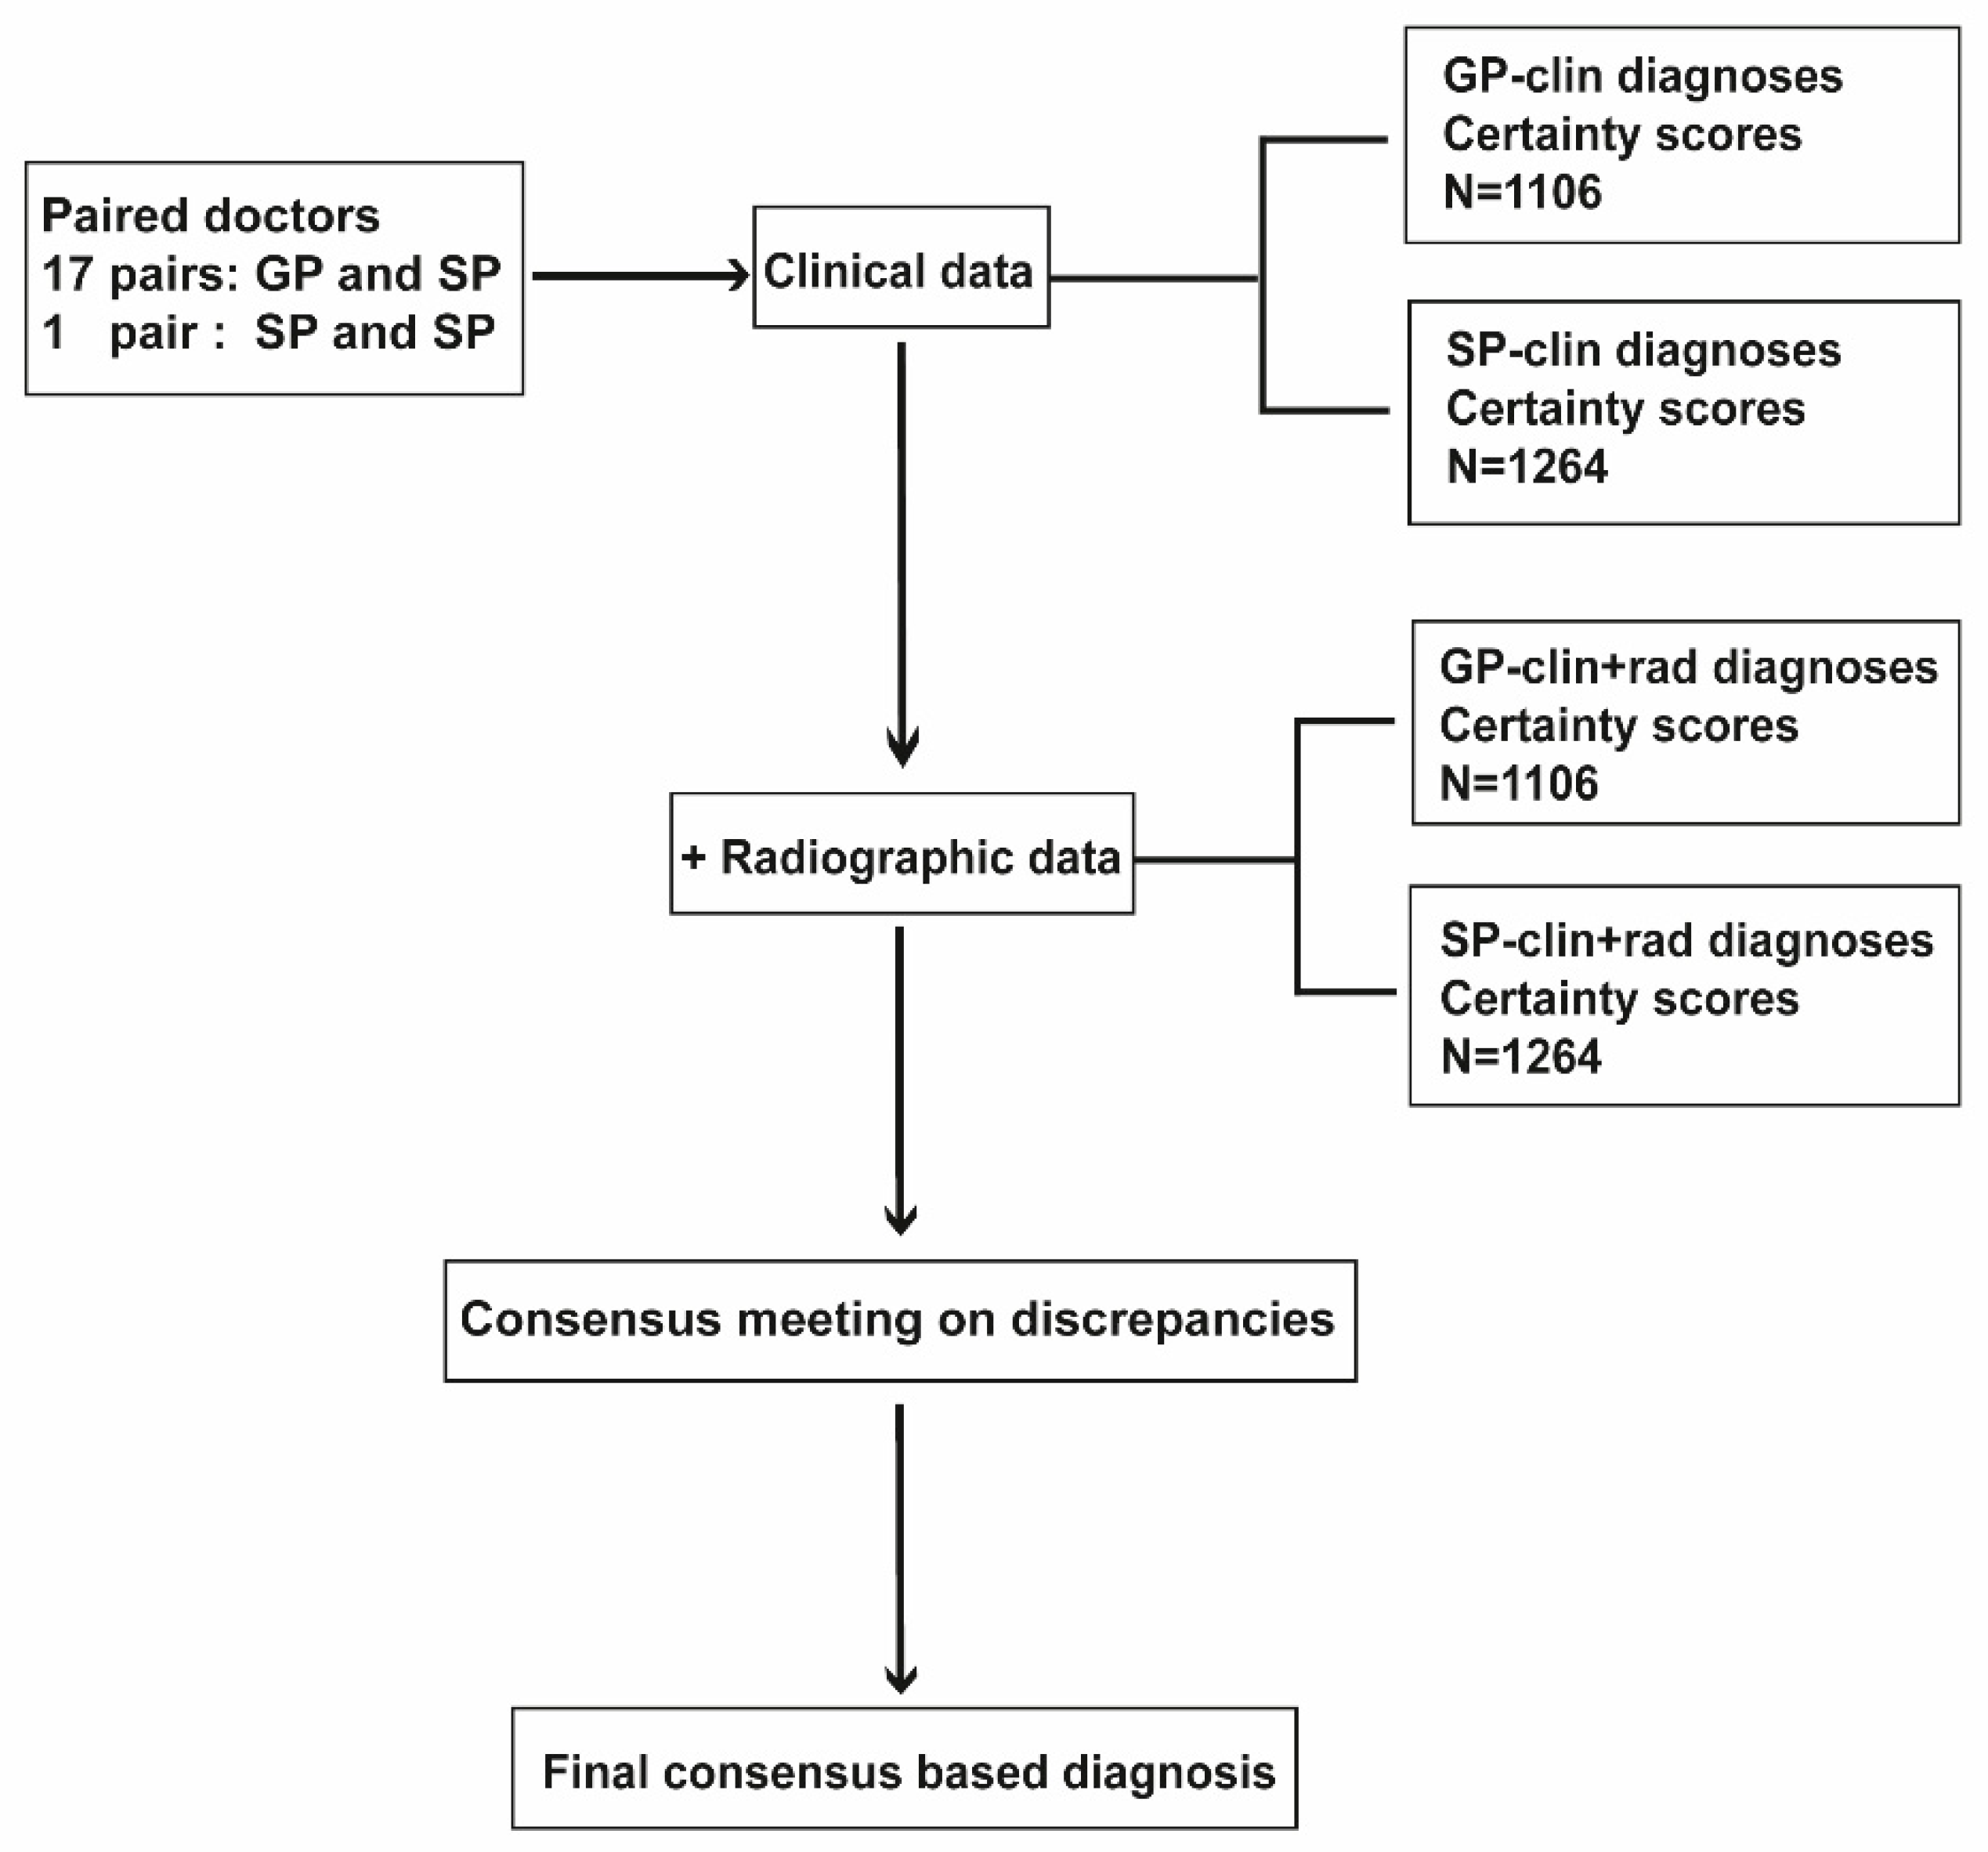
2.1. Clinical Experts
2.2. Clinical and Radiographic Data
2.3. Obtaining Diagnoses
2.4. Statistics
3. Results
3.1. Experts and Patients
3.2. Diagnostic Abilities
3.2.1. General Practitioners
3.2.2. Secondary Care Physicians
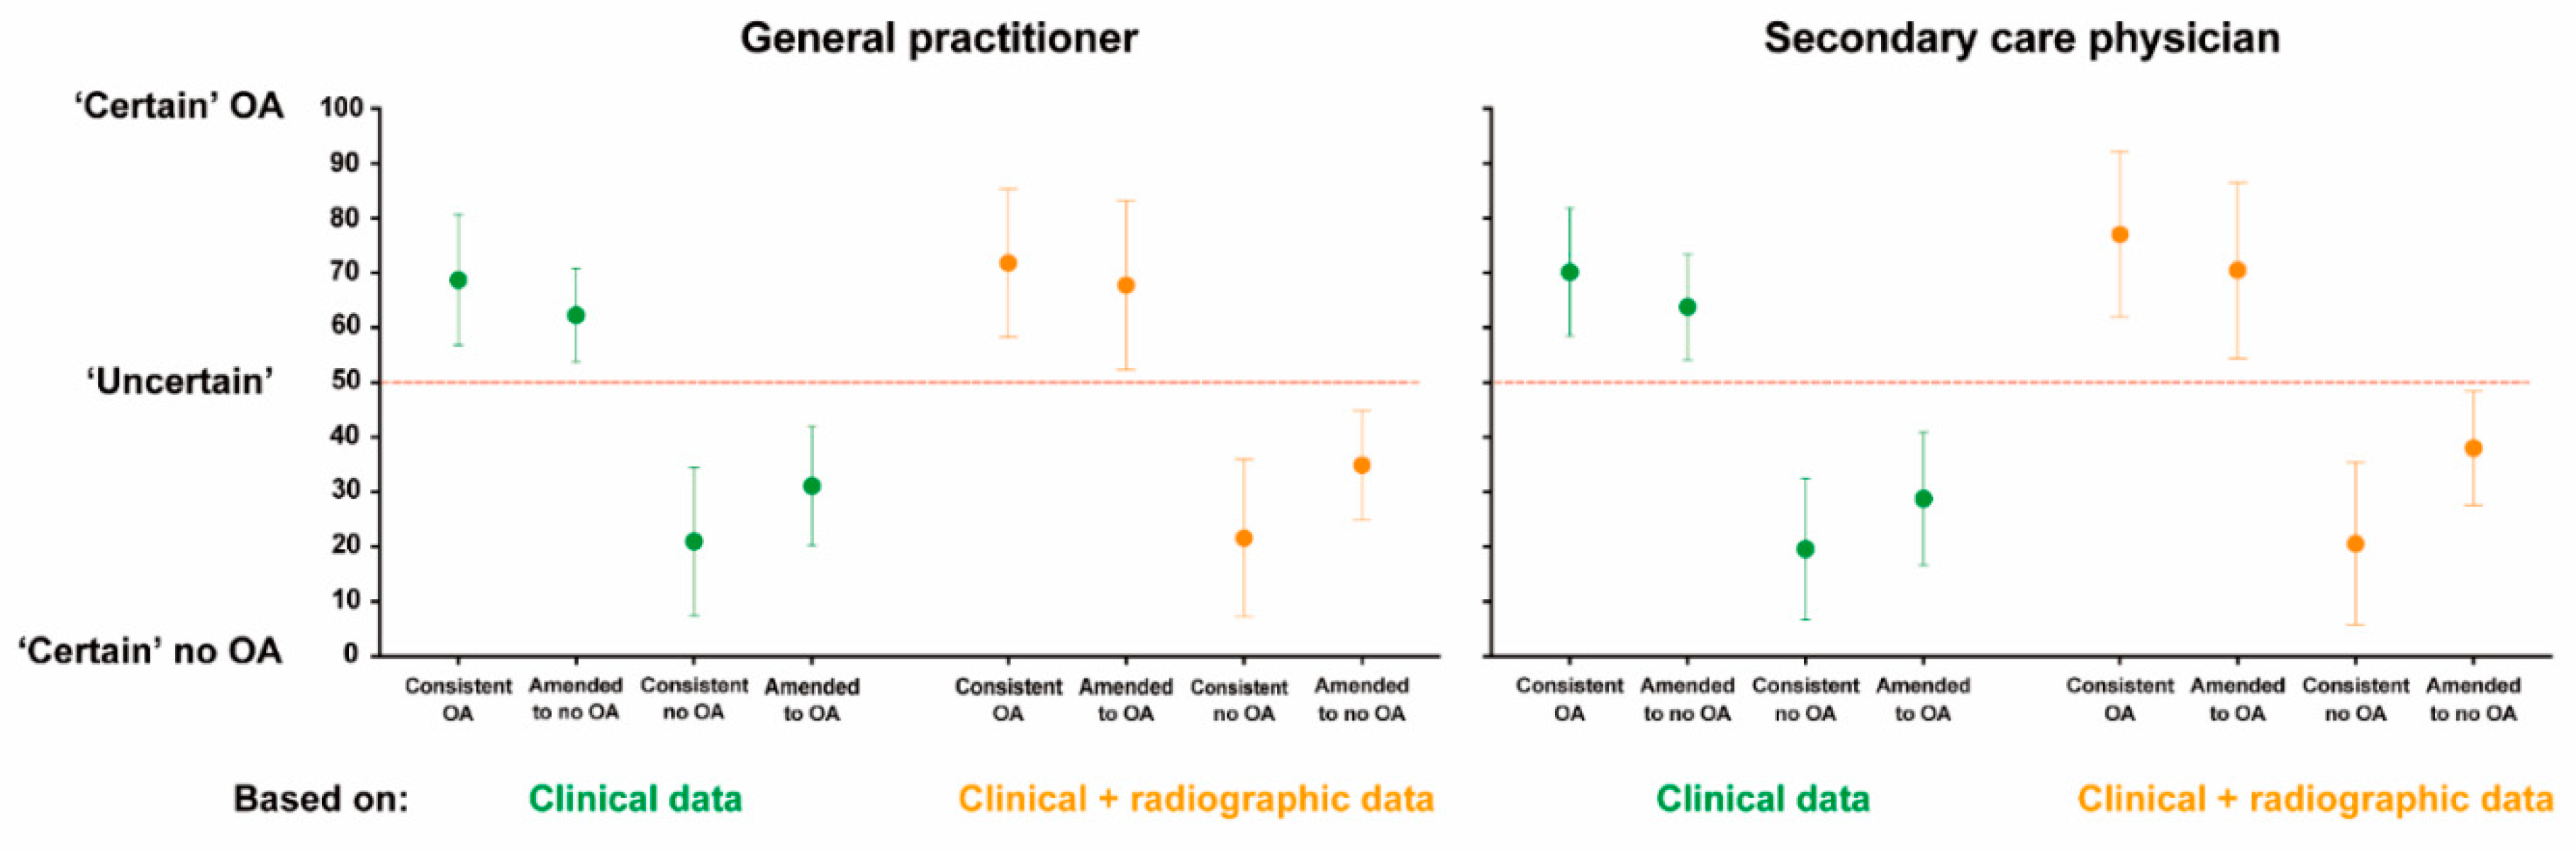
3.3. Diagnostic Certainties
4. Discussion
Supplementary Materials
Author Contributions
Funding
Acknowledgments
Conflicts of Interest
References
- Brand, C.A.; Harrison, C.; Tropea, J.; Hinman, R.S.; Britt, H.; Bennell, K. Management of osteoarthritis in general practice in australia. Arthritis Care Res. 2014, 66, 551–558. [Google Scholar] [CrossRef] [PubMed]
- Demehri, S.; Guermazi, A.; Kwoh, C.K. Diagnosis and longitudinal assessment of osteoarthritis: Review of available imaging techniques. Rheum. Dis. Clin. N. Am. 2016, 42, 607–620. [Google Scholar] [CrossRef] [PubMed]
- Zhang, W.; Doherty, M.; Peat, G.; Bierma-Zeinstra, M.A.; Arden, N.K.; Bresnihan, B.; Herrero-Beaumont, G.; Kirschner, S.; Leeb, B.F.; Lohmander, L.S.; et al. Eular evidence-based recommendations for the diagnosis of knee osteoarthritis. Ann. Rheum. Dis. 2010, 69, 483–489. [Google Scholar] [CrossRef]
- Parsons, C.; Fuggle, N.R.; Edwards, M.H.; Goulston, L.; Litwic, A.E.; Jagannath, D.; van der Pas, S.; Cooper, C.; Dennison, E.M.; Group, E.R. Concordance between clinical and radiographic evaluations of knee osteoarthritis. Aging Clin. Exp. Res. 2018, 30, 17–25. [Google Scholar] [CrossRef]
- Decary, S.; Ouellet, P.; Vendittoli, P.A.; Roy, J.S.; Desmeules, F. Diagnostic validity of physical examination tests for common knee disorders: An overview of systematic reviews and meta-analysis. Phys. Ther. Sport 2017, 23, 143–155. [Google Scholar] [CrossRef] [PubMed]
- Decary, S.; Feldman, D.; Fremont, P.; Pelletier, J.P.; Martel-Pelletier, J.; Fallaha, M.; Pelletier, B.; Belzile, S.; Sylvestre, M.P.; Vendittoli, P.A.; et al. Initial derivation of diagnostic clusters combining history elements and physical examination tests for symptomatic knee osteoarthritis. Musculoskelet. Care 2018, 16, 370–379. [Google Scholar] [CrossRef] [PubMed]
- Sakellariou, G.; Conaghan, P.G.; Zhang, W.; Bijlsma, J.W.J.; Boyesen, P.; D’Agostino, M.A.; Doherty, M.; Fodor, D.; Kloppenburg, M.; Miese, F.; et al. Eular recommendations for the use of imaging in the clinical management of peripheral joint osteoarthritis. Ann. Rheum. Dis. 2017, 76, 1484–1494. [Google Scholar] [CrossRef]
- Hunter, D.J.; Bierma-Zeinstra, S.M.A. Osteoarthr. Lancet 2019, 393, 1745–1759. [Google Scholar] [CrossRef]
- Bierma-Zeinstra, S.; van Middelkoop, M.; Runhaar, J.; Schiphof, D. Nonpharmacological and nonsurgical approaches in OA. Best Pract. Res. Clin. Rheumatol. 2020, 101564. [Google Scholar] [CrossRef]
- Kellgren, J.H.; Lawrence, J.S. Radiological assessment of osteo-arthrosis. Ann. Rheum. Dis. 1957, 16, 494–502. [Google Scholar] [CrossRef]
- Schiphof, D.; Runhaar, J.; Waarsing, J.H.; van Spil, W.E.; van Middelkoop, M.; Bierma-Zeinstra, S.M.A. The clinical and radiographic course of early knee and hip osteoarthritis over 10 years in check (cohort hip and cohort knee). Osteoarthr. Cartil. 2019, 27, 1491–1500. [Google Scholar] [CrossRef]
- Damen, J.; Schiphof, D.; Wolde, S.T.; Cats, H.A.; Bierma-Zeinstra, S.M.; Oei, E.H. Inter-observer reliability for radiographic assessment of early osteoarthritis features: The check (cohort hip and cohort knee) study. Osteoarthr. Cartil. 2014, 22, 969–974. [Google Scholar] [CrossRef] [PubMed]
- Wesseling, J.; Boers, M.; Viergever, M.A.; Hilberdink, W.K.; Lafeber, F.P.; Dekker, J.; Bijlsma, J.W. Cohort profile: Cohort hip and cohort knee (check) study. Int. J. Epidemiol. 2016, 45, 36–44. [Google Scholar] [CrossRef]
- Cook, C.J.; Cook, C.E.; Reiman, M.P.; Joshi, A.B.; Richardson, W.; Garcia, A.N. Systematic review of diagnostic accuracy of patient history, clinical findings, and physical tests in the diagnosis of lumbar spinal stenosis. Eur. Spine J. 2019. [Google Scholar] [CrossRef]
- Petersen, T.; Laslett, M.; Juhl, C. Clinical classification in low back pain: Best-evidence diagnostic rules based on systematic reviews. BMC Musculoskelet. Disord. 2017, 18, 188. [Google Scholar] [CrossRef]
- Thornbury, J.R.; Fryback, D.G.; Edwards, W. Likelihood ratios as a measure of the diagnostic usefulness of excretory urogram information. Radiology 1975, 114, 561–565. [Google Scholar] [CrossRef]
- McGee, S. Simplifying likelihood ratios. J. Gen. Intern. Med. 2002, 17, 646–649. [Google Scholar] [CrossRef]
- Esserman, L.; Cowley, H.; Eberle, C.; Kirkpatrick, A.; Chang, S.; Berbaum, K.; Gale, A. Improving the accuracy of mammography: Volume and outcome relationships. J. Natl. Cancer Inst. 2002, 94, 369–375. [Google Scholar] [CrossRef]
- Taruc-Uy, R.L.; Lynch, S.A. Diagnosis and treatment of osteoarthritis. Prim. Care 2013, 40, 821–836. [Google Scholar] [CrossRef]
- Worster, A.; Carpenter, C. Incorporation bias in studies of diagnostic tests: How to avoid being biased about bias. Can. J. Emerg. Med. 2008, 10, 174–175. [Google Scholar] [CrossRef]
- Karch, A.; Koch, A.; Zapf, A.; Zerr, I.; Karch, A. Partial verification bias and incorporation bias affected accuracy estimates of diagnostic studies for biomarkers that were part of an existing composite gold standard. J. Clin. Epidemiol. 2016, 78, 73–82. [Google Scholar] [CrossRef]
- Lankhorst, N.E.; Damen, J.; Oei, E.H.; Verhaar, J.A.N.; Kloppenburg, M.; Bierma-Zeinstra, S.M.A.; van Middelkoop, M. Incidence, prevalence, natural course and prognosis of patellofemoral osteoarthritis: The cohort hip and cohort knee study. Osteoarthr. Cartil. 2017, 25, 647–653. [Google Scholar] [CrossRef]
- Van Middelkoop, M.; Bennell, K.L.; Callaghan, M.J.; Collins, N.J.; Conaghan, P.G.; Crossley, K.M.; Eijkenboom, J.; van der Heijden, R.A.; Hinman, R.S.; Hunter, D.J.; et al. International patellofemoral osteoarthritis consortium: Consensus statement on the diagnosis, burden, outcome measures, prognosis, risk factors and treatment. Semin. Arthritis Rheum. 2018, 47, 666–675. [Google Scholar] [CrossRef]


| General Practitioner (N = 17) | Orthopedist (N = 8) | Rheumatologist (N = 9) | Sports Physician (N = 2) | p Values & | |
|---|---|---|---|---|---|
| Importance radiograph *, median (range) | 2 (1–4) | 4 (4–4) | 3 (2–4) | 3 (3–3) | <0.001 |
| Number of OA patients treated per week, mean (SD) | 5 (3) | 53 (25) | 6 (7) | 3 (2) | 0.06 |
| Years of experience, mean (SD) | 12 (9) | 14 (5) | 17 (9) | 20 (14) | 0.10 |
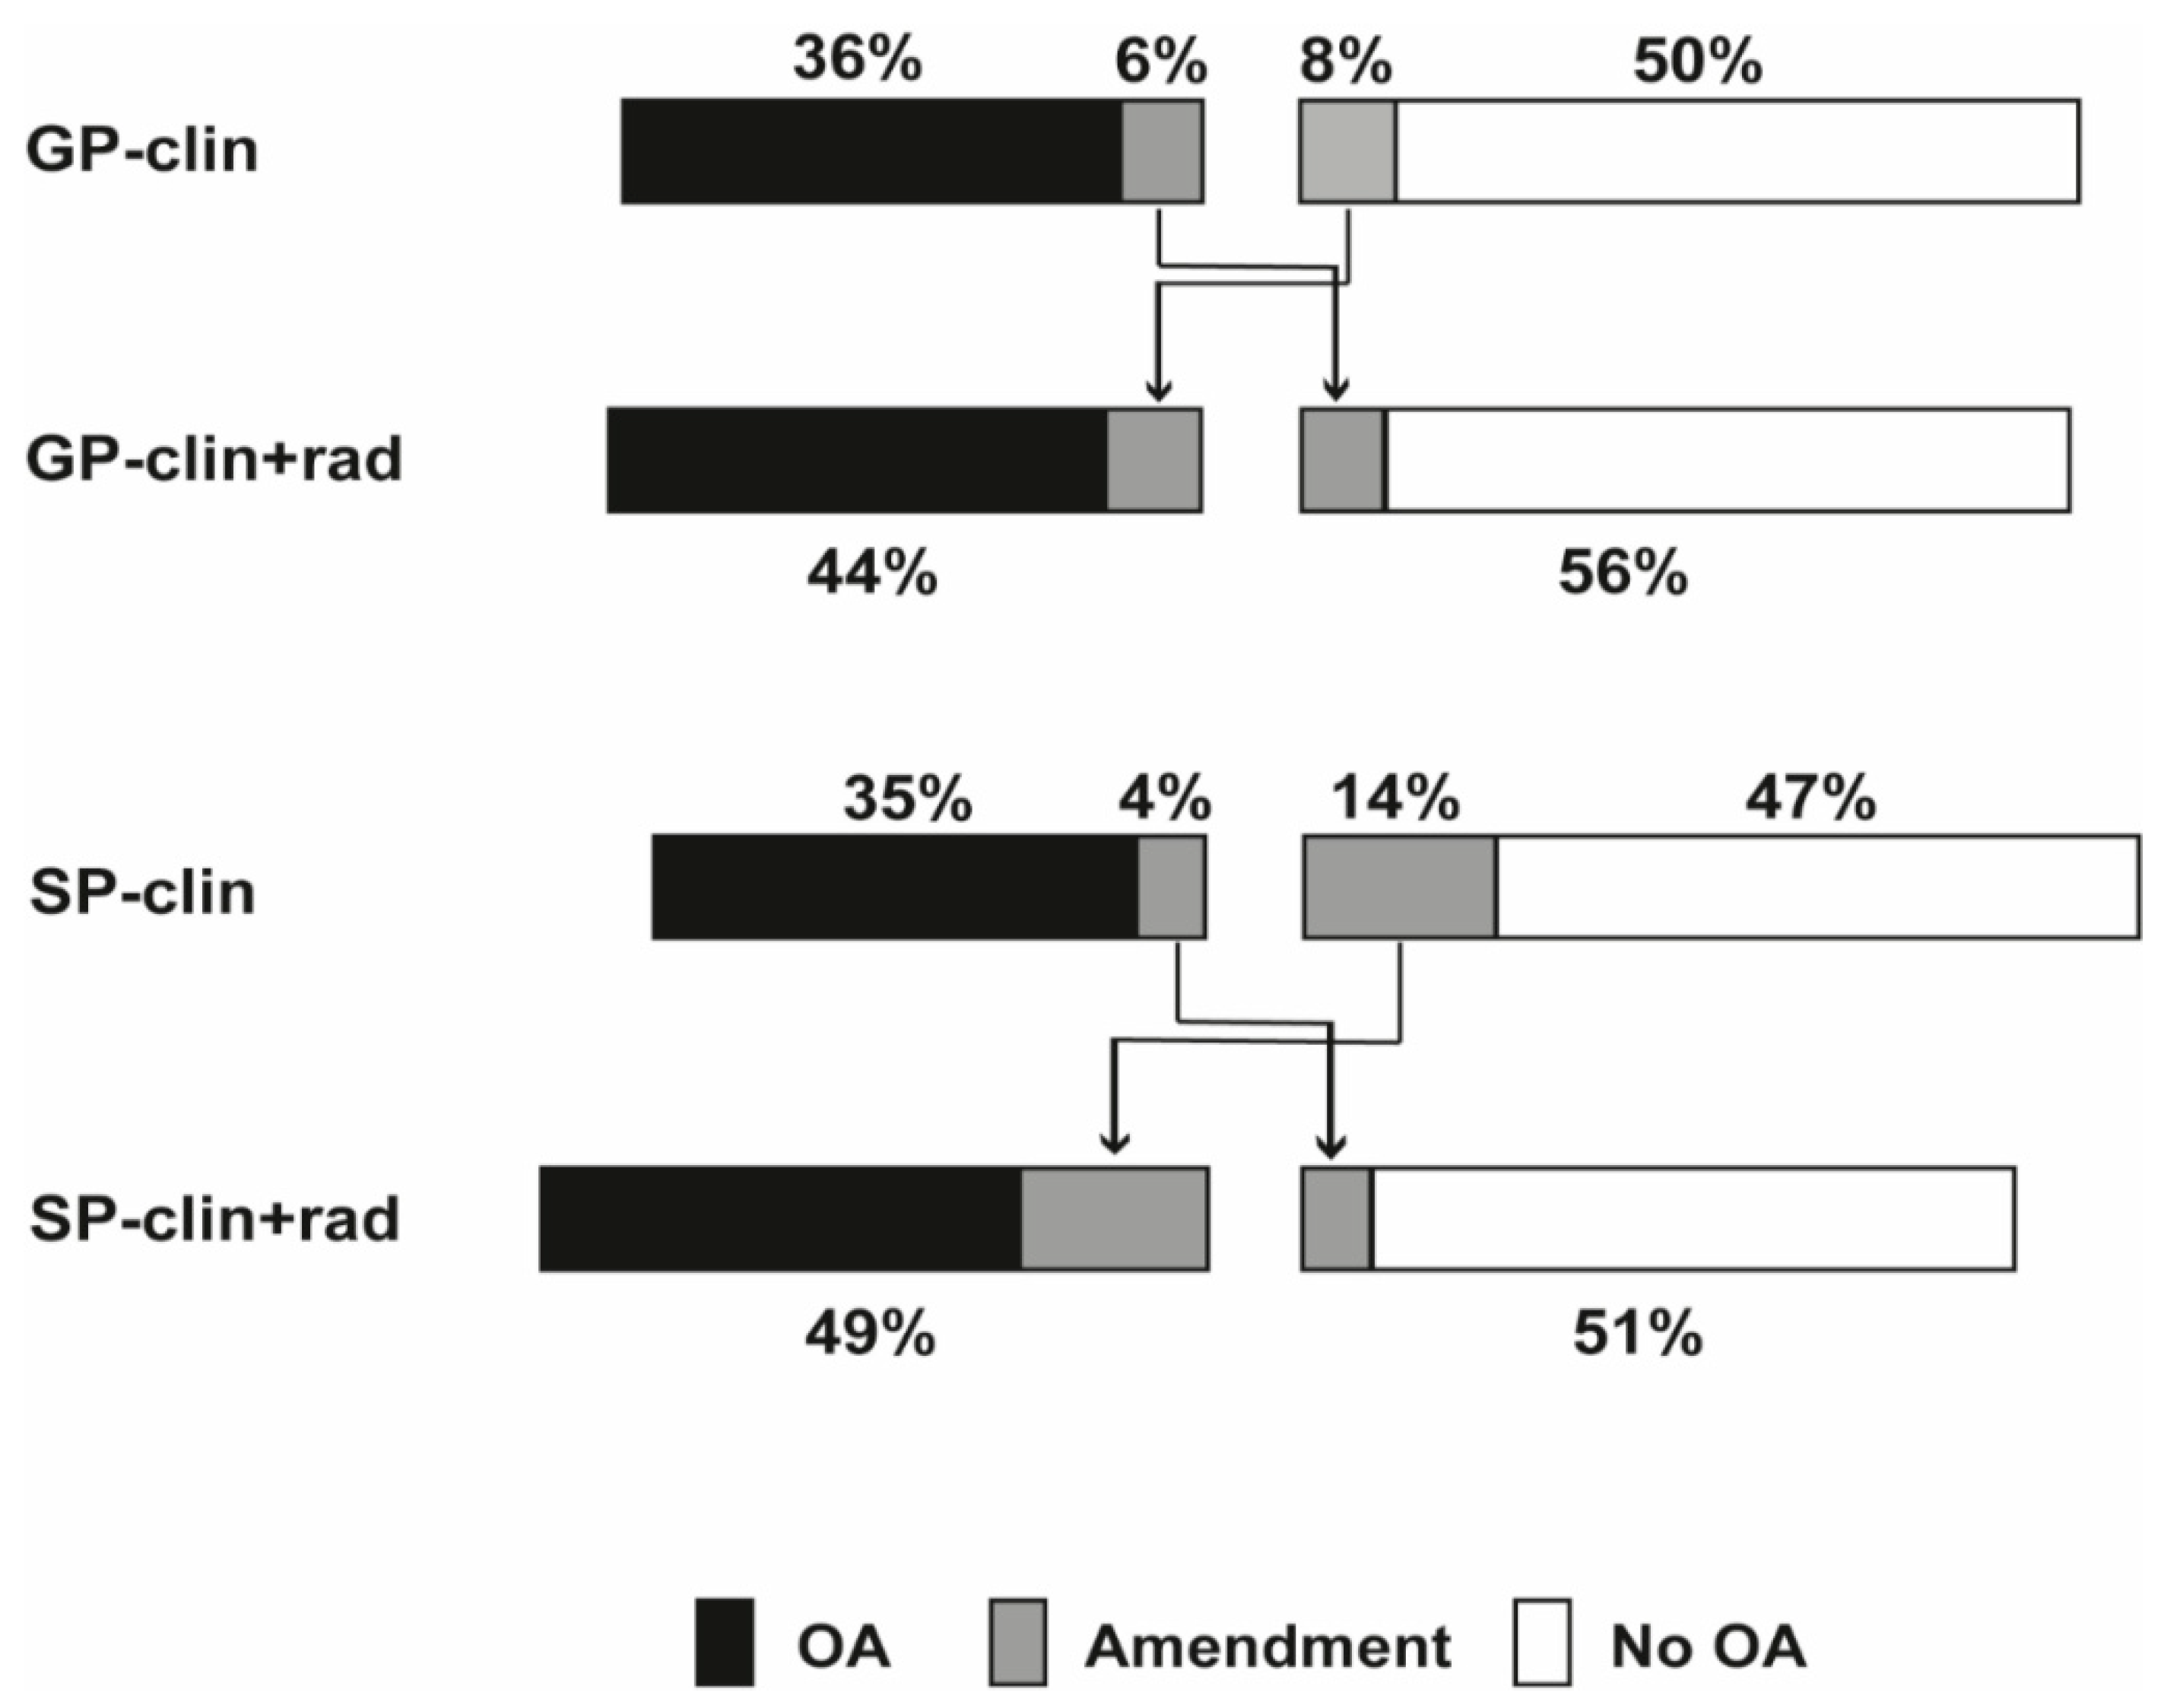
| OA % | Certainty Scores of OA Knees Mean (SD) | No OA % | Certainty Scores of No-OA Knees Mean (SD) | Consistent Diagnoses * % | Amended Diagnoses % | Correctly Amended # % | |
|---|---|---|---|---|---|---|---|
| GP-clin, N = 1106 | 42 & | 68 (12) | 58 & | 22 (14) | 86 | 14 | 8 |
| GP-clin + rad, N = 1106 | 44 & | 71 (14) | 56 & | 23 (15) | |||
| SP-clin, N = 1264 | 39 $ | 69 (12) | 61 $ | 22 (13) | 82 | 18 | 9 |
| SP-clin + rad, N = 1264 | 49 $ | 75 (16) | 51 $ | 22 (15) |
| Final Diagnosis | Sensitivity (95%CI) | Specificity (95%CI) | PPV (95%CI) | NPV (95%CI) | Accuracy (95%CI) | LR+ (95%CI) | LR− (95%CI) | ||||
|---|---|---|---|---|---|---|---|---|---|---|---|
| OA * | No A * | Uncertain *,† | |||||||||
| GP-clin (N = 1106) | OA | 29 | 6 | 7 | 0.76 (0.72–0.80) | 0.86 (0.82–0.89) | 0.68 (0.64–0.73) | 0.66 (0.62–0.69) | 0.67 (0.63–0.71) | 5.23 (4.24–6.63) | 0.28 (0.24–0.33) |
| No OA | 9 | 38 | 11 | ||||||||
| GP-clin + rad (N = 1106) | OA | 34 | 3 | 6 | 0.89 (0.86–0.92) | 0.92 (0.90–0.95) | 0.78 (0.74–0.82) | 0.72 (0.68–0.75) | 0.75 (0.71–0.78) | 11.75 (8.60–16.04) | 0.12 (0.09–0.16) |
| No OA | 4 | 41 | 12 | ||||||||
| SP-clin (N = 1264) | OA | 26 | 6 | 7 | 0.73 (0.69–0.77) | 0.88 (0.84–0.90) | 0.67 (0.62–0.71) | 0.66 (0.62–0.69) | 0.66 (0.62–0.70) | 5.86 (4.68–7.32) | 0.31 (0.26–0.36) |
| No OA | 10 | 40 | 11 | ||||||||
| SP-clin + rad (N = 1264) | OA | 33 | 4 | 12 | 0.93 (0.90–0.95) | 0.92 (0.90–0.94) | 0.69 (0.65–0.72) | 0.82 (0.78–0.85) | 0.75 (0.71–0.78) | 11.84 (8.94–15.70) | 0.08 (0.06–0.11) |
| No OA | 3 | 42 | 6 | ||||||||
| Clin+ Rad Clin | OA | No OA | Consistent Diagnoses * | Amended Diagnoses | Correctly Amended # | ||
| Clinically ‘certain’ knees | GP (N = 658) | OA | 28 | 2 | 93 | 7 | 5 |
| no OA | 5 | 65 | |||||
| SP (N = 811) | OA | 27 | 2 | 86 | 14 | 5 | |
| no OA | 12 | 59 | |||||
| Clinically ‘uncertain’ knees | GP (N = 448) | OA | 48 | 13 | 77 | 23 | 13 |
| no OA | 10 | 29 | |||||
| SP (N = 453) | OA | 49 | 9 | 73 | 27 | 16 | |
| no OA | 18 | 24 |
| Final Diagnosis | ||||||||||||
|---|---|---|---|---|---|---|---|---|---|---|---|---|
| OA * | No OA * | Uncertain *,† | Sensitivity (95%CI) | Specificity (95%CI) | PPV (95%CI) | NPV (95%CI) | Accuracy (95%CI) | LR+ (95%CI) | LR− (95%CI) | |||
| Clinically ‘certain’ knees | GP-clin (N = 658) | OA | 24 | 2 | 3 | 0.71 (0.65–0.77) | 0.95 (0.92–0.97) | 0.82 (0.76–0.87) | 0.71 (0.67–0.75) | 0.74 (0.71–0.81) | 15.39 (9.47–25.02) | 0.30 (0.25–0.37) |
| No OA | 10 | 50 | 11 | |||||||||
| GP-clin + rad (N = 658) | OA | 28 | 1 | 4 | 0.82 (0.77–0.87) | 0.97 (0.95–0.99) | 0.84 (0.78–0.88) | 0.77 (0.72–0.80) | 0.79 (0.75–0.84) | 31.69 (16.58–60.56) | 0.18 (0.14–0.24) | |
| No OA | 6 | 51 | 10 | |||||||||
| SP-clin (N = 811) | OA | 23 | 3 | 4 | 0.74 (0.68–0.79) | 0.95 (0.93–0.97) | 0.78 (0.72–0.83) | 0.74 (0.70–0.77) | 0.75 (0.71–0.80) | 14.98 (9.90–22.67) | 0.28 (0.22–0.34) | |
| No OA | 8 | 52 | 10 | |||||||||
| SP-clin + rad (N = 811) | OA | 27 | 2 | 9 | 0.90 (0.85–0.93) | 0.96 (0.93–0.97) | 0.71 (0.66–0.76) | 0.86 (0.82–0.89) | 0.80 (0.74–0.84) | 21.02 (13.51–32.71) | 0.11 (0.08–0.16) | |
| No OA | 3 | 53 | 6 | |||||||||
| Clinically ‘uncertain’ knees | GP-clin (N = 448) | OA | 36 | 11 | 13 | 0.81 (0.75–0.86) | 0.62 (0.53–0.70) | 0.59 (0.53–0.65) | 0.51 (0.43–0.58) | 0.56 (0.48–0.62) | 2.14 (1.72–2.67) | 0.30 (0.22–0.40) |
| No OA | 9 | 20 | 11 | |||||||||
| GP-clin + rad (N = 448) | OA | 43 | 6 | 9 | 0.97 (0.93–0.98) | 0.80 (0.73–0.86) | 0.73 (0.67–0.78) | 0.61 (0.54–0.68) | 0.68 (0.60–0.73) | 4.89 (3.51–6.83) | 0.04 (0.02–0.09) | |
| No OA | 2 | 25 | 15 | |||||||||
| SP-clin (N = 453) | OA | 33 | 11 | 14 | 0.72 (0.66–0.78) | 0.62 (0.53–0.70) | 0.57 (0.50–0.63) | 0.42 (0.35–0.49) | 0.51 (0.42–0.56) | 1.88 (1.49–2.37) | 0.45 (0.36–0.57) | |
| No OA | 13 | 18 | 11 | |||||||||
| SP-clin + rad (N = 453) | OA | 44 | 6 | 17 | 0.96 (0.92–0.98) | 0.80 (0.72–0.86) | 0.66 (0.60–0.71) | 0.68 (0.60–0.76) | 0.67 (0.60–0.73) | 4.81 (3.40–6.79) | 0.05 (0.02–0.10) | |
| No OA | 2 | 23 | 8 | |||||||||
Publisher’s Note: MDPI stays neutral with regard to jurisdictional claims in published maps and institutional affiliations. |
© 2020 by the authors. Licensee MDPI, Basel, Switzerland. This article is an open access article distributed under the terms and conditions of the Creative Commons Attribution (CC BY) license (http://creativecommons.org/licenses/by/4.0/).
Share and Cite
Wang, Q.; Runhaar, J.; Kloppenburg, M.; Boers, M.; Bijlsma, J.W.J.; Bierma-Zeinstra, S.M.A.; The CREDO Expert Group. The Added Value of Radiographs in Diagnosing Knee Osteoarthritis Is Similar for General Practitioners and Secondary Care Physicians; Data from the CHECK Early Osteoarthritis Cohort. J. Clin. Med. 2020, 9, 3374. https://doi.org/10.3390/jcm9103374
Wang Q, Runhaar J, Kloppenburg M, Boers M, Bijlsma JWJ, Bierma-Zeinstra SMA, The CREDO Expert Group. The Added Value of Radiographs in Diagnosing Knee Osteoarthritis Is Similar for General Practitioners and Secondary Care Physicians; Data from the CHECK Early Osteoarthritis Cohort. Journal of Clinical Medicine. 2020; 9(10):3374. https://doi.org/10.3390/jcm9103374
Chicago/Turabian StyleWang, Qiuke, Jos Runhaar, Margreet Kloppenburg, Maarten Boers, Johannes W. J. Bijlsma, Sita M. A. Bierma-Zeinstra, and The CREDO Expert Group. 2020. "The Added Value of Radiographs in Diagnosing Knee Osteoarthritis Is Similar for General Practitioners and Secondary Care Physicians; Data from the CHECK Early Osteoarthritis Cohort" Journal of Clinical Medicine 9, no. 10: 3374. https://doi.org/10.3390/jcm9103374
APA StyleWang, Q., Runhaar, J., Kloppenburg, M., Boers, M., Bijlsma, J. W. J., Bierma-Zeinstra, S. M. A., & The CREDO Expert Group. (2020). The Added Value of Radiographs in Diagnosing Knee Osteoarthritis Is Similar for General Practitioners and Secondary Care Physicians; Data from the CHECK Early Osteoarthritis Cohort. Journal of Clinical Medicine, 9(10), 3374. https://doi.org/10.3390/jcm9103374