Correlation between Choriocapillaris Density and Retinal Sensitivity in Stargardt Disease


 ,
,  , and
, and 
Abstract
1. Introduction
2. Methods
2.1. Study Participants
2.2. Imaging
2.2.1. OCT and OCTA Imaging
2.2.2. Microperimetry
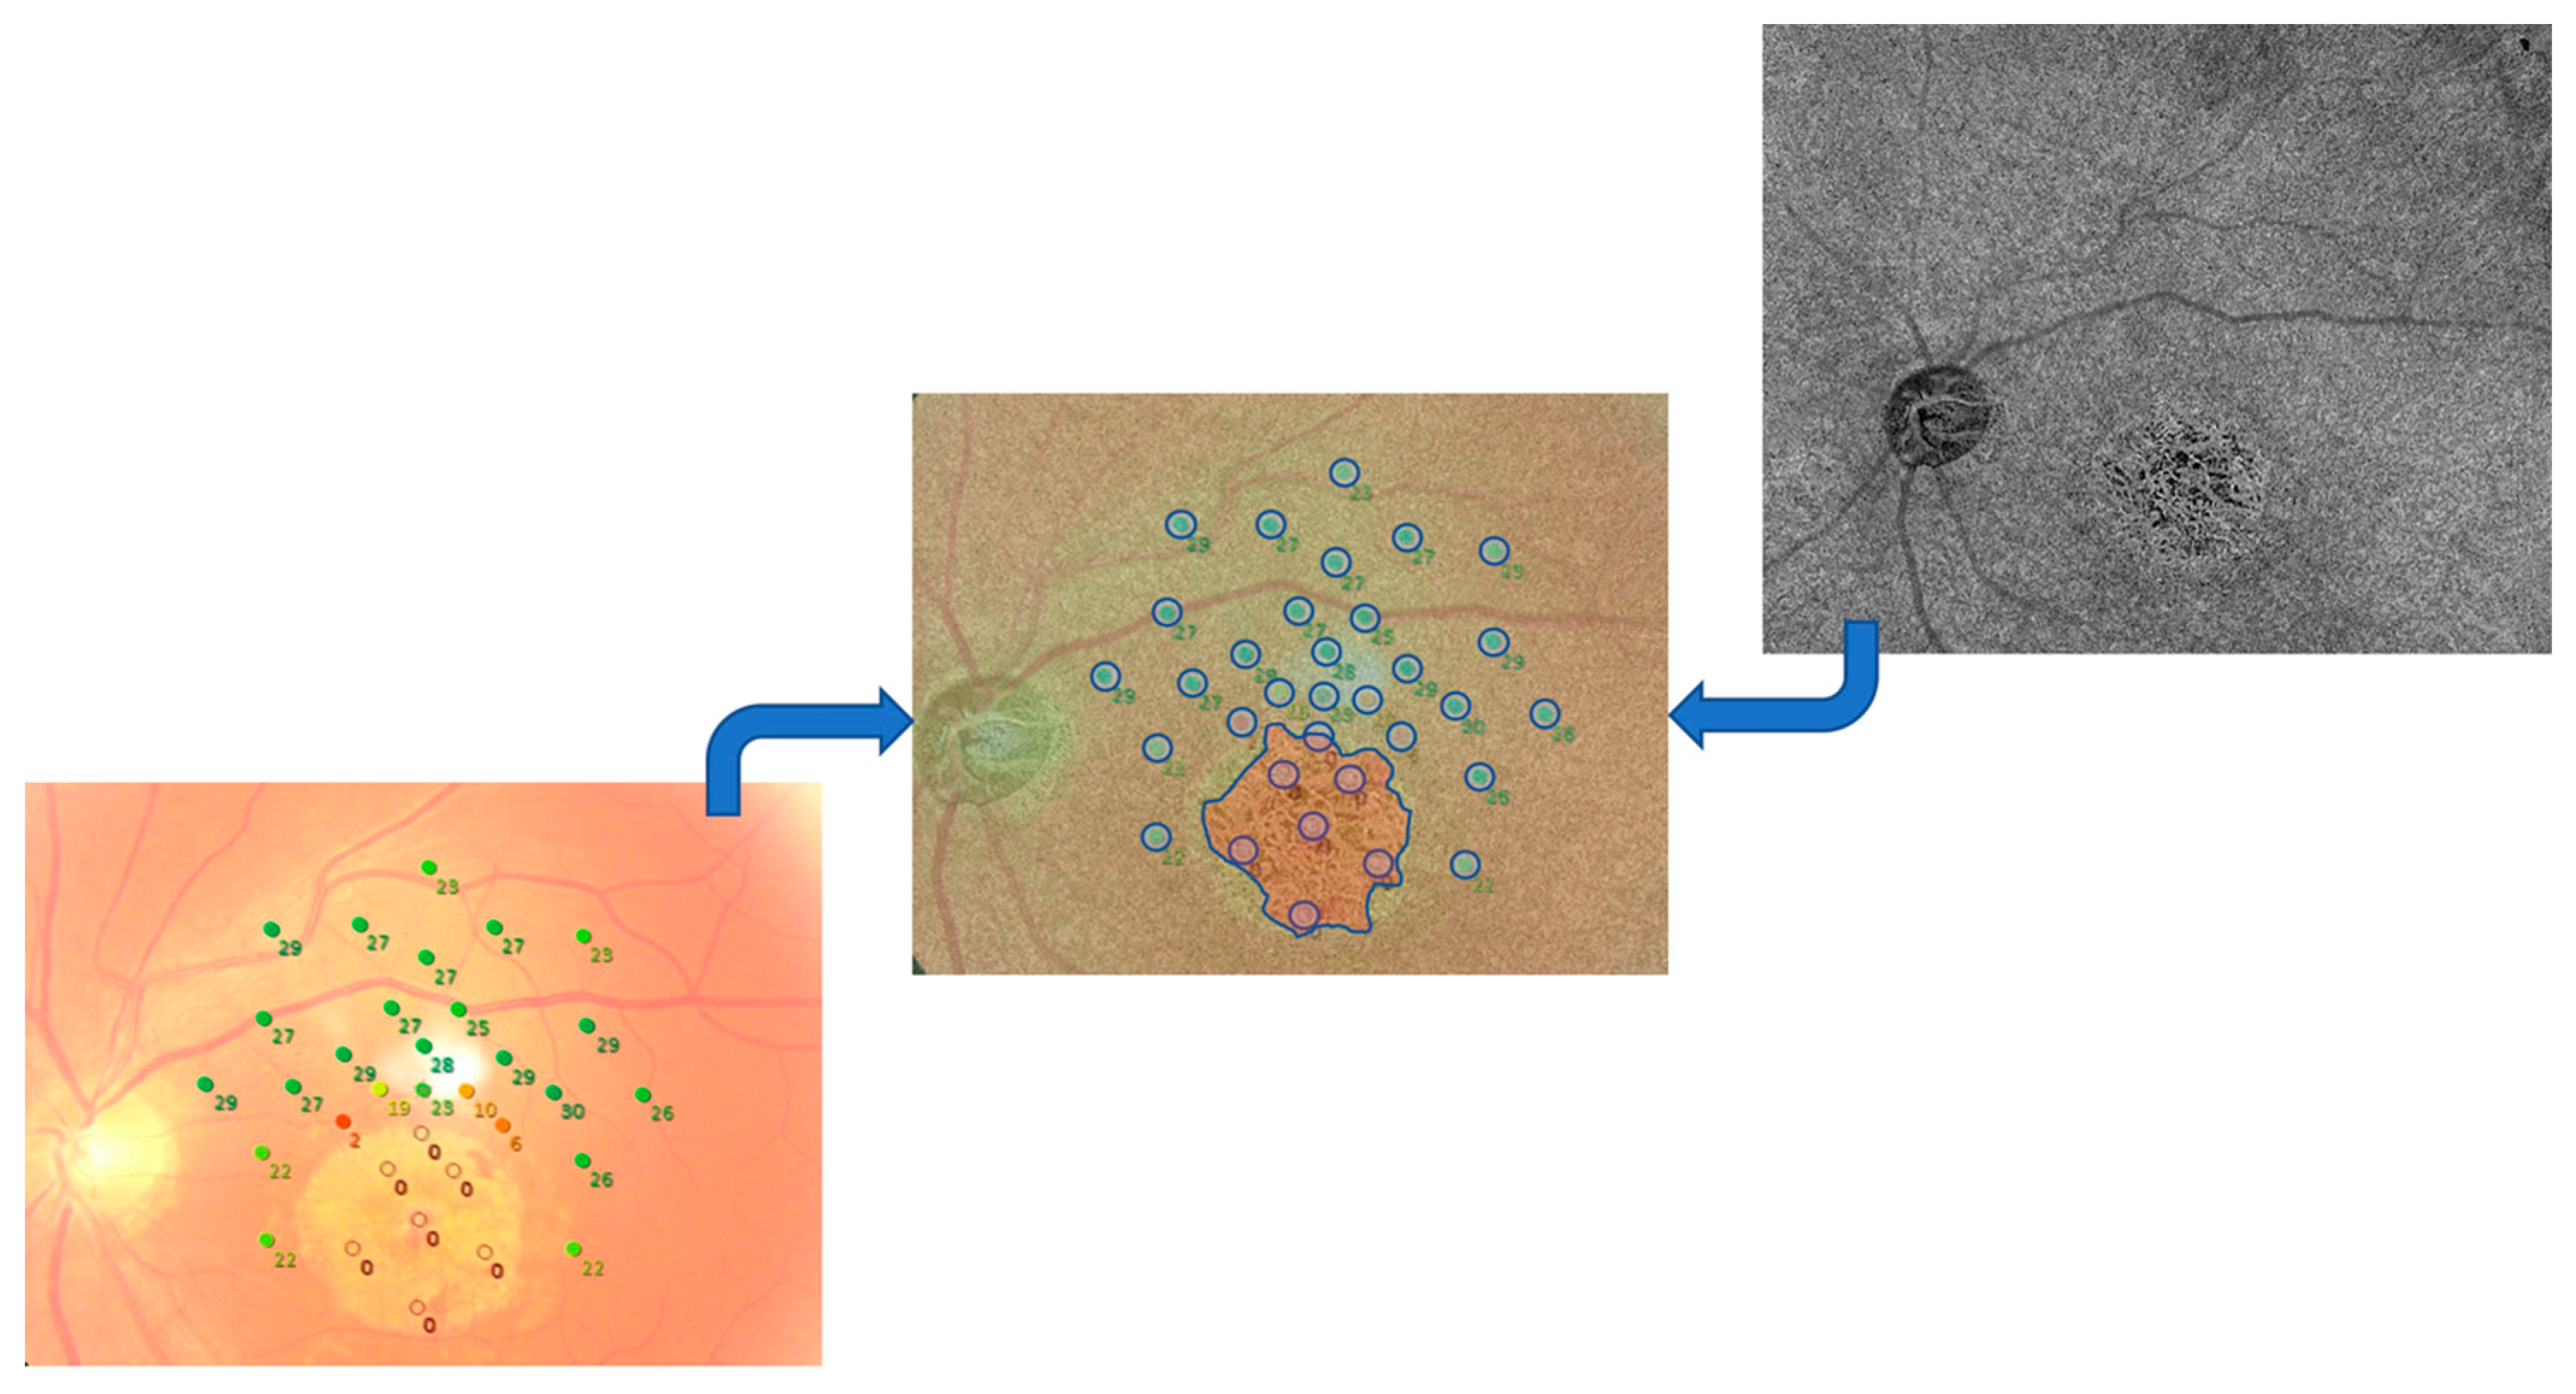
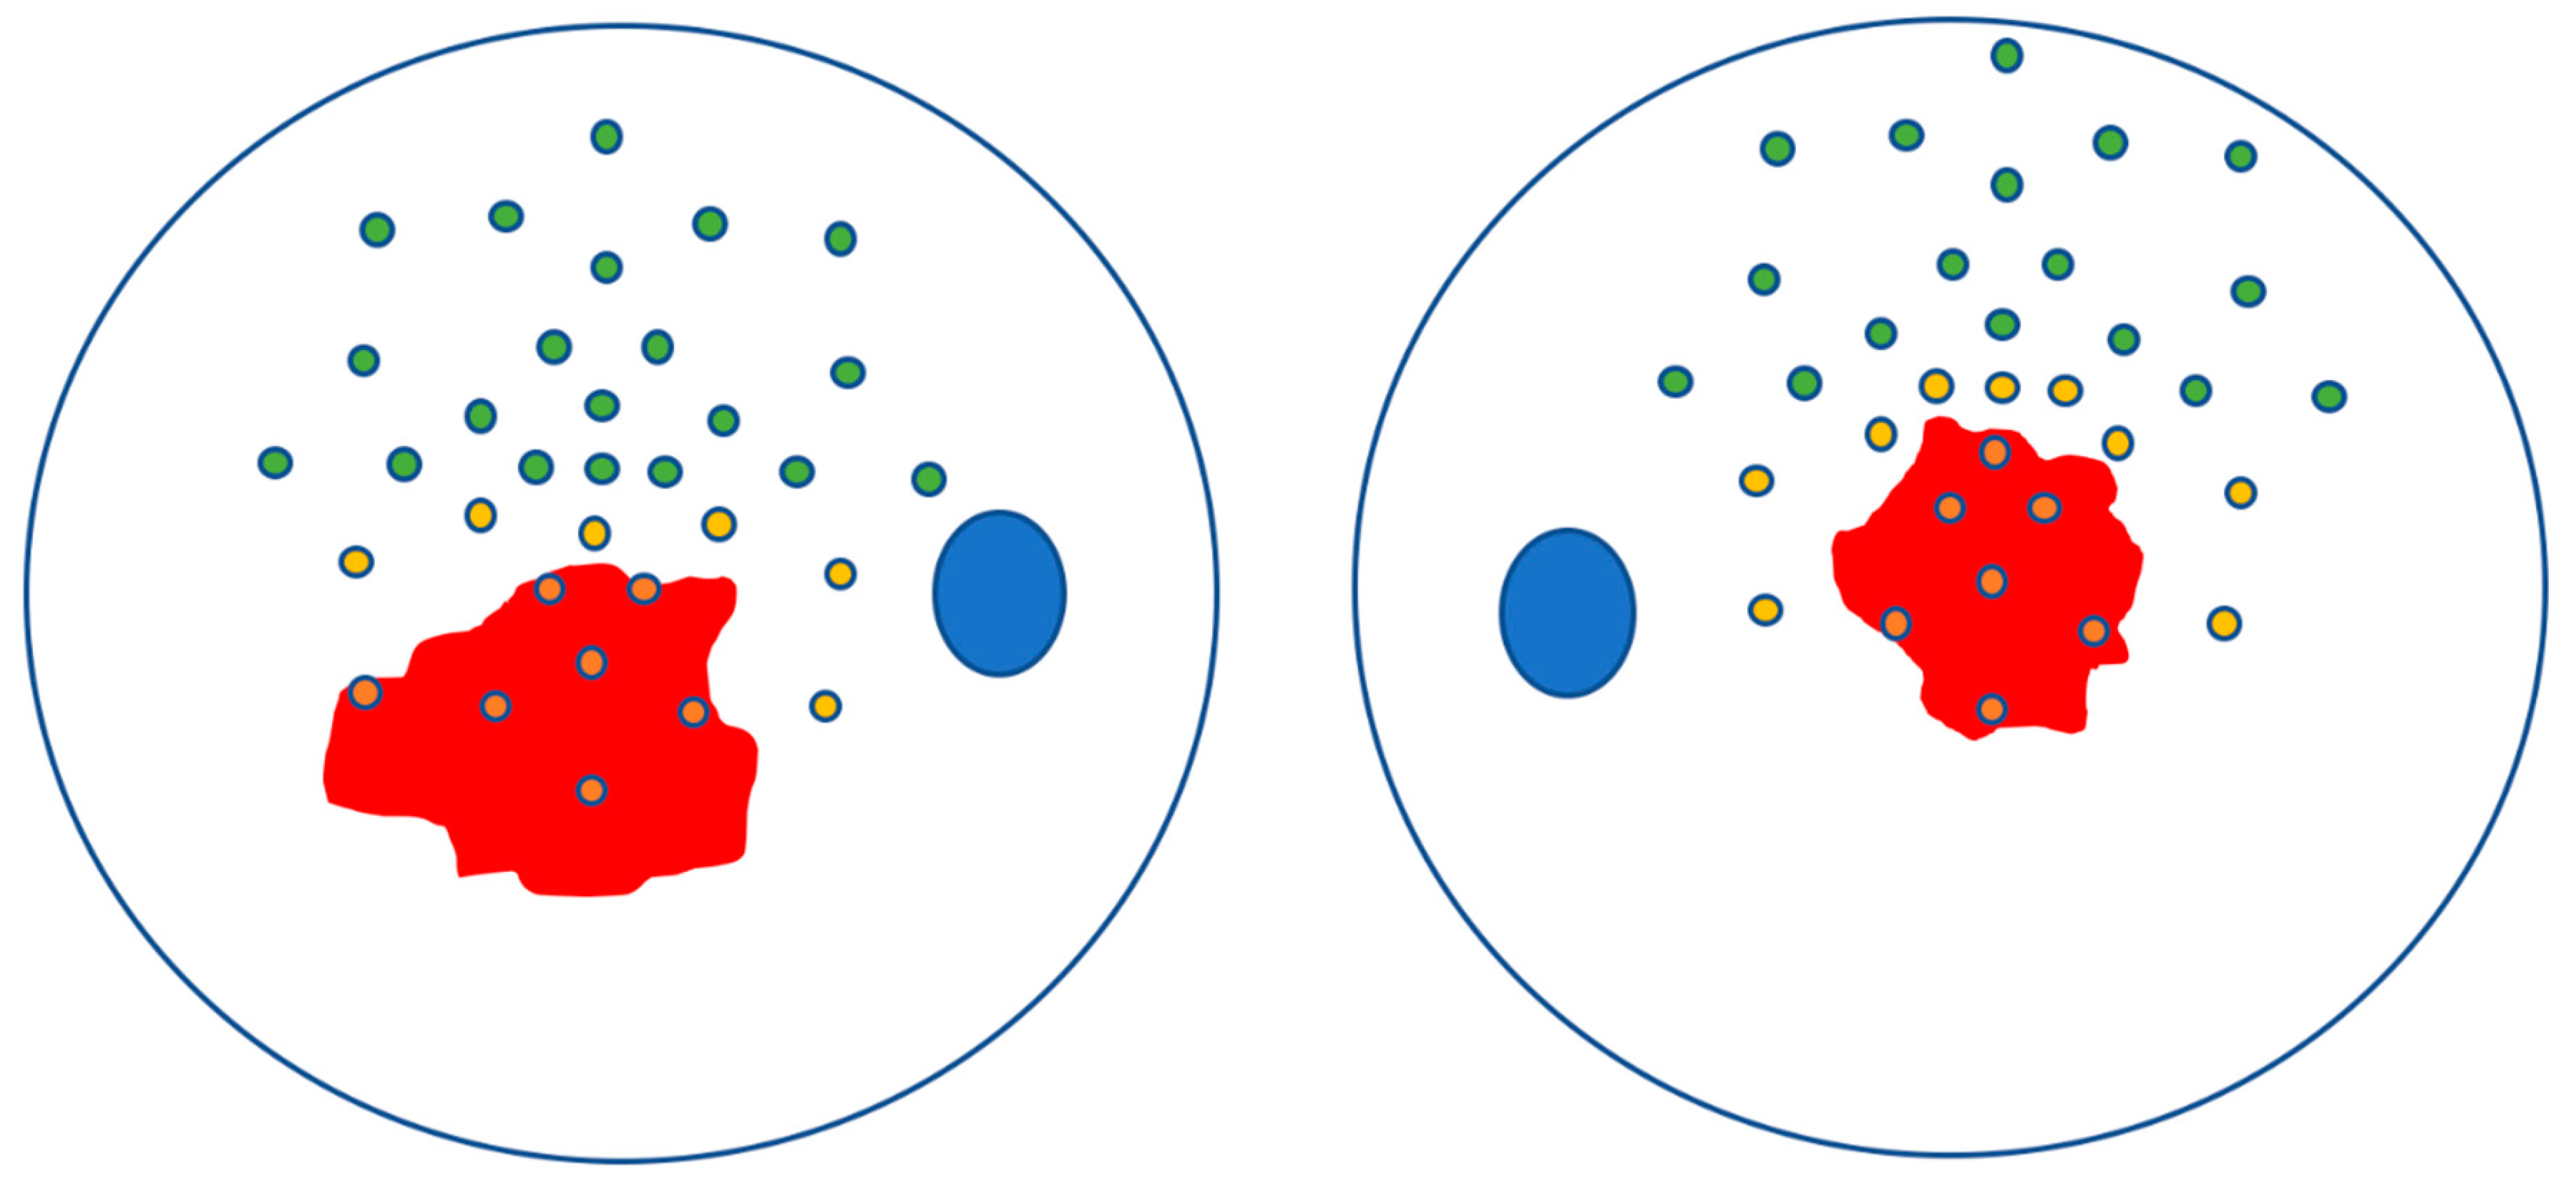
2.3. Image Processing
2.4. Statistical Analysis
3. Results
3.1. Characteristics of Patients Included in the Analysis
3.2. Analysis of CC Density and Retinal Sensitivity
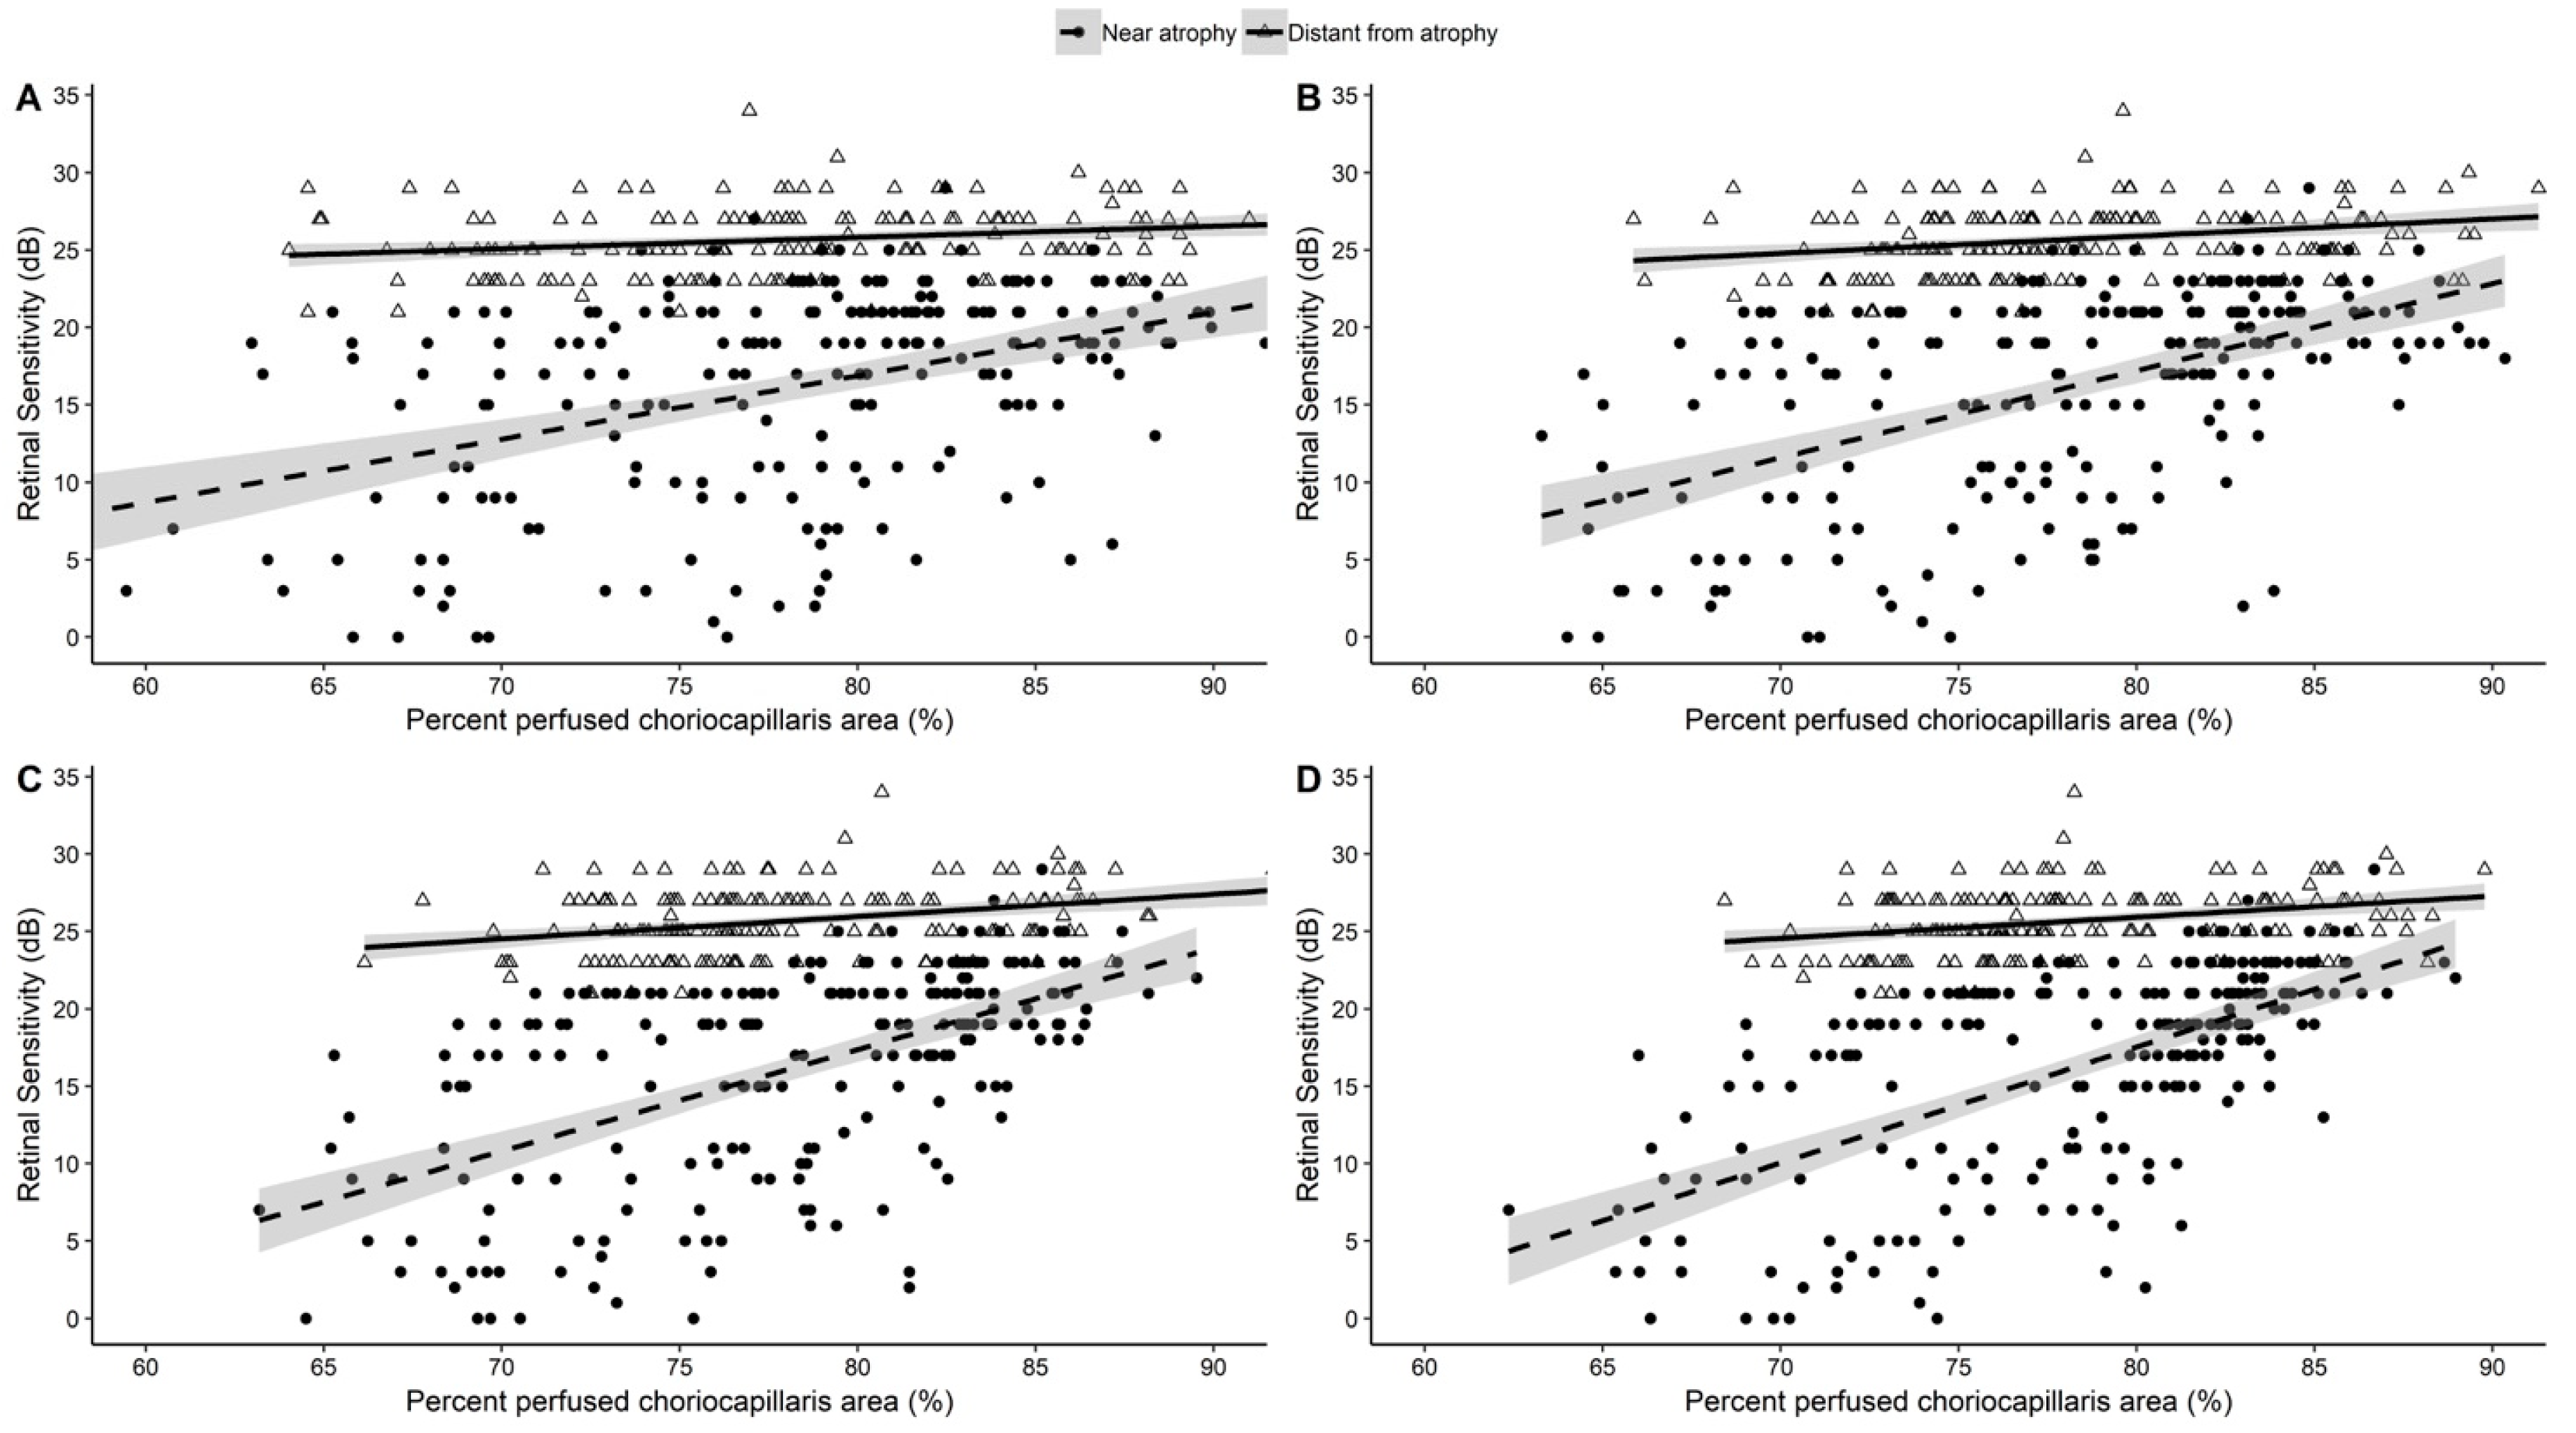
3.3. Correlation between CC Density and Retinal Sensitivity
4. Discussion
Author Contributions
Funding
Conflicts of Interest
References
- Tanna, P.; Strauss, R.W.; Fujinami, K.; Michaelides, M. Stargardt disease: Clinical features, molecular genetics, animal models and therapeutic options. Br. J. Ophthalmol. 2017, 101, 25–30. [Google Scholar] [CrossRef] [PubMed]
- Cideciyan, A.V.; Aleman, T.S.; Swider, M.; Schwartz, S.B.; Steinberg, J.D.; Brucker, A.J.; Maguire, A.M.; Bennett, J.; Stone, E.M.; Jacobson, S.G. Mutations in ABCA4 result in accumulation of lipofuscin before slowing of the retinoid cycle: A reappraisal of the human disease sequence. Hum. Mol. Genet. 2004, 13, 525–534. [Google Scholar] [CrossRef] [PubMed]
- Anderson, D.M.G.; Ablonczy, Z.; Koutalos, Y.; Hanneken, A.M.; Spraggins, J.M.; Calcutt, M.W.; Crouch, R.K.; Caprioli, R.M.; Schey, K.L. Bis(monoacylglycero)phosphate lipids in the retinal pigment epithelium implicate lysosomal/endosomal dysfunction in a model of Stargardt disease and human retinas. Sci. Rep. 2017, 7, 17352. [Google Scholar] [CrossRef] [PubMed]
- Mastropasqua RToto, L.; Borrelli, E.; Di Antonio, L.; Mattei, P.A.; Senatore, A.; Di Nicola, M.; Mariotti, C. Optical coherence tomography angiography findings in stargardt disease. PLoS ONE 2017, 12, e0170343. [Google Scholar] [CrossRef] [PubMed]
- Gomes, N.L.; Greenstein, V.C.; Carlson, J.N.; Tsang, S.H.; Smith, R.T.; Carr, R.E.; Hood, D.C.; Chang, S. A Comparison of Fundus Autofluorescence and Retinal Structure in Patients with Stargardt Disease. Investig. Opthalmol. Vis. Sci. 2009, 50, 3953–3959. [Google Scholar] [CrossRef] [PubMed]
- Smith, R.T.; Gomes, N.L.; Barile, G.; Busuioc, M.; Lee, N.; Laine, A. Lipofuscin and autofluorescence metrics in progressive STGD. Investig. Ophthalmol. Vis. Sci. 2009, 50, 3907–3914. [Google Scholar] [CrossRef] [PubMed]
- Adhi, M.; Read, S.P.; Ferrara, D.; Weber, M.; Duker, J.S.; Waheed, N.K. Morphology and Vascular Layers of the Choroid in Stargardt Disease Analyzed Using Spectral-Domain Optical Coherence Tomography. Am. J. Ophthalmol. 2015, 160, 1276–1284. [Google Scholar] [CrossRef] [PubMed]
- Giani, A.; Pellegrini, M.; Carini, E.; Deiro, A.P.; Bottoni, F.; Staurenghi, G. The Dark Atrophy with Indocyanine Green Angiography in Stargardt Disease. Investig. Opthalmol. Vis. Sci. 2012, 53, 3999–4004. [Google Scholar] [CrossRef] [PubMed]
- Blaauwgeers, H.G.T.; Holtkamp, G.M.; Rutten, H.; Witmer, A.N.; Koolwijk, P.; Partanen, T.A.; Alitalo, K.; Kroon, M.E.; Kijlstra, A.; Van Hinsbergh, V.W.M.; et al. Polarized vascular endothelial growth factor secretion by human retinal pigment epithelium and localization of vascular endothelial growth factor receptors on the inner choriocapillaris. Evidence for a trophic paracrine relation. Am. J. Pathol. 1999, 155, 421–428. [Google Scholar] [CrossRef]
- Nunes, R.P.; Rosa, P.R.; Giani, A.; Goldhardt, R.; Thomas, B.; Filho, C.A.G.; Gregori, G.; Feuer, W.; Lam, B.L.; Staurenghi, G.; et al. Choroidal Thickness in Eyes With Central Geographic Atrophy Secondary to Stargardt Disease and Age-Related Macular Degeneration. Ophthalmic Surg. Lasers Imaging Retin. 2015, 46, 814–822. [Google Scholar] [CrossRef]
- Lavinsky, F.; Lavinsky, D. Novel perspectives on swept-source optical coherence tomography. Int. J. Retin. Vitr. 2016, 2, 1178. [Google Scholar] [CrossRef] [PubMed]
- Palkovits, S.; Hirnschall, N.; Georgiev, S.; Leisser, C.; Findl, O. Test-Retest Reproducibility of the Microperimeter MP3 With Fundus Image Tracking in Healthy Subjects and Patients With Macular Disease. Transl. Vis. Sci. Technol. 2018, 7, 17. [Google Scholar] [CrossRef] [PubMed]
- Borrelli, E.; Lonngi, M.; Balasubramanian, S.; Tepelus, T.C.; Baghdasaryan, E.; Iafe, N.A.; Pineles, S.L.; Velez, F.G.; Sarraf, D.; Sadda, S.R.; et al. Macular Microvascular Networks in Healthy Pediatric Subjects. Retina 2019, 39, 1216–1224. [Google Scholar] [CrossRef] [PubMed]
- Goldstein, H.; Browne, W.; Rasbash, J. Multilevel modelling of medical data. Stat. Med. 2002, 21, 3291–3315. [Google Scholar] [CrossRef] [PubMed]
- Battaglia Parodi, M.; Cicinelli, M.V.; Rabiolo, A.; Pierro, L.; Bolognesi, G.; Bandello, F. Vascular abnormalities in patients with Stargardt disease assessed with optical coherence tomography angiography. Br. J. Ophthalmol. 2017, 101, 780–785. [Google Scholar] [CrossRef] [PubMed]
- Pellegrini, M.; Acquistapace, A.; Oldani, M.; Cereda, M.G.; Giani, A.; Cozzi, M.; Staurenghi, G. Dark Atrophy: An Optical Coherence Tomography Angiography Study. Ophthalmology 2016, 123, 1879–1886. [Google Scholar] [CrossRef] [PubMed]
- Muller, P.L.; Pfau, M.; Moller, P.T.; Nadal, J.; Schmid, M.; Lindner, M.; de Sisternes, L.; Stöhr, H.; Weber, B.H.F.; Neuhaus, C.; et al. Choroidal Flow Signal in Late-Onset Stargardt Disease and Age-Related Macular Degeneration: An OCT-Angiography Study. Investig. Ophthalmol. Vis. Sci. 2018, 59, 122–131. [Google Scholar] [CrossRef] [PubMed]
- Alabduljalil, T.; Patel, R.C.; Alqahtani, A.A.; Gao, S.S.; Gale, M.J.; Zhang, M.; Jia, Y.; Huang, D.; Chiang, P.W.; Chen, R.; et al. Correlation of Outer Retinal Degeneration and Choriocapillaris Loss in Stargardt disease using en face OCT and OCT Angiography. Am. J. Ophthalmol. 2019, 202, 79–90. [Google Scholar] [CrossRef] [PubMed]
- Bernstein, A.; Sunness, J.S.; Applegate, C.A.; Tegins, E.O. Mapping the dense scotoma and its enlargement in Stargardt disease. Retina 2016, 36, 1741–1750. [Google Scholar] [CrossRef] [PubMed][Green Version]
- Guduru, A.; Lupidi, M.; Gupta, A.; Jalali, S.; Chhablani, J. Comparative analysis of autofluorescence and OCT angiography in Stargardt disease. Br. J. Ophthalmol. 2018, 102, 1204–1207. [Google Scholar] [CrossRef] [PubMed]
- De Carlo, T.E.; Adhi, M.; Salz, D.A.; Joseph, T.; Waheed, N.K.; Seddon, J.M.; Duker, J.S.; Reichel, E. Analysis of Choroidal and Retinal Vasculature in Inherited Retinal Degenerations Using Optical Coherence Tomography Angiography. Ophthalmic Surg. Lasers Imaging Retin. 2016, 47, 120–127. [Google Scholar] [CrossRef] [PubMed]
- Cideciyan, A.V.; Swider, M.; Aleman, T.S.; Feuer, W.J.; Schwartz, S.B.; Russell, R.C.; Steinberg, J.D.; Stone, E.M.; Jacobson, S.G. Macular function in macular degenerations: Repeatability of microperimetry as a potential outcome measure for ABCA4-associated retinop-athy trials. Investig. Ophthalmol. Vis. Sci. 2012, 53, 841–852. [Google Scholar] [CrossRef] [PubMed]
- Schönbach, E.M.; Wolfson, Y.; Strauss, R.W.; Ibrahim, M.A.; Kong, X.; Muñoz, B.; Birch, D.G.; Cideciyan, A.V.; Hahn, G.-A.; Nittala, M.; et al. Macular Sensitivity Measured With Microperimetry in Stargardt Disease in the Progression of Atrophy Secondary to Stargardt Disease (ProgStar) Study: Report No. 7. JAMA Ophthalmol. 2017, 135, 696–703. [Google Scholar] [CrossRef] [PubMed]
- Tanna, P.; Georgiou, M.; Aboshiha, J.; Strauss, R.W.; Kumaran, N.; Kalitzeos, A.; Weleber, R.G.; Michaelides, M. Cross-Sectional and Longitudinal Assessment of Retinal Sensitivity in Patients with Childhood-Onset Stargardt Disease. Transl. Vis. Sci. Technol. 2018, 7, 10. [Google Scholar] [CrossRef] [PubMed]
- Lane, M.; Moult, E.M.; Novais, E.A.; Louzada, R.N.; Cole, E.D.; Lee, B.; Husvogt, L.; Keane, P.A.; Denniston, A.K.; Witkin, A.J.; et al. Visualizing the Choriocapillaris Under Drusen: Comparing 1050-nm Swept-Source Versus 840-nm Spectral-Domain Optical Coherence Tomography Angiography. Investig. Ophthalmol. Vis. Sci. 2016, 57, OCT585–OCT90. [Google Scholar] [CrossRef] [PubMed]


| Patient | Sex | Age | VA | Fundoscopy | SD-OCT Features | CMT (µm) | Genotype (ABCA4 Mutations) |
|---|---|---|---|---|---|---|---|
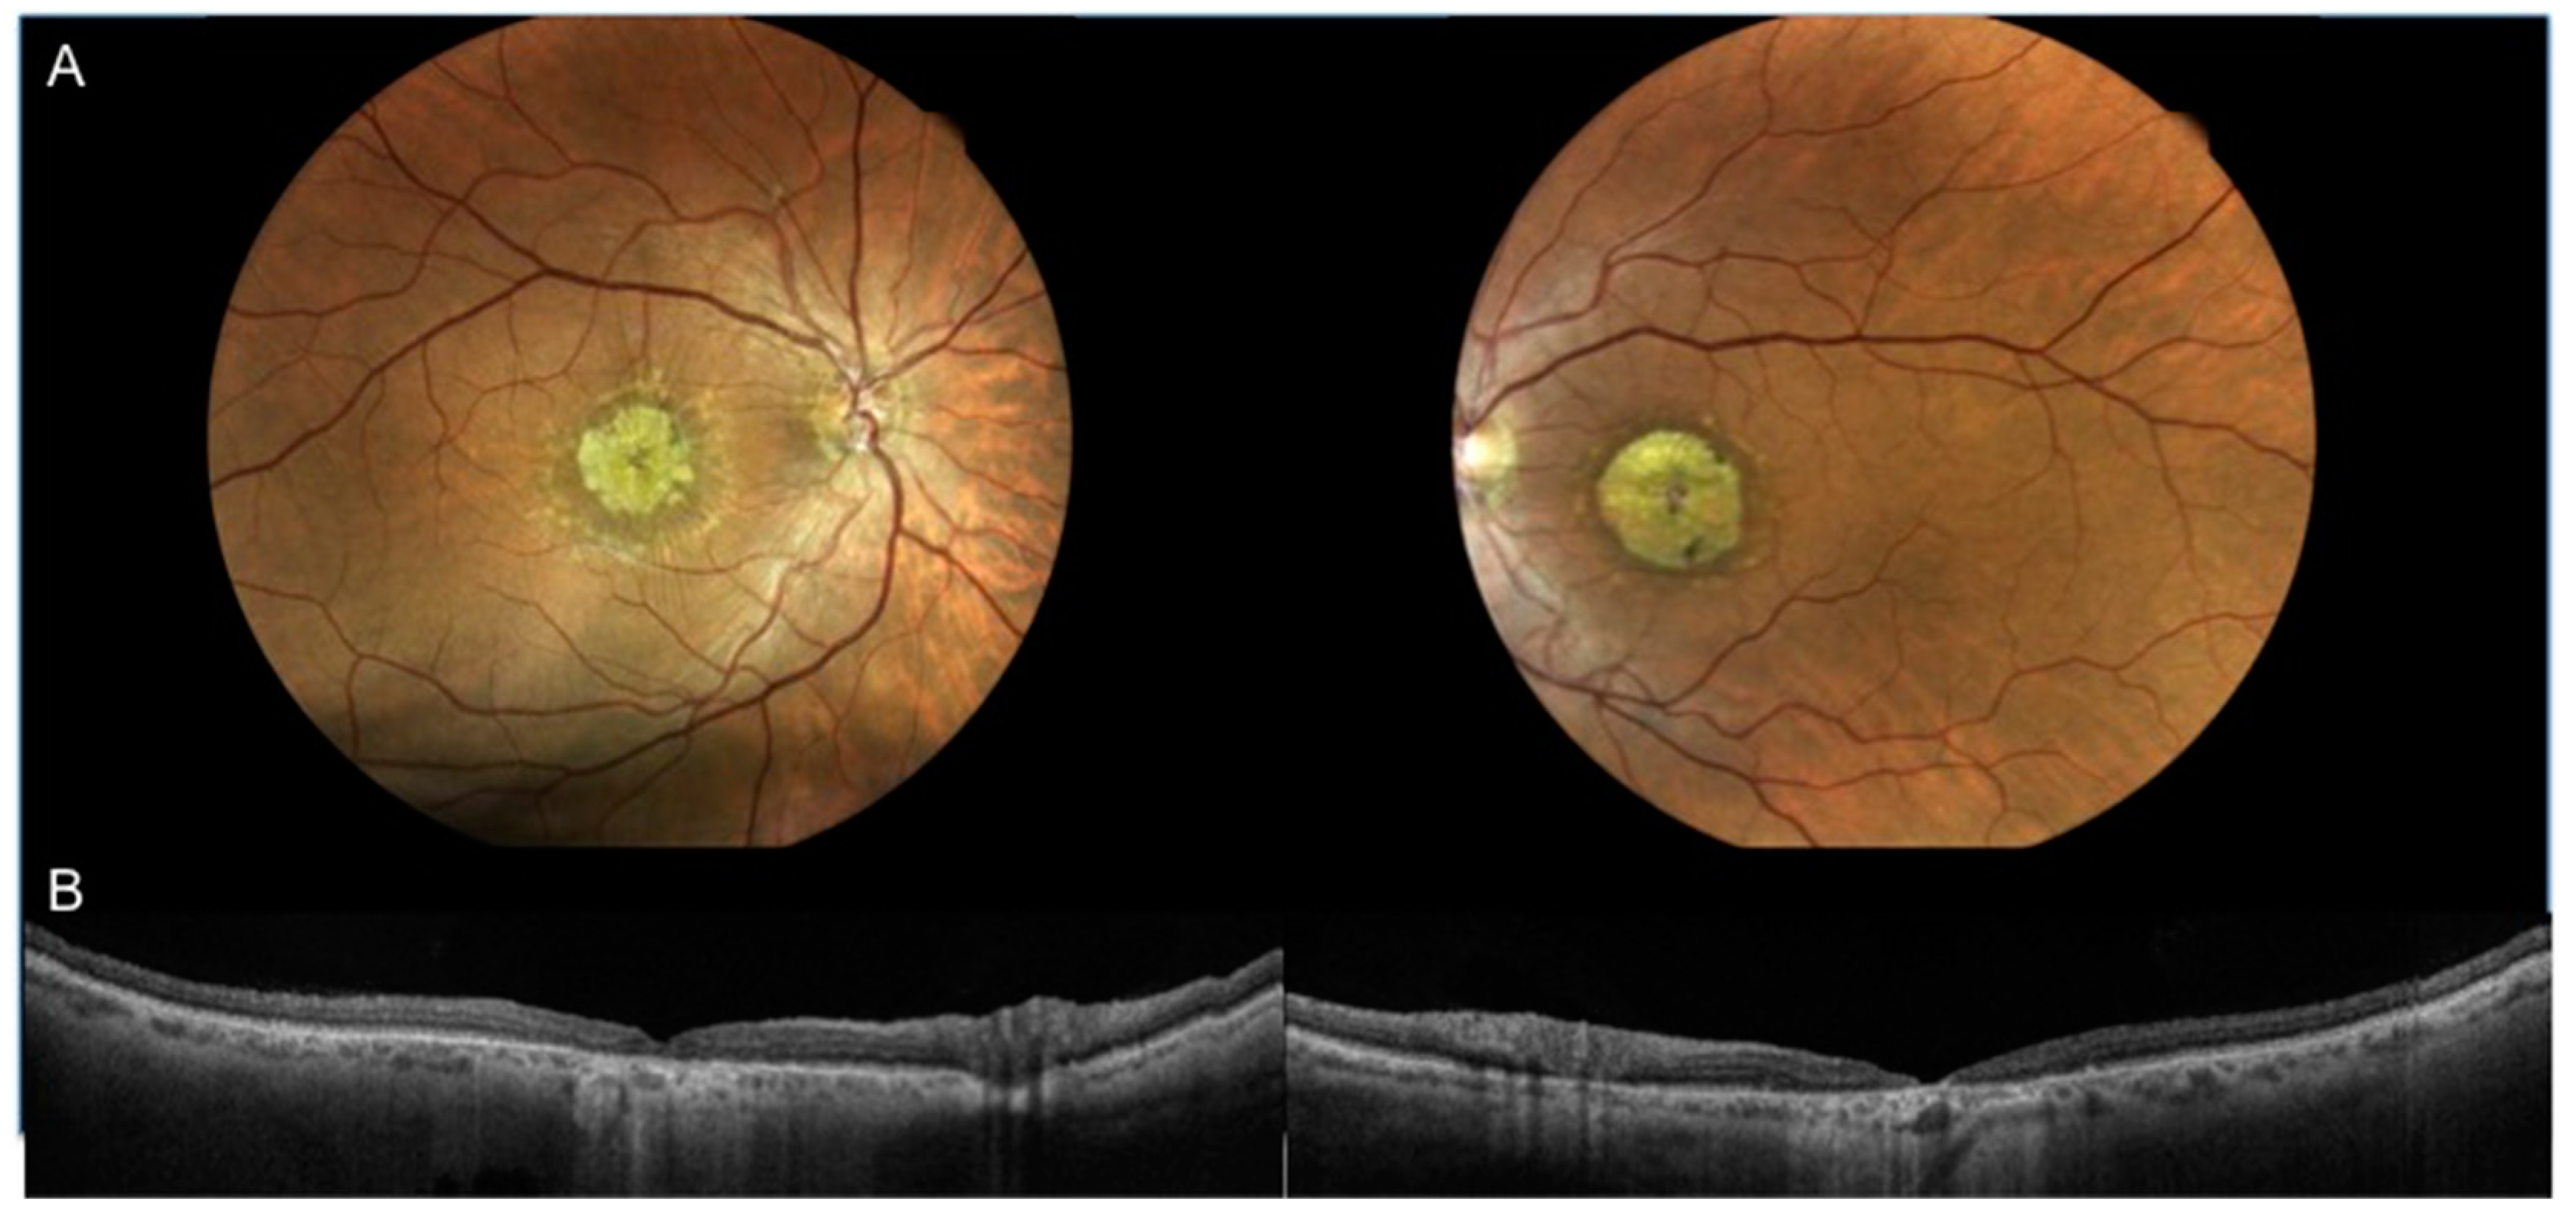
| Case 1 | Female | 54 years | OD: 1.0 | OU: Macular atrophy, flecks | OU: inner and outer retinal layer thinning/loss, ELM defect, ISe band defect, thinner RPE/ Bruchs complex, hyperreflective material located at the RPE level | OD 33 | c.5882G > A p.(Gly1961Glu) |
| OS: 1.0 | OS 31 | c.6089G > A p.(Arg2030Gln) | |||||
| Case 2 * | Male | 59 years | OD: l.2 | OU: Macular atrophy, flecks | OU: inner and outer retinal layer thinning/loss, ELM defect, ISe band defect, thinner RPE/ Bruchs complex, hyperreflective material located at the RPE level | OD 70 | c.4352+1A > G NA |
| OS: 1.2 | OS 65 | c.5882G > A p.Gly1961Glu | |||||
| Case 3 * | Male | 56 years | OD: 0.8 | OU: Macular atrophy flecks | OU: ELM defect, ISe band defect, photoreceptor outer segments defects,thinner RPE/ Bruchs complex, yperreflective material located at the RPE level | OD 120 | c.4352 + 1A > G NA |
| OS: 0.8 | OS 125 | c.5882G > A p.Gly1961Glu | |||||
| Case 4 | Female | 55 years | OD: 1.0 | OU: Macular atrophy, flecks | OU: inner and outer retinal layer thinning/loss, ELM defect, ISe band defect, thinner RPE/ Bruchs complex, hyperreflective material located at the RPE level | OD 32 | c.6077T > C p.(Leu2026Pro) |
| OS: 1.0 | OS 45 | c.4352þ1G > A p.(Ser1418_Pro1451delinsArg) | |||||
| Case 5 | Female | 57 years | OD: 0.9 | OU: Macular atrophy, flecks | OU: inner and outer retinal layer thinning/loss, ELM defect, ISe band defect, thinner RPE/ Bruchs complex, hyperreflective material located at the RPE level | OD 65 | c.5882G > A p.(Gly1961Glu) |
| OS: 1.1 | OS 20 | c.4234C > T p.(Gln1412 *) | |||||
| Case 6 | Female | 20 years | OD: 1.0 | OU: Macular atrophy, flecks | OU: ELM defect, ISe band defect, photoreceptor outer segments defects, thinner RPE/ Bruchs complex, hyperreflective material located at the RPE level | OD 78 | c.6112C > T p.(Arg2038Trp) |
| OS: 1.0 | OS 72 | c.4462T > C p.(Cys1488Arg) | |||||
| Case 7 | Female | 63 years | OD: 0.9 | OU: Macular atrophy, flecks | OD: ELM defect, ISe band defect, photoreceptor outer segments defects, thinner RPE/ Bruchs complex, hyperreflective material located at the RPE level | OD 85 | c.206G > A p.(Trp69 *) |
| OS: NA | OS: NA | OS: NA | c.3113C > T p. (Ala1038Val) | ||||
| Case 8 | Male | 47 years | OD: 1.2 | OU: Macular atrophy | OU: inner and outer retinal layer thinning/loss, ELM defect, ISe band defect, thinner RPE/ Bruchs complex | OD 52 | c.3322C>T p.(Arg1108Cys) |
| OS: 1.2 | OS 69 | c.6112C>T p.(Arg2038Trp) | |||||
| Case 9 | Male | 23 years | OD: 1.1 | OU: Macular atrophy, flecks | OU: ELM defect, ISe band defect, photoreceptor outer segments defects,thinner RPE/ Bruchs complex, hyperreflective material located at the RPE level | OD 43 | c.1622T>C p.(Leu541Pro) |
| OS: 1.1 | OS 59 | c.6437G>A p.(Gly2146Asp) |
| Mean Differences ± SD | |||
|---|---|---|---|
| Variable | Near Atrophy–Central Atrophy | Distant from Atrophy–Central Atrophy | p-Value |
| PPCA (%) | |||
| Area 20 × 20 pixels | 8.3 ± 4.3 * | 12.6 ± 1.8 * | <0.001 |
| Area 40 × 40 pixels | 10.0 ± 5.5 * | 14.6 ± 3.4 * | <0.001 |
| Area 50 × 50 pixels | 10.0 ± 5.2 * | 15.0 ± 4.1 * | <0.001 |
| Area 60 × 60 pixels | 10.1 ± 4.9 * | 15.5 ± 4.1 * | <0.001 |
| Retinal Sensitivity (dB) | 14.0 ± 4.9 * | 25.7 ± 1.3 * | <0.001 |
| Area Diameters | Outside Atrophy | Near Atrophy | Distant From Atrophy | |||
|---|---|---|---|---|---|---|
| b ± SEM | p-Value | b ± SEM | p-Value | b ± SEM | p-Value | |
| 20 × 20 pixels | 0.368 ± 0.050 | <0.001 | 0.448 ±0.069 | <0.001 | 0.040 ± 0.029 | 0.159 |
| 40 × 40 pixels | 0.748 ± 0.059 | <0.001 | 0.820 ±0.075 | <0.001 | 0.122 ± 0.041 | 0.004 |
| 50 × 50 pixels | 0.932 ± 0.062 | <0.001 | 1.076 ±0.078 | <0.001 | 0.166 ± 0.044 | <0.001 |
| 60 × 60 pixels | 1.196 ± 0.061 | <0.001 | 1.502 ±0.067 | <0.001 | 0.161 ± 0.048 | 0.001 |
© 2019 by the authors. Licensee MDPI, Basel, Switzerland. This article is an open access article distributed under the terms and conditions of the Creative Commons Attribution (CC BY) license (http://creativecommons.org/licenses/by/4.0/).
Share and Cite
Mastropasqua, R.; Senatore, A.; Di Antonio, L.; Di Nicola, M.; Marchioni, M.; Perna, F.; Amore, F.; Borrelli, E.; De Nicola, C.; Carpineto, P.; et al. Correlation between Choriocapillaris Density and Retinal Sensitivity in Stargardt Disease. J. Clin. Med. 2019, 8, 1432. https://doi.org/10.3390/jcm8091432
Mastropasqua R, Senatore A, Di Antonio L, Di Nicola M, Marchioni M, Perna F, Amore F, Borrelli E, De Nicola C, Carpineto P, et al. Correlation between Choriocapillaris Density and Retinal Sensitivity in Stargardt Disease. Journal of Clinical Medicine. 2019; 8(9):1432. https://doi.org/10.3390/jcm8091432
Chicago/Turabian StyleMastropasqua, Rodolfo, Alfonso Senatore, Luca Di Antonio, Marta Di Nicola, Michele Marchioni, Fabiana Perna, Filippo Amore, Enrico Borrelli, Chiara De Nicola, Paolo Carpineto, and et al. 2019. "Correlation between Choriocapillaris Density and Retinal Sensitivity in Stargardt Disease" Journal of Clinical Medicine 8, no. 9: 1432. https://doi.org/10.3390/jcm8091432
APA StyleMastropasqua, R., Senatore, A., Di Antonio, L., Di Nicola, M., Marchioni, M., Perna, F., Amore, F., Borrelli, E., De Nicola, C., Carpineto, P., & Toto, L. (2019). Correlation between Choriocapillaris Density and Retinal Sensitivity in Stargardt Disease. Journal of Clinical Medicine, 8(9), 1432. https://doi.org/10.3390/jcm8091432