Outpatient Readmission in Rheumatology: A Machine Learning Predictive Model of Patient’s Return to the Clinic


 , ,
, ,
Abstract
:1. Introduction
2. Patients and Methods
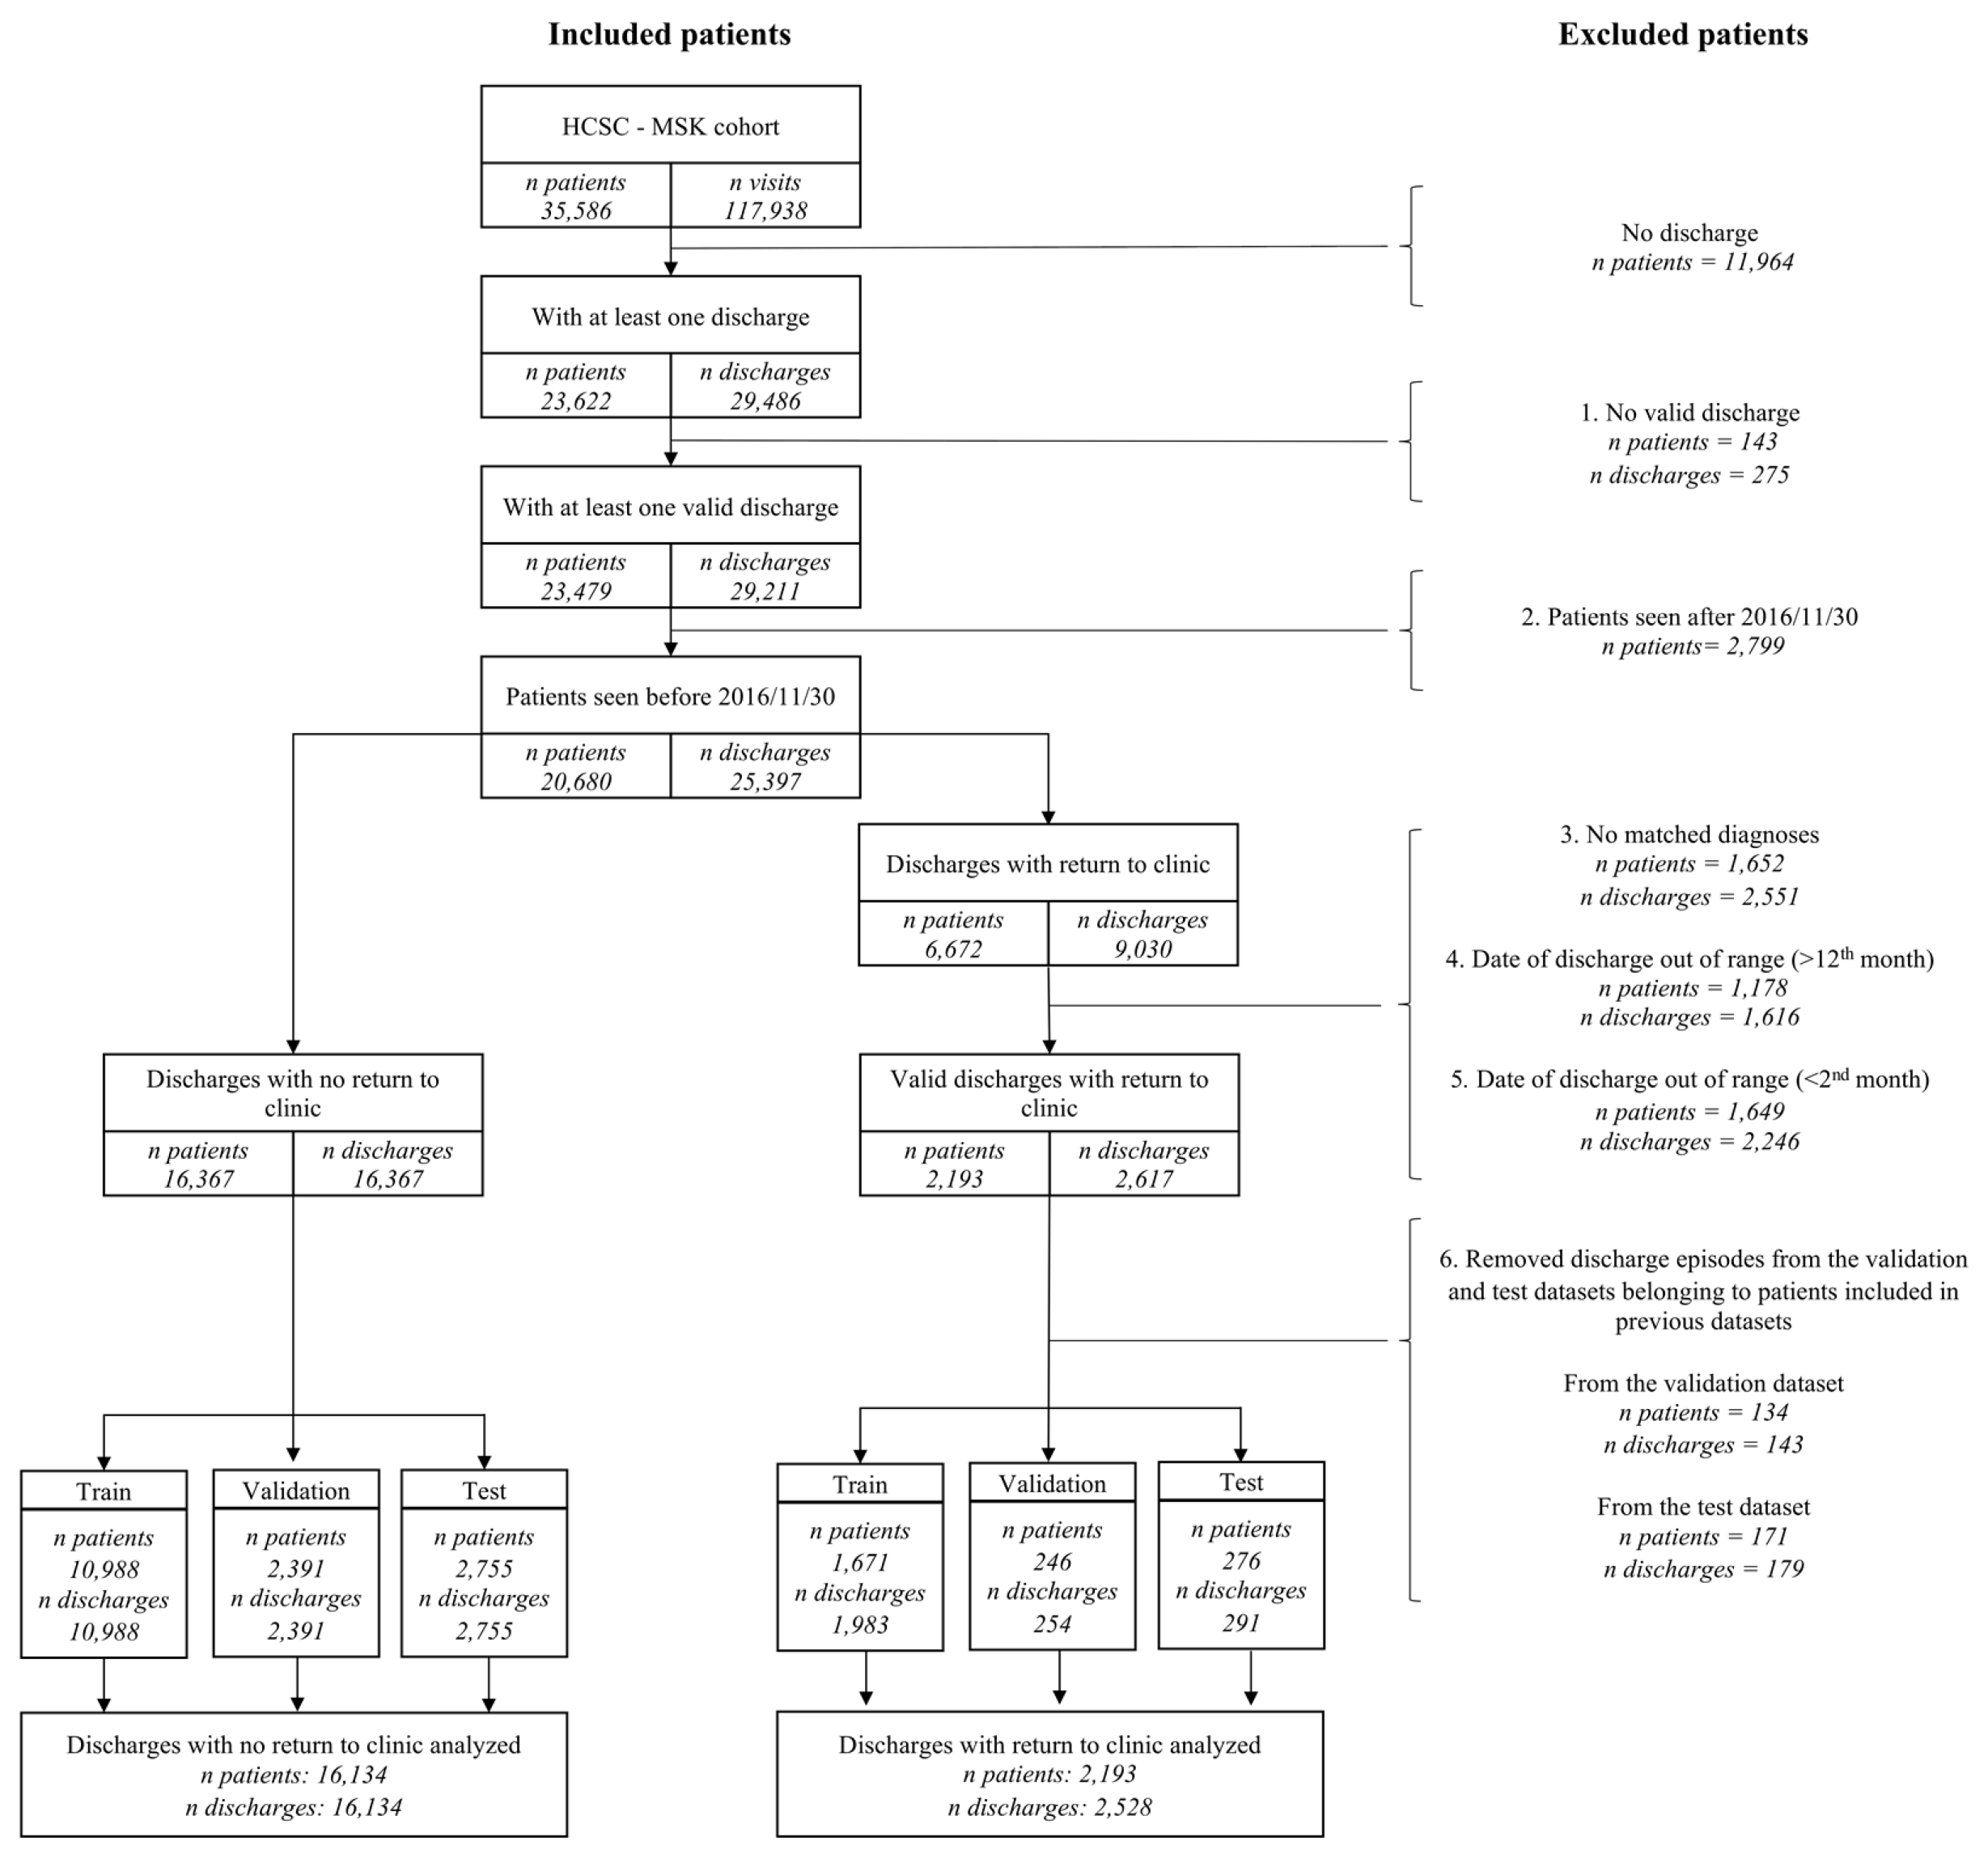
2.1. Patients
- Patients with at least one valid discharge from our outpatient clinic, meaning a “discharge status” codified as “discharge” and any “elaboration of the discharge status” that is consistent with that patient´s follow-up plan. Those possibilities include either a referral to primary care, or a scheduled telephone contact. In addition, considering that elaboration of the “discharge status” is not a mandatory variable, meaning that it can be left blank during the contact with the patient, we also considered this situation as compatible with a valid discharge, understood as the physician discharged the patient from our outpatient clinic and did not make any further specifications.
- Those discharges followed by a time window of at least 12 months.
- For those discharges followed by an outpatient readmission, there had to be at least one diagnosis shared between the discharge and the readmission visits, meaning the presence of diagnostic ICD9/ICD10 codes associated with the same disease or related group of diseases in both visits. Therefore, the patient did not need to have the same specific code in both visits, but he/she can have two different codes associated with the same disease (list of diseases/groups of diseases can be found in Supplementary Excel File Categories, Diagnoses 2nd categorization sheet. More detailed description regarding grouping of diseases can be found in the next section).
- For those discharges followed by an outpatient readmission, that visit had to take place in the first 12 months after discharge.
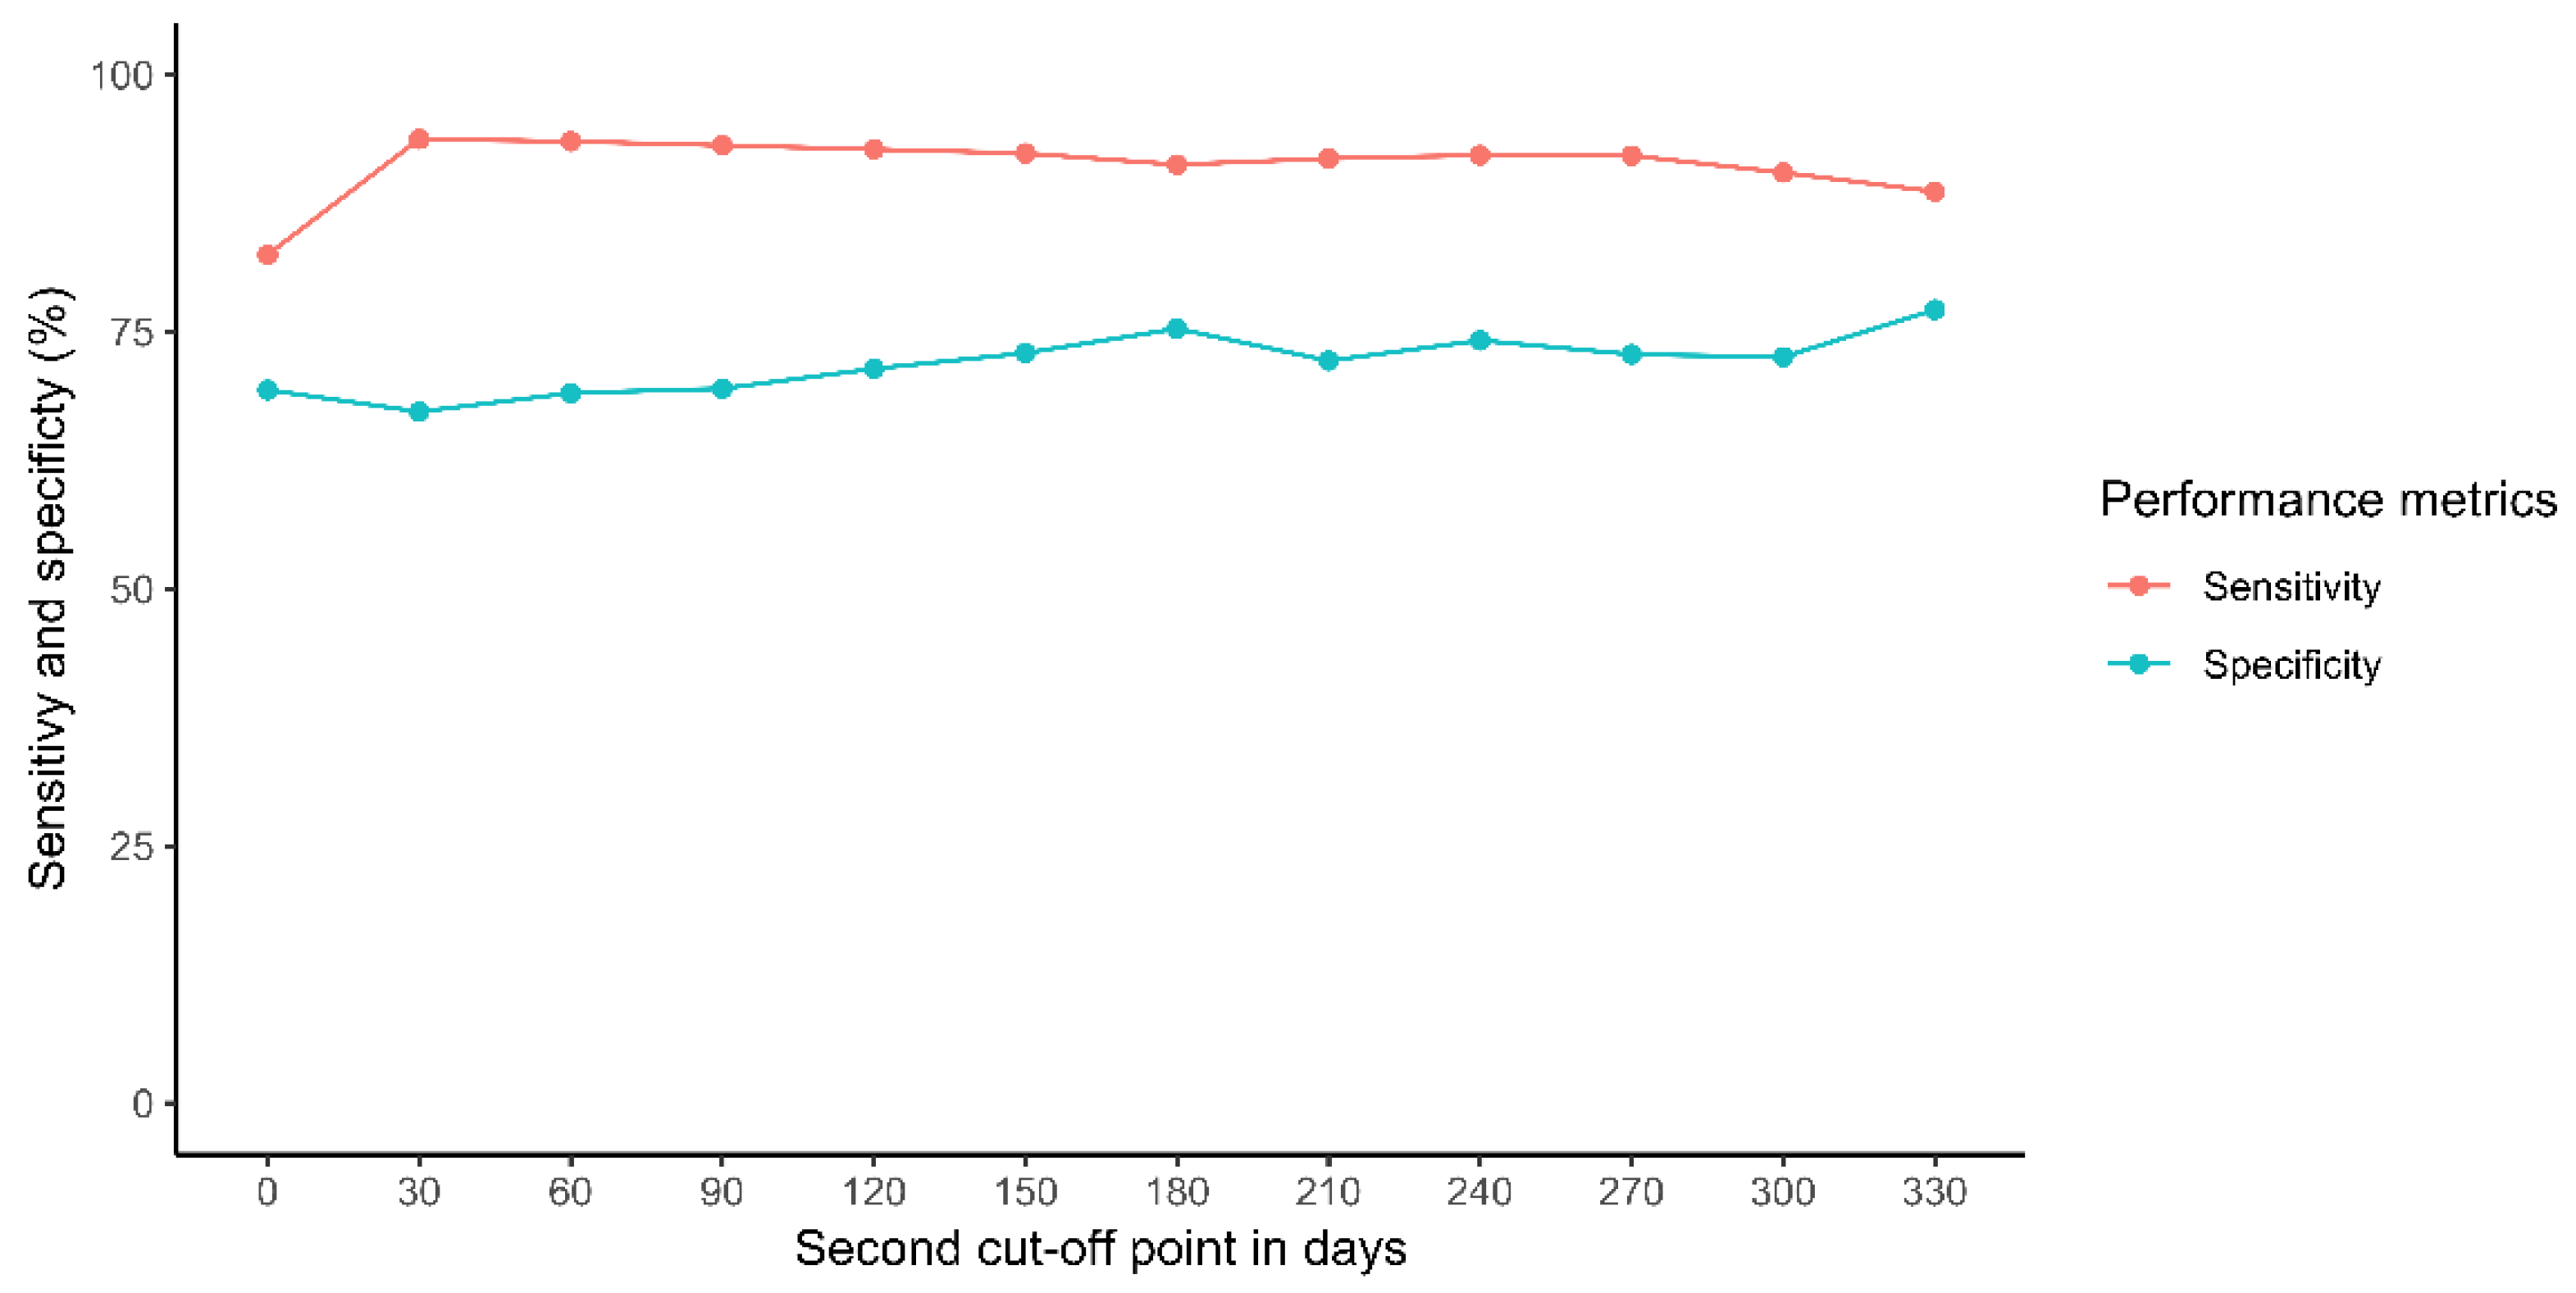
- For those discharges followed by an outpatient readmission, a second cut-off point was established based on the sensitivity and specificity of the mandatory “discharge status” variable to reduce its false positive rate.
- Finally, because to generate the prediction models the discharge episodes were chronologically split into training, validation, and test datasets, discharges were only included in the latter dataset if the patient had not had a previous discharge in the training or validation datasets; similarly, discharges included in the validation dataset were only included if the patient had not had a previous discharge in the training datasets.
2.2. Variables
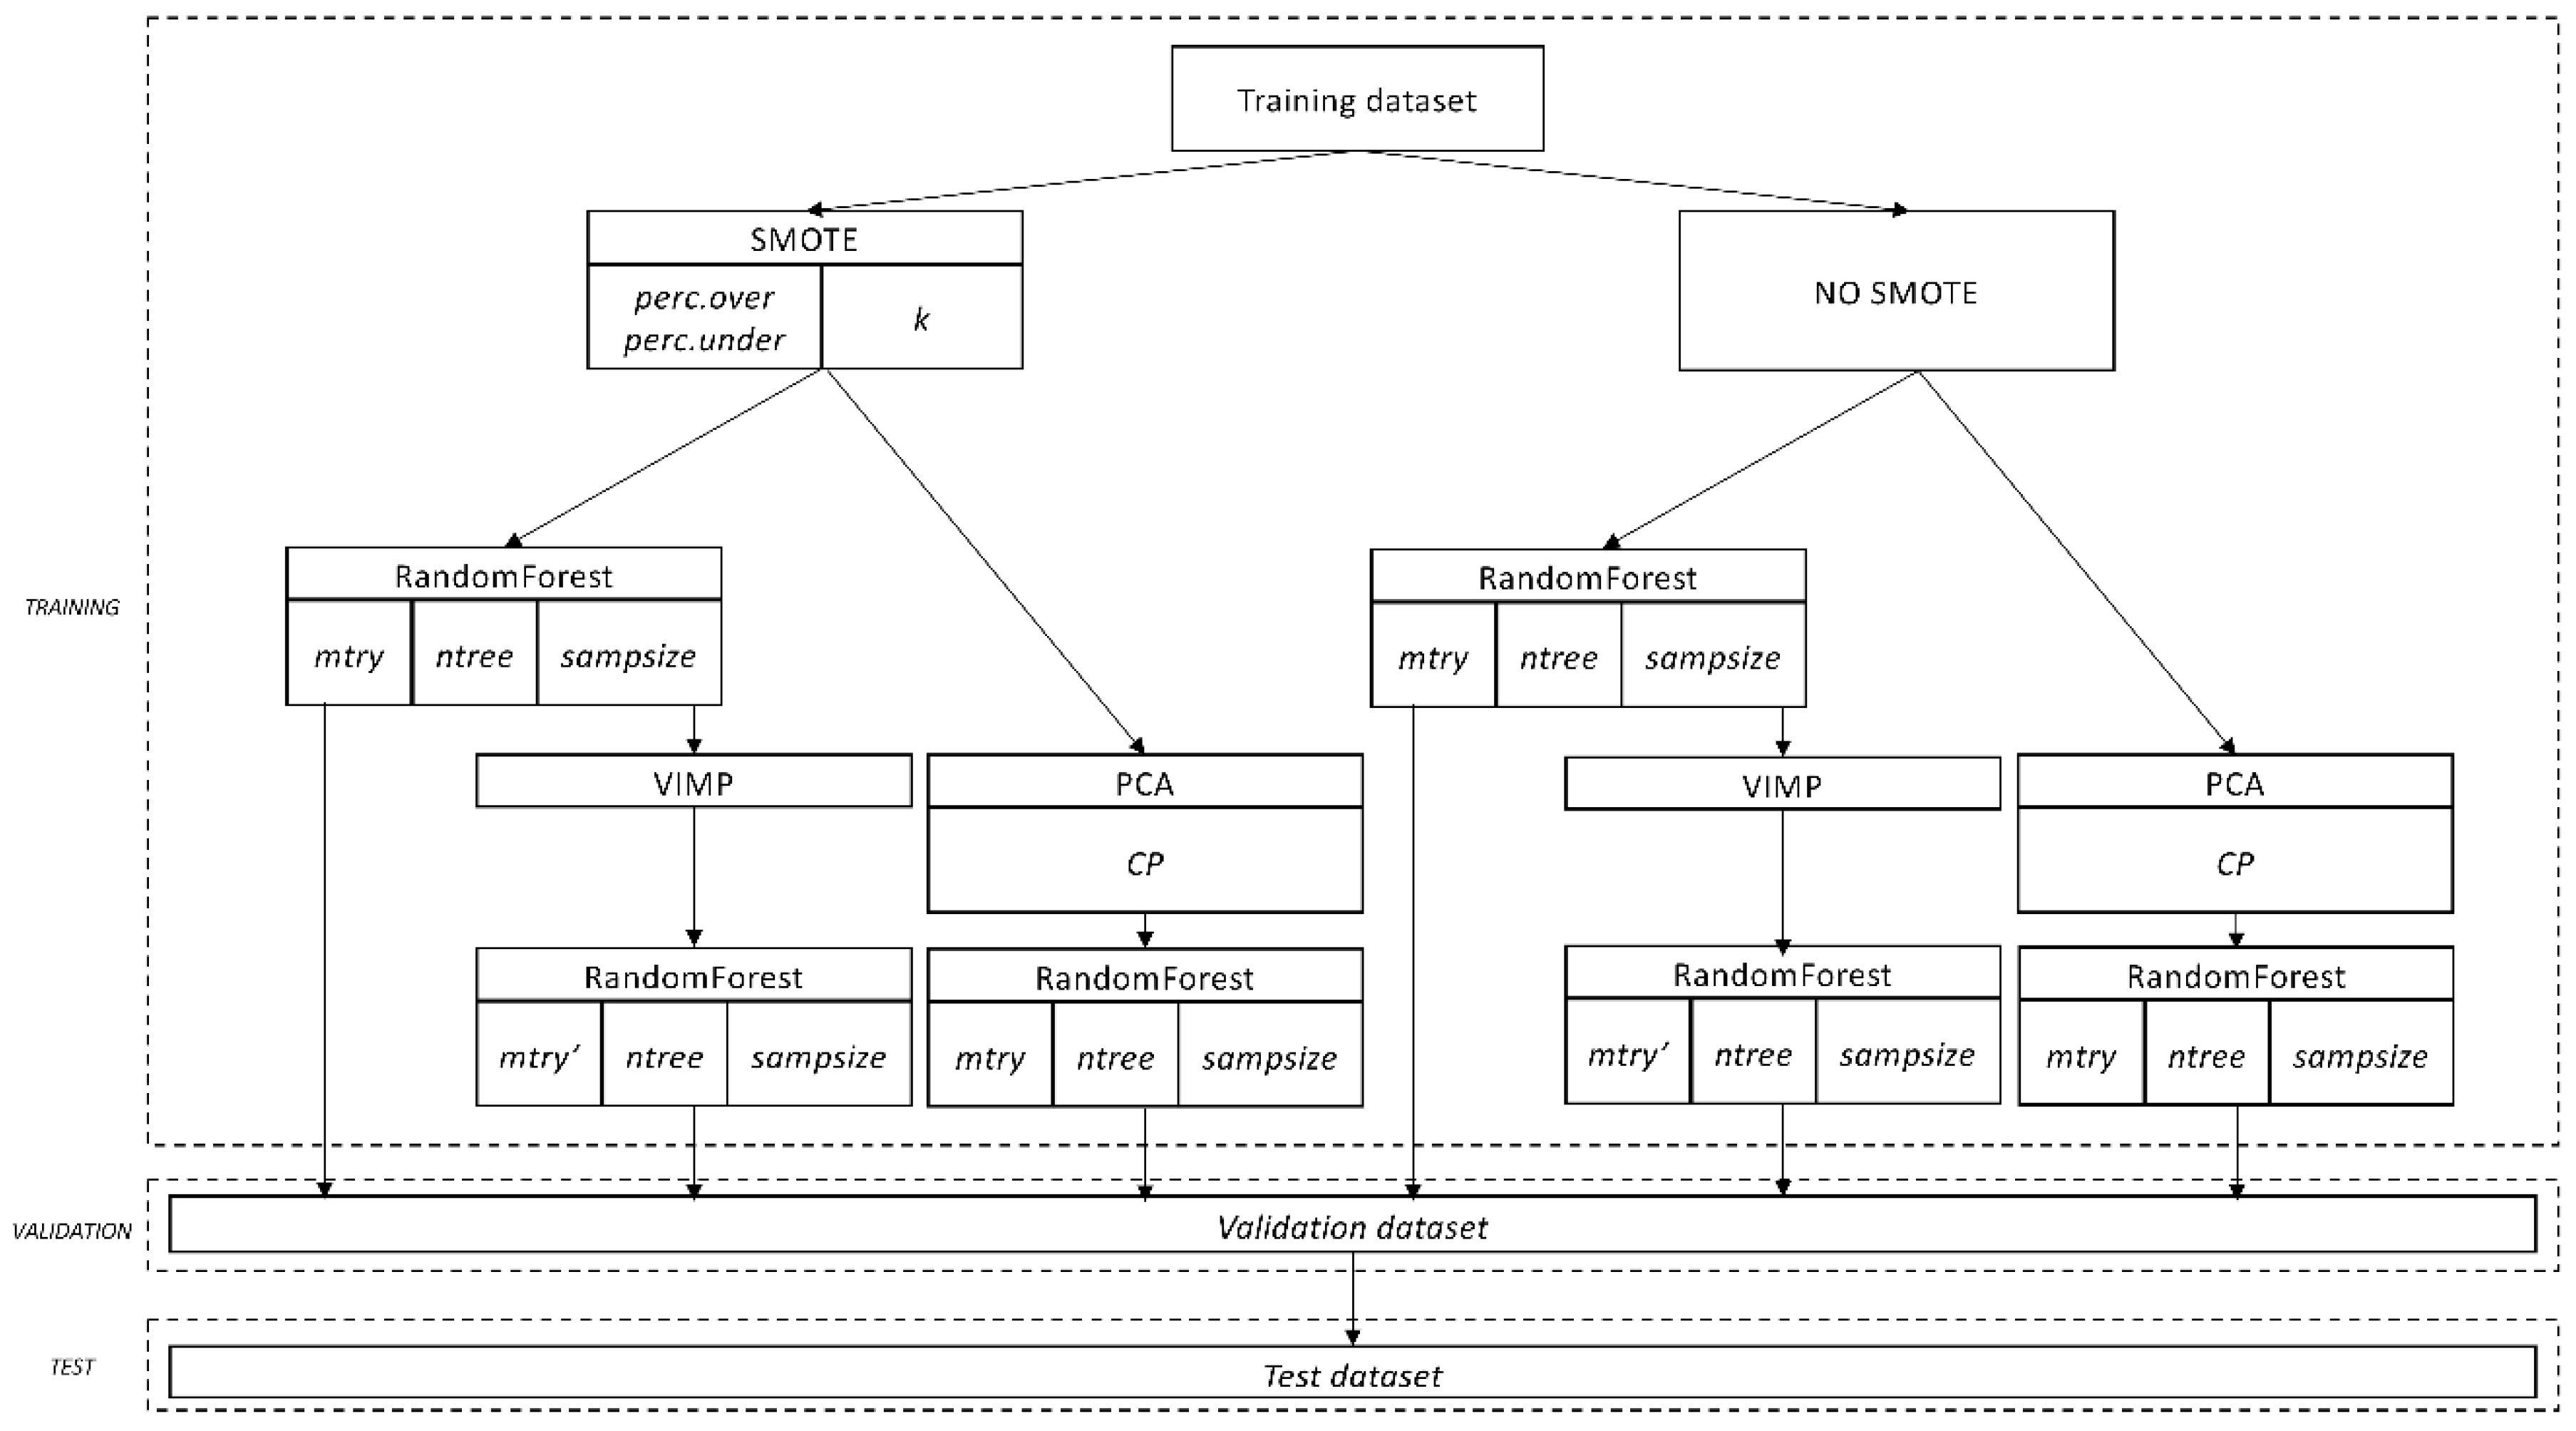
2.3. Statistical Analysis
- Starting from the original data, n bootstrap samples are drawn. Each sample is randomly divided into in-bag data and out-of-bag data (OOB data).
- From each bootstrap sample, a survival tree is grown using the in-bag data. At each node of the tree, several candidate variables (mtry) are randomly selected, and the candidate variable that maximizes difference between the two daughter nodes is used for splitting the node.
- The tree is grown until any of the daughter nodes have less that a certain number of events (in our case 1 event).
- The predicted outcome is determined based on the majority votes of the individual decision trees. Therefore, if more that 50% of the trees predict a particular outcome (in our case outpatient readmission), the forest will predict that the patient will experience an outpatient readmission.
- -
- First, for those variables referred to the same diagnosis given, or drug prescribed by the rheumatologists either at first visit in the clinic, at the first visit of each episode, at discharge, and at any visit taking place in the previous 90 or 182 days before discharge, we chose the one with the highest relative variable importance (VIMP) for each diagnosis and treatment. For those variables referred to disability, distress, Rosser Classification Index, duration of follow-up, and number of visits, the same process was carried out. All comorbidities and concomitant medications were carried out according to the next step.
- -
- Second, we considered those comorbidities and concomitant medications referred to the same diagnose and treatments from the first point. We selected either the variable given in our outpatient clinic or the one given by other physicians (i.e., comorbidities) based on the highest relative VIMP. Unrelated comorbidities, concomitant medications, diagnosis given, or drug prescribed by the rheumatologists were carried out according to the next step.
- -
- Third and final step, we considered the rest of comorbidities and concomitant medications (those not referred to a diagnosis or treatment from the first point). They were clinically grouped by system or syndrome, and the variable with the highest relative VIMP selected for each system or syndrome. In addition, the variables “number of diagnosis at discharge” and “number of treatments at discharge” were also selected.
3. Results
3.1. Patient Description
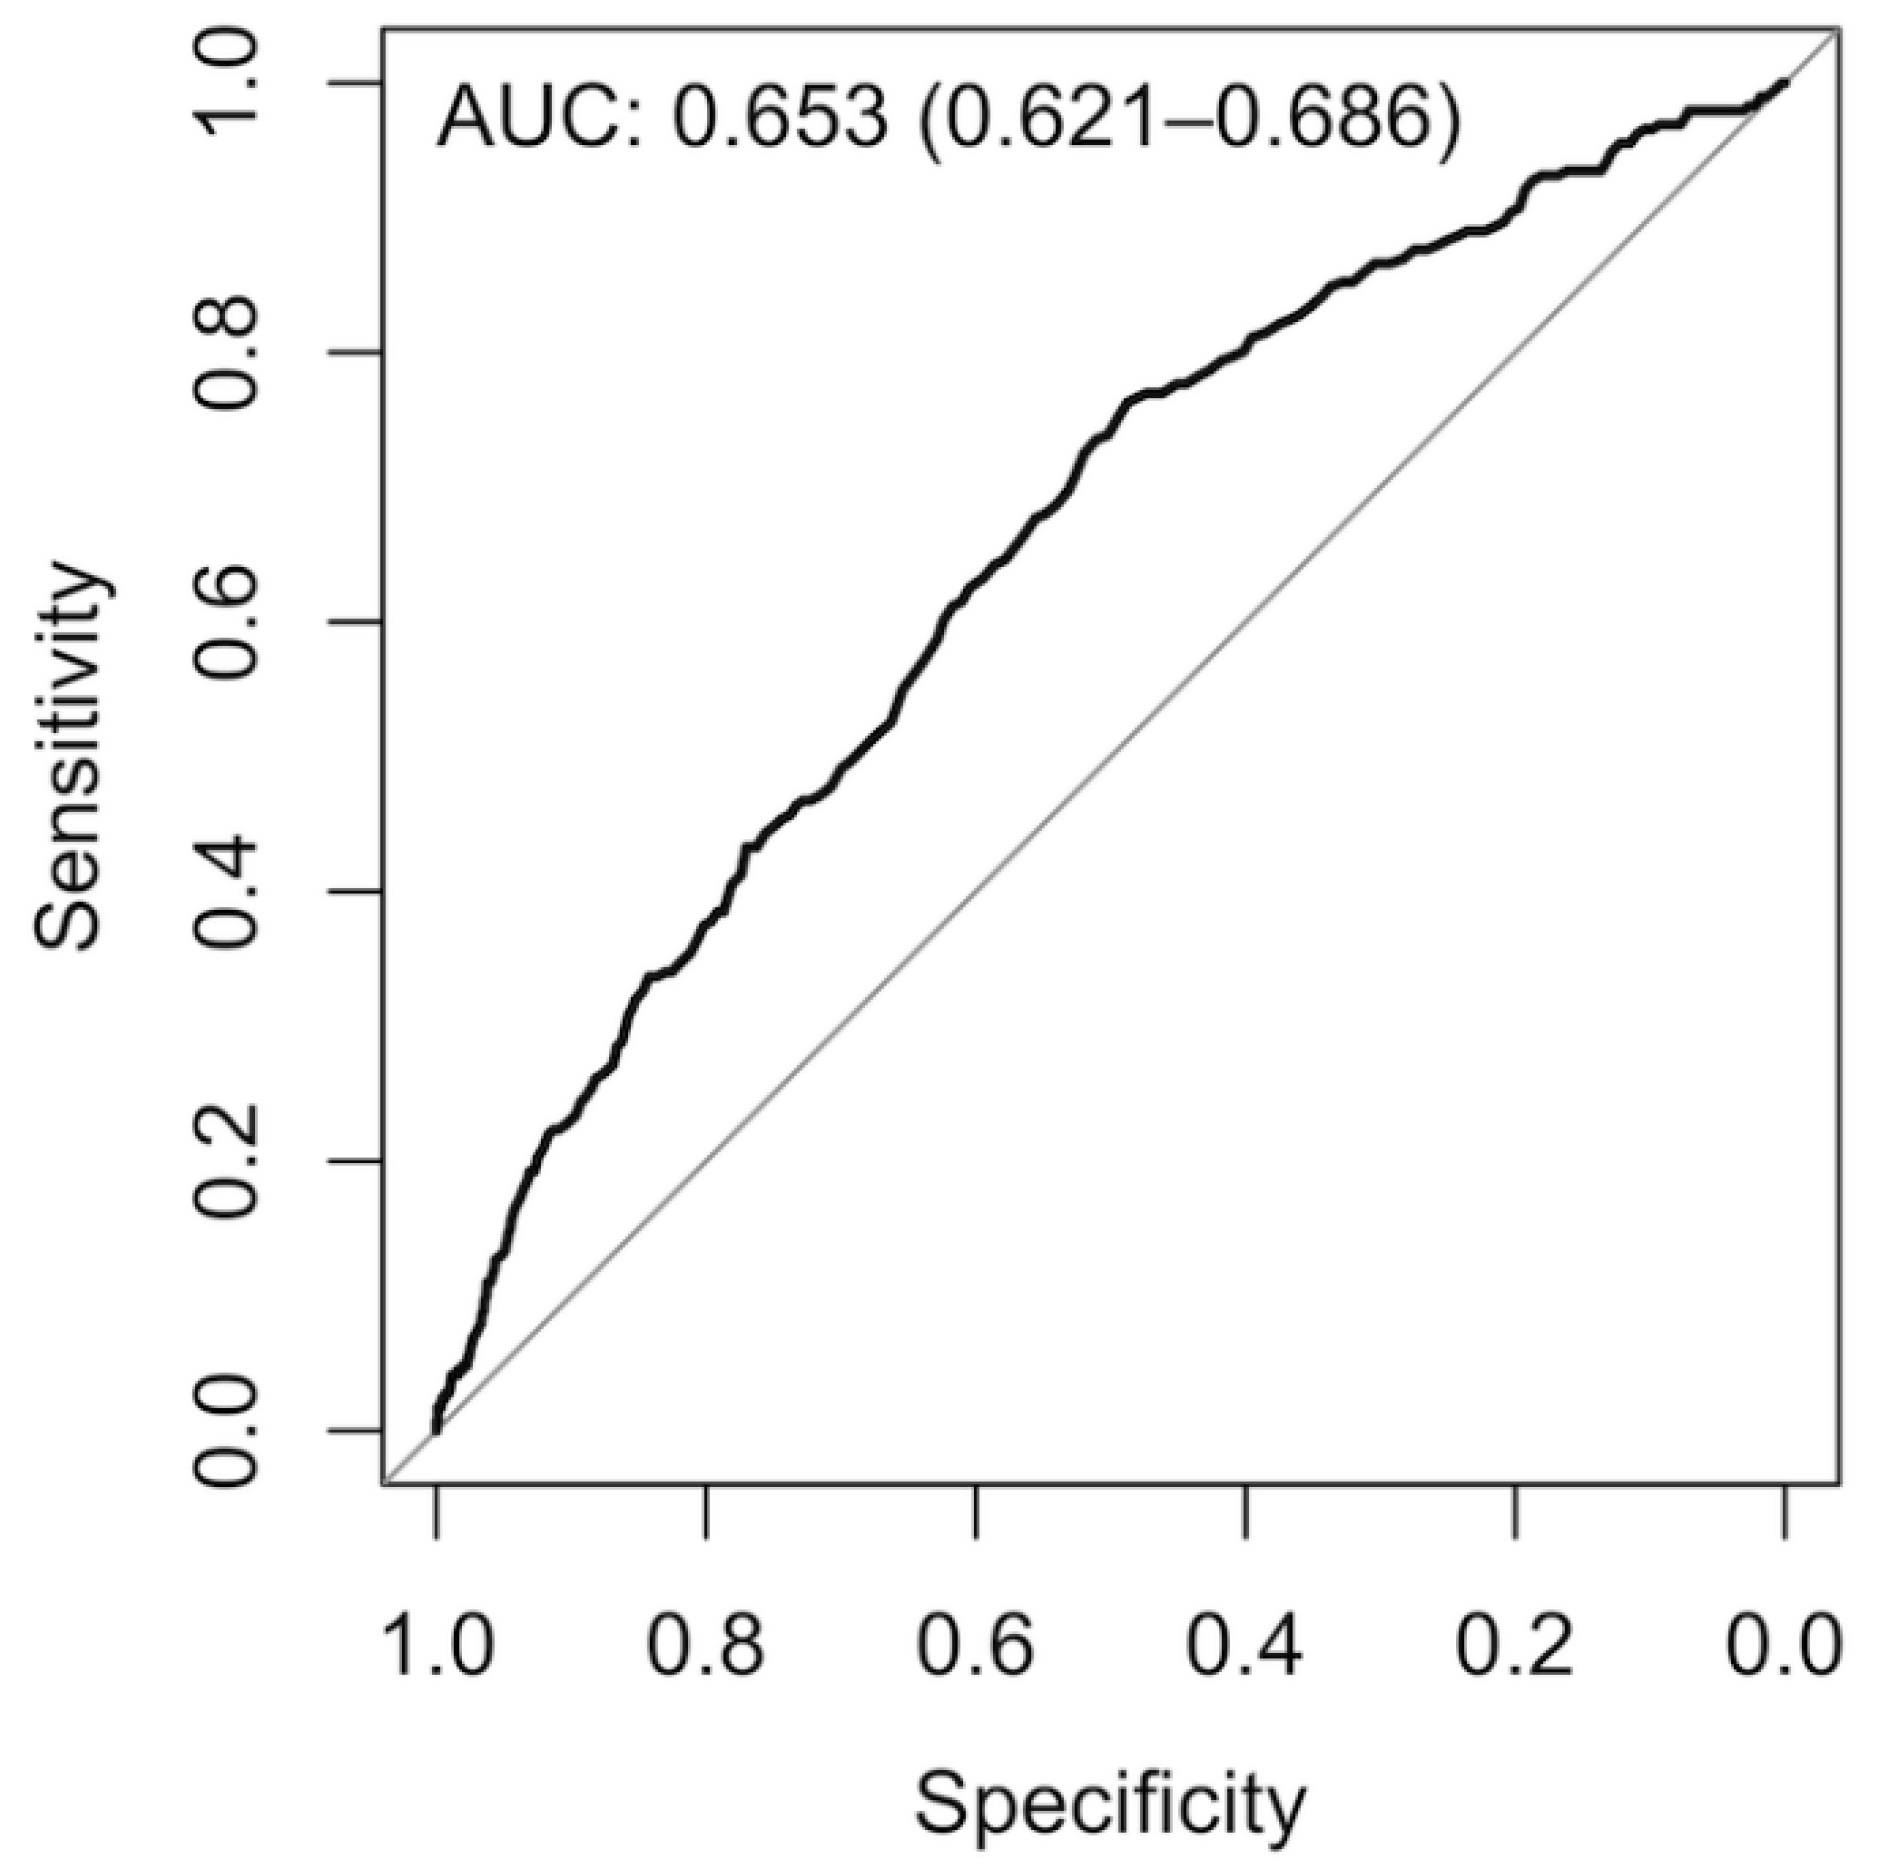
3.2. Model Development, Validation, and Testing
4. Discussion
- (a)
- Although we included predictors from most categories previously described (such as clinical, demographic, medication/treatment, and QoL) [22], some important predictors, mostly related to social determinants of health, such as income level, household structure, or race, were not included. These variables may impact the patient’s ability to follow the physician recommendations after discharge, increasing the risk of readmission. By not including these variables, two subjects with the same diagnosis, comorbidities, and follow-up duration would have been assigned by our model to the same readmission risk, despite having different income levels, or social support. The absence of social determinants of health in readmission models is common when they are generated using data from EHRs, as they are not usually collected in these tools [43]. Further studies are needed to assess their role in outpatient readmission.
- (b)
- Another limitation is that we have included an initial high number of predictors (>400). However, we want to point out that we are also analyzing a high number of discharge episodes (>18,000) and that this is the first analysis of outpatient readmission in the rheumatology setting, therefore there is no evidence regarding which variables should we focus. Finally, we managed to reduce the number of variables used by our reduced final model, which can improve the feasibility of implementation in new setting.
- (c)
- Another limitation is the lack of external validation in a different setting, which can limit the generalization of our model. In addition, the same researchers that developed the prediction model carried out the validation analysis, which can lead to bias [44]. However, we want to point out that in our validation and test cohort we included more than 200 events each, the number recommended by some authors to ensure a proper validation [33,34].
- (d)
- Class imbalance is an inherent problem when developing readmission prediction models [21]: inpatient readmission is estimated to affect only 20% of admitted patients [9]. Because most of the classifiers assume relatively balanced a priori probabilities for both classes [45], when imbalance is present, the resulting model tends to achieve higher accuracy in the majority class and lower in the minority class [46]. In this study we tried to minimize this issue by oversampling of cases, and by modifying the relationship between the number of cases and controls included in the bootstrapped samples to develop each decision tree.
- (e)
- Another limitation is the possibility that patients after discharge instead of being readmitted to our outpatient clinic can be transferred to another center, or to another specialist (such as orthopedic surgery). Therefore, we may be misclassifying patients from the “discharges without outpatient readmission” group. Based on the organization of our regional health system, subjects can request to be attended in the rheumatology department of a different reference area. Approximately 350 subjects from our reference area make this request every year, including subjects never seen in our clinic, previously seen and discharged, and previously seen and lost to follow-up. Assuming that in the previous years (2007–2016) those numbers remained stable, in a worst-case scenario in which all those subjects belonged to the “discharges without outpatient readmission” group and also attended the new centers between 2 and 12 months after discharge, we may be misclassifying up to 21.7% (3500/16,134) of the episodes of this group. Unfortunately, we do not currently have access to the information to identify the precise number of patients we are actually misclassifying. If we were to assume that those patients attending other rheumatology clinics were evenly distributed among the three groups (1166 patients never seen in our clinic, 1166 previously seen and discharged, and 1166 previously seen and lost to follow-up), and of those previously seen and discharged followed the same temporal pattern than those patients returning to our clinic (25% of them retuning in the first 2 months after discharge, 34% returning after 12 month, and 40% between 2 and 12 months), we would be misclassifying only 467 patient of 16,134 (2.9%). We assume the correct percentage could be between both numbers.
- (f)
- Because we are using data from routine clinical practice, collected in an environment of heavy workload, errors in codification may exist. To minimize this issue, we included only patients we were confident about that had high quality data, based on data completeness and consistency. Moreover, patient’s care is not formally standardized; meaning that the length of follow-up and the frequency with which patients attend our clinic is based on their clinical manifestations, response, and tolerance to treatment, and the clinical judgment of each physician regarding how the patient is going to evolve. Furthermore, changes regarding the collective management of some musculoskeletal diseases, such as rheumatoid arthritis, can prevent our model from a correct performance if developed in patients managed a certain way and then applied to future patients managed a different way. However, considering that the developed models showed very similar values of AUC-ROC in training, validation, and test datasets, we believe these errors in coding (in case they exist) or the heterogeneity in patient’s management may be systematic and therefore present in all datasets. In addition, changes in patient management do not seem to affect the model’s performance, as we only observed a small reduction in accuracy when comparing between datasets.
- (g)
- Another limitation is our definition of outpatient readmission. In order to minimize errors in coding, we excluded those readmissions within the first 2 months after discharge, and therefore we may be discarding early episodes of readmission. However, considering that the median elapsed time between two consecutive visits is close to 2 months (73 days (IQR: 32–133 days)), we can argue that the consequence for a patient that is discharged and returns to the clinic in the first 2 months may be similar to that of a patient not discharged and schedule to return within the first 2 months.
- (h)
- In addition, we required the presence of a common diagnosis between the discharge and readmission visits, i.e., the presence of the same or different ICD9/ICD10 codes in both visits but belonging to the same group of diagnoses. However, we did not specifically consider a common diagnosis when despite the readmission being motivated by a process associated or caused by a diagnosis given at discharge, both conditions belonged to different groups.
- (a)
- Musculoskeletal diseases are a very heterogeneous group of conditions. In our outpatient clinic, patients with all sorts of musculoskeletal and rheumatic diseases are attended, including inflammatory and non-inflammatory conditions. The proportion of incident patients with different diagnosis reflects their prevalence in the general population, with most patients being diagnosed with non-inflammatory diseases (such as low back/neck pain, shoulder tendinitis, knee osteoarthritis…). Regarding prevalent patients, the proportion of those with inflammatory diseases increases, due to the care requirements of these conditions (such as rheumatoid arthritis, chronic polyarthritis, polymyalgia rheumatica, spondyloarthropathies, connective tissue diseases…). For the different rheumatology outpatient clinics of the Community of Madrid, a 2011 survey presented in the “Strategic Plan for the Rheumatic and Musculoskeletal Diseases of the Community of Madrid” [47] showed a similar composition regarding the diseases attended in first and review visits. We can hypothesize that for outpatient clinics in other regions of Spain, the composition will be similar. However, there is great heterogeneity regarding clinical practice in these conditions [48]. We can expect this heterogeneity will affect the performance of our model, and therefore, affect its likelihood of being implemented in other settings.
- (b)
- Although EHRs represent rich sources of data to develop and improve predictive models, it is essential to consider that our reduced final model still included a large number of variables (>70). However, it is important to point out that all of them are calculated or derived from information routinely collected in our outpatient clinic, and therefore the model’s implementation will not represent an extra effort for the attending physician, as it does not require the collection of new data. Regarding the extension of this model to other rheumatology outpatient settings, there may be issues with the lack of some of the elements collected in our setting. Nevertheless, we have used variables that most EHR in outpatient settings collect: diagnosis, treatments, comorbidities, duration of follow-up, and basic demographic data. The main obstacle will be the absence of a systematic assessment of QoL or disability (in our case we used the Rosser Classification Index) in most EHR. We are aware that the use of this instrument is not as common as others, such as the EuroQol 5D. Regardless, the implementation of our model in a new setting will require an initial manual step of understanding how data is stored, structured, and codified, in order to figure out how to clean, translate, and homogenize the data to be used by the model. However, after this step, besides periodic manual assessments to ensure that this process is carried out with no errors, no further manual work will be required, as these processes can run automatically. Notwithstanding, we recognize this initial manual step and its automatization will limit the application of our model in new settings, as its implementation requires either some abilities and knowledge by the members of the new setting, or external assistance.
- (c)
- We have developed a model that identifies patients who are more likely to be readmitted in our outpatient clinic, but we have not shown that those patients have actually a poorer clinical outcome. Unfortunately, we currently have access only to information from those patients who returned to our clinic, and therefore we cannot assess if those coming back have a worse outcome that those who do not, and if our model preferentially identifies this group of patients with poorer outcome, regardless they are readmitted or not. Further studies will be needed to assess this point. Furthermore, considering the influence of the system’s organization in the administrative consequences of outpatient readmission, both circumstances can reduce the impact of our model once it is implemented in a new setting.
- (d)
- In addition, multiple factors, such as the definition of the outcome and the population where the model is developed and/or tested are going to play a tremendous influence in model performance. Therefore, trying to use this model in other settings may be associated with a reduction of its discrimination ability. Therefore, a previous testing to assess its performance will be mandatory before implementation in new settings.
5. Conclusions
Supplementary Materials
Author Contributions
Collaborators
Funding
Conflicts of Interest
Data Sharing Statement
References
- Dharmarajan, K.; Hsieh, A.F.; Lin, Z.; Bueno, H.; Ross, J.S.; Horwitz, L.I.; Barreto-Filho, J.A.; Kim, N.; Bernheim, S.M.; Suter, L.G.; et al. Diagnoses and timing of 30-day readmissions after hospitalization for heart failure, acute myocardial infarction, or pneumonia. JAMA 2013, 309, 355–363. [Google Scholar] [CrossRef] [PubMed]
- Rosenberg, A.L.; Watts, C. Patients readmitted to ICUs*: A systematic review of risk factors and outcomes. Chest 2000, 118, 492–502. [Google Scholar] [CrossRef] [PubMed]
- Kramer, A.A.; Higgins, T.L.; Zimmerman, J.E. Intensive care unit readmissions in US. hospitals: Patient characteristics, risk factors, and outcomes. Crit. Care Med. 2012, 40, 3–10. [Google Scholar] [CrossRef] [PubMed]
- Wong, E.G.; Parker, A.M.; Leung, D.G.; Brigham, E.P.; Arbaje, A.I. Association of severity of illness and intensive care unit readmission: A systematic review. Heart Lung 2016, 45, 3–9. [Google Scholar] [CrossRef] [PubMed]
- Balla, U.; Malnick, S.; Schattner, A. Early readmissions to the department of medicine as a screening tool for monitoring quality of care problems. Medicine (Baltimore) 2008, 87, 294–300. [Google Scholar] [CrossRef] [PubMed]
- Merkow, R.P.; Ju, M.H.; Chung, J.W.; Hall, B.L.; Cohen, M.E.; Williams, M.V.; Tsai, T.C.; Ko, C.Y.; Bilimoria, K.Y. Underlying reasons associated with hospital readmission following surgery in the United States. JAMA 2015, 313, 483–495. [Google Scholar] [CrossRef] [PubMed]
- McIntyre, L.K.; Arbabi, S.; Robinson, E.F.; Maier, R.V. Analysis of Risk Factors for Patient Readmission 30 Days Following Discharge From General Surgery. JAMA Surg. 2016, 151, 855–861. [Google Scholar] [CrossRef]
- Litwinowicz, R.; Bartus, K.; Drwila, R.; Kapelak, B.; Konstanty-Kalandyk, J.; Sobczynski, R.; Wierzbicki, K.; Bartuś, M.; Chrapusta, A.; Timek, T.; et al. In-hospital mortality in cardiac surgery patients after readmission to the intensive care unit: A single-center experience with 10,992 patients. J. Cardiothorac. Vasc. Anesth. 2015, 29, 570–575. [Google Scholar] [CrossRef]
- Jencks, S.F.; Williams, M.V.; Coleman, E.A. Rehospitalizations among patients in the Medicare fee-for-service program. N. Engl. J. Med. 2009, 360, 1418–1428. [Google Scholar] [CrossRef]
- Duwayri, Y.; Goss, J.; Knechtle, W.; Veeraswamy, R.K.; Arya, S.; Rajani, R.R.; Brewster, L.P.; Dodson, T.F.; Sweeney, J.F. The Readmission Event after Vascular Surgery: Causes and Costs. Ann. Vasc. Surg. 2016, 36, 7–12. [Google Scholar] [CrossRef]
- Goel, A.N.; Raghavan, G.; John, M.A.; Long, J.L. Risk Factors, Causes, and Costs of Hospital Readmission After Head and Neck Cancer Surgery Reconstruction. JAMA Facial Plast. Surg. 2018, 21, 137–145. [Google Scholar] [CrossRef] [PubMed]
- Burke, R.E.; Jones, C.D.; Hosokawa, P.; Glorioso, T.J.; Coleman, E.A.; Ginde, A.A. Influence of Nonindex Hospital Readmission on Length of Stay and Mortality. Med. Care 2018, 56, 85–90. [Google Scholar] [CrossRef] [PubMed]
- Kaboli, P.J.; Go, J.T.; Hockenberry, J.; Glasgow, J.M.; Johnson, S.R.; Rosenthal, G.E.; Jones, M.P.; Vaughan-Sarrazin, M. Associations between reduced hospital length of stay and 30-day readmission rate and mortality: 14-year experience in 129 Veterans Affairs hospitals. Ann. Intern. Med. 2012, 157, 837–845. [Google Scholar] [CrossRef] [PubMed]
- Smirnow, A.M.; Wendland, M.; Campbell, P.; Bartock, B.; Chirico, J.; Cohen, E.; Beckman, H. Patient Outcomes after 30, 60, and 90 Days Post-Discharge in a Community-Wide, Multi-Payer Care Transitions Intervention (CTI) Program; FLHSA: Rochester, NY, USA, 2015. [Google Scholar]
- Avinash, M.; Rajasekaran, S.; Aiyer, S.N. Unplanned 90-day readmissions in a specialty orthopaedic unit—A prospective analysis of consecutive 12729 admissions. J. Orthop. 2017, 14, 236–240. [Google Scholar] [CrossRef] [PubMed]
- Siracuse, J.J.; Shah, N.K.; Peacock, M.R.; Tahhan, G.; Kalish, J.A.; Rybin, D.; Eslami, M.H.; Farber, A. Thirty-day and 90-day hospital readmission after outpatient upper extremity hemodialysis access creation. J. Vasc. Surg. 2017, 65, 1376–1382. [Google Scholar] [CrossRef] [PubMed] [Green Version]
- Ashton, C.M.; Wray, N.P. A conceptual framework for the study of early readmission as an indicator of quality of care. Soc. Sci. Med. 1996, 43, 1533–1541. [Google Scholar] [CrossRef]
- Hernandez, A.F.; Greiner, M.A.; Fonarow, G.C.; Hammill, B.G.; Heidenreich, P.A.; Yancy, C.W.; Peterson, E.D.; Curtis, L.H. Relationship between early physician follow-up and 30-day readmission among Medicare beneficiaries hospitalized for heart failure. JAMA 2010, 303, 1716–1722. [Google Scholar] [CrossRef] [PubMed]
- Kripalani, S.; Jackson, A.T.; Schnipper, J.L.; Coleman, E.A. Promoting effective transitions of care at hospital discharge: A review of key issues for hospitalists. J. Hosp. Med. 2007, 2, 314–323. [Google Scholar] [CrossRef] [Green Version]
- Kansagara, D.; Englander, H.; Salanitro, A.; Kagen, D.; Theobald, C.; Freeman, M.; Kripalani, S. Risk prediction models for hospital readmission: A systematic review. JAMA 2011, 306, 1688–1698. [Google Scholar] [CrossRef]
- Artetxe, A.; Beristain, A.; Graña, M. Predictive models for hospital readmission risk: A systematic review of methods. Comput. Methods Programs Biomed. 2018, 164, 49–64. [Google Scholar] [CrossRef]
- Swain, M.J.; Kharrazi, H. Feasibility of 30-day hospital readmission prediction modeling based on health information exchange data. Int. J. Med. Inf. 2015, 84, 1048–1056. [Google Scholar] [CrossRef]
- Collings, S.; Highton, J. Changing patterns of hospital admissions for patients with rheumatic diseases. N. Z. Med. J. 2002, 115, 131–132. [Google Scholar]
- Harty, L.; O’Toole, G.; Gerald, O. Profound reduction in hospital admissions and musculoskeletal surgical procedures for rheumatoid arthritis with concurrent changes in clinical practice (1995–2010). Rheumatology (Oxford) 2015, 54, 666–671. [Google Scholar] [CrossRef]
- Jamshidi, A.; Pelletier, J.P.; Martel-Pelletier, J. Machine-learning-based patient-specific prediction models for knee osteoarthritis. Nat. Rev. Rheumatol. 2019, 15, 49–60. [Google Scholar] [CrossRef]
- Leon, L.; Rodriguez-Rodriguez, L.; Aguilar, M.D.; Jover, J.Á.; Vadillo, C.; Redondo, M.; Abasolo, L. Validation of a Quality of Life Instrument in Spanish Patients With Rheumatic Diseases: The Rosser Classification System. J. Clin. Rheumatol. 2019, 25, 78–84. [Google Scholar] [CrossRef]
- Zeng, C.; Dubreuil, M.; LaRochelle, M.R.; Lu, N.; Wei, J.; Choi, H.K.; Lei, G.; Zhang, Y. Association of Tramadol With All-Cause Mortality Among Patients With Osteoarthritis. JAMA 2019, 321, 969. [Google Scholar] [CrossRef]
- Austin, P.C. An Introduction to Propensity Score Methods for Reducing the Effects of Confounding in Observational Studies. Multivar. Behav. Res. 2011, 46, 399–424. [Google Scholar] [CrossRef] [Green Version]
- Du, Z.; Hao, Y. Stddiff: Calculate the Standardized Difference for Numeric, Binary and Category Variables. 2017. [Google Scholar]
- R Core Team. A Language and Environment for Statistical Computing; R Foundation for Statistical Computing: Vienna, Austria, 2013. [Google Scholar]
- Wiener, A.L.M. Classification and Regression by randomForest. R News 2002, 2, 18–22. [Google Scholar]
- Fernández-Delgado, M.; Cernadas, E.; Barro, S.; Fernández-Delgado, D.A. Do we need hundreds of classifiers to solve real world classification problems? J. Mach. Learn. Res. 2014, 15, 3133–3181. [Google Scholar]
- Collins, G.S.; Ogundimu, E.O.; Altman, D.G. Sample size considerations for the external validation of a multivariable prognostic model: A resampling study. Stat. Med. 2016, 35, 214–226. [Google Scholar] [CrossRef]
- Vergouwe, Y.; Steyerberg, E.W.; Eijkemans, M.J.C.; Habbema, J.D.F. Substantial effective sample sizes were required for external validation studies of predictive logistic regression models. J. Clin. Epidemiol. 2005, 58, 475–483. [Google Scholar] [CrossRef]
- Davis, J.; Goadrich, M. The relationship between Precision-Recall and ROC curves. In Proceedings of the 23rd international conference on Machine learning, Pittsburgh, PA, USA, 25–29 June 2006; pp. 233–240. [Google Scholar]
- Kuhn, M.; Johnson, K. Applied Predictive Modeling; Springer: New York, NY, USA, 2013. [Google Scholar]
- Mitchell, M.W. Bias of the Random Forest Out-of-Bag (OOB) Error for Certain Input Parameters. Open J. Stat. 2011, 1, 205–211. [Google Scholar] [CrossRef] [Green Version]
- Collins, G.S.; Reitsma, J.B.; Altman, D.G.; Moons, K.G.M. Transparent Reporting of a multivariable prediction model for Individual Prognosis or Diagnosis (TRIPOD): The TRIPOD statement. Ann. Intern. Med. 2015, 162, 55–63. [Google Scholar] [CrossRef]
- Jack, B.W.; Chetty, V.K.; Anthony, D.; Greenwald, J.L.; Sanchez, G.M.; Johnson, A.E.; Forsythe, S.R.; O’Donnell, J.K.; Paasche-Orlow, M.K.; Manasseh, C.; et al. A reengineered hospital discharge program to decrease rehospitalization: A randomized trial. Ann. Intern. Med. 2009, 150, 178–187. [Google Scholar] [CrossRef]
- Coleman, E.A.; Min, S.; Chomiak, A.; Kramer, A.M. Posthospital care transitions: Patterns, complications, and risk identification. Health Serv. Res. 2004, 39, 1449–1465. [Google Scholar] [CrossRef]
- Amarasingham, R.; Patel, P.C.; Toto, K.; Nelson, L.L.; Swanson, T.S.; Moore, B.J.; Xie, B.; Zhang, S.; Alvarez, K.S.; Ma, Y.; et al. Allocating scarce resources in real-time to reduce heart failure readmissions: A prospective, controlled study. BMJ Qual. Saf. 2013, 22, 998–1005. [Google Scholar] [CrossRef]
- Robert Wood Johnson Foundation The revolving door: A report on US. hospital readmissions. Available online: https://www.rwjf.org/content/dam/farm/reports/reports/2013/rwjf404178 (accessed on 17 January 2019).
- Meddings, J.; Reichert, H.; Smith, S.N.; Iwashyna, T.J.; Langa, K.M.; Hofer, T.P.; McMahon, L.F. The Impact of Disability and Social Determinants of Health on Condition-Specific Readmissions beyond Medicare Risk Adjustments: A Cohort Study. J. Gen. Intern. Med. 2017, 32, 71–80. [Google Scholar] [CrossRef]
- Ioannidis, J.P.A. Scientific inbreeding and same-team replication: Type D personality as an example. J. Psychosom. Res. 2012, 73, 408–410. [Google Scholar] [CrossRef]
- Sun, Y.; Wong, A.K.C.; Kamel, M.S. Classification of Imbalanced Data: A Review. Int. J. Pattern Recognit. Artif. Intell. 2009, 23, 687–719. [Google Scholar] [CrossRef]
- Lin, W.J.; Chen, J.J. Class-imbalanced classifiers for high-dimensional data. Brief. Bioinform. 2013, 14, 13–26. [Google Scholar] [CrossRef]
- Plan Estratégico de Reumatología de la Comunidad de Madrid; Servicio Madrileño de Salud: Madrid, Spain, 2011.
- Estrategia En Enfermedades Reumáticas y Musculoesqueléticas del Sistema Nacional de Salud; Ministerio De Sanidad, Servicios Sociales E Igualdad: Madrid, Spain, 2013.


| Variables | With Outpatient Readmission n = 2528 | Without Outpatient Readmission n = 16,134 | Standardized Mean Difference |
|---|---|---|---|
| Women, n (%) | 1888 (74.68) | 11,266 (69.83) | 0.109 |
| Age at discharge, median (IQR) | 60.8 (48.8–74.2) | 56 (44.3–70) | 0.230 |
| Year at discharge, n (%) | - | - | 0.624 |
| 2007 | 4 (0.16) | 738 (4.57) | - |
| 2008 | 44 (1.74) | 1107 (6.86) | - |
| 2009 | 173 (6.84) | 907 (5.62) | - |
| 2010 | 204 (8.07) | 886 (5.49) | - |
| 2011 | 534 (21.12) | 1495 (9.27) | - |
| 2012 | 510 (20.17) | 1768 (10.96) | - |
| 2013 | 272 (10.76) | 2075 (12.86) | - |
| 2014 | 263 (10.40) | 2154 (13.35) | - |
| 2015 | 262 (10.36) | 2471 (15.32) | - |
| 2016 | 262 (10.36) | 2533 (15.7) | - |
| Number of visits until discharge, since first visit in clinic, median (IQR) | 2 (1–4) | 1 (1–2) | 0.530 |
| Follow-up days until discharge, since first visit in clinic, median (IQR) | 42 (0–468) | 0 (0–49) | 0.334 |
| Follow-up days until discharge, per discharge episode, median (IQR) | 0 (0–77) | 0 (0–18) | 0.223 |
| Number of days elapsed from discharge until readmission, median (IQR) | 136 (91–212) | - | - |
| Rosser Index, median (IQR) | 98.6 (98.6–99.5) | 98.6 (98.6–99.5) | 0.020 |
| Pain/Distress level, n (%) | - | - | 0.152 |
| None | 448 (17.67) | 3633 (22.52) | - |
| Low | 1656 (65.58) | 10,447 (64.75) | - |
| Moderate | 409 (16.16) | 1965 (12.18) | - |
| High | 15 (0.6) | 89 (0.55) | - |
| Disability level, n (%) | 0.252 | ||
| None | 911 (36.04) | 7714 (47.81) | - |
| Slight social | 1187 (46.95) | 5970 (37) | - |
| Severe social and slight physical | 276 (10.92) | 1499 (9.29) | - |
| Moderate decrease in mobility | 105 (4.15) | 551 (3.42) | - |
| Severe decrease in mobility | 38 (1.50) | 292 (1.81) | - |
| Almost dependent | 11 (0.44) | 103 (0.64) | - |
| In bed | - | 5 (0.03) | - |
| Occupation, n (%) | - | - | 0.193 |
| Active | 1248 (49.34) | 9213 (57.10) | - |
| Housework | 721 (28.53) | 3744 (23.21) | - |
| Retired | 527 (20.85) | 2777 (17.21) | - |
| Student | 32 (1.27) | 400 (2.48) | - |
| Diagnoses, n (%) | - | ||
| Back pain | 321 (12.70) | 2763 (17.13) | 0.122 |
| No diagnoses | 114 (4.51) | 1914 (11.86) | 0.211 |
| Osteoarthritis of knee | 310 (12.26) | 1666 (10.33) | 0.063 |
| Pain in joint | 144 (5.7) | 1876 (11.63) | 0.269 |
| Tendinitis lower extremities | 247 (9.77) | 1193 (7.39) | 0.087 |
| Tendinitis upper extremities | 478 (18.91) | 2622 (16.25) | 0.073 |
| Medication use, n (%) | - | - | - |
| Analgesic 1st level | 1,019 (40.31) | 5969 (37.00) | 0.069 |
| Analgesic 2nd and 3rd level | 302 (12.02) | 1391 (8.62) | 0.124 |
| Benzodiazepine | 165 (6.53) | 1188 (7.36) | 0.031 |
| Calcium and vitamin D | 350 (13.84) | 1002 (6.21) | 0.254 |
| Gastric protector | 463 (18.31) | 2083 (12.91) | 0.15 |
| NSAIDs | 828 (32.75) | 5158 (31.97) | 0.019 |
| Comorbidities, n (%) | - | - | - |
| Depression | 138 (5.46) | 805 (4.99) | 0.021 |
| Diabetes mellitus | 236 (9.34) | 1366 (8.47) | 0.031 |
| Dyslipidemia | 613 (24.25) | 3480 (21.57) | 0.064 |
| Hypertension | 715 (28.28) | 4162 (25.8) | 0.056 |
| Hypothyroidism | 155 (6.13) | 1006 (6.24) | 0.004 |
| Obesity | 81 (3.20) | 634 (3.93) | 0.039 |
| Model | Ntree | Mtry | Mtry’ | Importance | Nº Pred | AUC-ROC | Sensitivity | Specificity | |||||||||
|---|---|---|---|---|---|---|---|---|---|---|---|---|---|---|---|---|---|
| TR | V | CV | TS | TR | V | CV | TS | TR | V | CV | TS | ||||||
| 1 | 100 | 30 | 8 | 1 | 329 | 0.744 | 0.668 | 0.731 | 0.662 | 0.561 | 0.480 | 0.535 | 0.440 | 0.791 | 0.743 | 0.790 | 0.758 |
| 2 | 100 | 20 | - | ALL | 403 | 0.739 | 0.668 | 0.734 | 0.668 | 0.536 | 0.469 | 0.523 | 0.416 | 0.799 | 0.766 | 0.801 | 0.783 |
| 3 | 1000 | 10 | - | ALL | 403 | 0.749 | 0.669 | 0.739 | 0.671 | 0.554 | 0.480 | 0.540 | 0.471 | 0.802 | 0.752 | 0.794 | 0.757 |
| 4 | 250 | 10 | - | ALL | 403 | 0.748 | 0.669 | 0.737 | 0.669 | 0.555 | 0.484 | 0.539 | 0.450 | 0.798 | 0.757 | 0.793 | 0.755 |
| 5 | 500 | 10 | - | ALL | 403 | 0.748 | 0.669 | 0.738 | 0.670 | 0.556 | 0.480 | 0.541 | 0.464 | 0.801 | 0.759 | 0.792 | 0.754 |
| 6 | 100 | 10 | 10 | 20 | 251 | 0.736 | 0.670 | 0.730 | 0.663 | 0.526 | 0.469 | 0.533 | 0.443 | 0.808 | 0.782 | 0.801 | 0.777 |
| 7 | 100 | 25 | 18 | 1 | 329 | 0.739 | 0.671 | 0.727 | 0.665 | 0.532 | 0.461 | 0.511 | 0.416 | 0.810 | 0.775 | 0.807 | 0.790 |
| 8 | 500 | 20 | - | ALL | 403 | 0.746 | 0.672 | 0.737 | 0.667 | 0.530 | 0.472 | 0.517 | 0.412 | 0.809 | 0.772 | 0.805 | 0.782 |
| 9 | 1000 | 20 | - | ALL | 403 | 0.747 | 0.672 | 0.737 | 0.667 | 0.532 | 0.472 | 0.520 | 0.416 | 0.809 | 0.768 | 0.805 | 0.783 |
| 10 | 250 | 20 | - | ALL | 403 | 0.746 | 0.673 | 0.736 | 0.667 | 0.534 | 0.472 | 0.523 | 0.419 | 0.806 | 0.767 | 0.802 | 0.784 |
| Reduced final model | 250 | 20 | - | - | 75 | - | - | 0.722 | 0.653 | - | - | 0.502 | 0.385 | - | - | 0.808 | 0.794 |
| Category | Predictor | rVIMP (%) | Prevalence/Mean in the “With Outpatient Readmission” Group |
|---|---|---|---|
| Demographic-related | Follow-up days until discharge since last discharge | 100 | Higher |
| Treatment-related | (D) Other DMARDs | 85.84 | Higher |
| Diagnoses-related | (182) Chronic polyarthritis | 58.75 | Higher |
| Treatment-related | (90) Corticosteroid | 40.61 | Higher |
| Demographic-related | (B) Occupation | 32.66 | Higher (house work, retired) |
| QoL-related | (182) Mean Rosser Index (c) | 32.48 | Lower |
| Diagnoses-related | (90) Osteoarthritis of hand | 32.32 | Lower |
| Comorbidity-related | (D) Other arrhythmias | 31.38 | Higher |
| Treatment-related | (D) Analgesic 2nd and 3rd level | 30.02 | Higher |
| Diagnoses-related | (182) Osteoporosis fracture | 29.05 | Higher |
| QoL-related | (182) Mean Disability Subscale (c) | 28.76 | Higher |
| Comorbidity-related | (D) Column surgery | 27.67 | Higher |
| Treatment-related | (D) Number of treatments | 27.08 | Higher |
| Diagnoses-related | (182) Generalized or Unspecified Osteoarthritis | 25.41 | Higher |
| Demographic-related | (B) Age | 24.69 | Higher |
| Comorbidity-related | (D) Axial neuropathy | 23.65 | Higher |
| Comorbidity-related | (D) Calcium antagonist | 23.56 | Higher |
| Diagnoses-related | (D) Back pain | 23.46 | Lower |
| Diagnoses-related | (D) Osteoarthritis of hip | 23.24 | Higher |
| Treatment-related | (B) NSAIDs | 22.57 | Lower |
| Comorbidity-related | (D) Antidepressant | 21.64 | Higher |
| Treatment-related | (D) Gabapentin | 21.11 | Higher |
| Comorbidity-related | (D) Hiatal hernia | 20.98 | Higher |
| Comorbidity-related | (D) Vitamins | 20.84 | Higher |
| Diagnoses-related | (D) Muscle disorders | 20.82 | Lower |
| Comorbidity-related | (D) Peripheral nervous system diseases | 20.33 | Higher |
| Treatment-related | (B) Gastric protector | 20.31 | Higher |
| Comorbidity-related | (D) Antiepileptics | 19.39 | Higher |
| Comorbidity-related | (D) Depression | 19.11 | Higher |
| QoL-related | (90) Mean Distress Subscale (c) | 19.1 | Higher |
| Diagnoses-related | (D) Spondyloarthropathies | 18.13 | Higher |
| Diagnoses-related | (D) No diagnoses | 17.98 | Lower |
| Treatment-related | (C) Analgesic 1st level | 17.59 | Higher |
| Diagnoses-related | (B) Neck pain | 17.47 | Lower |
| Treatment-related | (182) Colchicine | 16.18 | Higher |
| Comorbidity-related | (D) Other benign tumors | 15.96 | Higher |
| Comorbidity-related | (D) Anxiety | 15.83 | Lower |
| Comorbidity-related | (D) Calcium | 14.46 | Higher |
| Comorbidity-related | (D) Feet diseases | 14.46 | Higher |
| Diagnoses-related | (D) Number of diagnoses | 14.23 | Higher |
| Comorbidity-related | (D) Bisphosphonates | 13.66 | Higher |
| Comorbidity-related | (D) Bronchodilator | 13.63 | Higher |
| Comorbidity-related | (D) Cataract | 13.42 | Higher |
| Diagnoses-related | (182) Tendinitis upper extremities | 12.88 | Higher |
| Diagnoses-related | (182) Tendinitis | 12.62 | Lower |
| Comorbidity-related | (D) Kidney failure | 12.61 | Higher |
| Comorbidity-related | (D) Hand diseases | 12.17 | Higher |
| Diagnoses-related | (C) Other non-inflammatory diseases | 11.98 | Lower |
| Comorbidity-related | (D) Lowering uric acid drugs | 11.93 | Higher |
| Comorbidity-related | (D) Other endocrine diseases | 11.18 | Higher |
| Treatment-related | (182) NSAIDs hard | 11.03 | Higher |
| Comorbidity-related | (D) Allergy | 10.95 | Higher |
| Comorbidity-related | (D) Other ear diseases | 10.74 | Higher |
| Diagnoses-related | (B) Fibromyalgia | 10.25 | Higher |
| Diagnoses-related | (B) Pain in joint | 10.01 | Lower |
| Comorbidity-related | (D) Benzodiazepine | 9.81 | Lower |
| Comorbidity-related | (D) Other spine diseases | 9.59 | Higher |
| Comorbidity-related | (D) Knee arthrosis | 9.59 | Lower |
| Comorbidity-related | (D) Shoulder diseases | 7.94 | Higher |
| Comorbidity-related | (D) Urological surgery | 7.36 | Higher |
| Comorbidity-related | (D) Other virus infection | 7.32 | Higher |
| Comorbidity-related | (D) Symptomatic slow action drugs for osteoarthritis | 6.78 | Lower |
| Comorbidity-related | (D) Pregnancy | 3.34 | Lower |
| Comorbidity-related | (D) Other psychiatric conditions | 1.76 | Higher |
| Diagnoses-related | (182) Other connective tissue inflammatory diseases | 1.72 | Higher |
| Diagnoses-related | (D) Tendinitis lower extremities | 1.47 | Higher |
| Comorbidity-related | (D) Iron | 1.12 | Higher |
| Comorbidity-related | (D) Smoking habit | 0.89 | Lower |
| Diagnoses-related | (C) Crystal arthropathy | 0.15 | Higher |
| Demographic-related | Sex | −0.09 | Higher |
| Diagnoses-related | (C) Gout | −0.46 | Higher |
| Comorbidity-related | (D) Other dermatological diseases | −1.95 | Higher |
| Diagnoses-related | (90) Osteoarthritis of first carpometacarpal joints | −2.68 | Lower |
| Comorbidity-related | (D) Family history | −3.41 | Higher |
| Diagnoses-related | (182) Osteoporosis | −3.62 | Higher |
© 2019 by the authors. Licensee MDPI, Basel, Switzerland. This article is an open access article distributed under the terms and conditions of the Creative Commons Attribution (CC BY) license (http://creativecommons.org/licenses/by/4.0/).
Share and Cite
Madrid-García, A.; Font-Urgelles, J.; Vega-Barbas, M.; León-Mateos, L.; Freites, D.D.; Lajas, C.J.; Pato, E.; Jover, J.A.; Fernández-Gutiérrez, B.; Abásolo-Alcazar, L.; et al. Outpatient Readmission in Rheumatology: A Machine Learning Predictive Model of Patient’s Return to the Clinic. J. Clin. Med. 2019, 8, 1156. https://doi.org/10.3390/jcm8081156
Madrid-García A, Font-Urgelles J, Vega-Barbas M, León-Mateos L, Freites DD, Lajas CJ, Pato E, Jover JA, Fernández-Gutiérrez B, Abásolo-Alcazar L, et al. Outpatient Readmission in Rheumatology: A Machine Learning Predictive Model of Patient’s Return to the Clinic. Journal of Clinical Medicine. 2019; 8(8):1156. https://doi.org/10.3390/jcm8081156
Chicago/Turabian StyleMadrid-García, Alfredo, Judit Font-Urgelles, Mario Vega-Barbas, Leticia León-Mateos, Dalifer Dayanira Freites, Cristina Jesus Lajas, Esperanza Pato, Juan Angel Jover, Benjamín Fernández-Gutiérrez, Lydia Abásolo-Alcazar, and et al. 2019. "Outpatient Readmission in Rheumatology: A Machine Learning Predictive Model of Patient’s Return to the Clinic" Journal of Clinical Medicine 8, no. 8: 1156. https://doi.org/10.3390/jcm8081156