Expression of Glypican 3 Is an Independent Prognostic Biomarker in Primary Gastro-Esophageal Adenocarcinoma and Corresponding Serum Exosomes

 , , , ,
Abstract
:1. Introduction
2. Materials and Methods
2.1. Patient Characteristics and Data Collection
2.2. Blood Collection and Isolation of Serum Exosomes
2.3. Nanoparticle Tracking Analysis (NTA) and Fluorescent Nanoparticle Tracking Analysis (fNTA)
2.4. Western Blot (Immunoblotting)
2.5. Transmission Electron Microscopy (TEM)
2.6. Flow Cytometry Analysis (FC)
2.7. Immunohistochemistry (IHC)
2.8. CA19-9, CA72-4 and CEA and Immunoassays
2.9. Statistical Analyses
3. Results
3.1. Study Design and Study Population
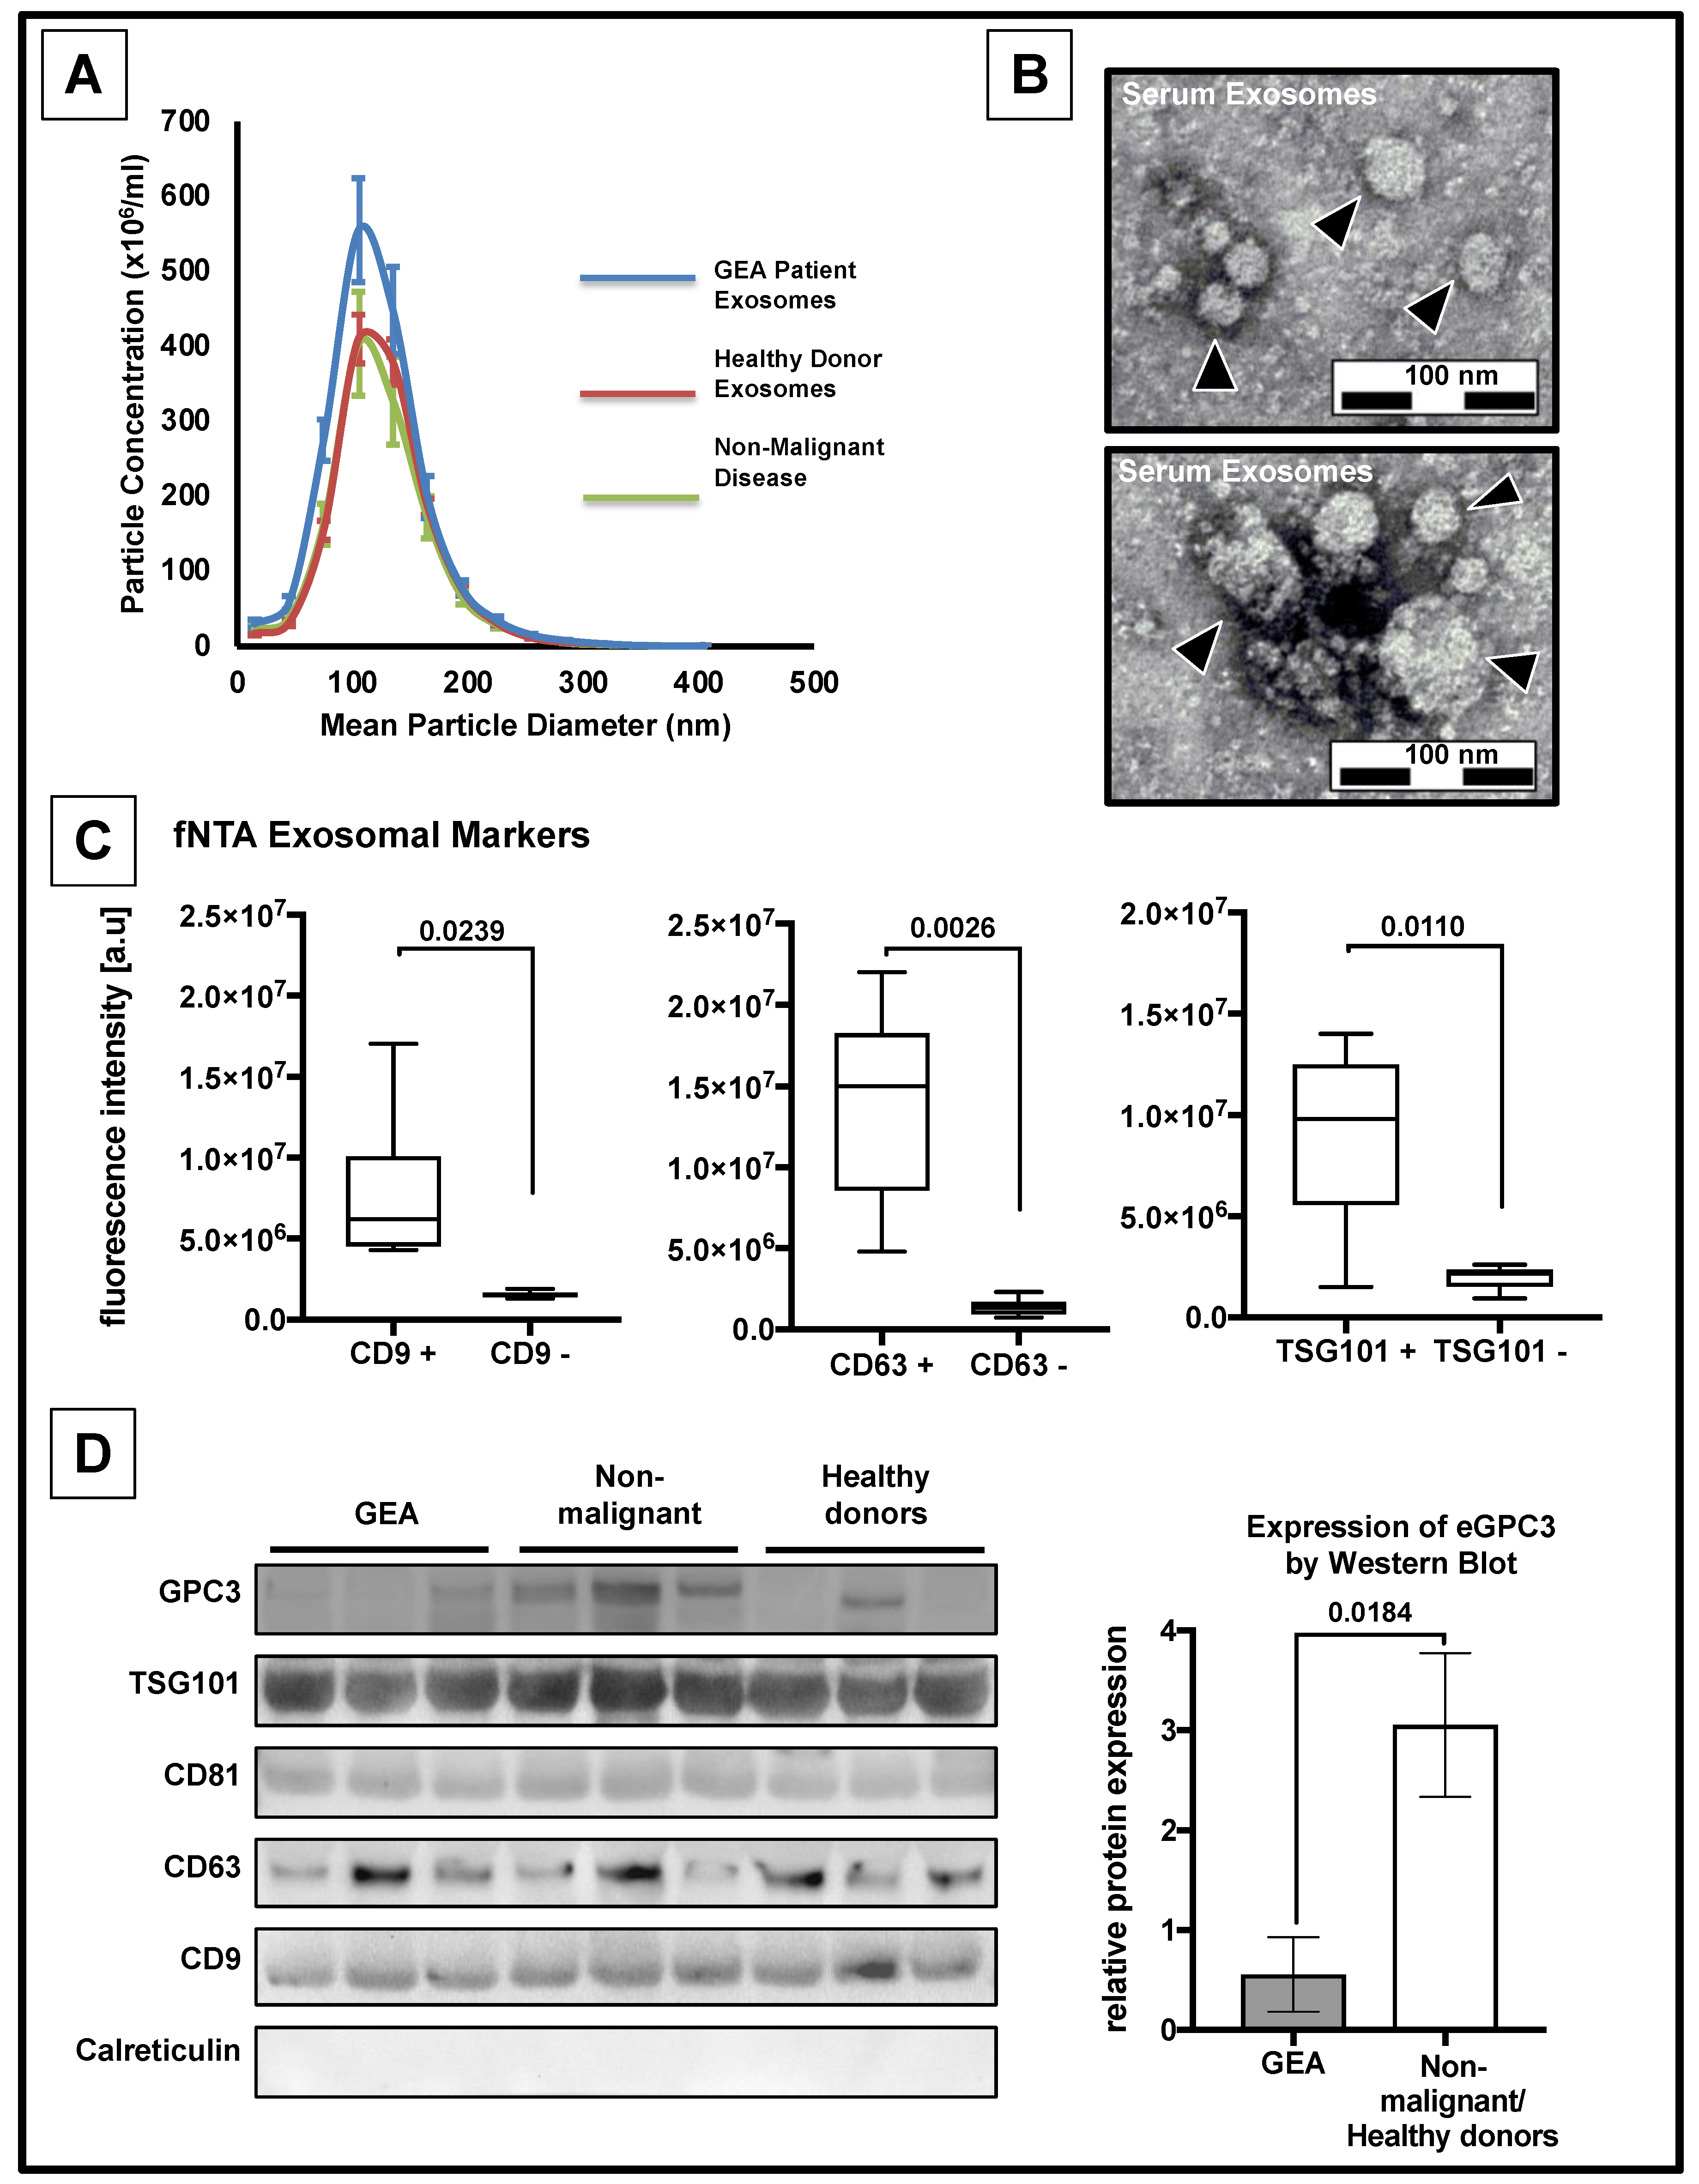
3.2. Confirmation of the Presence of Exosomes
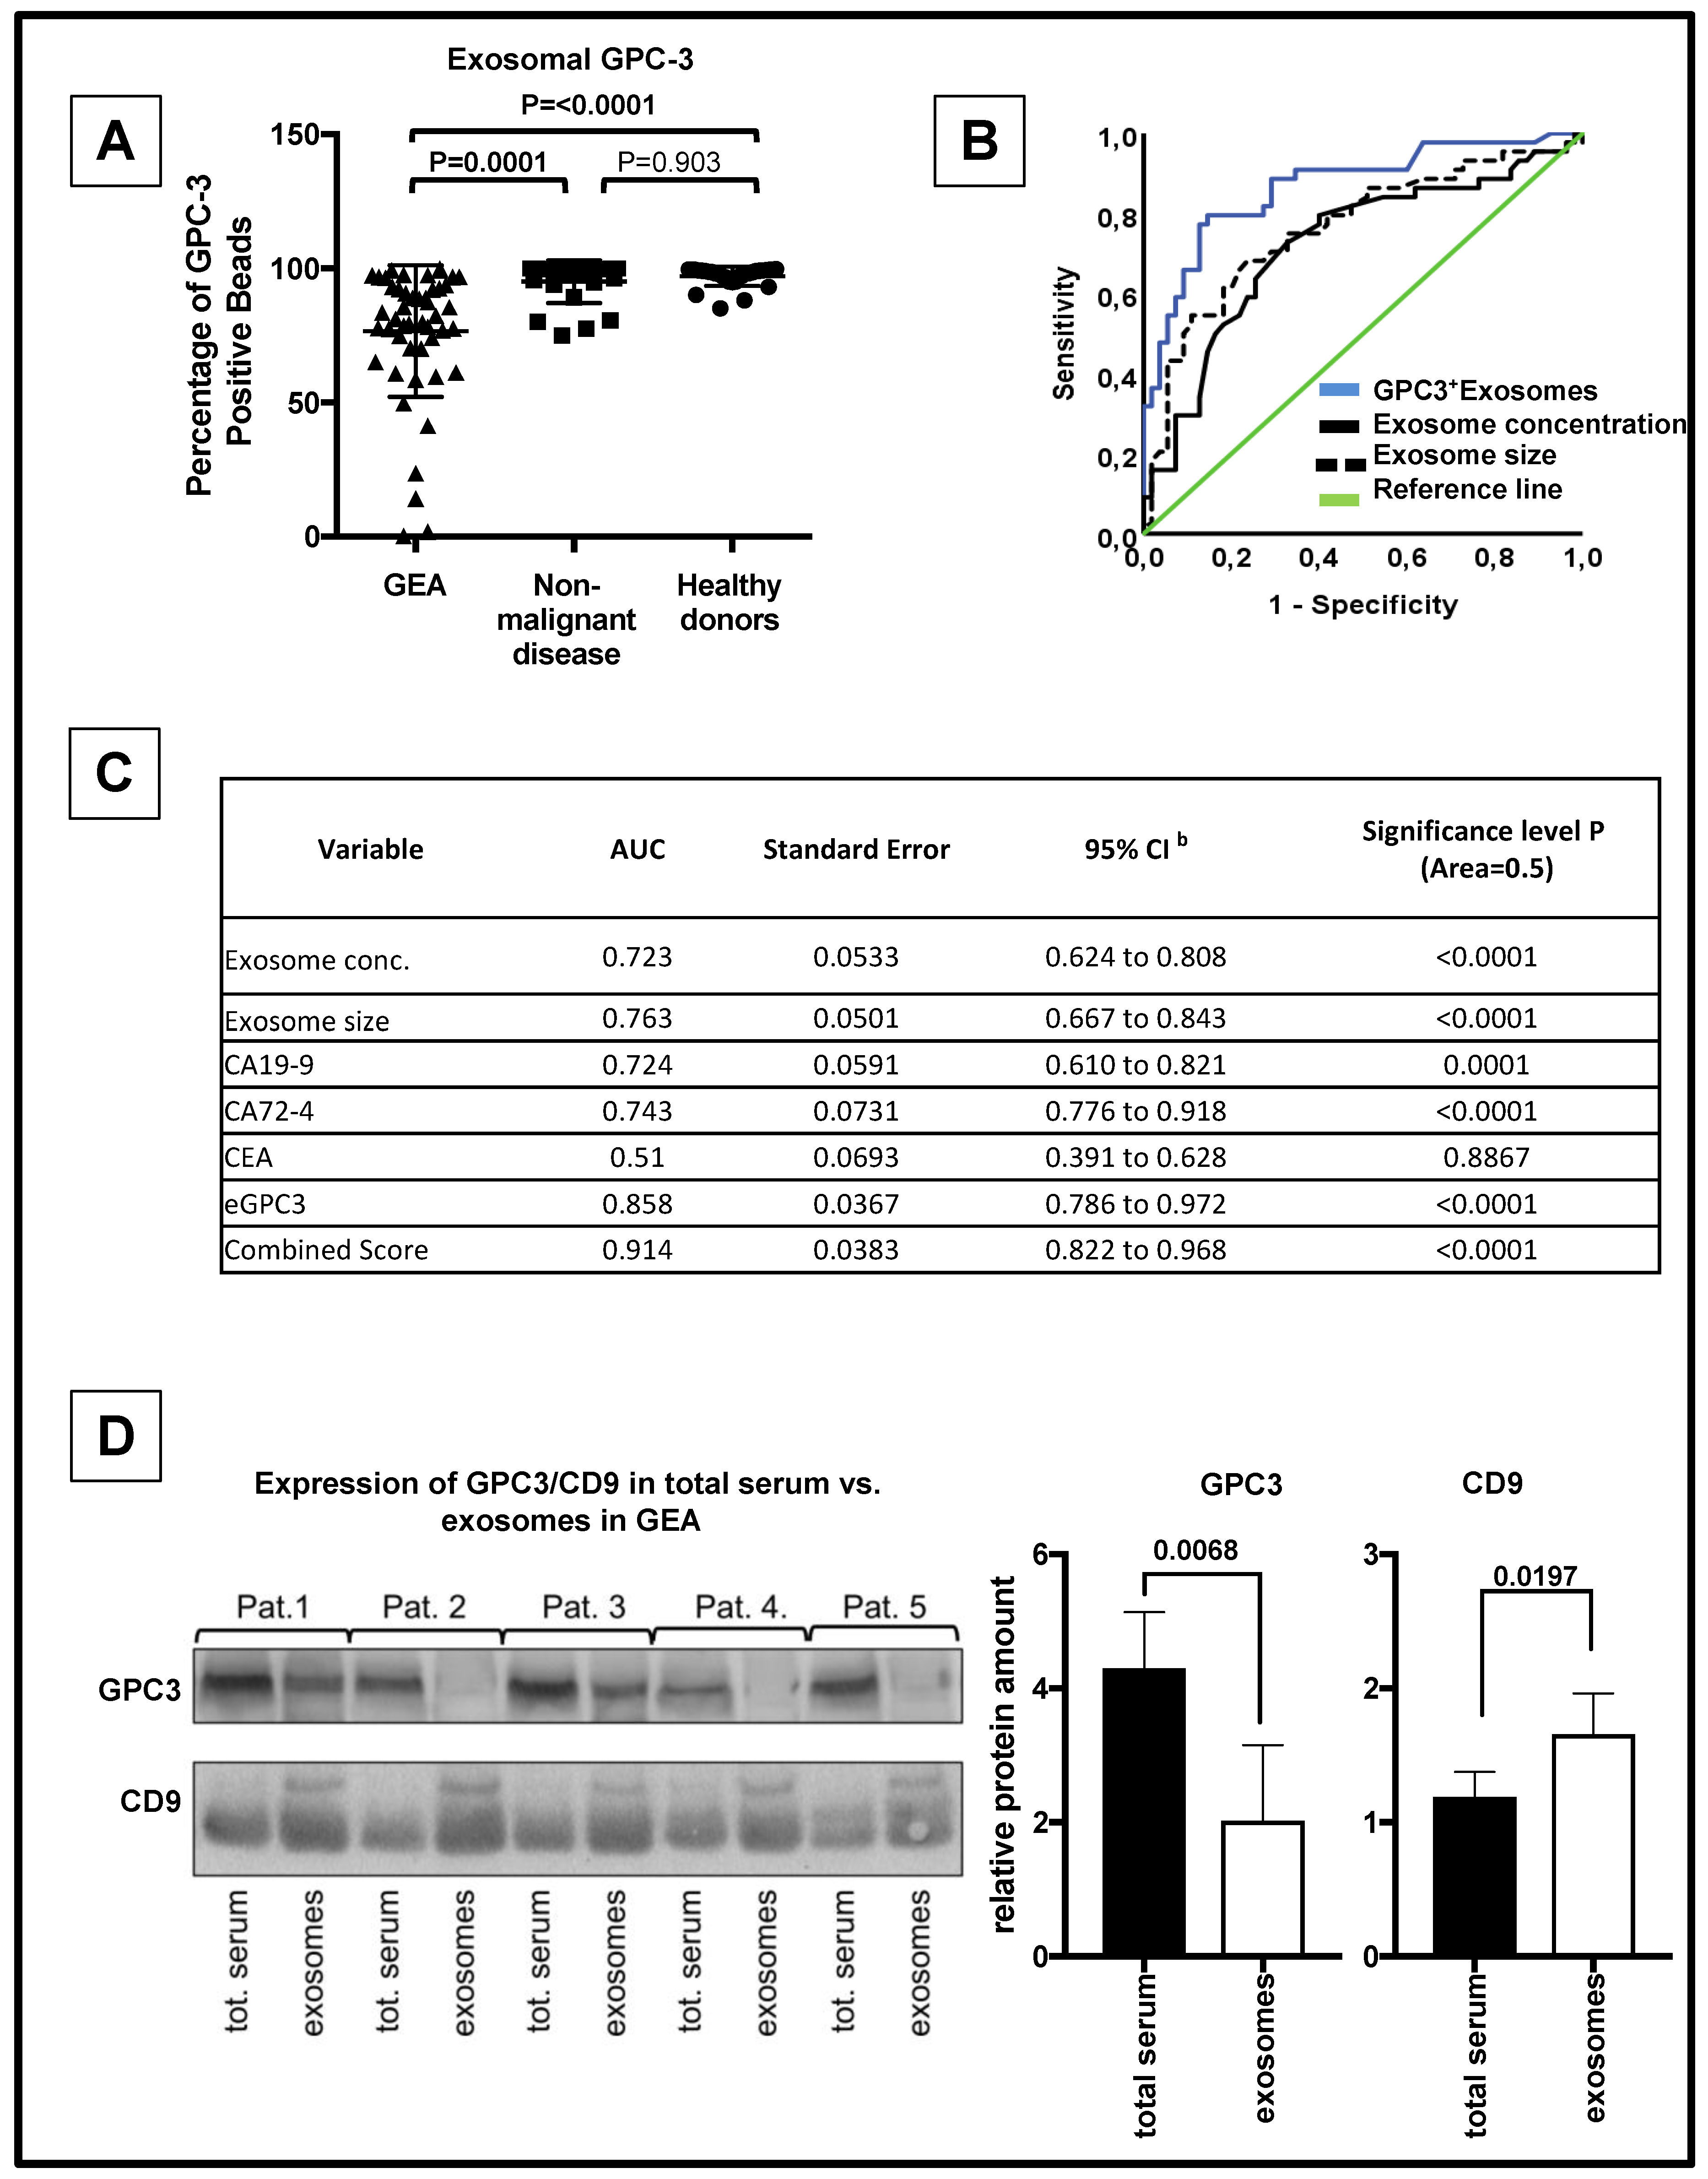
3.3. eGPC3 Outperforms Current Serum Biomarkers of GEA And Negatively Correlates with Overall Survival
3.4. eGPC3 Negatively Correlates with tGPC3 and Is Associated with Dismal Overall Survival
4. Discussion
Supplementary Materials
Author Contributions
Funding
Acknowledgments
Conflicts of Interest
References
- Siegel, R.L.; Miller, K.D.; Jemal, A. Cancer statistics, 2016. CA Cancer J. Clin. 2016, 66, 7–30. [Google Scholar] [CrossRef] [PubMed]
- Ferlay, J.; Steliarova-Foucher, E.; Lortet-Tieulent, J.; Rosso, S.; Coebergh, J.W.W.; Comber, H.; Forman, D.; Bray, F. Cancer incidence and mortality patterns in Europe: Estimates for 40 countries in 2012. Eur. J. Cancer 2013, 49, 1374–1403. [Google Scholar] [CrossRef] [PubMed]
- Van Cutsem, E.; Sagaert, X.; Topal, B.; Haustermans, K.; Prenen, H. Gastric cancer. Lancet 2016, 388, 2654–2664. [Google Scholar] [CrossRef]
- Liu, C.; Yang, Y.; Wu, Y. Recent Advances in Exosomal Protein Detection Via Liquid Biopsy Biosensors for Cancer Screening, Diagnosis, and Prognosis. AAPS J. 2018, 20, 41. [Google Scholar] [CrossRef] [PubMed]
- Siravegna, G.; Marsoni, S.; Siena, S.; Bardelli, A. Integrating liquid biopsies into the management of cancer. Nat. Rev. Clin. Oncol. 2017, 14, 531–548. [Google Scholar] [CrossRef]
- Uchoa Guimaraes, C.T.; Ferreira Martins, N.N.; Cristina da Silva Oliveira, K.; Almeida, C.M.; Pinheiro, T.M.; Gigek, C.O.; Roberto de Araujo Cavallero, S.; Assumpcao, P.P.; Cardoso Smith, M.A.; Burbano, R.R.; et al. Liquid biopsy provides new insights into gastric cancer. Oncotarget 2018, 9, 15144–15156. [Google Scholar] [CrossRef]
- Kim, D.H.; Oh, S.J.; Oh, C.A.; Choi, M.G.; Noh, J.H.; Sohn, T.S.; Bae, J.M.; Kim, S. The relationships between perioperative CEA, CA 19-9, and CA 72-4 and recurrence in gastric cancer patients after curative radical gastrectomy. J. Surg. Oncol. 2011, 104, 585–591. [Google Scholar] [CrossRef]
- Cocucci, E.; Meldolesi, J. Ectosomes and exosomes: Shedding the confusion between extracellular vesicles. Trends Cell Biol. 2015, 25, 364–372. [Google Scholar] [CrossRef]
- Kourembanas, S. Exosomes: Vehicles of intercellular signaling, biomarkers, and vectors of cell therapy. Annu. Rev. Physiol. 2015, 77, 13–27. [Google Scholar] [CrossRef]
- Qu, J.L.; Qu, X.J.; Zhao, M.F.; Teng, Y.E.; Zhang, Y.; Hou, K.Z.; Jiang, Y.H.; Yang, X.H.; Liu, Y.P. Gastric cancer exosomes promote tumour cell proliferation through PI3K/Akt and MAPK/ERK activation. Dig. Liver Dis. 2009, 41, 875–880. [Google Scholar] [CrossRef]
- Ohshima, K.; Inoue, K.; Fujiwara, A.; Hatakeyama, K.; Kanto, K.; Watanabe, Y.; Muramatsu, K.; Fukuda, Y.; Ogura, S.; Yamaguchi, K.; et al. Let-7 microRNA family is selectively secreted into the extracellular environment via exosomes in a metastatic gastric cancer cell line. PLoS ONE 2010, 5, e13247. [Google Scholar] [CrossRef]
- Li, C.; Liu, D.R.; Li, G.G.; Wang, H.H.; Li, X.W.; Zhang, W.; Wu, Y.L.; Chen, L. CD97 promotes gastric cancer cell proliferation and invasion through exosome-mediated MAPK signaling pathway. World J. Gastroenterol. 2015, 21, 6215–6228. [Google Scholar] [CrossRef]
- Pitt, J.M.; Kroemer, G.; Zitvogel, L. Extracellular vesicles: Masters of intercellular communication and potential clinical interventions. J. Clin. Investig. 2016, 126, 1139–1143. [Google Scholar] [CrossRef]
- Roberson, C.D.; Atay, S.; Gercel-Taylor, C.; Taylor, D.D. Tumor-derived exosomes as mediators of disease and potential diagnostic biomarkers. Cancer Biomark. 2010, 8, 281–291. [Google Scholar] [CrossRef]
- Pinho, S.S.; Reis, C.A. Glycosylation in cancer: Mechanisms and clinical implications. Nat. Rev. Cancer 2015, 15, 540–555. [Google Scholar] [CrossRef]
- Christianson, H.C.; Svensson, K.J.; van Kuppevelt, T.H.; Li, J.P.; Belting, M. Cancer cell exosomes depend on cell-surface heparan sulfate proteoglycans for their internalization and functional activity. Proc. Natl. Acad. Sci. USA 2013, 110, 17380–17385. [Google Scholar] [CrossRef]
- Melo, S.A.; Luecke, L.B.; Kahlert, C.; Fernandez, A.F.; Gammon, S.T.; Kaye, J.; LeBleu, V.S.; Mittendorf, E.A.; Weitz, J.; Rahbari, N.; et al. Glypican-1 identifies cancer exosomes and detects early pancreatic cancer. Nature 2015, 523, 177–182. [Google Scholar] [CrossRef]
- Yang, K.S.; Im, H.; Hong, S.; Pergolini, I.; Del Castillo, A.F.; Wang, R.; Clardy, S.; Huang, C.H.; Pille, C.; Ferrone, S.; et al. Multiparametric plasma EV profiling facilitates diagnosis of pancreatic malignancy. Sci. Transl. Med. 2017, 9. [Google Scholar] [CrossRef]
- Lewis, J.M.; Vyas, A.D.; Qiu, Y.; Messer, K.S.; White, R.; Heller, M.J. Integrated Analysis of Exosomal Protein Biomarkers on Alternating Current Electrokinetic Chips Enables Rapid Detection of Pancreatic Cancer in Patient Blood. ACS Nano 2018, 12, 3311–3320. [Google Scholar] [CrossRef]
- Sarrazin, S.; Lamanna, W.C.; Esko, J.D. Heparan sulfate proteoglycans. Cold Spring Harb. Perspect. Biol. 2011, 3. [Google Scholar] [CrossRef]
- Ushiku, T.; Uozaki, H.; Shinozaki, A.; Ota, S.; Matsuzaka, K.; Nomura, S.; Kaminishi, M.; Aburatani, H.; Kodama, T.; Fukayama, M. Glypican 3-expressing gastric carcinoma: Distinct subgroup unifying hepatoid, clear-cell, and alpha-fetoprotein-producing gastric carcinomas. Cancer Sci. 2009, 100, 626–632. [Google Scholar] [CrossRef]
- Ikeda, H.; Sato, Y.; Yoneda, N.; Harada, K.; Sasaki, M.; Kitamura, S.; Sudo, Y.; Ooi, A.; Nakanuma, Y. alpha-Fetoprotein-producing gastric carcinoma and combined hepatocellular and cholangiocarcinoma show similar morphology but different histogenesis with respect to SALL4 expression. Hum. Pathol. 2012, 43, 1955–1963. [Google Scholar] [CrossRef]
- Hishinuma, M.; Ohashi, K.I.; Yamauchi, N.; Kashima, T.; Uozaki, H.; Ota, S.; Kodama, T.; Aburatani, H.; Fukayama, M. Hepatocellular oncofetal protein, glypican 3 is a sensitive marker for alpha-fetoprotein-producing gastric carcinoma. Histopathology 2006, 49, 479–486. [Google Scholar] [CrossRef]
- Kinjo, T.; Taniguchi, H.; Kushima, R.; Sekine, S.; Oda, I.; Saka, M.; Gotoda, T.; Kinjo, F.; Fujita, J.; Shimoda, T. Histologic and immunohistochemical analyses of alpha-fetoprotein--producing cancer of the stomach. Am. J. Surg. Pathol. 2012, 36, 56–65. [Google Scholar] [CrossRef]
- Mounajjed, T.; Zhang, L.; Wu, T.T. Glypican-3 expression in gastrointestinal and pancreatic epithelial neoplasms. Hum. Pathol. 2013, 44, 542–550. [Google Scholar] [CrossRef]
- Zhu, Z.; Friess, H.; Kleeff, J.; Wang, L.; Wirtz, M.; Zimmermann, A.; Korc, M.; Buchler, M.W. Glypican-3 expression is markedly decreased in human gastric cancer but not in esophageal cancer. Am. J. Surg. 2002, 184, 78–83. [Google Scholar] [CrossRef]
- Han, S.; Ma, X.; Zhao, Y.; Zhao, H.; Batista, A.; Zhou, S.; Zhou, X.; Yang, Y.; Wang, T.; Bi, J.; et al. Identification of Glypican-3 as a potential metastasis suppressor gene in gastric cancer. Oncotarget 2016, 7, 44406. [Google Scholar] [CrossRef]
- Costa, J. Glycoconjugates from extracellular vesicles: Structures, functions and emerging potential as cancer biomarkers. Biochim. Biophys. Acta Rev. Cancer 2017, 1868, 157–166. [Google Scholar] [CrossRef]
- McShane, L.M.; Altman, D.G.; Sauerbrei, W.; Taube, S.E.; Gion, M.; Clark, G.M.; Statistics Subcommittee of the, N.C.I.E.W.G.o.C.D. Reporting recommendations for tumor marker prognostic studies (REMARK). J. Natl. Cancer Inst. 2005, 97, 1180–1184. [Google Scholar] [CrossRef]
- Uhlen, M.; Fagerberg, L.; Hallstrom, B.M.; Lindskog, C.; Oksvold, P.; Mardinoglu, A.; Sivertsson, A.; Kampf, C.; Sjostedt, E.; Asplund, A.; et al. Proteomics. Tissue-based map of the human proteome. Science 2015, 347, 1260419. [Google Scholar] [CrossRef]
- Szasz, A.M.; Lanczky, A.; Nagy, A.; Forster, S.; Hark, K.; Green, J.E.; Boussioutas, A.; Busuttil, R.; Szabo, A.; Gyorffy, B. Cross-validation of survival associated biomarkers in gastric cancer using transcriptomic data of 1,065 patients. Oncotarget 2016, 7, 49322–49333. [Google Scholar] [CrossRef]
- The Human Protein Atlas Project; Version: 18.1; Knut & Alice Wallenberg Foundation: Stockholm, Sweden, 2017.
- Kahlert, C.; Melo, S.A.; Protopopov, A.; Tang, J.; Seth, S.; Koch, M.; Zhang, J.; Weitz, J.; Chin, L.; Futreal, A.; et al. Identification of double-stranded genomic DNA spanning all chromosomes with mutated KRAS and p53 DNA in the serum exosomes of patients with pancreatic cancer. J. Biol. Chem. 2014, 289, 3869–3875. [Google Scholar] [CrossRef]
- Gailey, M.P.; Bellizzi, A.M. Immunohistochemistry for the novel markers glypican 3, PAX8, and p40 (DeltaNp63) in squamous cell and urothelial carcinoma. Am. J. Clin. Pathol. 2013, 140, 872–880. [Google Scholar] [CrossRef]
- Moek, K.L.; Fehrmann, R.S.N.; van der Vegt, B.; de Vries, E.G.E.; de Groot, D.J.A. Glypican 3 Overexpression across a Broad Spectrum of Tumor Types Discovered with Functional Genomic mRNA Profiling of a Large Cancer Database. Am. J. Pathol. 2018, 188, 1973–1981. [Google Scholar] [CrossRef]
- Chen, G.; Chen, Y.C.; Reis, B.; Belousov, A.; Jukofsky, L.; Rossin, C.; Muehlig, A.; Xu, C.; Essioux, L.; Ohtomo, T.; et al. Combining expression of GPC3 in tumors and CD16 on NK cells from peripheral blood to identify patients responding to codrituzumab. Oncotarget 2018, 9, 10436–10444. [Google Scholar] [CrossRef]
- Hirabayashi, K.; Kurokawa, S.; Maruno, A.; Yamada, M.; Kawaguchi, Y.; Nakagohri, T.; Mine, T.; Sugiyama, T.; Tajiri, T.; Nakamura, N. Sex differences in immunohistochemical expression and capillary density in pancreatic solid pseudopapillary neoplasm. Ann. Diagn. Pathol. 2015, 19, 45–49. [Google Scholar] [CrossRef]
- Tretiakova, M.; Zynger, D.L.; Luan, C.; Andeen, N.K.; Finn, L.S.; Kocherginsky, M.; Teh, B.T.; Yang, X.J. Glypican 3 overexpression in primary and metastatic Wilms tumors. Virchows Arch. 2015, 466, 67–76. [Google Scholar] [CrossRef]
- Witwer, K.W.; Soekmadji, C.; Hill, A.F.; Wauben, M.H.; Buzas, E.I.; Di Vizio, D.; Falcon-Perez, J.M.; Gardiner, C.; Hochberg, F.; Kurochkin, I.V.; et al. Updating the MISEV minimal requirements for extracellular vesicle studies: Building bridges to reproducibility. J. Extracell. Vesicles 2017, 6, 1396823. [Google Scholar] [CrossRef]
- Lotvall, J.; Hill, A.F.; Hochberg, F.; Buzas, E.I.; Di Vizio, D.; Gardiner, C.; Gho, Y.S.; Kurochkin, I.V.; Mathivanan, S.; Quesenberry, P.; et al. Minimal experimental requirements for definition of extracellular vesicles and their functions: A position statement from the International Society for Extracellular Vesicles. J. Extracell. Vesicles 2014, 3, 26913. [Google Scholar] [CrossRef]
- Pernot, S.; Voron, T.; Perkins, G.; Lagorce-Pages, C.; Berger, A.; Taieb, J. Signet-ring cell carcinoma of the stomach: Impact on prognosis and specific therapeutic challenge. World J. Gastroenterol. 2015, 21, 11428–11438. [Google Scholar] [CrossRef]
- Yamazawa, S.; Ushiku, T.; Shinozaki-Ushiku, A.; Hayashi, A.; Iwasaki, A.; Abe, H.; Tagashira, A.; Yamashita, H.; Seto, Y.; Aburatani, H.; et al. Gastric Cancer With Primitive Enterocyte Phenotype: An Aggressive Subgroup of Intestinal-type Adenocarcinoma. Am. J. Surg. Pathol. 2017, 41, 989–997. [Google Scholar] [CrossRef]
- Aydin, O.; Yildiz, L.; Baris, S.; Dundar, C.; Karagoz, F. Expression of Glypican 3 in low and high grade urothelial carcinomas. Diagn. Pathol. 2015, 10, 34. [Google Scholar] [CrossRef]
- Zhang, J.; Zhang, M.; Ma, H.; Song, X.; He, L.; Ye, X.; Li, X. Overexpression of glypican-3 is a predictor of poor prognosis in hepatocellular carcinoma: An updated meta-analysis. Medicine 2018, 97, e11130. [Google Scholar] [CrossRef]
- Senes, G.; Fanni, D.; Cois, A.; Uccheddu, A.; Faa, G. Intratumoral sampling variability in hepatocellular carcinoma: A case report. World J. Gastroenterol. 2007, 13, 4019–4021. [Google Scholar] [CrossRef]
- Willingham, S.B.; Volkmer, J.P.; Gentles, A.J.; Sahoo, D.; Dalerba, P.; Mitra, S.S.; Wang, J.; Contreras-Trujillo, H.; Martin, R.; Cohen, J.D.; et al. The CD47-signal regulatory protein alpha (SIRPa) interaction is a therapeutic target for human solid tumors. Proc. Natl. Acad. Sci. USA 2012, 109, 6662–6667. [Google Scholar] [CrossRef]
- Kibria, G.; Ramos, E.K.; Lee, K.E.; Bedoyan, S.; Huang, S.; Samaeekia, R.; Athman, J.J.; Harding, C.V.; Lotvall, J.; Harris, L.; et al. A rapid, automated surface protein profiling of single circulating exosomes in human blood. Sci. Rep. 2016, 6, 36502. [Google Scholar] [CrossRef]
- Soysal, S.D.; Muenst, S.; Barbie, T.; Fleming, T.; Gao, F.; Spizzo, G.; Oertli, D.; Viehl, C.T.; Obermann, E.C.; Gillanders, W.E. EpCAM expression varies significantly and is differentially associated with prognosis in the luminal B HER2(+), basal-like, and HER2 intrinsic subtypes of breast cancer. Br. J. Cancer 2013, 108, 1480–1487. [Google Scholar] [CrossRef]
- Rupp, A.K.; Rupp, C.; Keller, S.; Brase, J.C.; Ehehalt, R.; Fogel, M.; Moldenhauer, G.; Marme, F.; Sultmann, H.; Altevogt, P. Loss of EpCAM expression in breast cancer derived serum exosomes: Role of proteolytic cleavage. Gynecol. Oncol. 2011, 122, 437–446. [Google Scholar] [CrossRef]
- Zhu, Z.W.; Friess, H.; Wang, L.; Abou-Shady, M.; Zimmermann, A.; Lander, A.D.; Korc, M.; Kleeff, J.; Buchler, M.W. Enhanced glypican-3 expression differentiates the majority of hepatocellular carcinomas from benign hepatic disorders. Gut 2001, 48, 558–564. [Google Scholar] [CrossRef]
- Liu, J.W.; Zuo, X.L.; Wang, S. Diagnosis accuracy of serum Glypican-3 level in patients with hepatocellular carcinoma and liver cirrhosis: A meta-analysis. Eur. Rev. Med. Pharmacol. Sci. 2015, 19, 3655–3673. [Google Scholar]
- Villarroya-Beltri, C.; Baixauli, F.; Gutierrez-Vazquez, C.; Sanchez-Madrid, F.; Mittelbrunn, M. Sorting it out: Regulation of exosome loading. Semin. Cancer Biol. 2014, 28, 3–13. [Google Scholar] [CrossRef]


| Characteristics | Total Number of Cases | eGPC3 | tGPC3 | ||||
|---|---|---|---|---|---|---|---|
| eGPC3low | eGPC3high | P-Value | tGPC3low | tGPC3high | P-Value | ||
| Age | |||||||
| < median = 63 years | 24 | 15 | 9 | 0.156 | 11 | 13 | 0.778 |
| ≥ median = 63 years | 25 | 10 | 15 | 13 | 12 | ||
| Gender | |||||||
| Male | 34 | 16 | 18 | 0.538 | 18 | 16 | 0.538 |
| Female | 15 | 9 | 6 | 6 | 9 | ||
| Classification of Lauren | |||||||
| Intestinal | 23 | 11 | 12 | 0.342 | 9 | 14 | 0.560 |
| Diffuse | 14 | 8 | 6 | 8 | 6 | ||
| Mixed | 5 | 1 | 4 | 2 | 3 | ||
| Missing | 7 | 5 | 2 | 5 | 2 | ||
| UICC stage | |||||||
| I and II | 37 | 18 | 19 | 0.742 | 20 | 17 | 0.321 |
| III and IV | 12 | 7 | 5 | 4 | 8 | ||
| Tumor size | |||||||
| T1 and T2 | 34 | 16 | 18 | 0.538 | 17 | 17 | 1.000 |
| T3 and T4 | 15 | 9 | 6 | 7 | 8 | ||
| Lymph node status | |||||||
| N0 and N1 | 39 | 9 | 15 | 0.089 | 20 | 19 | 0.572 |
| N2 and N3 | 10 | 16 | 9 | 4 | 6 | ||
| Metastasis status | |||||||
| M0 | 43 | 20 | 23 | 0.189 | 23 | 20 | 0.189 |
| M1 | 6 | 5 | 1 | 1 | 5 | ||
| Resection margin status | |||||||
| R0 | 43 | 20 | 23 | 0.189 | 22 | 21 | 0.667 |
| R1 and R2 | 6 | 5 | 1 | 2 | 4 | ||
| Tumor differentiation | |||||||
| G1 and G2 | 17 | 9 | 8 | 0.751 | 4 | 13 | 0.050 |
| G3 and G4 | 22 | 10 | 12 | 13 | 9 | ||
| CEA | |||||||
| < Median | 21 | 9 | 12 | 0.538 | 12 | 9 | 0.215 |
| > Median | 20 | 11 | 9 | 7 | 13 | ||
| CA 19-9 | |||||||
| < Median | 21 | 11 | 10 | 0.758 | 8 | 13 | 0.354 |
| > Median | 20 | 9 | 11 | 11 | 9 | ||
| CA 72-4 | |||||||
| < Median | 24 | 12 | 12 | 0.732 | 11 | 13 | 0.292 |
| > Median | 12 | 5 | 7 | 3 | 9 | ||
| Adjuvant therapy | |||||||
| Yes | 22 | 13 | 8 | 0.244 | 11 | 16 | 0.244 |
| No | 27 | 11 | 16 | 13 | 8 | ||
| Neoadjuvant therapyes | |||||||
| Yes | 27 | 16 | 11 | 0.256 | 9 | 13 | 0.393 |
| No | 22 | 9 | 13 | 15 | 12 | ||
| Characteristics | 95%-Confidence-Interval | |||||
|---|---|---|---|---|---|---|
| No. of Cases | Mean Survival (Months) | Standard Error | Lower Limit | Upper Limit | P-Value | |
| Adjuvant Chemotherapy | ||||||
| Not received | 27 | 62.6 | 4.3 | 54.2 | 71.0 | 0.386 |
| Received | 22 | 69.6 | 8.4 | 53.1 | 86.1 | |
| Neoadjuvant Chemotherapy | ||||||
| Not received | 22 | 78.1 | 7.3 | 63.8 | 92.4 | 0.746 |
| Received | 27 | 68.8 | 6.5 | 56.1 | 81.4 | |
| Lymph node status | ||||||
| Negative | 24 | 87.9 | 4.0 | 80.0 | 95.8 | 0.014 |
| Positive | 25 | 56.2 | 7.4 | 41.6 | 70.7 | |
| Tumor size | ||||||
| T1 and T2 | 34 | 83.1 | 4.8 | 73.7 | 92.4 | 0.003 |
| T3 and T4 | 15 | 38.7 | 7.1 | 24.7 | 52.6 | |
| M stage | ||||||
| M0 | 43 | 76.2 | 5.3 | 65.8 | 86.6 | 0.003 |
| M1 | 6 | 9.7 | 0.000 | 9.7 | 9.7 | |
| L stage | ||||||
| L0 | 27 | 87.2 | 4.4 | 78.6 | 95.7 | 0.003 |
| L1 | 20 | 52.5 | 8.9 | 35.0 | 70.0 | |
| V stage | ||||||
| V0 | 39 | 81.6 | 4.8 | 72.3 | 91.0 | 0.001 |
| V1 | 8 | 26.4 | 7.1 | 12.5 | 40.2 | |
| Tumor differentiation | ||||||
| G1 and G2 | 17 | 70.4 | 6.2 | 58.3 | 82.6 | 0.432 |
| G3 and G4 | 22 | 71.1 | 8.0 | 55.4 | 86.8 | |
| UICC stage | ||||||
| I and II | 37 | 76.4 | 5.7 | 65.2 | 87.5 | 0.392 |
| III and IV | 12 | 46.7 | 8.1 | 30.7 | 62.6 | |
| Resection status | ||||||
| R0 | 43 | 77.8 | 5.2 | 67.50 | 88.0 | 0.009 |
| R1 and R2 | 6 | 24.0 | 8.6 | 7.1 | 40.9 | |
| eGPC3 | ||||||
| Low | 25 | 60.9 | 7.4 | 46.4 | 75.4 | 0.041 |
| High | 24 | 87.4 | 4.5 | 78.6 | 96.2 | |
| tGPC3 | ||||||
| Low | 24 | 84.7 | 4.9 | 75.0 | 94.4 | 0.044 |
| High | 25 | 58.0 | 8.2 | 41.9 | 74.2 | |
| Characteristics | 95%-Confidence-Interval | ||||
|---|---|---|---|---|---|
| Category | P-Value | Hazard Ratio | Lower | Upper | |
| eGPC3 | High vs. low | 0.361 | 0.306 | 0.024 | 3.890 |
| tGPC3 | High vs. low | 0.026 | 30.334 | 1.497 | 614.752 |
| N | N0 vs. N+ | 0.781 | 0.635 | 0.026 | 15.587 |
| M | M0 vs. M1 | 0.992 | 0.000 | 0.000 | 0.000 |
| L | L0 vs. L1 | 0.016 | 68.320 | 2.204 | 2118.091 |
| V | V0 vs. V1 | 0.473 | 0.462 | 0.056 | 3.816 |
| R | R0 vs. R+ | 0.158 | 13.888 | 0.359 | 537.946 |
© 2019 by the authors. Licensee MDPI, Basel, Switzerland. This article is an open access article distributed under the terms and conditions of the Creative Commons Attribution (CC BY) license (http://creativecommons.org/licenses/by/4.0/).
Share and Cite
Rahbari, M.; Pecqueux, M.; Aust, D.; Stephan, H.; Tiebel, O.; Chatzigeorgiou, A.; Tonn, T.; Baenke, F.; Rao, V.; Ziegler, N.; et al. Expression of Glypican 3 Is an Independent Prognostic Biomarker in Primary Gastro-Esophageal Adenocarcinoma and Corresponding Serum Exosomes. J. Clin. Med. 2019, 8, 696. https://doi.org/10.3390/jcm8050696
Rahbari M, Pecqueux M, Aust D, Stephan H, Tiebel O, Chatzigeorgiou A, Tonn T, Baenke F, Rao V, Ziegler N, et al. Expression of Glypican 3 Is an Independent Prognostic Biomarker in Primary Gastro-Esophageal Adenocarcinoma and Corresponding Serum Exosomes. Journal of Clinical Medicine. 2019; 8(5):696. https://doi.org/10.3390/jcm8050696
Chicago/Turabian StyleRahbari, Mohammad, Mathieu Pecqueux, Daniela Aust, Holger Stephan, Oliver Tiebel, Antonios Chatzigeorgiou, Torsten Tonn, Franziska Baenke, Venkatesh Rao, Nicole Ziegler, and et al. 2019. "Expression of Glypican 3 Is an Independent Prognostic Biomarker in Primary Gastro-Esophageal Adenocarcinoma and Corresponding Serum Exosomes" Journal of Clinical Medicine 8, no. 5: 696. https://doi.org/10.3390/jcm8050696
APA StyleRahbari, M., Pecqueux, M., Aust, D., Stephan, H., Tiebel, O., Chatzigeorgiou, A., Tonn, T., Baenke, F., Rao, V., Ziegler, N., Greif, H., Lin, K., Weitz, J., Rahbari, N. N., & Kahlert, C. (2019). Expression of Glypican 3 Is an Independent Prognostic Biomarker in Primary Gastro-Esophageal Adenocarcinoma and Corresponding Serum Exosomes. Journal of Clinical Medicine, 8(5), 696. https://doi.org/10.3390/jcm8050696