Cranio-Facial Characteristics in Children with Autism Spectrum Disorders (ASD)

 ,
,  , and
, and 
Abstract
1. Introduction
2. Material and Methods
2.1. Subjects
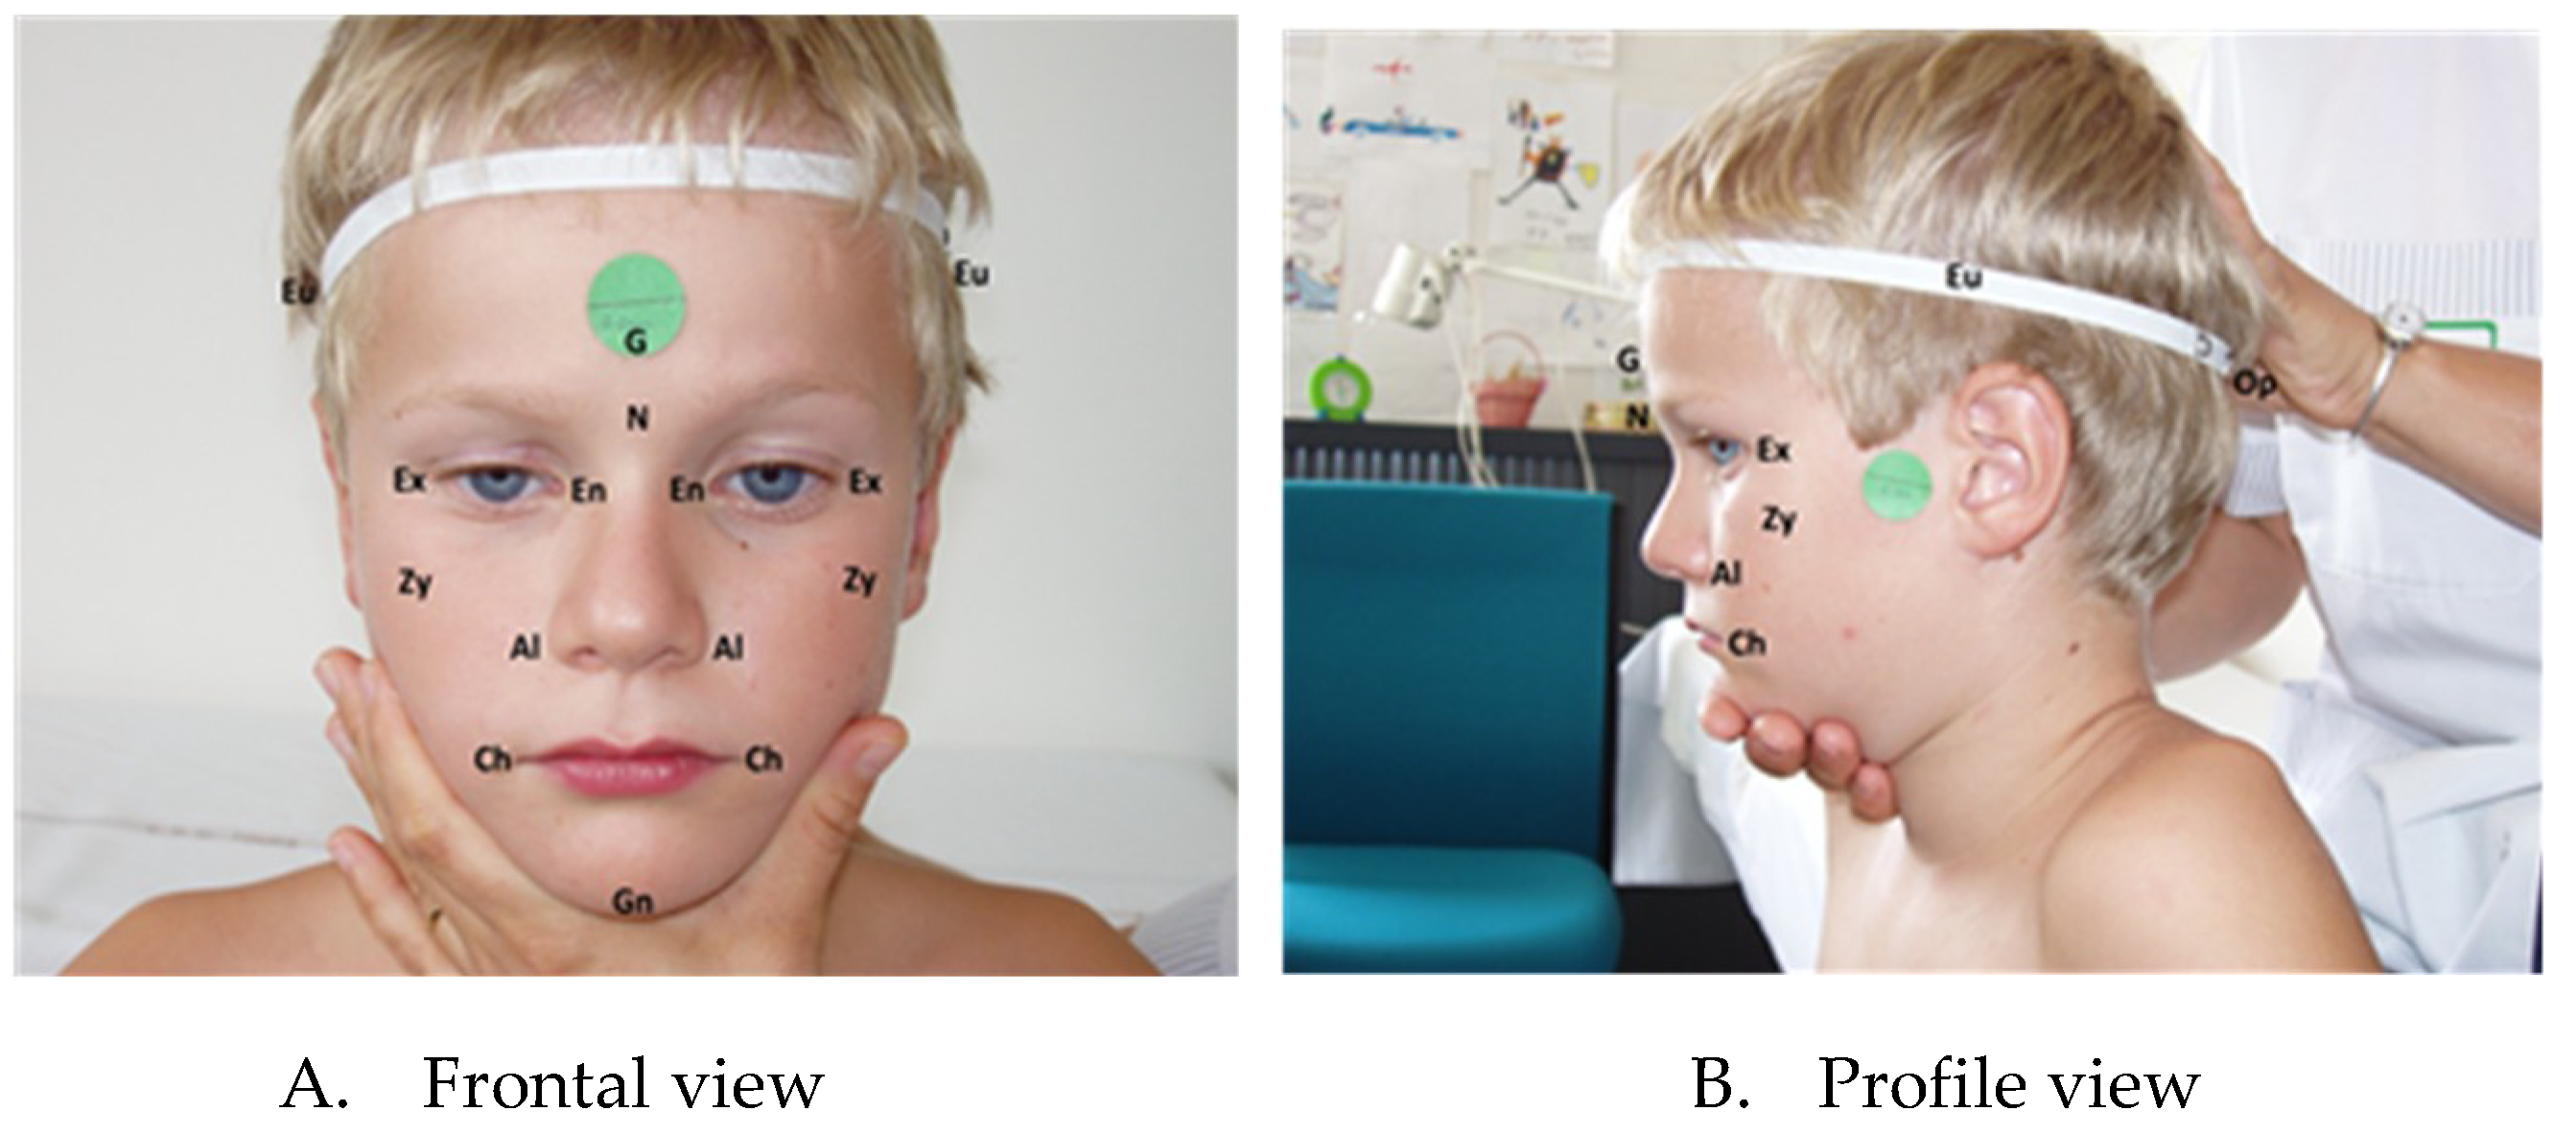
2.2. Measurements
3. Statistical Methods
4. Results
5. Discussion
Author Contributions
Acknowledgments
Conflicts of Interest
References
- Rodier, P.M.; Bryson, S.E.; Welch, J.P. Minor Malformations and Physical Measurements in Autism: Data from Nova Scotia. Teratology 1997, 55, 319–325. [Google Scholar] [CrossRef]
- Waldrop, M.F.; Pederson, F.A.; Bell, R.Q. Minor Physical Anomalies and Behavior in Preschool Children. Child Dev. 1968, 39, 391–400. [Google Scholar] [CrossRef]
- Ozgen, H.M.; Hop, J.W.; Hox, J.J.; Beemer, F.A.; Van Engeland, H. Minor Physical Anomalies in Autism: A Meta-Analysis. Mol. Psychiatry 2010, 15, 300–307. [Google Scholar] [CrossRef][Green Version]
- Tripi, G.; Roux, S.; Canziani, T.; Bonnet Brilhault, F.; Barthélémy, C.; Canziani, F. Minor Physical Anomalies in Children with Autism Spectrum Disorder. Early Hum. Dev. 2008, 84, 217–223. [Google Scholar] [CrossRef]
- Cheung, C.; McAlonan, G.M.; Fung, Y.Y.; Fung, G.; Yu, K.K.; Tai, K.S.; Sham, P.C.; Chua, S.E. MRI Study of Minor Physical Anomaly in Childhood Autism Implicates Aberrant Neurodevelopment in Infancy. PLoS ONE 2011, 6, e20246. [Google Scholar] [CrossRef]
- Aldridge, K.; George, I.D.; Cole, K.K.; Austin, J.R.; Takahashi, T.N.; Duan, Y.; Miles, J.H. Facial Phenotypes in Subgroups of Prepubertal Boys with Autism Spectrum Disorders are Correlated with Clinical Phenotypes. Mol. Autism 2011, 2, 15. [Google Scholar] [CrossRef]
- Obafemi-Ajayi, T.; Miles, J.H.; Takahashi, T.N.; Qi, W.; Aldridge, K.; Zhang, M.; Xin, S.Q.; He, Y.; Duan, Y. Facial Structure Analysis Separates Autism Spectrum Disorders into Meaningful Clinical Subgroups. J. Autism Dev. Disord. 2015, 45, 1302–1317. [Google Scholar] [CrossRef]
- Boutrus, M.; Maybery, M.T.; Alvares, G.A.; Tan, D.W.; Varcin, K.J. Whitehouse AJO Investigating Facial Phenotype in Autism Spectrum Conditions: The Importance of a Hypothesis Driven Approach. Autism Res. 2017, 10, 1910–1918. [Google Scholar] [CrossRef] [PubMed]
- Feingold, M.; Bossert, W.H. Normal Values for Selected Physical Parameters: An Aid to Syndrome Delineation. Birth Defects Orig. Artic. Ser. 1974, 13, 1–15. [Google Scholar]
- Farkas, L.G.; Munro, I.R.; Kolar, J.C. Anthropometric Facial Proportions in Medicine; Charles Thomas Publisher Ltd.: Springfield, IL, USA, 1987. [Google Scholar]
- Lord, C.; Rutter, M.; Le Couteur, A. Autism Diagnostic Interview-Revised: A Revised Version of a Diagnostic Interview for Caregivers of Individuals with Possible Pervasive Developmental Disorders. J. Autism Dev. Disord. 1994, 24, 659–685. [Google Scholar] [CrossRef] [PubMed]
- Schopler, E.; Reichler, R.J.; Renner, B.R. The Childhood Autism Rating Scale (CARS); Western Psychological Services: Los Angeles, CA, USA, 1988. [Google Scholar]
- Wechsler, D. Wechsler Intelligence Scale for Children, 3rd ed.; The Psychological Corporation: San Antonio, TX, USA, 1991. [Google Scholar]
- Hall, G.H.; Froster, U.G.; Allanson, J.E. Handbook of Normal Physical Measurements; Oxford Medical Publications; Oxford University Press: Evans Road Cary, NC, USA, 1989. [Google Scholar]
- Militerni, R.; Bravaccio, C.; Falco, C.; Fico, C. Palermo MT Repetitive Behaviors in Autistic Disorder. Eur. Child Adolesc. Psychiatry 2002, 11, 210–218. [Google Scholar] [CrossRef]
- McAlonan, G.M.; Li, Q.; Cheung, C. The Timing and Specificity of Prenatal Immune Risk Factors for Autism Modeled in the Mouse and Relevance to Schizophrenia. Neurosignals 2010, 18, 129–139. [Google Scholar] [CrossRef]
- Miles, J.H.; Hillman, R.E. Value of a Clinical Morphology Examination in Autism. Am. J. Med. Genet. 2000, 91, 245–253. [Google Scholar] [CrossRef]
- Gray, D.L.; Songster, G.S.; Parvin, C.A. Cephalic Index: A Gestational Age-Dependant Biometric Parameter. Obstet. Gynecol. 1989, 74, 600–603. [Google Scholar]
- Rajlakshmi, C.H.; Shyamo, S.M.; Bidhumukhi, T.H.; Chandramani, S.L. Cephalic Index of Foetuses of Manipuri Population—A Baseline Study. J. Anat. Soc. India 2001, 50, 8–10. [Google Scholar]
- Bonnet-Brilhault, F.; Rajerison, T.A.; Paillet, C.; Guimard-Brunault, M.; Saby, A.; Ponson, L.; Tripi, G.; Malvy, J.; Roux, S. Autism is a Prenatal Disorder: Evidence from Late Gestation Brain Overgrowth. Autism Res. 2018, 11, 1635–1642. [Google Scholar] [CrossRef] [PubMed]
- Sacco, R.; Gabriele, S.; Persico, A.M. Head Circumference and Brain Size in Autism Spectrum Disorder: A Systematic Review and Meta-Analysis. Psychiatry Res. 2015, 234, 239–251. [Google Scholar] [CrossRef] [PubMed]
- Miles, J.H. Autism Subgroups from a Medical Genetics Perspective. In Autism Spectrum Disorders; Amaral, D.G., Dawson, G., Geschwind, D.H., Eds.; Oxford University Press: New York, NY, USA; pp. 705–721.
- Walker, H.A. Incidence Ofminor Physical Anomaly in Autism. J. Autism Child. Schizophr. 1977, 7, 165–176. [Google Scholar] [CrossRef] [PubMed]
- Ozgen, H.; Hellemann, G.S.; Stellato, R.K.; Lahuis, B.; Van Daalen, E.; Staal, W.G.; Rozendal, M.; Hennekam, R.C.; Beemer, F.A.; van Engeland, H. Morphological Features in Children with Autism Spectrum Disorders: A Matched Case–Control Study. J. Autism Dev. Disord. 2011, 41, 23–31. [Google Scholar] [CrossRef]
- Mosconi, M.W.; Cody-Hazlett, H.; Poe, M.D.; Gerig, G.; Gimpel-Smith, R.; Piven, J. Longitudinal Study of Amygdala Volume and Joint Attention in 2- to 4-Year-Old Children with Autism. Arch. Gen. Psychiatry 2009, 66, 509–516. [Google Scholar] [CrossRef]
- Schumann, C.M.; Barnes, C.C.; Lord, C.; Courchesne, E. Amygdala Enlargement in Toddlers with Autism Related to Severity of Social and Communication Impairments. Biol. Psychiatry 2009, 66, 942–949. [Google Scholar] [CrossRef] [PubMed]
- Odriozola, P.; Dajani, D.R.; Burrows, C.A.; Gabard-Durnam, L.J.; Goodman, E.; Baez, A.C.; Tottenham, N.; Uddin, L.Q.; Gee, D.G. Atypical Frontoamygdala Functional Connectivity in Youth with Autism. Dev. Cogn. Neurosci. 2018, 7, 100603. [Google Scholar] [CrossRef]
- Hardan, A.Y.; Keshavan, M.S.; Sreedhar, S.; Vemulapalli, M.; Minshew, N.J. An MRI Study of Minor Physical Anomalies in Autism. J. Autism Dev. Disord. 2006, 36, 607–611. [Google Scholar] [PubMed]
- Angkustsiri, K.; Krakowiak, P.; Moghaddam, B.; Wardinsky, T.; Gardner, J.; Kalamkarian, N.; Hertz-Picciotto, I.; Hansen, R.L. Minor Physical Anomalies in Children with Autism Spectrum Disorders. Autism 2011, 15, 746–760. [Google Scholar] [CrossRef]
- Engels, H.; Brockschmidt, A.; Hoischen, A.; Landwehr, C.; Bosse, K.; Walldorf, C.; Toedt, G.; Radlwimmer, B.; Propping, P.; Lichter, P.; et al. DNA Microarray Analysis Identifies Candidate Regions and Genes in Unexplained Mental Retardation. Neurology 2007, 68, 743–750. [Google Scholar] [CrossRef] [PubMed]


| Linear Measurements & Landmarks | Index Subnormal | Index Supernormal |
|---|---|---|
| Cephalic Index = eu-eu × 100/g-op | head narrow for its length | head wide for its length |
| Facial Index = n-ng × 100/zy-zy | face short for its width | face long for its width |
| Interchantal Index = en-en × 100/ex-ex | orbital hypotelorism | orbital hypertelorism |
| Nasal Index = al-al × 100/n-sn | nose narrow for its height | nose wide for its height |
| Facial-Mouth Width Index = ch-ch × 100/zy-zy | mouth narrow for face width | mouth wide for face width |
| Demographic and Clinical Variables | Anthropometric Variables | ||||
|---|---|---|---|---|---|
| Mean ± SD | Mean ± SD | z-score | Counts within Normal Range (%) | ||
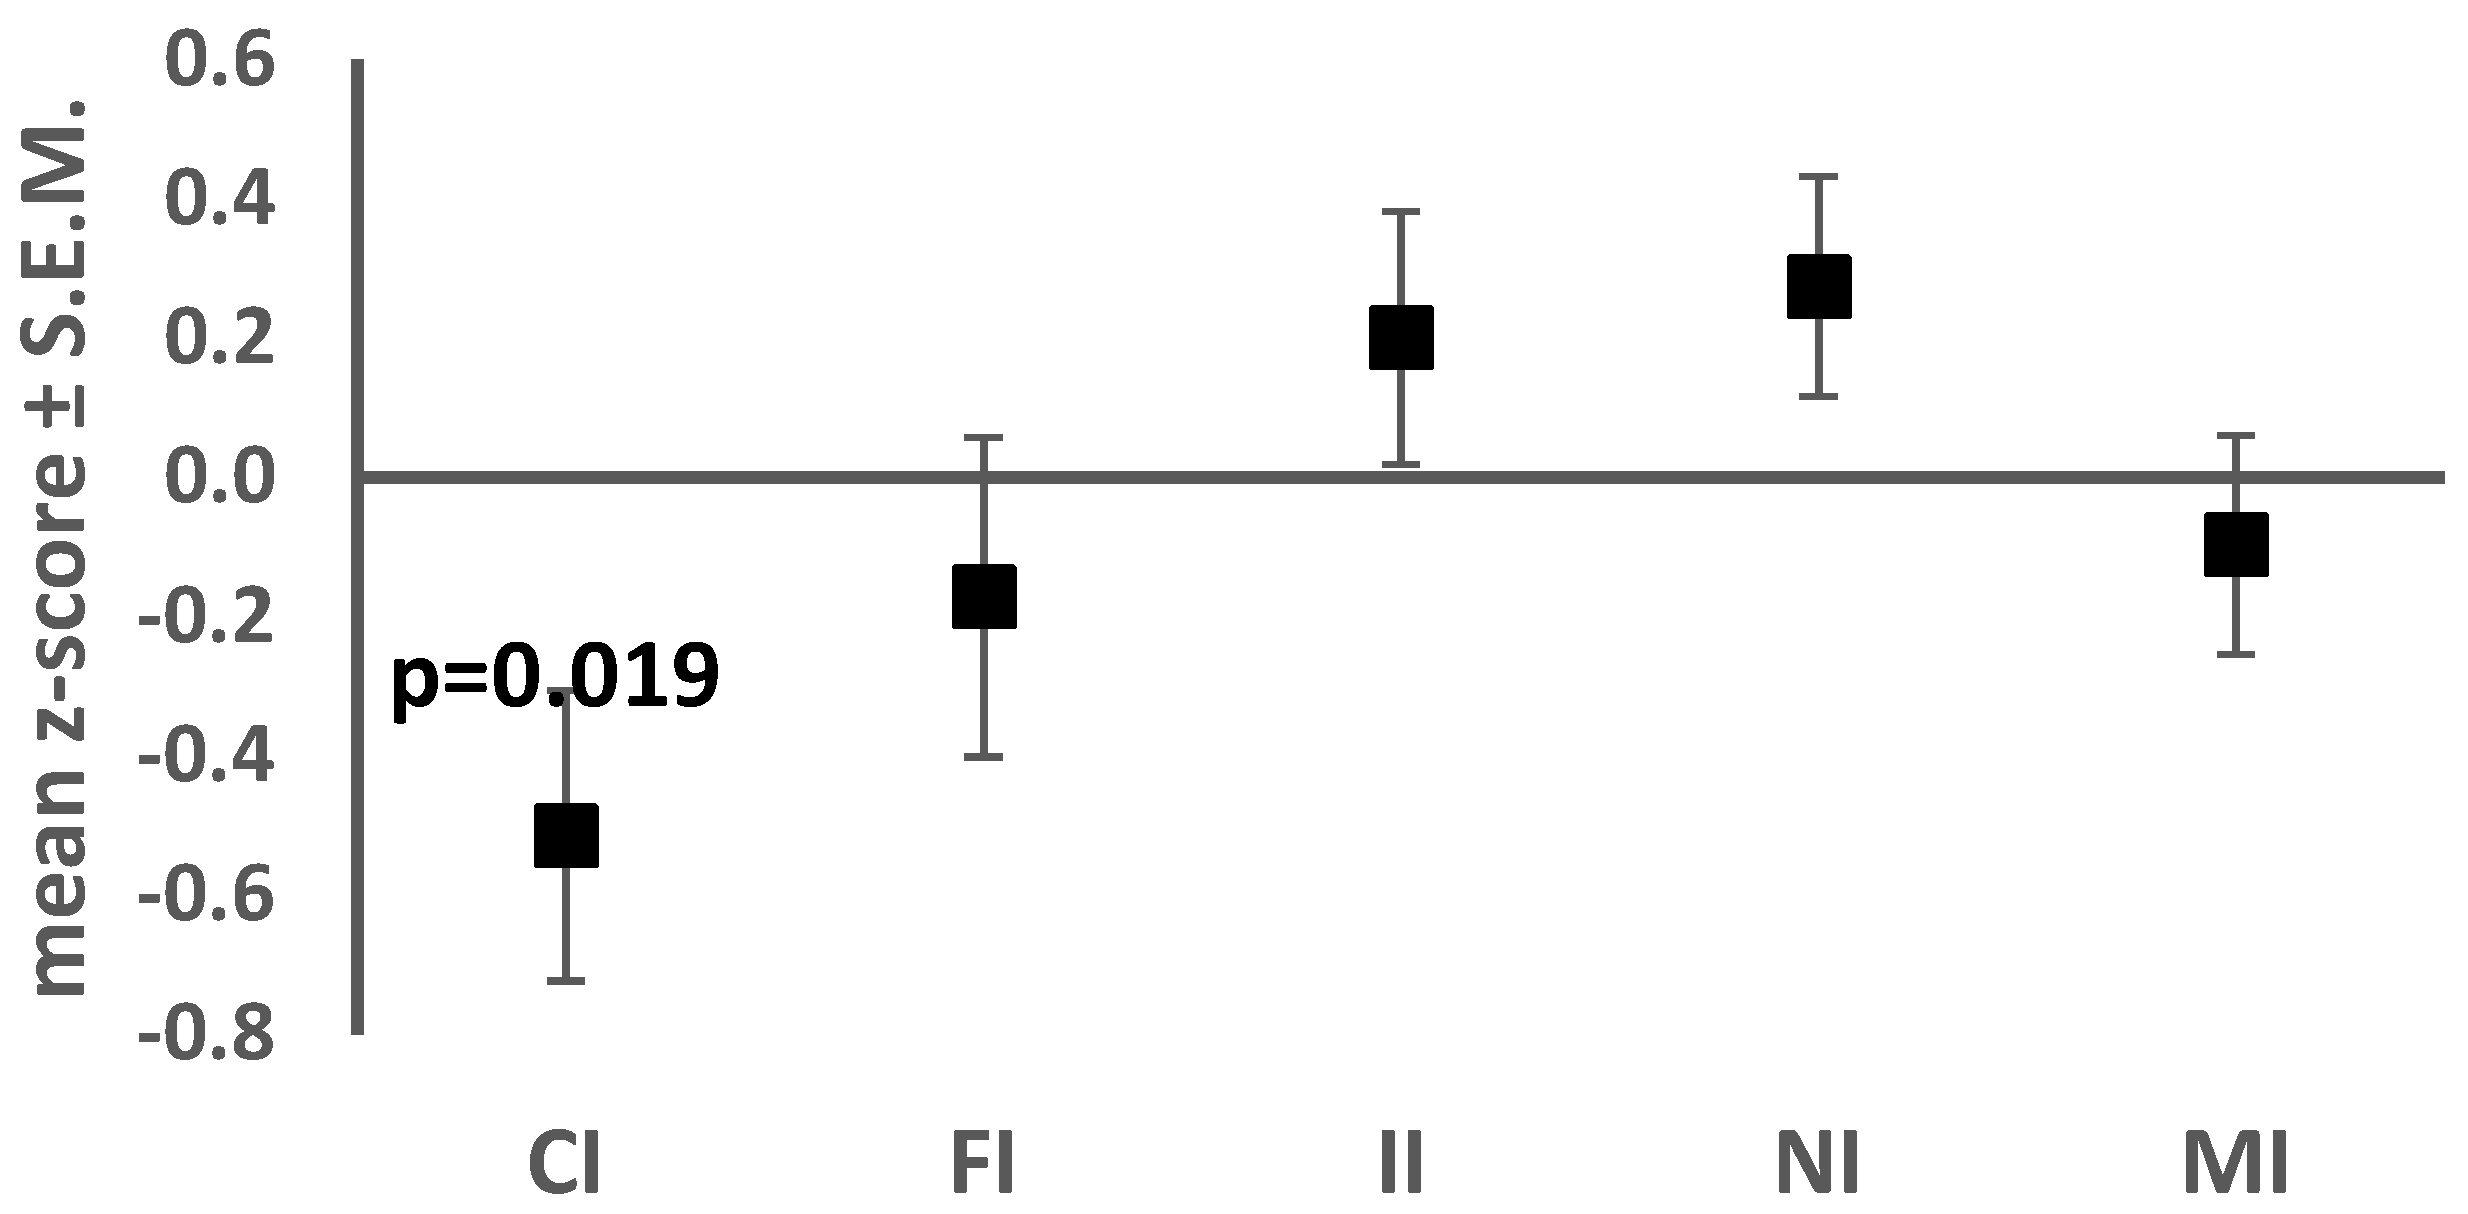
| Age in months | 91.5 ± 26.7 | Cephalic Index | 74.2 ± 5.1 | −0.51 ± 1.20 | 25 (75.8) |
| CARS | 30.4 ± 5.3 | Facial Index | 83.9 ± 6.6 | −0.17 ± 1.32 | 23 (69.7) |
| Global IQ | 59.9 ± 24.2 | Interchantal index | 38.7 ± 2.2 | 0.20 ± 1.04 | 30 (90.9) |
| Verbal IQ | 50 ± 24.4 | Nasal Index | 72.5 ± 5.9 | 0.27 ± 0.91 | 30 (90.9) |
| Non-verbal IQ | 70 ± 26.8 | Mouth-face Index | 36.7 ± 2.1 | −0.09 ± 0.90 | 31 (93.9) |
| Age | CARS | Global IQ | ||||
|---|---|---|---|---|---|---|
| r | p Value | r | p Value | R | p Value | |
| Cephalic Index z-score | 0.330 | 0.061 | 0.316 | 0.073 | −0.232 | 0.195 |
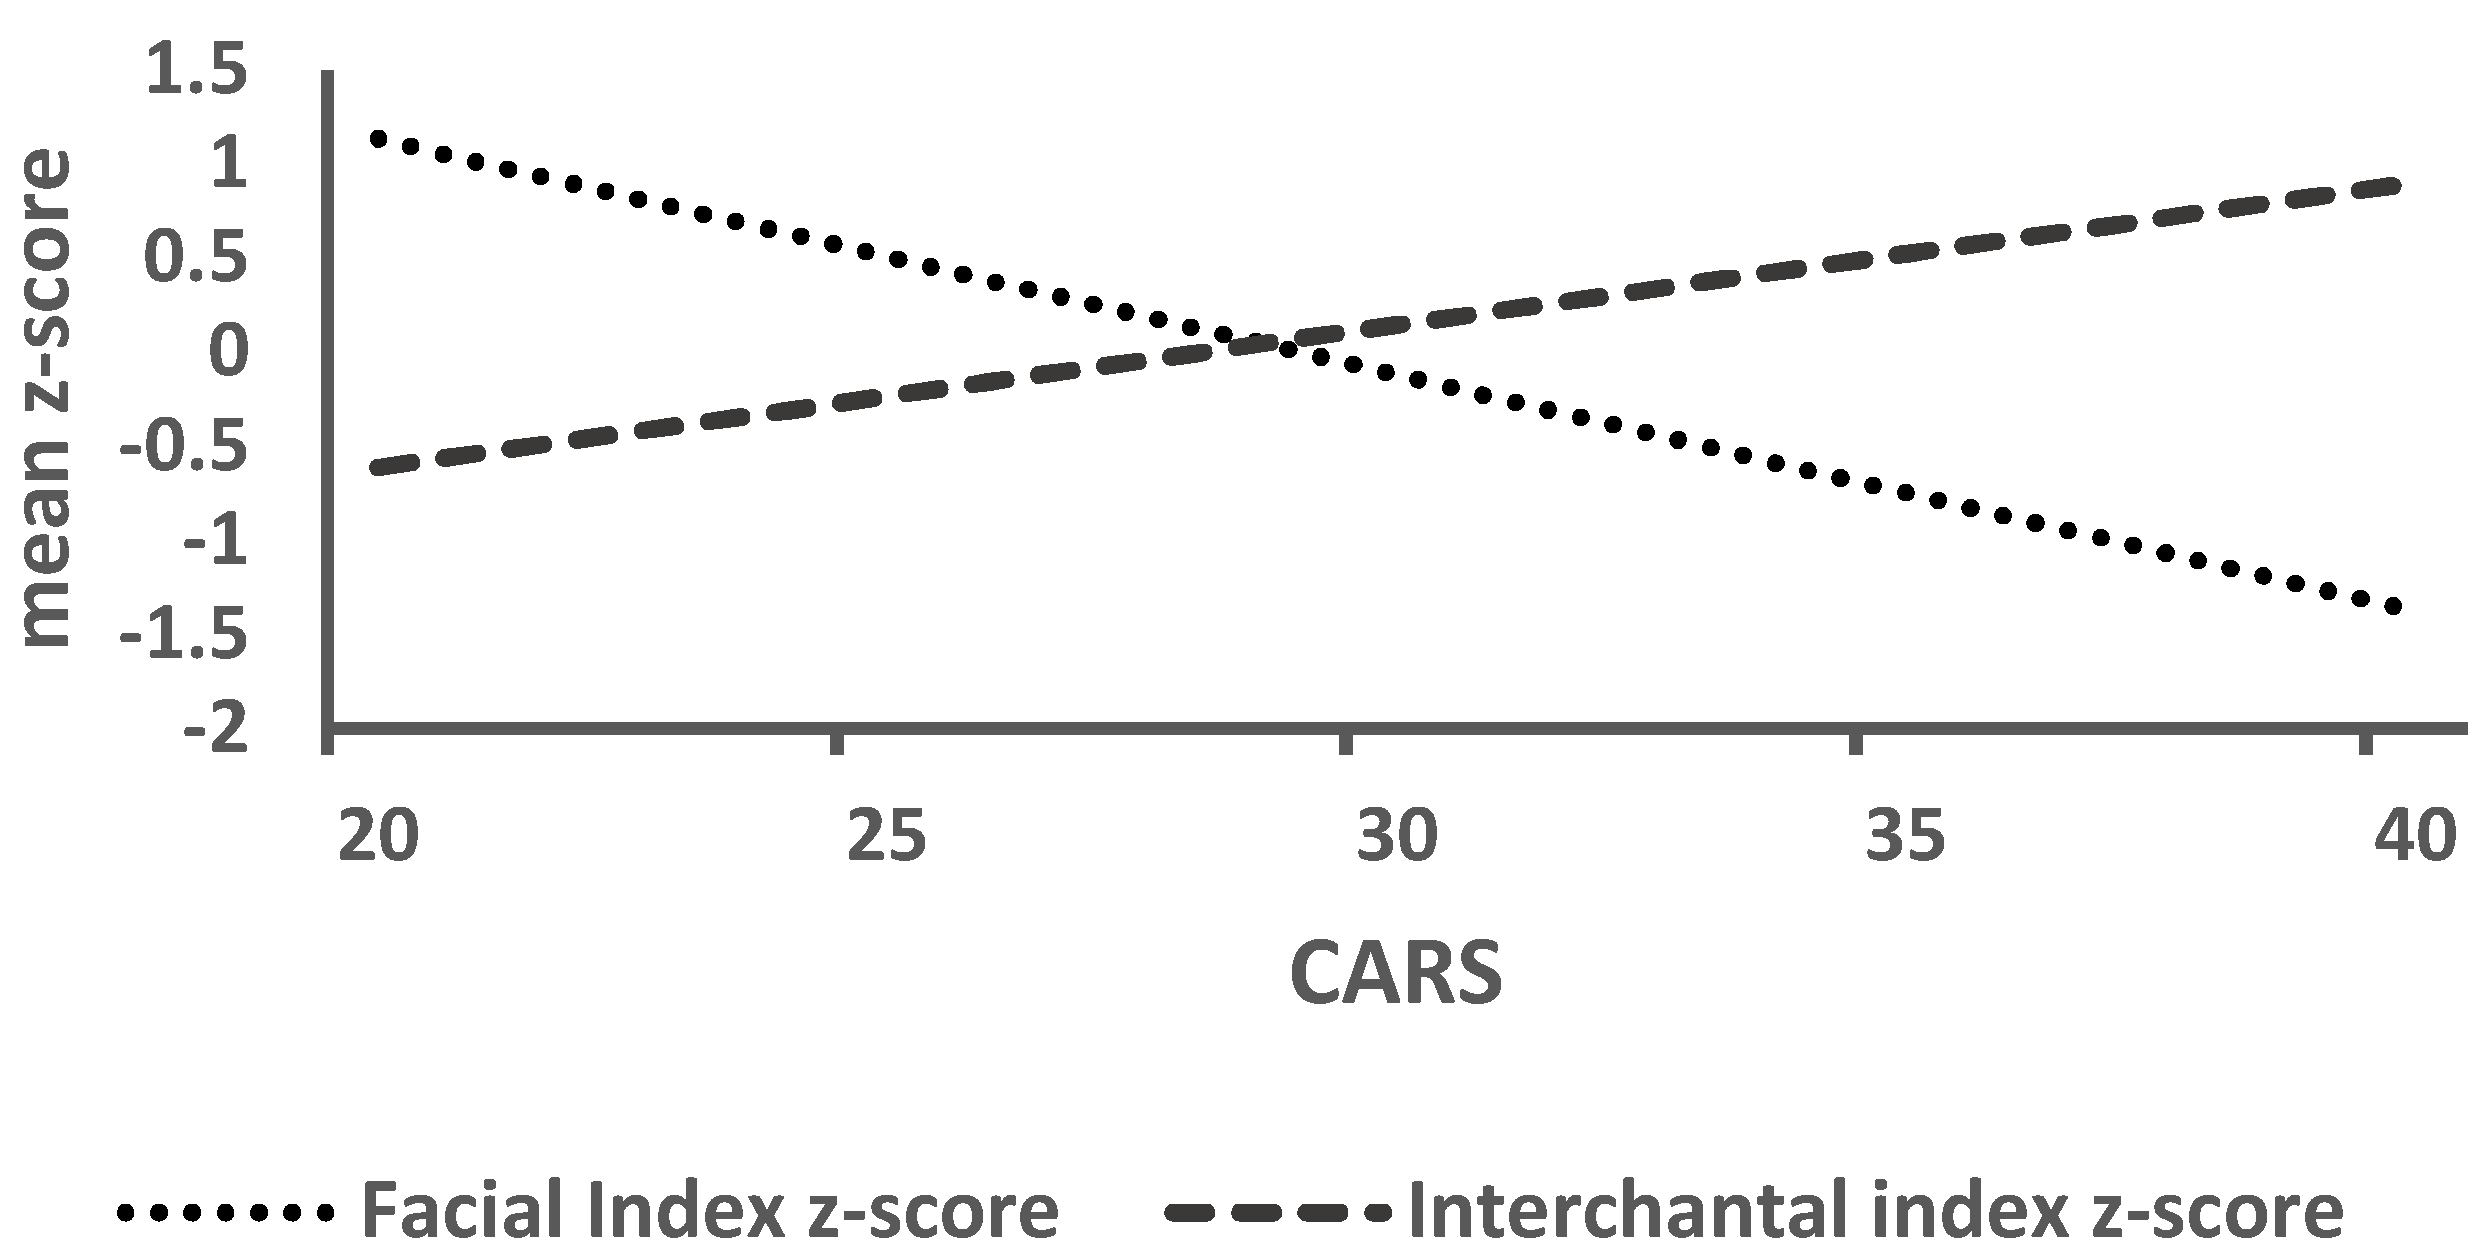
| Facial Index z-score | −0.062 | 0.731 | −0.506 | 0.003 | 0.349 | 0.047 |
| Interchantal Index z-score | 0.143 | 0.427 | 0.385 | 0.028 | −0.122 | 0.499 |
| Nasal Index z-score | −0.045 | 0.806 | −0.275 | 0.122 | 0.138 | 0.445 |
| Mouth-face Index z-score | 0.001 | 0.997 | −0.029 | 0.872 | 0.075 | 0.680 |
| Variable | Coef (SE) | t Value | p Value | 95% CI | |
|---|---|---|---|---|---|
| Facial Index z-score | CARS Global IQ | −0.125 (0.054) 0.000 (0.012) | −2.33 0.03 | 0.027 0.977 | (−0.234, −0.015) (−0.024, 0.024) |
| Interchantal Index z-score | CARS Global IQ | 0.111 (0.044) 0.011 (0.010) | 2.51 1.17 | 0.018 0.250 | (0.021, 0.566) (−0.008, 0.031) |
© 2019 by the authors. Licensee MDPI, Basel, Switzerland. This article is an open access article distributed under the terms and conditions of the Creative Commons Attribution (CC BY) license (http://creativecommons.org/licenses/by/4.0/).
Share and Cite
Tripi, G.; Roux, S.; Matranga, D.; Maniscalco, L.; Glorioso, P.; Bonnet-Brilhault, F.; Roccella, M. Cranio-Facial Characteristics in Children with Autism Spectrum Disorders (ASD). J. Clin. Med. 2019, 8, 641. https://doi.org/10.3390/jcm8050641
Tripi G, Roux S, Matranga D, Maniscalco L, Glorioso P, Bonnet-Brilhault F, Roccella M. Cranio-Facial Characteristics in Children with Autism Spectrum Disorders (ASD). Journal of Clinical Medicine. 2019; 8(5):641. https://doi.org/10.3390/jcm8050641
Chicago/Turabian StyleTripi, Gabriele, Sylvie Roux, Domenica Matranga, Laura Maniscalco, Pasqualino Glorioso, Frédérique Bonnet-Brilhault, and Michele Roccella. 2019. "Cranio-Facial Characteristics in Children with Autism Spectrum Disorders (ASD)" Journal of Clinical Medicine 8, no. 5: 641. https://doi.org/10.3390/jcm8050641
APA StyleTripi, G., Roux, S., Matranga, D., Maniscalco, L., Glorioso, P., Bonnet-Brilhault, F., & Roccella, M. (2019). Cranio-Facial Characteristics in Children with Autism Spectrum Disorders (ASD). Journal of Clinical Medicine, 8(5), 641. https://doi.org/10.3390/jcm8050641