Abstract
Autism Spectrum Disorders (ASD) is a group of neurodevelopmental disorders that is characterized by an altered brain connectivity organization. Autistic traits below the clinical threshold (i.e., the broad autism phenotype; BAP) are frequent among first-degree relatives of subjects with ASD; however, little is known regarding whether subthreshold behavioral manifestations of ASD mirror also at the neuroanatomical level in parents of ASD probands. To this aim, we applied advanced diffusion network analysis to MRI of 16 dyads consisting of a child with ASD and his father in order to investigate: (I) the correlation between structural network organization and autistic features in preschoolers with ASD (all males; age range 1.5–5.2 years); (II) the correlation between structural network organization and BAP features in the fathers of individuals with ASD (fath-ASD). Local network measures significantly correlated with autism severity in ASD children and with BAP traits in fath-ASD, while no significant association emerged when considering the global measures of brain connectivity. Notably, an overlap of some brain regions that are crucial for social functioning (cingulum, superior temporal gyrus, inferior temporal gyrus, middle frontal gyrus, frontal pole, and amygdala) in patients with ASD and fath-ASD was detected, suggesting an intergenerational transmission of these neural substrates. Overall, the results of this study may help in elucidating the neurostructural endophenotype of ASD, paving the way for bridging connections between underlying genetic and ASD symptomatology.
1. Introduction
Autism Spectrum Disorders (ASD) is a heterogeneous group of neurodevelopmental conditions, which is characterized by impairments in socio-communication and the presence of restricted/repetitive behaviors [1], with a consistent prevalence rate in different countries of about 1% of children [2,3,4]. Although the exact etiopathogenesis of ASD remains elusive in the majority of cases, a combination of genetic predisposition, environmental influence, and the interaction between the two has been repeatedly suggested [5,6]. Regarding genetic influences, the analysis of single nucleotide variants (SNVs) on the whole genome (genome-wide association studies, GWAS) [7,8,9], of copy number variants (CNVs) [10], and the sequencing of the whole exome in subjects with ASD [11,12] detected a large set of rare variants, highly penetrating, affecting hundreds of genes. Crucially, the several hundred genes that are involved converge on the functioning of a smaller number of key pathways, such as development and activity of synapses (molecules of neuronal adhesion, synaptic transmission, activity-dependent protein synthesis), regulation of transcription, and remodeling of the chromatin [13,14]. Genetic anomalies are implicated in a considerable proportion of ASD cases (at least 10–20%). For the remaining ~85% cases, in which specific genetic variations are not yet detectable, the sources of ASD heritability remain to be clarified.
Consistent with a genetic predisposition in ASD, several studies have reported that, in about 25% of families of persons with ASD, other family members display various ASD manifestations, ranging from full–blown autistic disorder, autistic symptoms, or autistic traits [15,16,17], suggesting that ASD and autistic traits might share common underlying genetic susceptibility factors [18]. More specifically, literature consistently suggests that parents of individuals with ASD (pASD) are more likely than the general population to express personality traits similar, although less severe, to those of ASD individuals, i.e., the so-called broad autism phenotype (BAP) [19]. These sub-threshold characteristics include peculiar social, communication, and cognitive processes, strong persistent interests, and rigid and aloof personality traits [20,21], and they are higher in fathers when compared to mothers of individuals with ASD (for a systematic review, see [22]). Still little is known, however, on whether genetic and behavioural commonalities between pASD and their sons with ASD also mirror at the brain level. This issue is of relevance, since neuroimaging could reveal ‘intermediate phenotypes’ or ‘endophenotypes’ that are more closely associated with specific genes than the clinical phenotype, and they can therefore support the discovering of new disease genes or the characterization of genetic subtypes of the disease [23].
To this aim, some investigations have examined the neurostructural and the neurofunctional underpinnings in pASD. In a pioneering single case report, Volkmar and colleagues [24] reported similar MRI abnormalities in the dorsolateral frontal region in a father and his 15-year-old son with Asperger syndrome. More recently, studies regarding this topic were summarized in a review [25]. The selected studies used structural magnetic resonance imaging (sMRI), magnetic resonance spectroscopy (MRS), functional magnetic resonance imaging (fMRI), electroencephalography (EEG), or magnetoencephalography (MEG) to explore neurobiological substrates of pASD. The results indicated that pASD are generally different from healthy controls at a structural [26,27] and functional level [28,29]. In addition, a positive correlation between neuroanatomical characteristics and BAP traits is emerging [30,31]. Crucially, some of the observed atypicalities involve the same brain regions (e.g., fusiform gyrus) as the ASD probands, suggesting a potential genetic influence [30]. Moreover, gender was found to influence the neurostructural and neurofunctional results: in particular, the neuroimaging study of Baron-Cohen et al. [32] supported the “Extreme Male Brain Theory” of ASD [33], with mothers of individuals of ASD expressing even less fMRI activation than male controls in empathic tasks.
To the best of our knowledge, no study has used diffusion-weighted imaging (DWI) to explore structural connectivity in pASD and its relationship with behavioral measures. DWI allows for indirect inferences on anatomical connectivity based on differential water diffusion [34], and it is thought to be particularly suited to assess the neuroanatomical underpinnings of ASD, which has been increasingly considered a brain connectivity disorder [35,36,37]. This assumption stems from the several DWI-based studies that were performed in the last two decades to investigate the white matter tracts of individuals with ASD, which revealed a complex pattern of abnormalities in brain connectivity when compared to matched controls [38]. Specifically, atypical connectivity in a distributed network of brain regions specialized in understanding the social behaviours of others—the so-called ‘social brain’—is thought to be involved in social impairment, which is a cardinal feature of the autistic spectrum. This circuit comprises a set of areas that are implicated in processing social stimuli, i.e., the orbitofrontal and medial prefrontal cortices, the superior temporal cortex, the temporal poles, the amygdala, the precuneus, the temporo-parietal junction, the anterior cingulate cortex (ACC), and the insula [39]. Atypical connectivity patterns in ASD are not limited to the social brain, but it also includes thalamo-frontal [40], fronto-striatal [41], cerebellar [42], and motor-sensory homunculus [43] connections, as well as corpus callosum [44]. Further, a developmental trend in the disruption of brain structural connectivity was detected. In fact, infants and toddlers with ASD are characterized by a predominance of over-connectivity pattern when compared with age-matched controls [45,46,47,48], while adolescents and adults predominantly show an overall under-connectivity, as to matched peers [49,50]. However, recent studies revealed a picture that is more complex, in which over- and under-connectivity are network-dependent and may coexist in the brain of subjects with ASD, independently from their age [51].
In the current study, we performed brain structural connectivity in ASD children and in their fathers by applying the HARDI (High Angular Resolution Diffusion Imaging) protocol. This method is able to reduce the known limits of the diffusion-weighted MRI, allowing for a better identification of crossings and branching fibers, which are highly prevalent in brain white matter [52]. In addition, the adoption of a mathematical approach based on graph theory allowed us to examine the brain as a network of interconnected processing units, rather than exploring individual anatomical connections [53]. Graph analysis approaches use measures of the length and strength of connections between all pairs of brain regions to evaluate the efficiency of information transfer within the network, assessing how brain abnormalities impact communication, both at the global and local level. The primary aim of this study was to more specifically explore brain-behavior correlations in the two groups: (I) to correlate autistic features in terms of Autism Diagnostic Observation Schedule Second Edition (ADOS-2) [54] scores with structural network organization in ASD preschoolers; (II) to correlate BAP features in terms of Autism-Spectrum Quotient (AQ) [55] with structural network organization in fathers of ASD preschoolers (fath-ASD). The secondary aim was to test the hypothesis that regions that were identified in fath-ASD may overlap those identified in their probands. We restricted our investigation to male subjects with ASD and their fathers, as fathers have higher rates of BAP than mothers [22], and gender can impact on neuroanatomical findings, both in typical [56] and ASD subjects [57].
2. Experimental Section
2.1. Participants
Sixteen ASD-child/father dyads (all Caucasian) were recruited at IRCCS Stella Maris Foundation (Pisa, IT). The study protocol was approved by the Pediatric Ethic Committee of the Tuscany Region and was performed in accordance with the Declaration of Helsinki. A document with all the necessary information about the study protocol as well as a written informed consent form to participate in the study were given and signed by the parents.
The inclusion criteria for children were an age-range between 18 and 72 months and male gender. Fathers were only included if they were 18 years or older. Exclusion criteria for both fathers and their children were: (I) brain anomalies that were detected on MRI; (II) neurological syndromes or focal neurological signs; (III) history of birth asphyxia, extreme premature birth (≤28 gestational weeks) or perinatal insult; (IV) epilepsy; (V) significant sensory impairment (e.g., blindness, deafness); (VI) use of any psychotropic medication; and, (VII) contraindication for MRI. Additional exclusion criteria for fathers were a poor comprehension of Italian language, which could have biased the clinical evaluation, and insufficient cooperation for MRI scans. Children with ASD also performed the recommended laboratory tests to rule-out medical causes of ASD, including audiometry, thyroid hormone disorders, DNA analysis of FRA-X and screening tests for inborn errors of metabolism (plasma and urine aminoacid analysis, urine organic acid measurement, urine mucopolysaccarides quantitation, plasma and urine creatine, and guanidinoacetate analysis).
Table 1 reports on the demographic and clinical characteristic of the participants.

Table 1.
Demographic and clinical characteristics of the participants.
2.2. Clinical Assessment
All of the children received a clinical diagnosis of ASD according to DSM-5 criteria [1] that was confirmed using algorithm cutoffs on the ADOS-2 [54], as administered by an evaluator (A.N.) who has obtained research reliability certification. Children with ASD perform structural MRI as part of the clinical assessment protocol with the aim of excluding brain alterations. In the case of absence of anomalies detected on MRI, the father of the child was asked to participate in the study and was evaluated with the same MRI protocol.
ADOS calibrated severity score (ADOS-CSS) was used as a clinical measure of ASD severity in children. Separate severity metrics for the Social Affect (SA) and Restricted, Repetitive Behavior (RRB) domains were also considered, which could provide a better picture of ASD dimension [58]. In addition, all children with ASD were assessed for non-verbal development quotient through the performance subscale of the Griffiths Mental Developmental Scales (GMDS).
The fathers enrolled in the study were evaluated through a semi-structured clinical interview that aimed at making the major psychiatric diagnoses (SCID-I, [59]) and through a series of self-administered questionnaires to evaluate post-traumatic stress disorder (Trauma and Loss Spectrum-self report, TALS-SR lifetime version) [60,61] and mood disorders (Mood Spectrum-self report, MOODS-SR—lifetime version) [62].
BAP traits evaluation was based on the Autism-Spectrum Quotient (AQ) [55], a self-report questionnaire that evaluates the following five different areas: “social skills”, “attention switching”, “attention to detail”, “communication”, and “imagination”.
2.3. Image Acquisition
Structural and diffusion tensor MRI were acquired on a 1.5 T MR system (Signa Horizon LX, GE Medical System). Children were scanned under bland sedation. They received inhalational anesthesia with an odorless oxygen and nitrous mixture for induction and sevoflurane for maintenance. No side effects were reported. The fathers were scanned while they were awake, after being recommended to stay as still as possible during the scan acquisition. The MRI protocol included an axial MRI three-dimensional (3D) brain volume (BRAVO) T1-weighted (acquisition matrix = 256 × 256, TR/TE = 12,332/5.16 ms, voxel dimension = 0.5 × 0.5 × 2 mm3, field of view = 256 mm) and an HARDI scan that was acquired along 30 uniformly distributed diffusion encoding directions (b = 1000 s/mm2), along with one b = 0 image (acquisition matrix: 80 × 80, voxel dimension = 3 × 3 × 3 mm3, TR/TE = 10,000/92 ms, field of view = 240 mm). Notably, in a HARDI approach, the diffusion-weighted images are acquired using a large number of non-collinear encoding directions (ideally 60 or above); however, crossing fibers can also be resolved using 30-direction diffusion data, albeit less accurately [63].
2.4. Structural Data Analysis
Structural MRI segmentation was performed in native space using the FreeSurfer software package [64]. Although Freesurfer analysis is not formally recommended for use in children under four years of age due to insufficient gray–white matter contrast, it has been previously used in investigations in infants and toddlers as young as 12 months [46,65,66,67]. Images were visually inspected at each stage in the Freesurfer processing pipeline and, if needed, manually edited and corrected to avoid errors in the segmentation procedure. This included inspecting data for poor skull-stripping, the additional use of “gcut” (http://freesurfer.net/fswiki/FsTutorial/SkullStrip_Fix_freeview) and, in extreme cases, the manual removal of remaining dura, eye, and other non-brain signal. Using this controlled procedure, we also obtained good results for younger children.
FreeSurfer provides parcellation of anatomical regions of the cortex (34 for each hemisphere) based on the Desikan atlas [68] and subcortical regions [69], eight for each hemisphere (nucleus accumbens, amygdala, caudate, hippocampus, pallidum, putamen, and thalamus and cerebellum) were included. Thus, the final parcellation, including both hemispheres, consisted of 84 cortical and subcortical regions in total (Table 2). Cortical regions are defined according to the Desikan atlas [68] and subcortical regions, according to Fischl et al. [69]. The Freesurfer procedure has been previously validated in a control group of typically developing children [70].
Table 2.
Cortical and subcortical regions including in the final parcellation within each hemisphere.
Figure 1 represents the cortical brain regions that were obtained by Freeserfer parcellation.
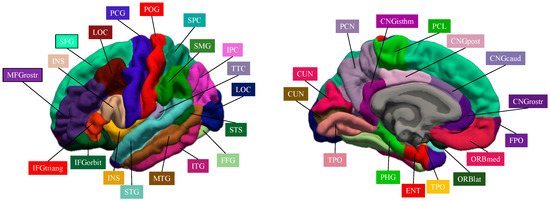
Figure 1.
Cortical brain regions obtained by Freesurer parcellation.
2.5. Diffusion Data Analysis and Connectome Construction
An extensive pre-processing procedure was applied to HARDI data to correct for head motion, image distortions, and artifacts based on previous work [70]. In brief, first volumes with motion between subvolumes were detected and removed based on a discontinuity index [71]. Subsequently, outlier detection and replacement, correction for distortions (eddy currents and subject motion) was performed used the integrated new tool “eddy” implemented in FSL version 5.0.11 [72].
Spatial intensity inhomogeneities were reduced using N3 correction [73]. The bias field was calculated from the image with b = 0, and subsequently applied to all diffusion-weighted images. Using MRtrix3 software (http://www.mrtrix.org) tensor, the fractional anisotropy (FA) and mean diffusivity (MD) maps were successively computed and the fiber orientation distribution (FOD) was estimated using single-tissue constrained spherical deconvolution while applying an algorithm that is a reimplementation of the iterative approach proposed in Tournier et al. [74].
Tractography was performed using an approach that was based on the integration of anatomically-constrained tractography (ACT) [75], which uses anatomical information from high-resolution T1-weighted images to control the evolution and termination of fiber tracking and spherical-deconvolution informed filtering of tractograms (SIFT) [76].
First, registration between structural and diffusion data was performed using the Boundary-Based Registration (BBR) approach [77]. The T1-weighted image that was generated by Freesufer processing was used as it is isotropic (1 × 1 × 1 mm3). Subsequently, tissue partial volume maps of brain white matter (WM), cortical grey matter (GM), deep GM, and cerebrospinal fluid (CSF) were prepared for the ACT framework while using FSL tools [78]. For each scan, tractograms of 10 million streamlines were generated through seeding from either WM mask or deep GM. SIFT was finally applied to filter the reconstruction from 10 million to five million streamlines.
Using MRtrix3 software, the connectomes were generated while considering all possible connecting streamlines between each pairs of nodes. Connectomes were generated using streamline count as the weighting factor.
Figure 2 schematically represents the overall analysis procedure.

Figure 2.
Overall schematic representation of the construction of the structural brain networks. BBR: Boundary-Based Registration; CSD: constrained spherical deconvolution; FOD: fiber orientation distribution; SIFT: spherical-deconvolution informed filtering of tractograms.
2.6. Graph Analysis of Connectomes
The graph theory approach was used to analyze connectome. First, a group threshold of 60% was applied to connectomes in order to eliminate false positive and false negatives [79]. The threshold was separately applied for the group of fathers and the group of children.
The Brain Connectivity Toolbox [80], as well as homemade Matlab scripts, were then used to perform the analyses. Global measures (network-level) and local measures (node-level) were calculated for each connectome. The global measures computed were the global efficiency (EG) [81], the transitivity (T) [82], and the characteristic path length [83]. In addition, Small-World Propensity (SWP), a measure to evaluate small-world characteristics in weighted neural networks [84], was calculated. The local measures used in this study were local efficiency (LE) [81], clustering coefficient (CC) [83], and betweenness centrality (BC) [85]. Table 3 reports the graph theoretical measures extracted in this study. For a more detailed description, please see Bullmore and Sporns [53] and Rubinov and Sporns [80].
Table 3.
Description of the global and local network measures.
2.7. Statistical Analysis
Statistical analyses of the data were performed using SPSS software for Mac Version 20.0 (SPSS Inc, Chicago, IL, USA). Multiple univariate general linear model (GLM) based variance analysis was performed for each brain region, in which the network measures were dependent variables and the clinical variables were independent variables, to identify the clinical correlates of the network characteristics. Age was regressed out as covariate, as it has been previously demonstrated that it can influence the diffusion-weighted MRI parameters [86].
In the group of children, the ADOS-CSS, the SA and the RRB domains, and the GMDS were evaluated, while in the group of fathers the AQ total score as well as its subdomains were considered as the clinical variables. The effect sizes were estimated by partial eta squared (η2; values between 0.01 and 0.06 are they generally considered to be a small effect, between 0.06 and 0.14 a medium effect, and those above 0.14 are regarded as a large effect) [87]. A multiple comparison correction using the Benjamini–Hochberg procedure for false discovery rate (FDR) control [88], with a level set at 0.05 was applied, resulting in a significance of p < 0.0083 (0.05/6 clinical variables). However, due to the explorative nature of the study, we also reported significance values with p < 0.05.
3. Results
3.1. Correlation between ASD Symptoms and Brain Network Measures in ASD Probands
3.1.1. Global Measures
Using multiple linear regression analyses, no significant correlations emerged between clinical features and global measures in ASD probands. A significant positive correlation between age and SWP was found (F = 9.78, p = 0.02, η2 = 0.620).
3.1.2. Nodal Measure
Significant correlations were found for the nodal measures and the clinical measures. We report here only those that survived FDR correction and those obtained for the same brain areas in fathers and children. Supplementary Data S1 reports all of the significant correlations.
EL index. ADOS-CSS was significantly positively correlated with EL of right PCL, left CNGpost, and right STG. SA was also positively correlated with the left CAU. Age also showed a significant negative correlation with EL of left CAU and of right STG.
CC index. For CC, significant correlations in most of the same areas were found. ADOS-CSS was positively correlated with CC of CNGpost. Regarding ADOS subdomains, SA was positively correlated with left CAU, right FPO, and right ITG. GMDS was positively correlated with right ITG.
BC index. ADOS-CSS was significantly positively correlated with the BC of right PCG. SA was significantly positively correlated with the BC of right MFGcaud, left CNGpost, and significantly negatively correlated with the BC of the left AMY. RRB was negatively correlated with the BC of the the left CNGpost. Age showed a significant negative correlation with left AMY.
Table 4, left column, summarizes the significant correlations between ASD symptoms and brain network measures in ASD probands.
Table 4.
Significant correlations between nodal measures and psychological measures in children with Autism Spectrum Disorders (ASD), and in their fathers. Only correlations that survived false discovery rate (FDR) correction and/or were obtained in the same brain areas in the two groups are reported.
3.2. Correlation between BAP Traits and Brain Network Measures in Fathers of ASD Probands
3.2.1. Global Measures
No significant correlations were found between global measures and autistic traits in fath-ASD
3.2.2. Nodal Measures
Significant correlations were found for the nodal measures and the clinical measures. No significant correlation between the nodal measures and total AQ were found. Conversely, the following significant correlations were observed with the AQ subdomains.
As for children, we only report those that survived FDR correction and those that were obtained for the same brain areas in fathers and children, while Supplementary Data S1 reports all of the significant correlations.
EL index. The “attention switching” area of the AQ was negatively correlated with the EL of left CNGisthm and right STG.
CC index. Additionally, for the CC, the “attention switching” area of the AQ was negatively correlated with several brain regions: right SFG, right MFGrostr, left FPO, left LOC, left CNGisthm, right SMG, and right ITG.
BC index. Regarding the BC a significant positive correlation between the “social skills” area of the AQ and the BC of the right THA, right MFGcaud, and right MTG was detected. The “imagination” area of AQ was also significantly positively correlated with the BC of the left IFGoperc. Moreover, “imagination” was negatively correlated with BC of left LOC, left CNGisthm, and right AMY. Age significantly correlated with the BC of left POG.
Table 4, the right column, summarizes the significant correlations between BAP traits and brain network measures in fath-ASD.
3.3. Brain Areas Shared in Fathers and in Their ASD Probands
When considering the correlations that were reported in the above paragraphs, it emerges that fathers and their ASD probands shared some brain areas of significance i.e., areas that in both groups are correlated with BAP/clinical measures. These brain areas are highlighted in bold in Table 4 and summarized in Table 5.
Table 5.
Brain area for which significant correlations with clinical measures were found both in fathers and in their children.
In particular, EL of right STG and left CNG was correlated to BAP/clinical measures in both fathers and their ASD probands. CC of right ITG and left CNG and FPO (right in ASD probands and left in their fathers) also expressed significant correlations in both groups.
Finally, the BC of left LOC, right MFGcaud, left CNG, and AMY (left in ASD probands and right in their fathers) significantly correlated with BAP/clinical measures in the two groups.
The relationship of the predicted and observed values of graph measurements for those brain regions shared by children and their fathers is represented in Figure 3, Figure 4 and Figure 5. In order to understand whether all of the couples showed the same degree of correlation, we performed an analysis of residuals of GLM, which is reported in Supplementary Data S2.

Figure 3.
Regional local efficiency correlates of autistic traits in fathers and of autism severity in children. Top: predicted values vs. AQ domains in fathers. Bottom: predicted values vs. ADOS in children. EL: local efficiency.
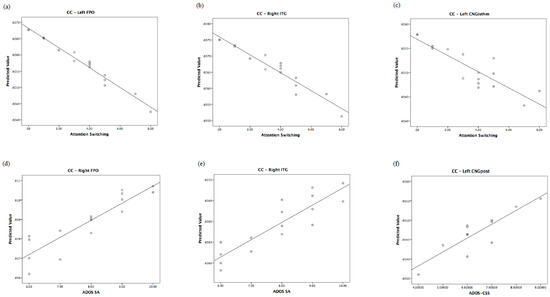
Figure 4.
Regional clustering coefficient correlates of autistic traits in fathers and of autism severity in children. Top: predicted values vs. AQ domains in fathers. Bottom: predicted values vs. ADOS in children. CC: clustering coefficient.

Figure 5.
Regional betweenness centrality correlates of autistic traits in fathers and of autism severity in children. Top: predicted values vs. AQ domains in fathers. Bottom: predicted values vs. ADOS in children. BC: betweenness centrality.
To better visualize the anatomical regions that were significantly associated with autistic traits in fathers and in their children, we plotted connectivity graphs which are reported in Supplementary Data S3.
4. Discussion
The primary aim of this investigation was to explore the brain-behavior correlations in ASD preschoolers and in their fathers (fath-ASD) by using HARDI diffusion techniques. To the best of our knowledge, this is the first study applying an advanced diffusion tractography approach to explore this possible association. The results indicated that the local network measures significantly correlated with autism severity in ASD children and with BAP traits in fath-ASD, while no significant association emerged when considering the global measures of brain connectivity. Interestingly, in ASD probands, correlations were mainly positive, while in fath-ASD correlations, they were mostly negative (especially for local efficiency and cluster coefficient).
4.1. Correlations between Autistic Severity and White Matter Measures in Children
ASD children mostly displayed a positive association between local efficiency/clustering coefficient and ASD severity (ADOS-CSS and SA), thus suggesting higher connectivity indexes in most impaired subjects. In particular, the brain regions that are involved have been previously associated with ASD impairments, like the caudate [89], known to be implicated both in sensorimotor and cognitive functions [90], or the cingulum [45], associated to empathic cognition, social behaviour, and pain perception [91]. This result agrees with other studies reporting a positive correlation between the connectivity and severity of the social domain [92,93].
A positive correlation between GMDS and local efficiency as well as the clustering coefficient in children with ASD was also observed. This is consistent with the recent report of a significant positive association between local connectivity and language performance in individuals with ASD [94]. We could speculate that this result is in line with the compensatory theory [95,96], according to which, during the development, neural reorganization of brain networks (e.g., high local connectivity) may occur as a compensatory strategy, and may result in better performances.
Interestingly, we found a correlation in the opposite direction for the RRB symptoms, suggesting the existence of a mix pattern of both over- and under-connectivity that subtended specific autistic domains, which is in agreement with previous investigations [97,98]. Notably, in our study, such an inverse, negative correlation was found between local efficiency or cluster coefficient of hippocampus and inferior parietal cortex. Studies in the animal models of ASD have related hippocampal dysfunction to restrictive and repetitive behaviors (RRB) [99,100], while the inferior parietal cortex has been previously associated with cognitive flexibility [101]. Also, RRB have been correlated with weaker brain connectivity in adolescents with ASD [102], and with stronger brain connectivity in adults with ASD [103]. These results are consistent with our findings, and they suggest that, at a younger age, RRB are associated with both reduced local efficiency and cluster coefficient, and thus with weak local connectivity.
4.2. Correlations between BAP Traits and White Matter Measures in Fathers
Following the concept of BAP, some studies have explored whether the same neural alterations that were observed in ASD individuals are present in non-clinical or in ASD first-degree relatives. Several techniques, including fMRI, EEG, and MEG have been utilized to assess the brain correlates of autistic traits in pASD, however MRI tractography was never applied [25]. Few studies have used diffusion-weighted MRI to assess the relationship between autistic traits and white matter microstructure in a non-clinical sample of adults, detecting significant associations. For example, Gibbard et al. [104], in a combined sample of individuals with and without ASD, have reported significant negative correlations between the fractional anisotropy (FA) values in several brain regions and AQ score. Hirose et al. [105] found that autistic traits in healthy adults were significantly negatively correlated with the FA in regions that are related to core features of ASD. Positive brain-behavior associations were also reported. For instance, in the study by Iidaka et al. [106], autistic traits were positively associated with the volume of connectivity between superior temporal gyrus and amygdala, while, in the study by Bradstreet et al. [107], autistic traits were positively correlated with FA values in left inferior longitudinal fasciculus. Notably, both significant and positive associations with autistic traits have been reported in the study by Takeuchi et al. [108], which explored WM structural correlates of empathizing and systemizing in young, typically developing adults.
Only one study used a graph theoretical network approach to investigate the functional connectivity of autistic traits in a population of typically developing individuals [109]. Again, both positive and negative correlations between autistic traits and local measures of functional connectivity were found. In particular, the two questionnaires that were used to assess autistic traits (the Social Responsiveness Scale and the Autistic Spectrum Screening Questionnaire) often showed opposite correlations, possibly capturing different aspects of the ASD endophenotype.
Overall, regions we found to be significantly correlated with BAP traits in fath-ASD mostly overlap with those previously that were reported as correlated to autistic traits in non-clinical samples [105,106,110,111]. Importantly, while most previous studies were only able to identify correlations with the total score of the questionnaire, in the current investigation we found significant correlations with the AQ subdomains. This finding may be explained by the different approach that was used in our study (graph analysis versus more traditional DWI techniques), but also by the fact that fath-ASD generally have more autistic traits than typical adults [17]. Accordingly, a wider network of altered regions than those that were recognized in previous diffusion-weighted MRI studies of typical adults was identified. In agreement with the study by Jakab et al. [109], we did not observe any significant correlation with global efficiency, but we detected significant correlations with local measures in several brain regions, suggesting that the impairment of connectivity could be regionally specific. In particular, most of the correlations that we obtained were negative, suggesting that fath-ASD, such as adults with ASD, present higher expression of autistic features in association with lower connectivity indexes. However, some sporadic opposite trends were also found (in particular for “communication” and “attention to detail” domains) [108,109].
Some of the regions that we identified as implicated in autistic traits (i.e., LOC, INS, AMY, SMG, STG) overlap with those that were identified as atypical in previous structural and functional studies of pASD [25]. For example, Yucel et al. [31] investigated neural substrates of faces processing in an fMRI study in pASD and highlighted the lower activation of right INS and higher activity in the AMY when compared with healthy controls. Additionally, an increased activation of LOC only in those parents with aloof personality was detected. Using fMRI, Greimel et al. [30] observed significant differences in the activation of AMY between pASD and controls during an empathy task, with parents displaying decreased activation. Notably, a positive correlation between INS activity and language score was also identified. Increased LOC and SMG activations that correlated with the level of language measures were also found during a MEG language auditory stimulation task [112] in pASD relative to controls. In a phonological processing fMRI task [29], greater hemodynamic response enhancement in several cortical regions, including insular cortex STG, SMG, as well as greater hemodynamic response suppression in the left lateralized postcentral gyrus, middle temporal gyrus (MTG), STG, and SMG was characteristic of pASD when compared to controls. Increased response in STG was also typical of pASD compared with healthy controls in the picture-naming MEG study by Buard et al. [113].
In our study, the higher autistic traits in fath-ASD are associated with lower connectivity in most of the regions that were identified in the abovementioned studies. Given that most of the functional studies have highlighted an increased activity of these regions during several social or auditory tasks, it is possible that the enhanced activation reflects a compensatory mechanism for the abnormal, reduced structural connectivity.
Most of the brain-behavior correlations that we observed were related to the “attention switching” domain of the AQ, suggesting that a wide range of brain areas contribute to modulating cognitive flexibility in fath-ASD. It should be noted that this item does include attention shifts, not only between non-social stimuli, but also between social stimuli. Thus, an impaired cognitive flexibility may reduce one’s ability to effectively attend to, process, and use social and emotional information [114]. Therefore, having a higher number of autistic traits may be related to displaying fewer social behaviors and experiencing more discomfort when doing so.
The correlations obtained for betweenness centrality confirm the relevance of the identified regions in the definition of the ASD phenotype. In particular, reduced centrality of left LOC, right AMY, and left SMG was related to increased autistic traits in the “imagination” domain, which is consistent with the role of LOC region in processing social stimuli [115], of AMY inferring mental states from faces [116], and of left SMG in linking symbols to their meaning [117]. Reduced centrality of bilateral INS was instead correlated with increased autistic traits in the “social skills” domain, which is in agreement with the reduced activation of the insula across several social cognitive task paradigms in individuals with ASD [111].
4.3. Overlap between Fathers and Their Children
Some of the regions that were identified as correlated with ADOS scores in the group of ASD probands overlap with those that were correlated to autistic traits in their fathers, thus suggesting an intergenerational transmission of neural substrates. In particular, the local efficiency of STG and cluster coefficient of FPO, ITG, and CNG were significantly negatively correlated with autistic features in ASD probands and positively correlated with autistic traits in fathers. This opposite direction of correlation is consistent with the inversion of connectivity pattern from childhood to adulthood that was previously discussed.
Previous MRI studies have suggested that abnormalities in the STG are highly implicated in ASD [118,119,120]. Interestingly, neuroimaging and neurophysiological studies show that, in the left hemisphere, the STG is implicated in language, while in the right hemisphere mediates spatial awareness and exploration [121]. In this study, we found a positive correlation between ADOS-CSS and right STG in children with ASD, which is in line with the impairment of language function in the clinical sample [122], and a negative correlation between the “attention switching” domain of the AQ and right STG in fath-ASD, revealing a deficit more related to the cognitive flexibility in fathers. These results are consistent with previous studies that identified the STG, the CNG, and the ITG as part of the circuit activated in response to switching the attention to an unattended stimulus [123].
The FPO plays a role in retrospective memory and in higher-order cognitive operations (e.g., decision making, planning, social/moral reasoning) [124], and structural abnormalities in this area has been previously linked to ASD [125]. Our results indicated a positive association with the social domain of ADOS in ASD probands and a negative correlation with the “attention switching” in fath-ASD, suggesting the involvement of this brain structure in mediating the ASD features in the two groups.
Moreover, the betweenness centrality of LOC, AMY, CNG, and MFG was correlated with autism severity in both ASD children and their fathers. The limbic system, including the cingulate gyrus, is related to emotion and social behaviors, and replicated evidences suggested that the disruption of this circuitry could be related to some of the behavioral deficits that were seen in individuals with ASD [126].
The different direction of correlations in ASD children and their fathers can be partially ascribed to their different ages, which implies a shift in the connectivity patterns, and partially to the different severity of ASD features (i.e., autistic disorder in children versus autistic traits in their fathers).
4.4. Strengths and Limitations
This is the first DWI study investigating the neurostructural correlates of BAP traits in fathers of individuals with ASD (fath-ASD). In addition, we enrolled children with ASD as well as their fathers, to allow for exploration of the intergenerational transmission of autistic features. Only one previous fMRI study [30] acquired both the ASD probands and their fathers, with the aim of exploring the intergenerational transmission of neural substrates. Overall, the results from these studies may help in elucidating the neural endophenotype of ASD and better clarifying the hereditary mechanisms that are involved in the various clinical dimension of ASD.
A further strength of this study is the use of the graph analysis approach to explore network characteristics and their behavioral correlates in children with ASD and in fath-ASD. This novel approach is providing interesting results for a comprehensive characterization of brain connectivity and it is improving our understanding of the brain organization in neurodevelopmental disorders as well as in other pathological conditions. Since ASD reports several white matter microstructure abnormalities, investigating the properties of the inter-regional correlations of white matter integrity may provide insight into the structural coherence of underlying white matter tracts in ASD and in fath-ASD. In particular, the characterization of the local properties of the structural connectivity can enhance our understanding of the correlations between white matter structure and behavioral impairments in the ASD endophenotype.
There are some limitations to our study that must be acknowledged. At first, the relatively low sample size only allows for partial conclusions regarding the common and distinct brain-behavior correlations in ASD preschoolers and in fath-ASD. With larger cohorts, it would be possible to better control for confounding factors, including IQ and psychiatric comorbidities, which could somehow affect the neuroanatomical underpinnings. However, the number of subjects that were included in this study is somewhat in line with previous MRI investigations on this topic [26,29,30,113]. In this context, our findings could add to the current literature by providing initial insight into DWI patterns in ASD individuals as well as in fath-ASD. Moreover, we did not include a control group, so the specificity of our results is unclear. Finally, as this was the first DTI study in fath-ASD, we did not have any a priori hypothesis allowing for restricting the number of comparisons between DTI measures for each brain region and different domains of autistic traits. As a result, FDR correction yielded a very conservative threshold with only two correlations surviving the correction. Since many of the extracted features or regions are likely to be highly dependent from each other, it is conceivable that an a priori limitation of the number of comparisons would have resulted in a higher number of significant correlations.
4.5. Future Directions
Future investigations should address the limitations of this and previous studies in pASD by including a larger sample of parents and a group of adults without a child with ASD, but comparable for autistic traits. In addition, multimodal imaging techniques that evaluate the structural and functional measures could help in elucidating the relationship between the neurostructural and neurofunctional correlates of autistic traits in ASD parents, including the potential compensatory neural activations to counter structural brain impairments. Moreover, studies assessing the BAP could also benefit from the assessment of multiple endophenotypes/biomarkers by collecting, in addition to neuroimaging data, immunological, biochemical, or neuropsychological information, thus addressing the cross talk among the different modalities [127]. Ultimately, the detection of common and distinct neuroimaging underpinnings in patients with ASD and in fath-ASD has the potential to bridge the gap between genes and clinical ASD features, and therefore to pave the way towards a better understanding of ASD etiopathogenesis.
5. Conclusions
Our results suggest that a significant association exists between BAP traits in fath-ASD and their white matter connectivity organization. Importantly, some aspects of the brain structure are shared by parents and their children with ASD, supporting their possible role as an endophenotype of the disorder. Conversely, several other patterns of brain connectivity are group-specific, with some regions being correlated with autistic features in children with ASD and others with BAP traits in fath-ASD. The specificity of these brain-behavior correlations could be due to the different age-range of the two groups of subjects, when considering that the connectome changes with age [86]. However, another possible, not mutually exclusive, explanation is that the regions exhibiting correlations with autistic traits in fath-ASD, but not in their children, have a more marginal role in defining the ASD endophenotype.
Supplementary Materials
The following are available online at https://www.mdpi.com/2077-0383/8/4/487/s1. S1. Nodal measures correlations in fathers and in their children; S2. Data analysis to understand if all the couples showed similar correlations; S3. Anatomical graphs for father and children; Table S1. Significant correlations between nodal measures extracted from the connectome weighted on the basis on the number of streamlines and psychological measures in children with ASD and in their fathers; Figure S1. Three dimensional sagittal and axial views of the anatomical graph in fathers (a) and in children (b) in which the size of the node represents the Local Efficiency (EL), while the thickness of the edges represents the strength of the connections (number of streamlines); Figure S2. Three dimensional sagittal and axial views of the anatomical graph in fathers (a) and in children (b) in which the size of the node represents the Cluster Coefficient (CC), while the thickness of the edges represents the strength of the connections (number of streamlines); Figure S3. Three dimensional sagittal and axial views of the anatomical graph in fathers (a) and in children (b) in which the size of the node represents the Betweennes Centrality (BC), while the thickness of the edges represents the strength of the connections (number of streamlines).
Author Contributions
Conceptualization, S.C., E.C., C.C., L.D. and A.G.; Methodology, L.B., S.C., E.C., A.L. A.N. and C.G.; Formal Analysis, L.B.; Writing—Original Draft Preparation, L.B.; Writing—Review & Editing, S.C., E.C. and A.G.; Supervision, G.C., F.M. and A.G.
Funding
This research was funded by University of Pisa, Bando PRA 2015 and 2017. This work was also supported by grant from the IRCCS Stella Maris Foundation (Ricerca Corrente, and the “5 × 1000” voluntary contributions, Italian Ministry of Health). The APC was funded by University of Pisa.
Conflicts of Interest
The authors declare no conflict of interest.
References
- American Psychiatric Association. Diagnostic and Statistical Manual of Mental Disorders, 5th ed.; American Psychiatric Association: Washington, DC, USA, 2013. [Google Scholar]
- Baio, J.; Wiggins, L.; Christensen, D.L.; Maenner, M.J.; Daniels, J.; Warren, Z.; Kurzius-Spencer, M.; Zahorodny, W.; Robinson Rosenberg, C.; White, T.; et al. Prevalence of Autism Spectrum Disorder Among Children Aged 8 Years—Autism and Developmental Disabilities Monitoring Network, 11 Sites, United States, 2014. MMWR Surveill. Summ. 2018, 67, 1–23. [Google Scholar] [CrossRef]
- Narzisi, A.; Posada, M.; Barbieri, F.; Chericoni, N.; Ciuffolini, D.; Pinzino, M.; Romano, R.; Scattoni, M.L.; Tancredi, R.; Calderoni, S.; et al. Prevalence of Autism Spectrum Disorder in a large Italian catchment area: A school-based population study within the ASDEU project. Epidemiol. Psychiatr. Sci. 2018, 6, 1–10. [Google Scholar] [CrossRef] [PubMed]
- Kim, Y.S.; Leventhal, B.L.; Koh, Y.J.; Fombonne, E.; Laska, E.; Lim, E.C.; Cheon, K.A.; Kim, S.J.; Kim, Y.K.; Lee, H.; et al. Prevalence of autism spectrum disorders in a total population sample. Am. J. Psychiatry 2011, 168, 904–912. [Google Scholar] [CrossRef]
- Hallmayer, J.; Cleveland, S.; Torres, A.; Phillips, J.; Cohen, B.; Torigoe, T.; Miller, J.; Fedele, A.; Collins, J.; Smith, K.; et al. Genetic heritability and shared environmental factors among twin pairs with autism. Arch. Gen. Psychiatry 2011, 68, 1095–1102. [Google Scholar] [CrossRef] [PubMed]
- Tick, B.; Bolton, P.; Happé, F.; Rutter, M.; Rijsdijk, F. Heritability of autism spectrum disorders: A meta-analysis of twin studies. J. Child Psychol. Psychiatry 2016, 57, 585–595. [Google Scholar] [CrossRef]
- Anney, R.; Klei, L.; Pinto, D.; Regan, R.; Conroy, J.; Magalhaes, T.R.; Correia, C.; Abrahams, B.S.; Sykes, N.; Pagnamenta, A.T.; et al. A genome-wide scan for common alleles affecting risk for autism. Hum. Mol. Genet. 2011, 19, 4072–4082. [Google Scholar] [CrossRef] [PubMed]
- Krishnan, A.; Zhang, R.; Yao, V.; Theesfeld, C.L.; Wong, A.K.; Tadych, A.; Volfovsky, N.; Packer, A.; Lash, A.; Troyanskaya, O.G. Genome-wide prediction and functional characterization of the genetic basis of autism spectrum disorder. Nat. Neurosci. 2016, 19, 1454. [Google Scholar] [CrossRef] [PubMed]
- Weiss, L.A.; Dan, E.A.; Gene Discovery Project of Johns Hopkins & the Autism Consortium. A genome-wide linkage and association scan reveals novel loci for autism. Nature 2009, 461, 802. [Google Scholar]
- Pinto, D.; Pagnamenta, A.T.; Klei, L.; Anney, R.; Merico, D.; Regan, R.; Conroy, J.; Magalhaes, T.R.; Correia, C.; Abrahams, B.S.; et al. Functional impact of global rare copy number variation in autism spectrum disorders. Nature 2010, 466, 368–372. [Google Scholar] [CrossRef]
- De Rubeis, S.; Buxbaum, J.D. Genetics and genomics of autism spectrum disorder: Embracing complexity. Hum. Mol. Genet. 2015, 24, R24–R31. [Google Scholar] [CrossRef]
- Iossifov, I.; O’Roak, B.J.; Sanders, S.J.; Ronemus, M.; Krumm, N.; Levy, D.; Stessman, H.A.; Witherspoon, K.T.; Vives, L.; Patterson, K.E.; et al. The contribution of de novo coding mutations to autism spectrum disorder. Nature 2014, 515, 216. [Google Scholar] [CrossRef]
- Bourgeron, T. From the genetic architecture to synaptic plasticity in autism spectrum disorder. Nat. Rev. Neurosci. 2015, 16, 551. [Google Scholar] [CrossRef]
- de la Torre-Ubieta, L.; Won, H.; Stein, J.L.; Geschwind, D.H. Advancing the understanding of autism disease mechanisms through genetics. Nat. Med. 2016, 22, 345–361. [Google Scholar] [CrossRef] [PubMed]
- Constantino, J.N.; Zhang, Y.; Frazier, T.; Abbacchi, A.M.; Law, P. Sibling Recurrence and the Genetic Epidemiology of Autism. Am. J. Psychiatry 2010, 167, 1349–1356. [Google Scholar] [CrossRef] [PubMed]
- Virkud, Y.V.; Todd, R.D.; Abbacchi, A.M.; Zhang, Y.; Constantino, J.N. Familial aggregation of quantitative autistic traits in multiplex versus simplex autism. Am. J. Med. Genet. B Neuropsychiatr. Genet. 2009, 150, 328–334. [Google Scholar] [CrossRef] [PubMed]
- Losh, M.; Childress, D.; Lam, K.; Piven, J. Defining key features of the broad autism phenotype: A comparison across parents of multiple- and single-incidence autism families. Am. J. Med. Genet. B Neuropsychiatr Genet. 2008, 147, 424–433. [Google Scholar] [CrossRef] [PubMed]
- Bralten, J.; van Hulzen, K.J.; Martens, M.B.; Galesloot, T.E.; Arias Vasquez, A.; Kiemeney, L.A.; Buitelaar, J.K.; Muntjewerff, J.W.; Franke, B.; Poelmans, G. Autism spectrum disorders and autistic traits share genetics and biology. Mol. Psychiatry 2018, 23, 1205–1212. [Google Scholar] [CrossRef]
- Piven, J.; Palmer, P.; Jacobi, D.; Childress, D.; Arndt, S. Broader autism phenotype: Evidence from a family history study of multiple-incidence autism families. Am. J. Psychiatry 1997, 154, 185–190. [Google Scholar]
- Gerdts, J.; Bernier, R. The broader autism phenotype and its implications on the etiology and treatment of autism spectrum disorders. Autism Res. Treat. 2011. [Google Scholar] [CrossRef]
- Sucksmith, E.; Roth, I.; Hoekstra, R.A. Autistic traits below the clinical threshold: Re-examining the broader autism phenotype in the 21st century. Neuropsychol. Rev. 2011, 21, 360–389. [Google Scholar] [CrossRef] [PubMed]
- Rubenstein, E.; Chawla, D. Broader autism phenotype in parents of children with autism: A systematic review of percentage estimates. J. Child. Fam. Stud. 2018, 27, 1705–1720. [Google Scholar] [CrossRef]
- Rasetti, R.; Weinberger, D.R. Intermediate phenotypes in psychiatric disorders. Curr. Opin. Genet. Dev. 2011, 21, 340–348. [Google Scholar] [CrossRef]
- Volkmar, F.R.; Klin, A.; Schultz, R.; Bronen, R.; Marans, W.D.; Sparrow, S.; Cohen, D.J. Asperger’s syndrome. J. Am. Acad. Child. Adolesc. Psychiatry 1996, 35, 118–123. [Google Scholar] [CrossRef] [PubMed]
- Billeci, L.; Calderoni, S.; Conti, E.; Gesi, C.; Carmassi, C.; Dell’Osso, L.; Cioni, G.; Muratori, F.; Guzzetta, A. The broader autism endo(phenotype): Neurostructural and neurofunctional correlates in parents of individuals with Autism Spectrum Disorders. Front. Neurosci. 2016, 10, 276. [Google Scholar] [CrossRef] [PubMed]
- Rojas, D.C.; Smith, J.A.; Benkers, T.L.; Camou, S.L.; Reite, M.L.; Rogers, S.J. Hippocampus and amygdala volumes in parents of children with autistic disorder. Am. J. Psychiatry 2004, 161, 2038–2044. [Google Scholar] [CrossRef]
- Peterson, E.; Schmidt, G.L.; Tregellas, J.R.; Winterrowd, E.; Kopelioff, L.; Hepburn, S.; Reite, M.; Rojas, D.C. A voxel-based morphometry study of gray matter in parents of children with autism. Neuroreport 2006, 17, 1289–1292. [Google Scholar] [CrossRef]
- Dawson, G.; Webb, S.J.; Wijsman, E.; Schellenberg, G.; Estes, A.; Munson, J.; Faja, S. Neurocognitive and electrophysiological evidence of altered face processing in parents of children with autism: Implications for a model of abnormal development of social brain circuitry in autism. Dev. Psychopathol. 2005, 17, 679–697. [Google Scholar] [CrossRef]
- Wilson, L.B.; Jason, R.; Tregellas, J.R.; Slason, E.; Pasko, B.E.; Hepburn, S.; Rojas, D.C. Phonological processing in first-degree relatives of individuals with autism: An fMRI study. Hum. Brain Map. 2013, 34, 1447–1463. [Google Scholar] [CrossRef]
- Greimel, E.; Schulte-Rüther, M.; Kircher, T.; Kamp-Becker, I.; Remschmidt, H.; Fink, G.R.; Herpertz-Dahlmann, B.; Konrad, K. Neural mechanisms of empathy in adolescents with autism spectrum disorder and their fathers. NeuroImage 2010, 49, 1055–1065. [Google Scholar] [CrossRef]
- Yucel, G.H.; Belger, A.; Bizzell, J.; Parlier, M.; Adolphs, R.; Piven, J. Abnormal neural activation to faces in the parents of children with autism. Cereb. Cortex 2014, 25, 4653–4666. [Google Scholar] [CrossRef] [PubMed]
- Baron-Cohen, S.; Ring, H.; Wheelwright, S.; Williams, S.; Brammer, M.; Bullmore, E. fMRI of parents of children with Asperger Syndrome: A pilot study. Brain Cogn. 2006, 61, 122–130. [Google Scholar] [CrossRef]
- Baron-Cohen, S. The extreme male brain theory of autism. Trends Cogn. Sci. 2002, 6, 248–254. [Google Scholar] [CrossRef]
- Lebel, C.; Treit, S.; Beaulieu, C. A review of diffusion MRI of typical white matter development from early childhood to young adulthood. NMR Biomed. 2019, 32, e3778. [Google Scholar] [CrossRef]
- Just, M.A.; Keller, T.A.; Malave, V.L.; Kana, R.K.; Varma, S. Autism as a neural systems disorder: A theory of frontal-posterior underconnectivity. Neurosci. Biobehav. Rev. 2012, 36, 1292–1313. [Google Scholar] [CrossRef]
- Kana, R.K.; Libero, L.E.; Moore, M.S. Disrupted cortical connectivity theory as an explanatory model for autism spectrum disorders. Phys. Life Rev. 2011, 8, 410–437. [Google Scholar] [CrossRef]
- Müller, R.A.; Fishman, I. Brain Connectivity and Neuroimaging of Social Networks in Autism. Trends Cogn. Sci. 2018, 22, 1103–1116. [Google Scholar] [CrossRef]
- Ismail, M.M.; Keynton, R.S.; Mostapha, M.M.; ElTanboly, A.H.; Casanova, M.F.; Gimel’farb, G.L.; El-Baz, A. Studying Autism Spectrum Disorder with Structural and Diffusion Magnetic Resonance Imaging: A Survey. Front. Hum. Neurosci. 2016, 10, 211. [Google Scholar] [CrossRef]
- Brothers, L. The social brain: A project for integrating primate behavior and neurophysiology in a new domain. Concepts Neurosci. 1990, 1, 27–51. [Google Scholar]
- Cheon, K.A.; Kim, Y.S.; Oh, S.H.; Park, S.Y.; Yoon, H.W.; Herrington, J.; Nair, A.; Koh, Y.J.; Jang, D.P.; Kim, Y.B.; et al. Involvement of the anterior thalamic radiation in boys with high functioning autism spectrum disorders: A diffusion tensor imaging study. Brain Res. 2011, 1417, 77–86. [Google Scholar] [CrossRef]
- Langen, M.; Leemans, A.; Johnston, P.; Ecker, C.; Daly, E.; Murphy, C.M.; Dell’acqua, F.; Durston, S.; AIMS Consortium; Murphy, D.G. Fronto-striatal circuitry and inhibitory control in autism: Findings from diffusion tensor imaging tractography. Cortex 2012, 48, 183–193. [Google Scholar] [CrossRef]
- Sivaswamy, L.; Kumar, A.; Rajan, D.; Behen, M.; Muzik, O.; Chugani, D.; Chugani, H. A diffusion tensor imaging study of the cerebellar pathways in children with autism spectrum disorder. J. Child. Neurol. 2010, 25, 1223–1231. [Google Scholar] [CrossRef]
- Thompson, A.; Murphy, D.; Dell’Acqua, F.; Ecker, C.; McAlonan, G.; Howells, H.; Baron-Cohen, S.; Lai, M.C.; Lombardo, M.V.; MRC AIMS Consortium; Catani, M. Impaired Communication Between the Motor and Somatosensory Homunculus Is Associated with Poor Manual Dexterity in Autism Spectrum Disorder. Biol. Psychiatry 2017, 81, 211–219. [Google Scholar] [CrossRef]
- Brito, A.R.; Vasconcelos, M.M.; Domingues, R.C.; Hygino da Cruz, L.C., Jr.; Rodrigues Lde, S.; Gasparetto, E.L.; Calçada, C.A. Diffusion tensor imaging findings in school-aged autistic children. J. Neuroimaging 2009, 19, 337–343. [Google Scholar] [CrossRef]
- Billeci, L.; Calderoni, S.; Tosetti, M.; Catani, M.; Muratori, F. White matter connectivity in children with autism spectrum disorders: A tract-based spatial statistics study. BMC Neurol. 2012, 12, 148. [Google Scholar] [CrossRef]
- Conti, E.; Calderoni, S.; Marchi, V.; Muratori, F.; Cioni, G.; Guzzetta, A. The first 1000 days of the autistic brain: A systematic review of diffusion imaging studies. Front. Hum. Neurosci. 2015, 9, 159. [Google Scholar] [CrossRef] [PubMed]
- Wolff, J.J.; Gu, H.; Gerig, G.; Elison, J.T.; Styner, M.; Gouttard, S.; Botteron, K.N.; Dager, S.R.; Dawson, G.; Estes, A.M.; et al. Differences in white matter fiber tract development present from 6 to 24 months in infants with autism. Am. J. Psychiatry 2012, 169, 589–600. [Google Scholar] [CrossRef]
- Wolff, J.J.; Jacob, S.; Elison, J.T. The journey to autism: Insights from neuroimaging studies of infants and toddlers. Dev. Psychopathol. 2018, 30, 479–495. [Google Scholar] [CrossRef] [PubMed]
- Pardini, M.; Garaci, F.G.; Bonzano, L.; Roccatagliata, L.; Palmieri, M.G.; Pompili, E.; Coniglione, F.; Krueger, F.; Ludovici, A.; Floris, R.; et al. White matter reduced streamline coherence in young men with autism and mental retardation. Eur. J. Neurol. 2009, 16, 1185–1190. [Google Scholar] [CrossRef]
- Nickel, K.; Tebartz van Elst, L.; Perlov, E.; Endres, D.; Müller, G.T.; Riedel, A.; Fangmeier, T.; Maier, S. Altered white matter integrity in adults with autism spectrum disorder and an IQ >100: A diffusion tensor imaging study. Acta Psychiatr. Scand. 2017, 135, 573–583. [Google Scholar] [CrossRef] [PubMed]
- Picci, G.; Gotts, S.J.; Scherf, K.S. A theoretical rut: Revisiting and critically evaluating the generalized under/over-connectivity hypothesis of autism. Dev. Sci. 2016, 19, 524–549. [Google Scholar] [CrossRef] [PubMed]
- Bloy, L.; Ingalhalikar, M.; Batmanghelich, N.K.; Schultz, R.T.; Roberts, T.P.; Verma, R. An integrated framework for high angular resolution diffusion imaging-based investigation of structural connectivity. Brain Connect. 2012, 2, 69–79. [Google Scholar] [CrossRef] [PubMed]
- Bullmore, E.; Sporns, O. Complex brain networks: Graph theoretical analysis of structural and functional systems. Nat. Rev. Neurosci. 2009, 10, 186–198. [Google Scholar] [CrossRef] [PubMed]
- Lord, C.; Rutter, M.; DiLavore, P.C.; Risi, S.; Gotham, K.; Bishop, S. Autism Diagnostic Observation Schedule, 2nd ed.; Western Psychological Services: Torrance, CA, USA, 2012. [Google Scholar]
- Ruta, L.; Mazzone, D.; Mazzone, L.; Wheelwright, S.; Baron-Cohen, S. The Autism-Spectrum Quotient-Italian version: A cross-cultural confirmation of the broader autism phenotype. J. Autism Dev. Disord. 2012, 42, 625–633. [Google Scholar] [CrossRef]
- Ritchie, S.J.; Cox, S.R.; Shen, X.; Lombardo, M.V.; Reus, L.M.; Alloza, C.; Harris, M.A.; Alderson, H.L.; Hunter, S.; Neilson, E.; et al. Sex Differences in the adult human brain: Evidence from 5216 UK biobank participants. Cereb. Cortex 2017, 28, 2959–2975. [Google Scholar] [CrossRef]
- Retico, A.; Giuliano, A.; Tancredi, R.; Cosenza, A.; Apicella, F.; Narzisi, A.; Biagi, L.; Tosetti, M.; Muratori, F.; Calderoni, S. The effect of gender on the neuroanatomy of children with autism spectrum disorders: A support vector machine case-control study. Mol. Autism 2016, 7, 5. [Google Scholar] [CrossRef]
- Hus, V.; Gotham, K.; Lord, C. Standardizing ADOS domain scores: Separating severity of social affect and restricted and repetitive behaviors. J. Autism Dev. Disord. 2014, 44, 2400–2412. [Google Scholar] [CrossRef]
- First, M.B.; Williams, J.B.W.; Karg, R.S.; Spitzer, R.L. Structured Clinical Interview for DSM-5-Research Version (SCID-5 for DSM-5, Research Version; SCID-5-RV); American Psychiatric Association: Arlington, VA, USA, 2015. [Google Scholar]
- Dell’Osso, L.; Shear, M.K.; Carmassi, C.; Rucci, P.; Maser, J.D.; Frank, E.; Endicott, J.; Lorettu, L.; Altamura, C.A.; Carpiniello, B.; et al. Validity and reliability of the structured clinical interview for the trauma and loss spectrum (SCI-TALS). Clin. Pract. Epidemiol. Ment. Health 2008, 4, 2. [Google Scholar] [CrossRef]
- Dell’Osso, L.; Carmassi, C.; Rucci, P.; Conversano, C.; Shear, M.K.; Calugi, S.; Maser, J.D.; Endicott, J.; Fagiolini, A.; Cassano, G.B. A multidimensional spectrum approach to post-traumatic stress disorder: Comparison between the structured clinical interview for trauma and loss spectrum (SCI-TALS) and the self-report instrument (TALS-SR). Compr. Psychiatry 2009, 50, 485–490. [Google Scholar] [CrossRef]
- Dell’Osso, L.; Armani, A.; Rucci, P.; Frank, E.; Fagiolini, A.; Corretti, G.; Shear, M.K.; Grochocinski, V.J.; Maser, J.D.; Endicott, J.; et al. Measuring mood spectrum: Comparison of interview (SCI-MOODS) and self-report (MOODS-SR) instruments. Compr. Psychiatry 2002, 43, 69–73. [Google Scholar] [CrossRef] [PubMed]
- Pannek, K.; Guzzetta, A.; Colditz, P.B.; Rose, S.E. Diffusion MRI of the neonate brain: Acquisition, processing and analysis techniques. Pediatr. Radiol. 2012, 42, 1169–1182. [Google Scholar] [CrossRef]
- Fischl, B. FreeSurfer. NeuroImage 2012, 62, 774–781. [Google Scholar] [CrossRef]
- Croteau-Chonka, E.C.; Dean, D.C., 3rd; Remer, J.; Dirks, H.; O’Muircheartaigh, J.; Deoni, S.C.L. Examining the relationships between cortical maturation and white matter myelination throughout early childhood. NeuroImage 2016, 125, 413–421. [Google Scholar] [CrossRef]
- Lowe, J.R.; MacLean, P.C.; Caprihan, A.; Ohls, R.K.; Qualls, C.; VanMeter, J.; Phillips, J.P. Comparison of cerebral volume in children aged 18–22 and 36–47 months born preterm and term. J. Child Neurol. 2012, 27, 172–177. [Google Scholar] [CrossRef]
- Travis, K.E.; Curran, M.M.; Torres, C.; Leonard, M.K.; Brown, T.T.; Dale, A.M.; Elman, J.L.; Halgren, E. Age-related changes in tissue signal properties within cortical areas important for word understanding in 12- to 19-month-old infants. Cereb. Cortex 2014, 24, 1948–1955. [Google Scholar] [CrossRef]
- Desikan, R.S.; Ségonne, F.; Fischl, B.; Quinn, B.T.; Dickerson, B.C.; Blacker, D.; Buckner, R.L.; Dale, A.M.; Maguire, R.P.; Hyman, B.T.; et al. An automated labeling system for subdividing the human cerebral cortex on MRI scans into gyral based regions of interest. NeuroImage 2006, 31, 968–980. [Google Scholar] [CrossRef]
- Fischl, B.; Salat, D.H.; Busa, E.; Albert, M.; Dieterich, M.; Haselgrove, C.; van der Kouwe, A.; Killiany, R.; Kennedy, D.; Klaveness, S.; et al. Whole brain segmentation: Automated labeling of neuroanatomical structures in the human brain. Neuron 2002, 33, 341–355. [Google Scholar] [CrossRef]
- Pannek, K.; Boyd, R.N.; Fiori, S.; Guzzetta, A.; Rose, S.E. Assessment of the structural brain network reveals altered connectivity in children with unilateral cerebral palsy due to periventricular white matter lesions. NeuroImage Clin. 2014, 5, 84–92. [Google Scholar] [CrossRef]
- Nam, H.; Park, H.J. Distortion correction of high b-valued and high angular resolution diffusion images using iterative simulated images. NeuroImage 2011, 57, 968–978. [Google Scholar] [CrossRef]
- Andersson, J.L.R.; Sotiropoulos, S.N. An integrated approach to correction for off-resonance effects and subject movement in diffusion MR imaging. NeuroImage 2016, 125, 1063–1078. [Google Scholar] [CrossRef]
- Sled, J.G.; Zijdenbos, A.P.; Evans, A.C. A nonparametric method for automatic correction of intensity nonuniformity in MRI data. IEEE Trans. Med. Imaging 1998, 17, 87–97. [Google Scholar] [CrossRef]
- Tournier, J.D.; Calamante, F.; Connelly, A. Determination of the appropriate b value and number of gradient directions for high-angular-resolution diffusion-weighted imaging. NMR Biomed. 2013, 26, 1775–1786. [Google Scholar] [CrossRef] [PubMed]
- Smith, R.E.; Tournier, J.D.; Calamante, F.; Connelly, A. Anatomically-constrained tractography: Improved diffusion MRI streamlines tractography through effective use of anatomical information. NeuroImage 2012, 62, 1924–1938. [Google Scholar] [CrossRef] [PubMed]
- Smith, R.E.; Tournier, J.D.; Calamante, F.; Connelly, A. SIFT: Spherical-deconvolution informed filtering of tractograms. NeuroImage 2013, 67, 298–312. [Google Scholar] [CrossRef] [PubMed]
- Greve, D.N.; Fischl, B. Accurate and robust brain image alignment using boundary-based registration. NeuroImage 2009, 48, 63–72. [Google Scholar] [CrossRef]
- Patenaude, B.; Smith, S.M.; Kennedy, D.N.; Jenkinson, M. A Bayesian model of shape and appearance for subcortical brain segmentation. NeuroImage 2011, 56, 907–922. [Google Scholar] [CrossRef] [PubMed]
- de Reus, M.A.; van den Heuvel, M.P. Estimating false positives and negatives in brain networks. NeuroImage 2013, 70, 402–409. [Google Scholar] [CrossRef] [PubMed]
- Rubinov, M.; Sporns, O. Complex network measures of brain connectivity: Uses and interpretations. NeuroImage 2010, 52, 1059–1069. [Google Scholar] [CrossRef] [PubMed]
- Latora, V.; Marchiori, M. Efficient behavior of small-world networks. Phys. Rev. Lett. 2001, 87, 198701. [Google Scholar] [CrossRef] [PubMed]
- Onnela, J.P.; Saramaki, J.; Kertesz, J.; Kaski, K. Intensity and coherence of motifs in weighted complex networks. Phys. Rev. E Stat. Nonlinear Soft Matter Phys. 2005, 71, 065103. [Google Scholar] [CrossRef] [PubMed]
- Watts, D.J.; Strogatz, S.H. Collective dynamics of ‘‘small-world’’ networks. Nature 1998, 393, 440–442. [Google Scholar] [CrossRef]
- Muldoon, S.F.; Bridgeford, E.W.; Bassett, D.S. Small-World Propensity and Weighted Brain Networks. Sci. Rep. 2016, 6, 22057. [Google Scholar] [CrossRef] [PubMed]
- Kintali, S. Betweenness centrality: Algorithms and lower bounds. arXiv 2008, arXiv:0809.1906v0802. [Google Scholar]
- Cao, M.; Huang, H.; Peng, Y.; Dong, Q.; He, Y. Toward Developmental Connectomics of the Human Brain. Front. Neuroanat. 2016, 10, 25. [Google Scholar] [CrossRef] [PubMed]
- Cohen, J. Statistical Power Analysis for the Behavioral Sciences; Routledge Academic: New York, NY, USA, 1988. [Google Scholar]
- Benjamini, Y.; Hochberg, Y. Controlling the false discovery rate: A practical and powerful approach to multiple testing. J. R. Stat. Soc. Ser. B 1995, 57, 289–300. [Google Scholar] [CrossRef]
- Voelbel, G.T.; Bates, M.E.; Buckman, J.F.; Pandina, G.; Hendren, R.L. Caudate Nucleus Volume and Cognitive Performance: Are they related in Childhood Psychopathology? Biol. Psychiatry 2006, 60, 942–950. [Google Scholar] [CrossRef] [PubMed]
- Williams, J.H.; Waiter, G.D.; Perra, O.; Perrett, D.I.; Whiten, A. An fMRI study of joint attention experience. NeuroImage 2005, 25, 133–140. [Google Scholar] [CrossRef] [PubMed]
- Di Martino, A.; Ross, K.; Uddin, L.Q.; Sklar, A.B.; Castellanos, F.X.; Milham, M.P. Functional brain correlates of social and nonsocial processes in autism spectrum disorders: An activation likelihood estimation meta-analysis. Biol. Psychiatry 2009, 65, 63–74. [Google Scholar] [CrossRef]
- Keown, C.L.; Shih, P.; Nair, A.; Peterson, N.; Mulvey, M.E.; Müller, R.A. Local functional overconnectivity in posterior brain regions is associated with symptom severity in autism spectrum disorders. Cell Rep. 2013, 5, 567–572. [Google Scholar] [CrossRef] [PubMed]
- Supekar, K.; Uddin, L.Q.; Khouzam, A.; Phillips, J.; Gaillard, W.D.; Kenworthy, L.E.; Yerys, B.E.; Vaidya, C.J.; Menon, V. Brain hyperconnectivity in children with autism and its links to social deficits. Cell Rep. 2013, 5, 738–747. [Google Scholar] [CrossRef]
- Li, H.; Xue, Z.; Ellmore, T.M.; Frye, R.E.; Wong, S.T. Network-based analysis reveals stronger local diffusion-based connectivity and different correlations with oral language skills in brains of children with high functioning autism spectrum disorders. Hum. Brain Map. 2014, 35, 396–413. [Google Scholar] [CrossRef]
- Belmonte, M.K.; Allen, G.; Beckel-Mitchener, A.; Boulanger, L.M.; Carper, R.A.; Webb, S.J. Autism and abnormal development of brain connectivity. J. Neurosci. 2004, 24, 9228–9231. [Google Scholar] [CrossRef]
- Just, M.A.; Cherkassky, V.L.; Keller, T.A.; Minshew, N.J. Cortical activation and synchronization during sentence comprehension in high-functioning autism: Evidence of underconnectivity. Brain 2004, 127, 1811–1821. [Google Scholar] [CrossRef]
- Cheng, Y.; Chou, K.H.; Chen, I.Y.; Fan, Y.T.; Decety, J.; Lin, C.P. Atypical development of white matter microstructure in adolescents with autism spectrum disorders. NeuroImage 2010, 50, 873–882. [Google Scholar] [CrossRef]
- Nair, A.; Carper, R.A.; Abbott, A.E.; Chen, C.P.; Solders, S.; Nakutin, S.; Datko, M.C.; Fishman, I.; Müller, R.A. Regional specificity of aberrant thalamocortical connectivity in autism. Hum. Brain Map. 2015, 36, 4497–4511. [Google Scholar] [CrossRef]
- Micheau, J.; Vimeney, A.; Normand, E.; Mulle, C.; Riedel, G. Impaired hippocampus-dependent spatial flexibility and sociability represent autism-like phenotypes in GluK2 mice. Hippocampus 2014, 24, 1059–1069. [Google Scholar] [CrossRef]
- Lewis, J.D.; Theilmann, R.J.; Townsend, J.; Evans, A.C. Network efficiency in autism spectrum disorder and its relation to brain overgrowth. Front. Hum. Neurosci. 2013, 7, 845. [Google Scholar] [CrossRef]
- Kim, C.; Johnson, N.F.; Cilles, S.E.; Gold, B.T. Common and distinct mechanisms of cognitive flexibility in prefrontal cortex. J. Neurosci. 2011, 31, 4771–4779. [Google Scholar] [CrossRef]
- Weng, S.J.; Wiggins, J.L.; Peltier, S.J.; Carrasco, M.; Risi, S.; Lord, C.; Monk, C.S. Alterations of resting state functional connectivity in the default network in adolescents with autism spectrum disorders. Brain Res. 2010, 1313, 202–214. [Google Scholar] [CrossRef]
- Monk, C.S.; Peltier, S.J.; Wiggins, J.L.; Weng, S.J.; Carrasco, M.; Risi, S.; Lord, C. Abnormalities of intrinsic functional connectivity in autism spectrum disorders. NeuroImage 2009, 47, 764–772. [Google Scholar] [CrossRef]
- Gibbard, C.R.; Ren, J.; Seunarine, K.K.; Clayden, J.D.; Skuse, D.H.; Clark, C.A. White matter microstructure correlates with autism trait severity in a combined clinical-control sample of high-functioning adults. NeuroImage Clin. 2013, 3, 106–114. [Google Scholar] [CrossRef]
- Hirose, K.; Miyata, J.; Sugihara, G.; Kubota, M.; Sasamoto, A.; Aso, T.; Fukuyama, H.; Murai, T.; Takahashi, H. Fiber tract associated with autistic traits in healthy adults. J. Psychiatry Res. 2014, 59, 117–124. [Google Scholar] [CrossRef]
- Iidaka, T.; Miyakoshi, M.; Harada, T.; Nakai, T. White matter connectivity between superior temporal sulcus and amygdala is associated with autistic trait in healthy humans. Neurosci. Lett. 2012, 510, 154–158. [Google Scholar] [CrossRef]
- Bradstreet, L.E.; Hecht, E.E.; King, T.Z.; Turner, J.L.; Robins, D.L. Associations between autistic traits and fractional anisotropy values in white matter tracts in a nonclinical sample of young adults. Exp. Brain Res. 2017, 235, 259–267. [Google Scholar] [CrossRef]
- Takeuchi, H.; Taki, Y.; Thyreau, B.; Sassa, Y.; Hashizume, H.; Sekiguchi, A.; Nagase, T.; Nouchi, R.; Fukushima, A.; Kawashima, R. White matter structures associated with empathizing and systemizing in young adults. NeuroImage 2013, 77, 222–236. [Google Scholar] [CrossRef]
- Jakab, A.; Emri, M.; Spisak, T.; Szeman-Nagy, A.; Beres, M.; Kis, S.A.; Molnar, P.; Berenyi, E. Autistic traits in neurotypical adults: Correlates of graph theoretical functional network topology and white matter anisotropy patterns. PLoS ONE 2013, 8, e60982. [Google Scholar] [CrossRef]
- Wallace, G.L.; Shaw, P.; Lee, N.R.; Clasen, L.S.; Raznahan, A.; Lenroot, R.K.; Martin, A.; Giedd, J.N. Distinct cortical correlates of autistic versus antisocial traits in a longitudinal sample of typically developing youth. J. Neurosci. 2012, 32, 4856–4860. [Google Scholar] [CrossRef]
- Di Martino, A.; Shehzad, Z.; Kelly, C.; Roy, A.K.; Gee, D.G.; Uddin, L.Q.; Gotimer, K.; Klein, D.F.; Castellanos, X.; Milham, M.P. Relationship between cingulo-insular functional connectivity and autistic traits in neurotypical adults. Am. J. Psychiatry 2009, 166, 891–899. [Google Scholar] [CrossRef]
- McFadden, K.L.; Hepburn, S.; Winterrowd, E.; Schmidt, G.L.; Rojas, D.C. Abnormalities in gamma-band responses to language stimuli in firstdegree relatives of children with autism spectrum disorder: An MEG study. BMC Psychiatry 2012, 12, 213. [Google Scholar] [CrossRef]
- Buard, I.; Rogers, S.J.; Hepburn, S.; Kronberg, E.; Rojas, D.C. Altered oscillation patterns and connectivity during picture naming in autism. Front. Hum. Neurosci. 2013, 7, 742. [Google Scholar] [CrossRef]
- Gökçen, E.; Petrides, K.V.; Hudry, K.; Frederickson, N.; Smillie, L.D. Sub-threshold autism traits: The role of trait emotional intelligence and cognitive flexibility. Br. J. Psychol. 2014, 105, 187–199. [Google Scholar] [CrossRef]
- Nagy, K.; Greenlee, M.W.; Kovács, G. The Lateral Occipital Cortex in the Face Perception Network: An Effective Connectivity Study. Front. Psychol. 2012, 3, 141. [Google Scholar] [CrossRef]
- Piggot, J.; Kwon, H.; Mobbs, D.; Blasey, C.; Lotspeich, L.; Menon, V.; Bookheimer, S.; Reiss, A.L. Emotional attribution in high-functioning individuals with autistic spectrum disorder: A functional imaging study. J. Am. Acad. Child Adolesc. Psychiatry 2004, 43, 473–480. [Google Scholar] [CrossRef]
- Dehaene, S.; Piazza, M.; Pinel, P.; Cohen, L. Three parietal circuits for number processing. Cogn. Neuropsychol. 2003, 20, 487–506. [Google Scholar] [CrossRef]
- Pelphrey, K.; Adolphs, R.; Morris, J.P. Neuroanatomical substrates of social cognition dysfunction in autism. Ment. Retard. Dev. Disabil. Res. Rev. 2004, 10, 259–271. [Google Scholar] [CrossRef]
- Harris, G.J.; Chabris, C.F.; Clark, J.; Urban, T.; Aharon, I.; Steele, S.; McGrath, L.; Condouris, K.; Tager-Flusberg, H. Brain activation during semantic processing in autism spectrum disorders via functional magnetic resonance imaging. Brain Cogn. 2006, 61, 54–68. [Google Scholar] [CrossRef]
- Lee, J.E.; Bigler, E.D.; Alexander, A.L.; Lazar, M.; DuBray, M.B.; Chung, M.K.; Johnson, M.; Morgan, J.; Miller, J.N.; McMahon, W.M.; et al. Diffusion tensor imaging of white matter in the superior temporal gyrus and temporal stem in autism. Neurosci. Lett. 2007, 424, 127–132. [Google Scholar] [CrossRef]
- Karnath, H.O. New insights into the functions of the superior temporal cortex. Nat. Rev. Neurosci. 2001, 2, 568–576. [Google Scholar] [CrossRef]
- Bigler, E.D.; Mortensen, S.; Neeley, E.S.; Ozonoff, S.; Krasny, L.; Johnson, M.; Lu, J.; Provencal, S.L.; McMahon, W.; Lainhart, J.E. Superior temporal gyrus, language function, and autism. Dev. Neuropsychol. 2007, 31, 217–238. [Google Scholar] [CrossRef]
- Waberski, T.D.; Kreitschmann-Andermahr, I.; Kawohl, W.; Darvas, F.; Ryang, Y.; Rodewald, M.; Gobbelé, R.; Buchner, H. Spatio-temporal source imaging reveals subcomponents of the human auditory mismatch negativity in the cingulum and right inferior temporal gyrus. Neurosci. Lett. 2001, 308, 107–110. [Google Scholar] [CrossRef]
- Okuda, J.; Fujii, T.; Ohtake, H.; Tsukiura, T.; Tanji, K.; Suzuki, K.; Kawashima, R.; Fukuda, H.; Itoh, M.; Yamadori, A. Thinking of the future and past: The roles of the frontal pole and the medial temporal lobes. NeuroImage 2003, 19, 1369–1380. [Google Scholar] [CrossRef]
- Jiao, Y.; Chen, R.; Ke, X.; Chu, K.; Lu, Z.; Herskovits, E.H. Predictive models of autism spectrum disorder based on brain regional cortical thickness. NeuroImage 2010, 50, 589–599. [Google Scholar] [CrossRef] [PubMed]
- Sokolowski, K.; Corbin, J.G. Wired for behaviors: From development to function of innate limbic system circuitry. Front. Mol. Neurosci. 2012, 5, 55. [Google Scholar] [CrossRef] [PubMed]
- Ruggeri, B.; Sarkans, U.; Schumann, G.; Persico, A.M. Biomarkers in autism spectrum disorder: The old and the new. Psychopharmacology 2014, 231, 1201–1216. [Google Scholar] [CrossRef] [PubMed]
© 2019 by the authors. Licensee MDPI, Basel, Switzerland. This article is an open access article distributed under the terms and conditions of the Creative Commons Attribution (CC BY) license (http://creativecommons.org/licenses/by/4.0/).