Beat-to-Beat Tracking of Pulse Pressure and Its Respiratory Variation Using Heart Sound Signal in Patients Undergoing Liver Transplantation


Abstract
1. Introduction
2. Materials and Methods
2.1. Study Population and Anesthesia Protocol
2.2. Hemodynamic Monitoring
2.3. Data Acquisition and Signal Processing
2.4. Statistical Analysis
3. Results
4. Discussion
Author Contributions
Funding
Acknowledgments
Conflicts of Interest
References
- Wen, Y.N.; Lee, A.P.; Fang, F.; Jin, C.N.; Yu, C.M. Beyond auscultation: Acoustic cardiography in clinical practice. Int. J. Cardiol. 2014, 172, 548–560. [Google Scholar] [CrossRef]
- Singh, J.; Anand, R.S. Computer aided analysis of phonocardiogram. J. Med. Eng. Technol. 2007, 31, 319–323. [Google Scholar] [CrossRef]
- Durand, L.G.; Pibarot, P. Digital signal processing of the phonocardiogram: Review of the most recent advancements. Crit. Rev. Biomed. Eng. 1995, 23, 163–219. [Google Scholar] [CrossRef] [PubMed]
- Smith, C. An endo-oesophageal stethoscope. Anesthesiology 1954, 15, 566. [Google Scholar] [CrossRef] [PubMed]
- Park, S.H.; Shin, Y.D.; Bae, J.H.; Kwon, E.J.; Lee, T.S.; Shin, J.Y.; Kim, Y.C.; Min, G.D.; Kim, M. Heart sounds analysis via esophageal stethoscope system in beagles. J. Clin. Monit. Comput. 2013, 27, 535–539. [Google Scholar] [CrossRef]
- Manecke, G.R., Jr.; Nemirov, M.A.; Bicker, A.A.; Adsumelli, R.N.; Poppers, P.J. The effect of halothane on the amplitude and frequency characteristics of heart sounds in children. Anesth. Analg. 1999, 88, 263–267. [Google Scholar]
- Hansen, P.B.; Luisada, A.A.; Miletich, D.J.; Albrecht, R.F. Phonocardiography as a monitor of cardiac performance during anesthesia. Anesth. Analg. 1989, 68, 385–387. [Google Scholar] [CrossRef] [PubMed]
- Kim, S.H.; Moon, Y.J.; Kim, J.W.; Song, J.G.; Hwang, G.S. Prediction of fluid responsiveness by a non-invasive respiratory systolic time interval variation using heart sound signals in recipients undergoing liver transplantation. Transplant. Proc. 2017, 49, 1082–1086. [Google Scholar] [CrossRef]
- Huh, I.Y.; Kim, Y.K.; Shin, W.J.; Park, S.E.; Bang, J.Y.; Hwang, G.S. Increased B-type natriuretic peptide during liver transplantation: Relationship to invasively measured hemodynamic parameters. Transplant. Proc. 2012, 44, 1318–1322. [Google Scholar] [CrossRef]
- Kim, Y.K.; Shin, W.J.; Song, J.G.; Jun, I.G.; Kim, H.Y.; Seong, S.H.; Huh, I.Y.; Hwang, G.S. Effect of right ventricular dysfunction on dynamic preload indices to predict a decrease in cardiac output after inferior vena cava clamping during liver transplantation. Transplant. Proc. 2010, 42, 2585–2589. [Google Scholar] [CrossRef]
- Kim, Y.K.; Shin, W.J.; Song, J.G.; Jun, I.G.; Kim, H.Y.; Seong, S.H.; Hwang, G.S. Comparison of stroke volume variations derived from radial and femoral arterial pressure waveforms during liver transplantation. Transplant. Proc. 2009, 41, 4220–4228. [Google Scholar] [CrossRef] [PubMed]
- Kim, S.H.; Hwang, G.S.; Kim, S.O.; Kim, Y.K. Is stroke volume variation a useful preload index in liver transplant recipients? A retrospective analysis. Int. J. Med. Sci. 2013, 10, 751–757. [Google Scholar] [CrossRef] [PubMed][Green Version]
- Manecke, G.R., Jr.; Poppers, P.J. Esophageal stethoscope placement depth: Its effect on heart and lung sound monitoring during general anesthesia. Anesth. Analg. 1998, 86, 1276–1279. [Google Scholar]
- Michard, F.; Chemla, D.; Richard, C.; Wysocki, M.; Pinsky, M.R.; Lecarpentier, Y.; Teboul, J.L. Clinical use of respiratory changes in arterial pulse pressure to monitor the hemodynamic effects of PEEP. Am. J. Respir. Crit. Care Med. 1999, 159, 935–939. [Google Scholar] [CrossRef] [PubMed]
- Prielipp, R.C.; Kelly, J.S.; Roy, R.C. Use of esophageal or precordial stethoscopes by anesthesia providers: Are we listening to our patients? J. Clin. Anesth. 1995, 7, 367–372. [Google Scholar] [CrossRef]
- Klepper, I.D.; Webb, R.K.; Van der Walt, J.H.; Ludbrook, G.L.; Cockings, J. The stethoscope: Applications and limitations—An analysis of 2000 incident reports. Anaesth. Intensive Care 1993, 21, 575–578. [Google Scholar] [CrossRef]
- Tonnesen, A.L.; Gabel, J.C.; Cooper, J.R.; McLeavey, C.A.; Drake, R.E. Intraesophageal microphone for phonocardiographic recording. Anesthesiology 1977, 46, 70–71. [Google Scholar] [CrossRef] [PubMed]
- Dart, A.M.; Kingwell, B.A. Pulse pressure—A review of mechanisms and clinical relevance. J. Am. Coll. Cardiol. 2001, 37, 975–984. [Google Scholar] [CrossRef]
- Chemla, D.; Antony, I.; Lecarpentier, Y.; Nitenberg, A. Contribution of systemic vascular resistance and total arterial compliance to effective arterial elastance in humans. Am. J. Physiol. Heart Circ. Physiol. 2003, 285, H614–H620. [Google Scholar] [CrossRef]
- Coriat, P.; Vrillon, M.; Perel, A.; Baron, J.F.; Le Bret, F.; Saada, M.; Viars, P. A comparison of systolic blood pressure variations and echocardiographic estimates of end-diastolic left ventricular size in patients after aortic surgery. Anesth. Analg. 1994, 78, 46–53. [Google Scholar] [CrossRef] [PubMed]
- Tavernier, B.; Makhotine, O.; Lebuffe, G.; Dupont, J.; Scherpereel, P. Systolic pressure variation as a guide to fluid therapy in patients with sepsis-induced hypotension. Anesthesiology 1998, 89, 1313–1321. [Google Scholar] [CrossRef] [PubMed]
- Biais, M.; Nouette-Gaulain, K.; Cottenceau, V.; Vallet, A.; Cochard, J.F.; Revel, P.; Sztark, F. Cardiac output measurement in patients undergoing liver transplantation: Pulmonary artery catheter versus uncalibrated arterial pressure waveform analysis. Anesth. Analg. 2008, 106, 1480–1486. [Google Scholar]
- Tsai, Y.F.; Su, B.C.; Lin, C.C.; Liu, F.C.; Lee, W.C.; Yu, H.P. Cardiac output derived from arterial pressure waveform analysis: Validation of the third-generation software in patients undergoing orthotopic liver transplantation. Transplant. Proc. 2012, 44, 433–437. [Google Scholar] [CrossRef] [PubMed]
- Gouvea, G.; Diaz, R.; Auler, L.; Toledo, R.; Martinho, J.M. Evaluation of the pulse pressure variation index as a predictor of fluid responsiveness during orthotopic liver transplantation. Br. J. Anaesth. 2009, 103, 238–243. [Google Scholar] [CrossRef] [PubMed]
- Wang, S.C.; Teng, W.N.; Chang, K.Y.; Susan Mandell, M.; Ting, C.K.; Chu, Y.C.; Loong, C.C.; Chan, K.H.; Tsou, M.Y. Fluid management guided by stroke volume variation failed to decrease the incidence of acute kidney injury, 30-day mortality, and 1-year survival in living donor liver transplant recipients. J. Chin. Med. Assoc. 2012, 75, 654–659. [Google Scholar] [CrossRef] [PubMed]


| Characteristics | |
|---|---|
| Sex (M/F) | 19/5 |
| Age (years) | 55.0 ± 10.4 |
| Weight (kg) | 66.1 ± 13.3 |
| Height (cm) | 164.5 ± 8.0 |
| Classification of liver transplant recipients | |
| Hepatitis virus-related liver cirrhosis | 12 (50.0%) |
| Alcoholic cirrhosis | 6 (25.0%) |
| Secondary biliary cirrhosis | 2 (8.4%) |
| Autoimmune or cryptogenic cirrhosis | 3 (12.5%) |
| Acute hepatitis | 1 (4.2%) |
| Child-Turcotte-Pugh score | 8.2 ± 1.5 |
| Model for End-Stage Liver Disease score | 15.2 ± 6.9 |
| Preoperative transthoracic echocardiographic findings | |
| Ejection fraction (%) | 65.2 ± 4.3 |
| End-diastolic volume (mL) | 116.1 ± 31.3 |
| End-systolic volume (mL) | 40.5 ± 12.3 |
| Stroke volume (mL) | 75.6 ± 21.1 |
| Left ventricular mass (g) | 162.9 ± 43.5 |
| Preoperative hematologic profiles | |
| Hemoglobin (g/dL) | 10.7 ± 1.6 |
| Platelet count (×103/mm3) | 86.3 ± 68.5 |
| Prothrombin time (international normalized ratio) | 1.6 ± 0.6 |
| Albumin (g/dL) | 3.1 ± 0.5 |
| Creatinine (mg/dL) | 1.0 ± 1.3 |
| Bilirubin (mg/dL) | 5.4 ± 8.9 |
| Parameter | I + 60 | C − 30 | C + 30 | R + 30 | HA |
|---|---|---|---|---|---|
| SBP (mmHg) | 114.3 ± 14.5 | 114.1 ± 17.1 | 115.4 ± 13.5 | 123.5 ± 27.0 | 118.6 ± 16.2 |
| DBP (mmHg) | 59.6 ± 10.0 | 58.6 ± 9.8 | 63.3 ± 8.3 | 59.8 ± 14.2 | 57.3 ± 7.7 |
| HR (beats/min) | 91.7 ± 12.1 | 91.1 ± 14.6 | 94.7 ± 14.6 | 91.7 ± 14.0 | 89.1 ± 12.3 |
| CVP (mmHg) | 11.4 ± 2.5 | 10.7 ± 2.2 | 11.0 ± 2.6 | 12.3 ± 2.6 | 11.6 ± 1.9 |
| FVP (mmHg) | 15.5 ± 4.2 | 13.8 ± 2.4 | 25.8 ± 6.0 * | 15.0 ± 3.5 | 14.7 ± 3.2 |
| CO (L/min) | 8.0 ± 2.3 | 8.3 ± 2.5 | 6.9 ± 2.3 | 9.0 ± 2.5 | 8.3 ± 2.5 |
| SV (mL/beat) | 87.9 ± 25.9 | 90.6 ± 27.8 | 78.1 ± 28.8 | 94.4 ± 26.0 | 94.7 ± 26.8 |
| RVEDVI (mL/m2) | 138.1 ± 27.5 | 132.4 ± 24.9 | 121.5 ± 26.2 * | 131.9 ± 30.9 | 131.7 ± 29.4 |
| SVR (dyne·s/cm5) | 718.0 ± 236.2 | 711.5 ± 245.7 | 711.2 ± 298.6 | 679.9 ± 224.8 | 673.1 ± 251.6 |
| PP (mmHg) | 54.6 ± 10.5 | 55.8 ± 11.8 | 51.5 ± 11.4 | 64.4 ± 16.2 * | 61.4 ± 1.37 |
| SVV (%) | 8.5 ± 3.9 | 8.4 ± 4.3 | 11.3 ± 7.6 | 6.6 ± 3.3 | 8.4 ± 2.4 |
| PPV (%) | 7.4 ± 4.7 | 6.7 ± 5.0 | 8.2 ± 5.1 | 5.1 ± 3.3 * | 6.1 ± 3.8 |
| PST (ms) | 279.4 ± 40.8 | 275.1 ± 36.8 | 259.3 ± 42.7 | 286.8 ± 39.5 | 269.1 ± 40.7 |
| PDT (ms) | 387.7 ± 80.9 | 386.8 ± 73.6 | 375.2 ± 62.8 | 396.5 ± 92.6 | 426.9 ± 97.5 |
| PSV (%) | 8.4 ± 3.4 | 7.0 ± 3.2 | 7.8 ± 4.2 | 6.9 ± 3.5 | 9.1 ± 4.6 |
| S1 amplitude (dB) | 26.6 ± 4.9 | 26.7 ± 5.4 | 25.3 ± 5.1 | 25.0 ± 6.1 | 25.1 ± 6.9 |
| S2 amplitude (dB) | 22.4 ± 4.6 | 21.8 ± 4.7 | 20.0 ± 4.9 * | 20.7 ± 5.2 | 21.0 ± 5.5 |
| Patient | I + 60 | C − 30 | C + 30 | R + 30 | HA |
|---|---|---|---|---|---|
| 1 | 0.469 ** | 0.877 *** | 0.622 *** | 0.689 *** | 0.633 *** |
| 2 | 0.761 *** | 0.435 * | 0.904 *** | 0.043 | 0.619 ** |
| 3 | 0.791 *** | 0.956 *** | 0.817 *** | 0.903 *** | 0.831 *** |
| 4 | 0.611 *** | 0.326 | 0.543 ** | −0.067 | 0.820 *** |
| 5 | −0.155 | −0.155 | 0.722 *** | −0.324 | −0.361 |
| 6 | 0.643 *** | −0.186 | 0.429 * | 0.318 | 0.709 *** |
| 7 | 0.896 *** | 0.884 *** | 0.799 *** | 0.497 ** | 0.376 |
| 8 | 0.748 *** | 0.819 *** | 0.859 *** | −0.229 | 0.891 *** |
| 9 | 0.535 ** | 0.031 | 0.839 *** | −0.018 | 0.067 |
| 10 | 0.931 *** | 0.552 ** | 0.172 | 0.022 | −0.412 * |
| 11 | 0.621 *** | 0.354 | 0.076 | 0.769 *** | 0.394 * |
| 12 | 0.650 *** | 0.518 ** | 0.252 | −0.001 | 0.583 ** |
| 13 | 0.187 | −0.035 | 0.638 *** | 0.110 | 0.078 |
| 14 | 0.687 *** | 0.889 *** | 0.583 ** | 0.305 | 0.333 |
| 15 | 0.950 *** | 0.944 *** | 0.768 *** | 0.191 | 0.774 *** |
| 16 | 0.435 * | 0.371 | 0.411 | 0.664 ** | 0.226 |
| 17 | 0.907 *** | 0.034 | 0.885 *** | 0.374 | 0.062 |
| 18 | 0.965 *** | 0.948 *** | 0.883 *** | 0.844 *** | 0.863 *** |
| 19 | 0.758 *** | 0.488 * | 0.479* | 0.673 *** | −0.298 |
| 20 | 0.772 *** | 0.248 | 0.600 ** | 0.834 *** | 0.745 *** |
| 21 | 0.478 ** | 0.253 | −0.401 | 0.389 * | 0.376 * |
| 22 | 0.921 *** | 0.942 *** | 0.238 | 0.754 *** | 0.927 *** |
| 23 | 0.882 *** | 0.821 *** | −0.189 | 0.066 | 0.355 * |
| 24 | 0.524 ** | 0.620 *** | 0.643 *** | 0.515 ** | 0.125 |
| Median, IQR | 0.717 (0.532–0.886) | 0.503 (0.252–0.879) | 0.611 (0.372–0.803) | 0.346 (0.037–0.677) | 0.385 (0.113–0.753) |
| I + 60 | C − 30 | C + 30 | R + 30 | HA | ||
|---|---|---|---|---|---|---|
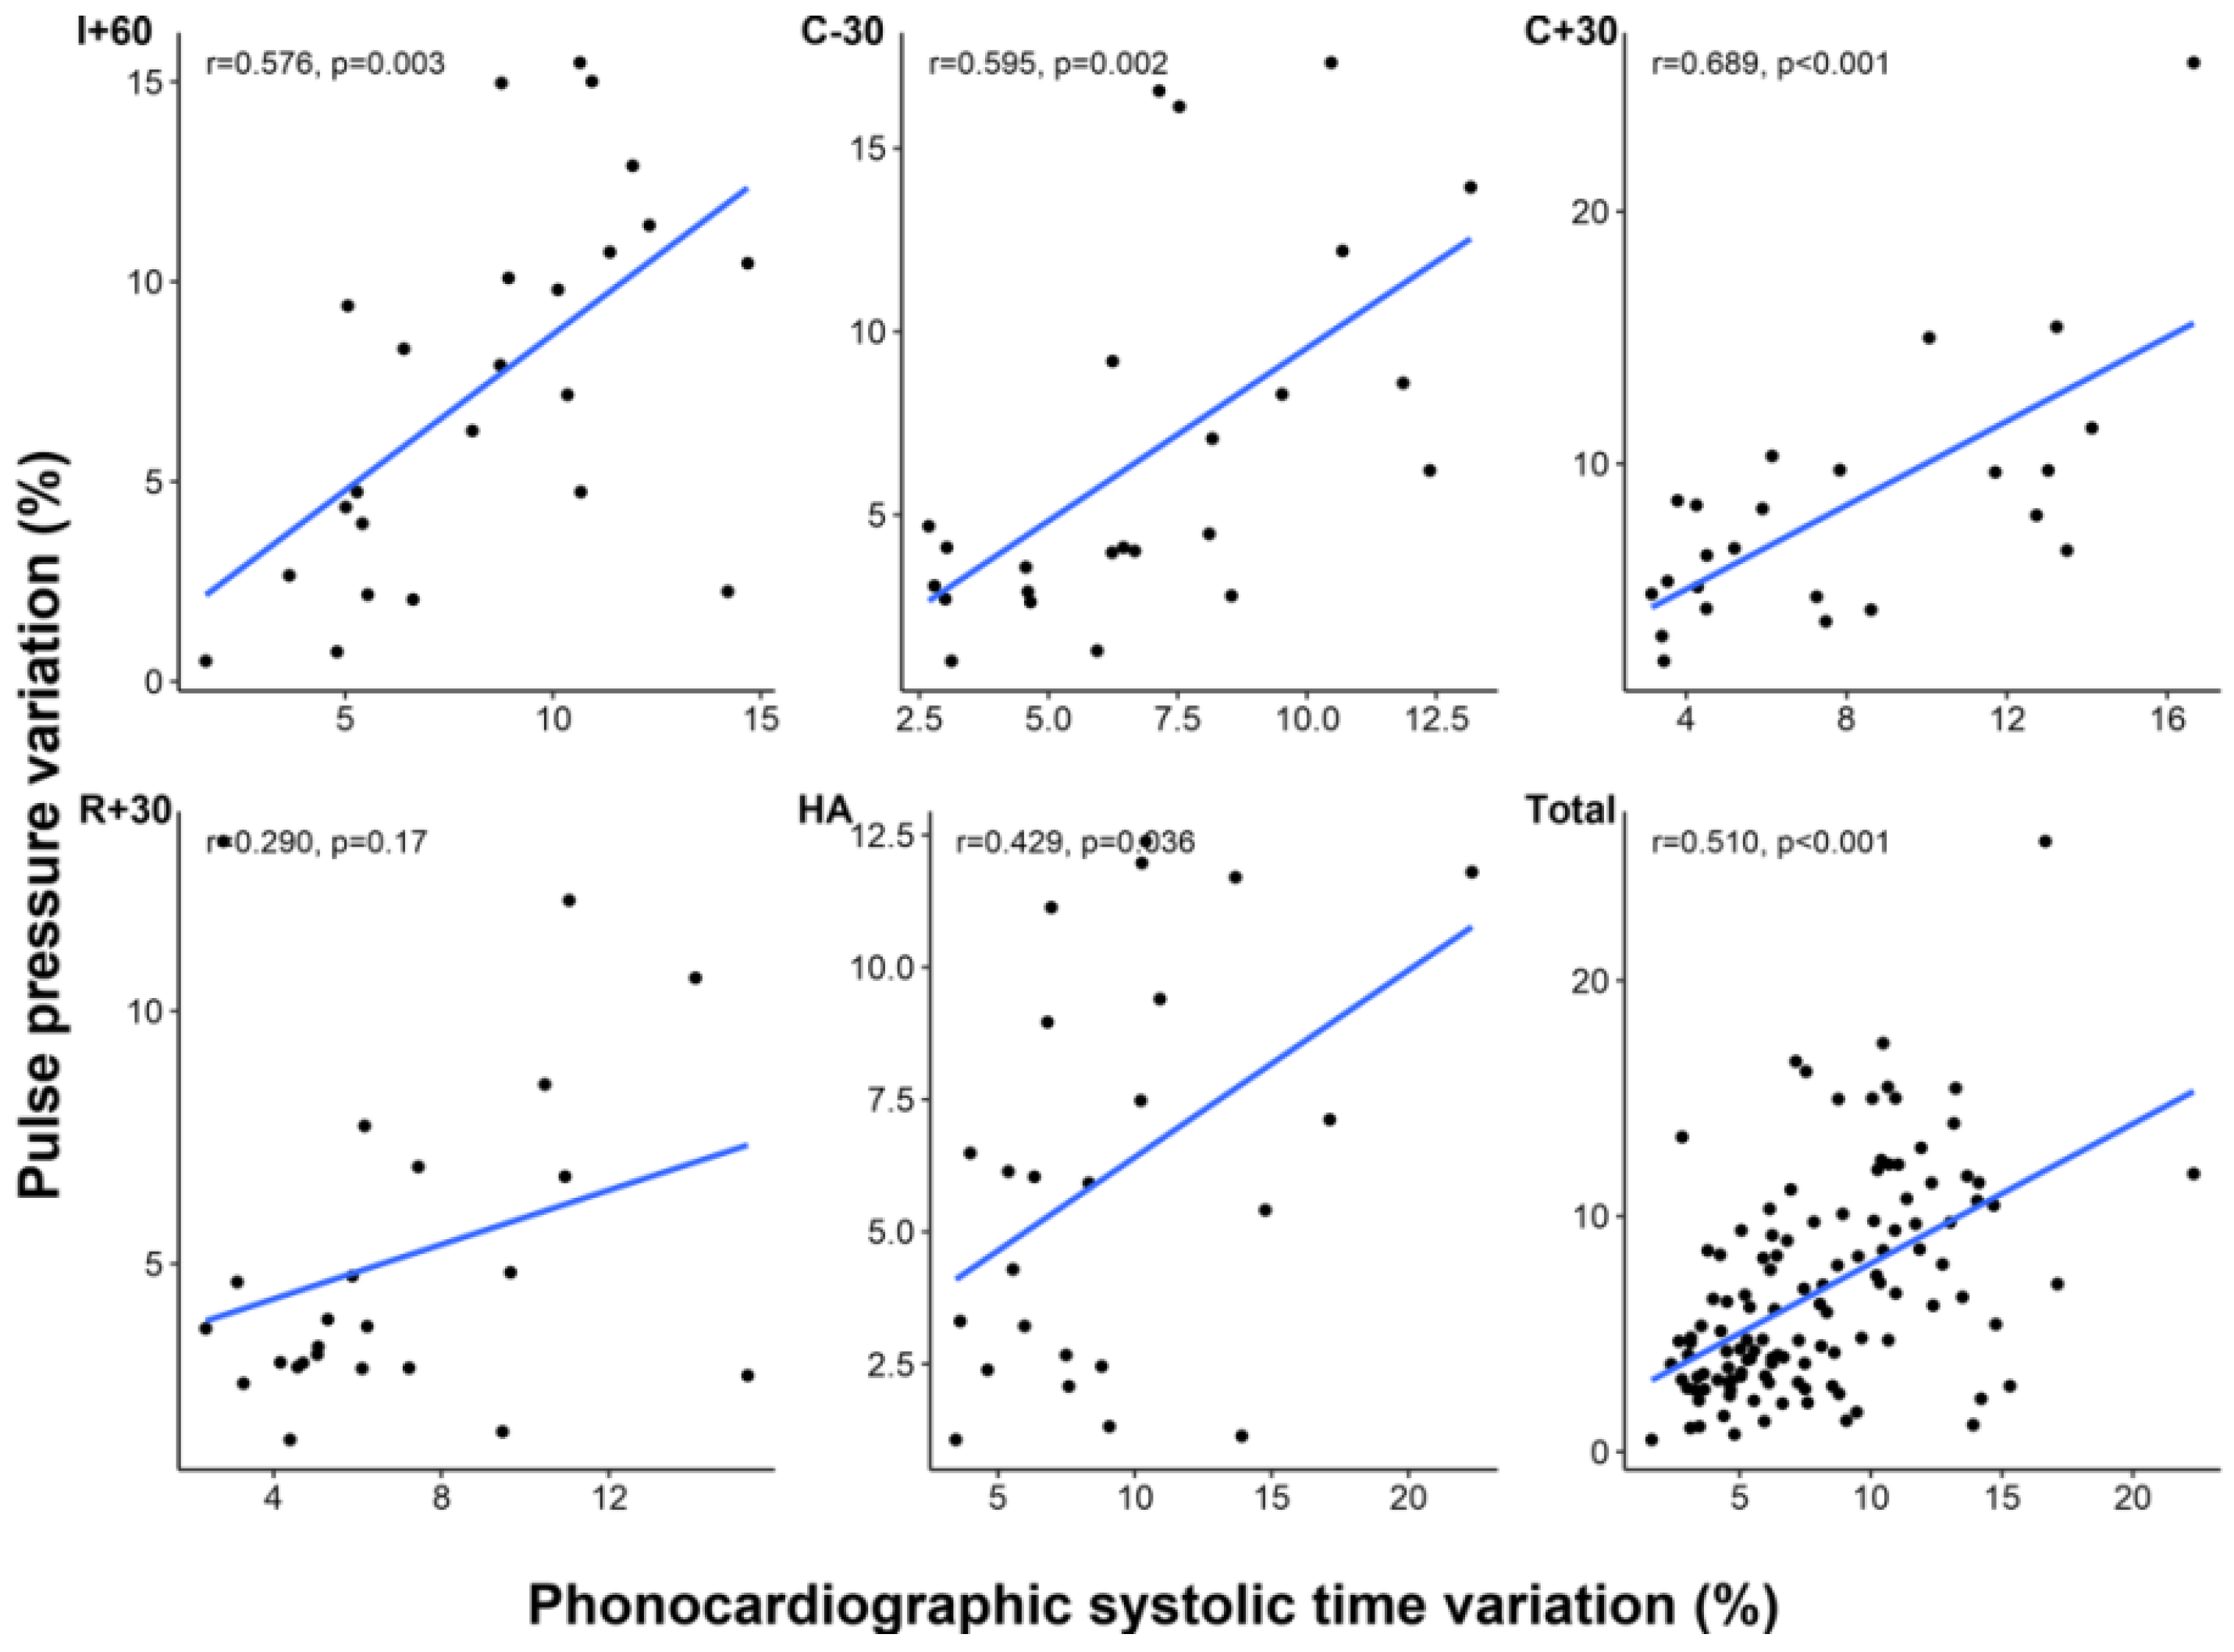
| PPV vs. PSV | r | 0.576 | 0.595 | 0.689 | 0.290 | 0.429 |
| p | 0.003 | 0.002 | <0.001 | 0.170 | 0.036 | |
| SVV vs. PSV | r | 0.407 | 0.408 | 0.407 | 0.335 | 0.055 |
| p | 0.048 | 0.048 | 0.048 | 0.109 | 0.797 | |
© 2019 by the authors. Licensee MDPI, Basel, Switzerland. This article is an open access article distributed under the terms and conditions of the Creative Commons Attribution (CC BY) license (http://creativecommons.org/licenses/by/4.0/).
Share and Cite
Park, Y.-S.; Moon, Y.-J.; Kim, S.-H.; Kim, J.-M.; Song, J.-G.; Hwang, G.-S. Beat-to-Beat Tracking of Pulse Pressure and Its Respiratory Variation Using Heart Sound Signal in Patients Undergoing Liver Transplantation. J. Clin. Med. 2019, 8, 593. https://doi.org/10.3390/jcm8050593
Park Y-S, Moon Y-J, Kim S-H, Kim J-M, Song J-G, Hwang G-S. Beat-to-Beat Tracking of Pulse Pressure and Its Respiratory Variation Using Heart Sound Signal in Patients Undergoing Liver Transplantation. Journal of Clinical Medicine. 2019; 8(5):593. https://doi.org/10.3390/jcm8050593
Chicago/Turabian StylePark, Yong-Seok, Young-Jin Moon, Sung-Hoon Kim, Jae-Man Kim, Jun-Gol Song, and Gyu-Sam Hwang. 2019. "Beat-to-Beat Tracking of Pulse Pressure and Its Respiratory Variation Using Heart Sound Signal in Patients Undergoing Liver Transplantation" Journal of Clinical Medicine 8, no. 5: 593. https://doi.org/10.3390/jcm8050593
APA StylePark, Y.-S., Moon, Y.-J., Kim, S.-H., Kim, J.-M., Song, J.-G., & Hwang, G.-S. (2019). Beat-to-Beat Tracking of Pulse Pressure and Its Respiratory Variation Using Heart Sound Signal in Patients Undergoing Liver Transplantation. Journal of Clinical Medicine, 8(5), 593. https://doi.org/10.3390/jcm8050593