Re-Evaluating the Protective Effect of Hemodialysis Catheter Locking Solutions in Hemodialysis Patients

Abstract
1. Introduction
1.1. Variety of New Strategies for Locking Solutions to Avoid Catheter Infection and Catheter Malfunction in Hemodialysis Patients
1.2. Rationale for Re-Evaluating the Protective Effect of Hemodialysis Catheter Locking Solutions in Hemodialysis Patients
2. Experimental Section
2.1. Search Strategy and Inclusion Criteria
2.2. Definition of Study Outcomes
2.3. Data Extraction and Quality Assessment
2.4. Data Synthesis and Analysis
3. Results
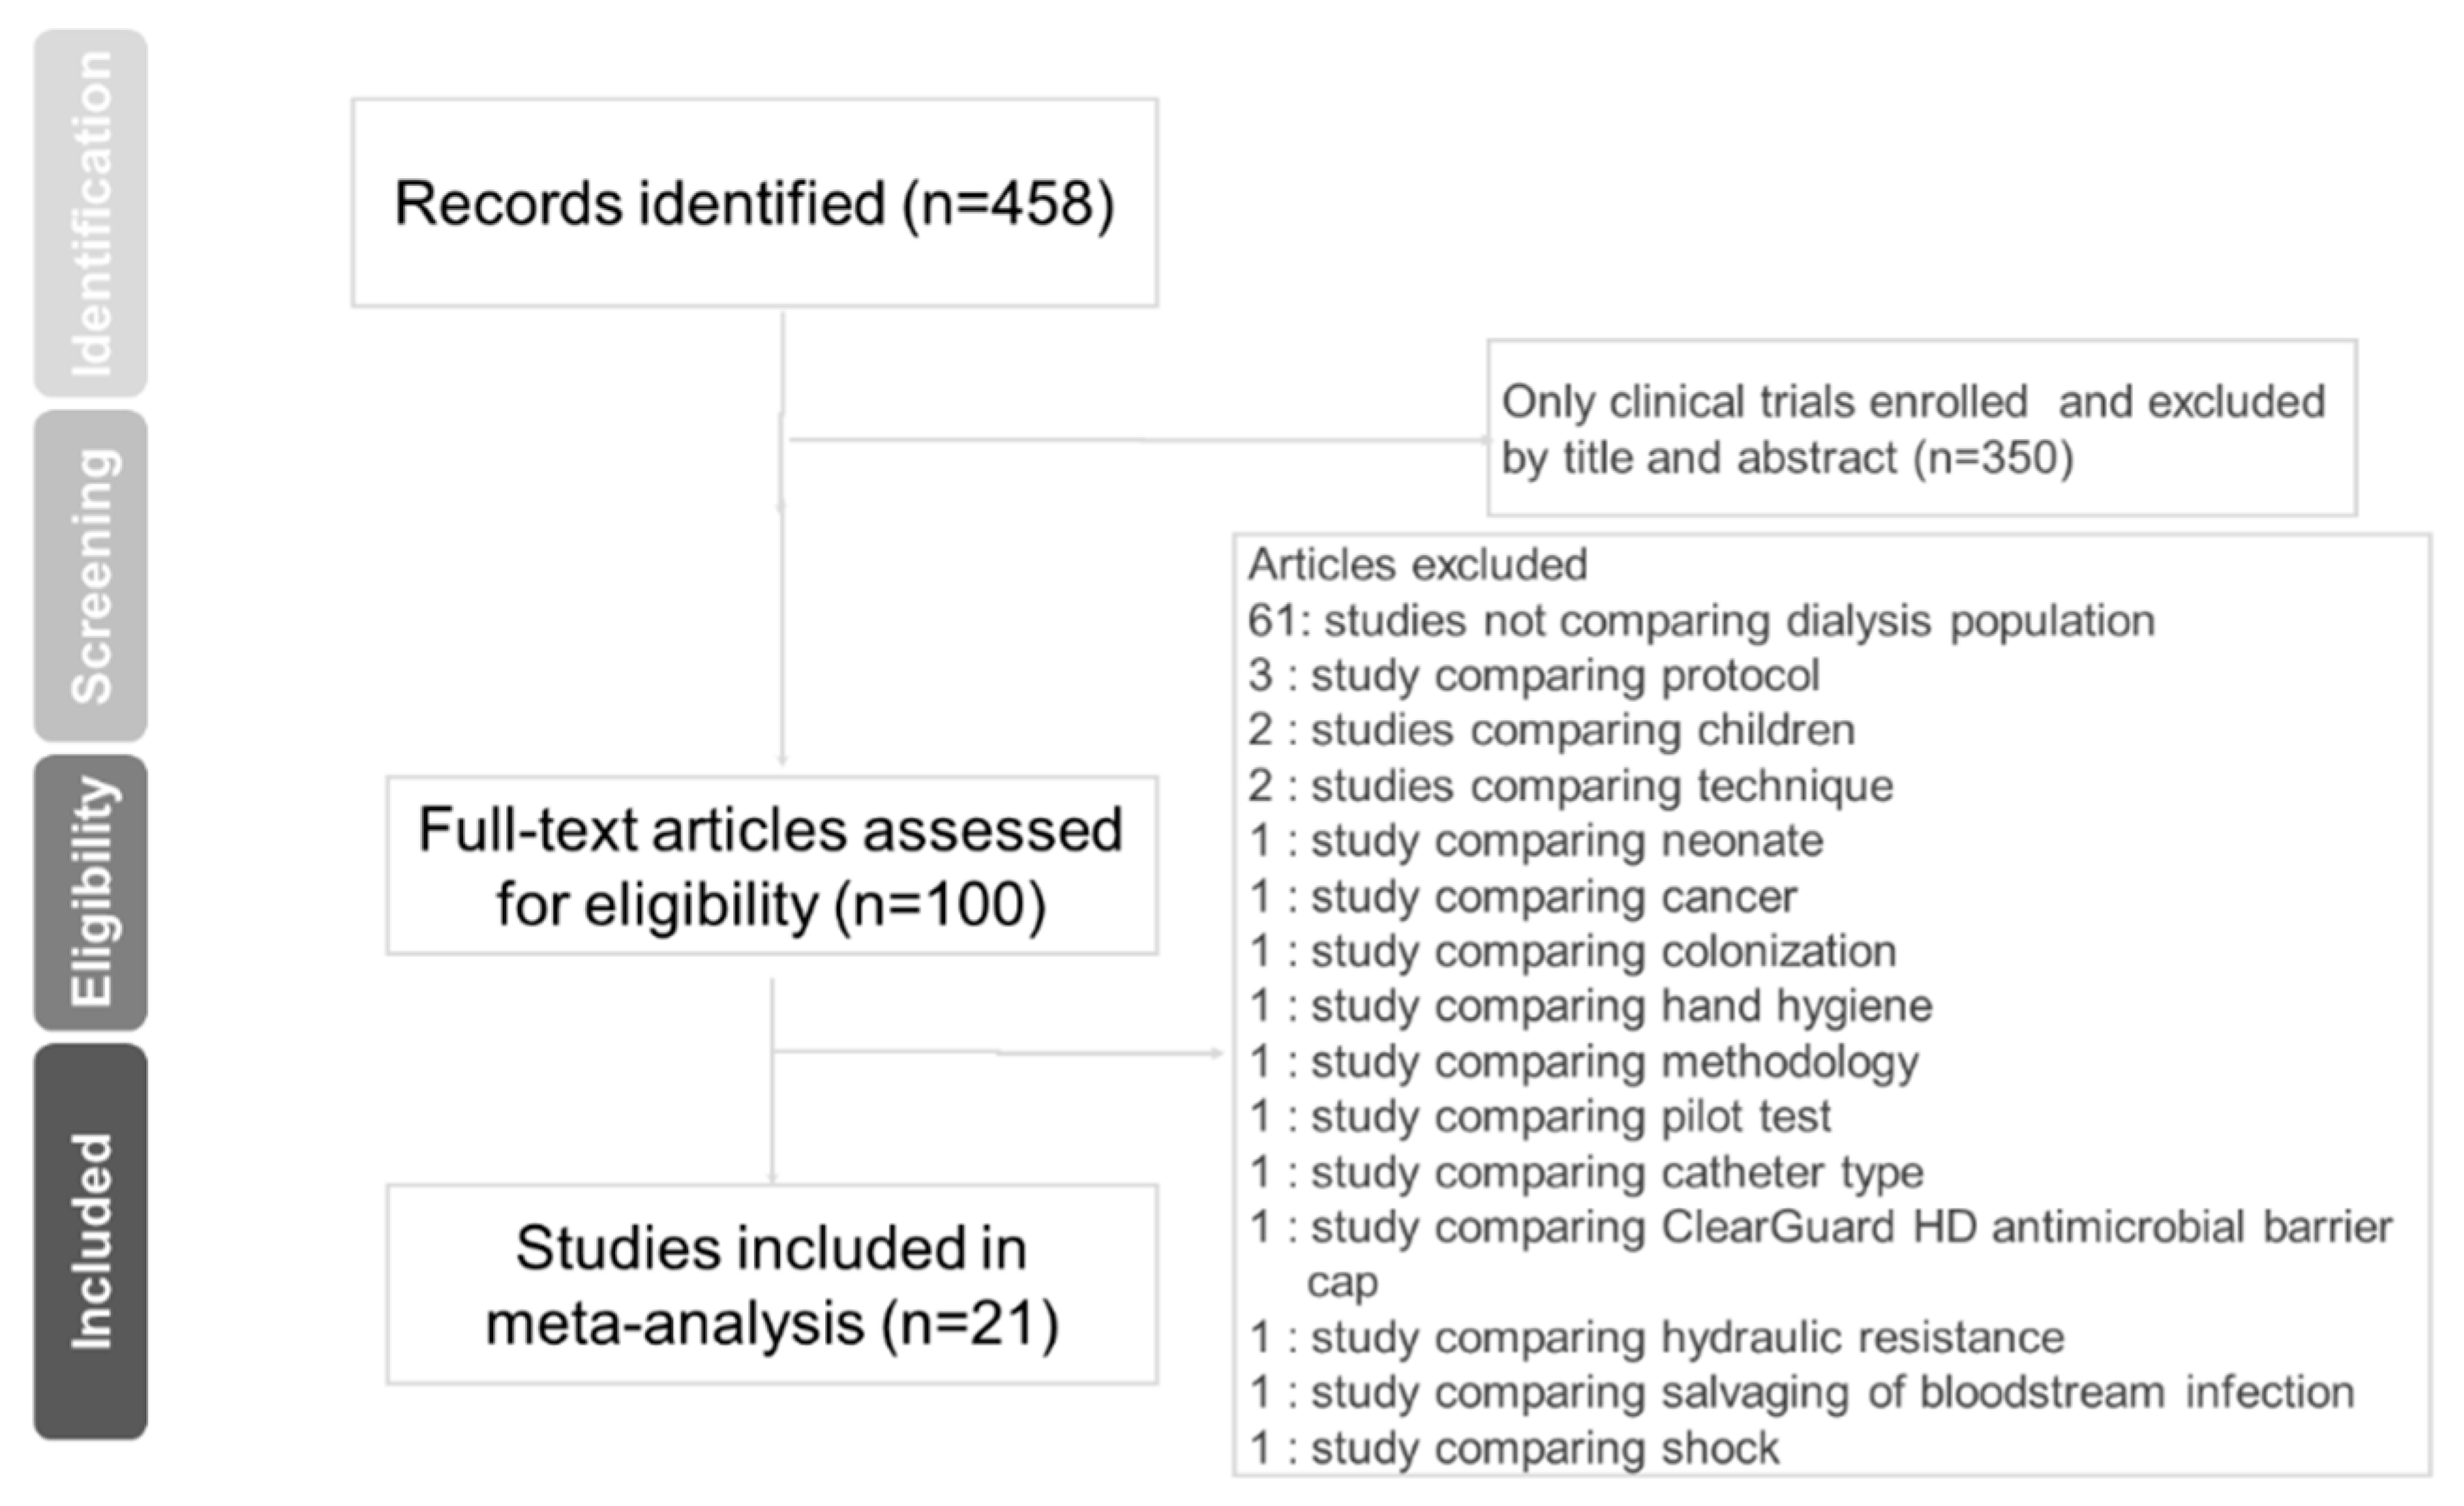
3.1. Eligible Studies
3.2. Pooled Odds for Primary Outcomes and Subgroup Analysis
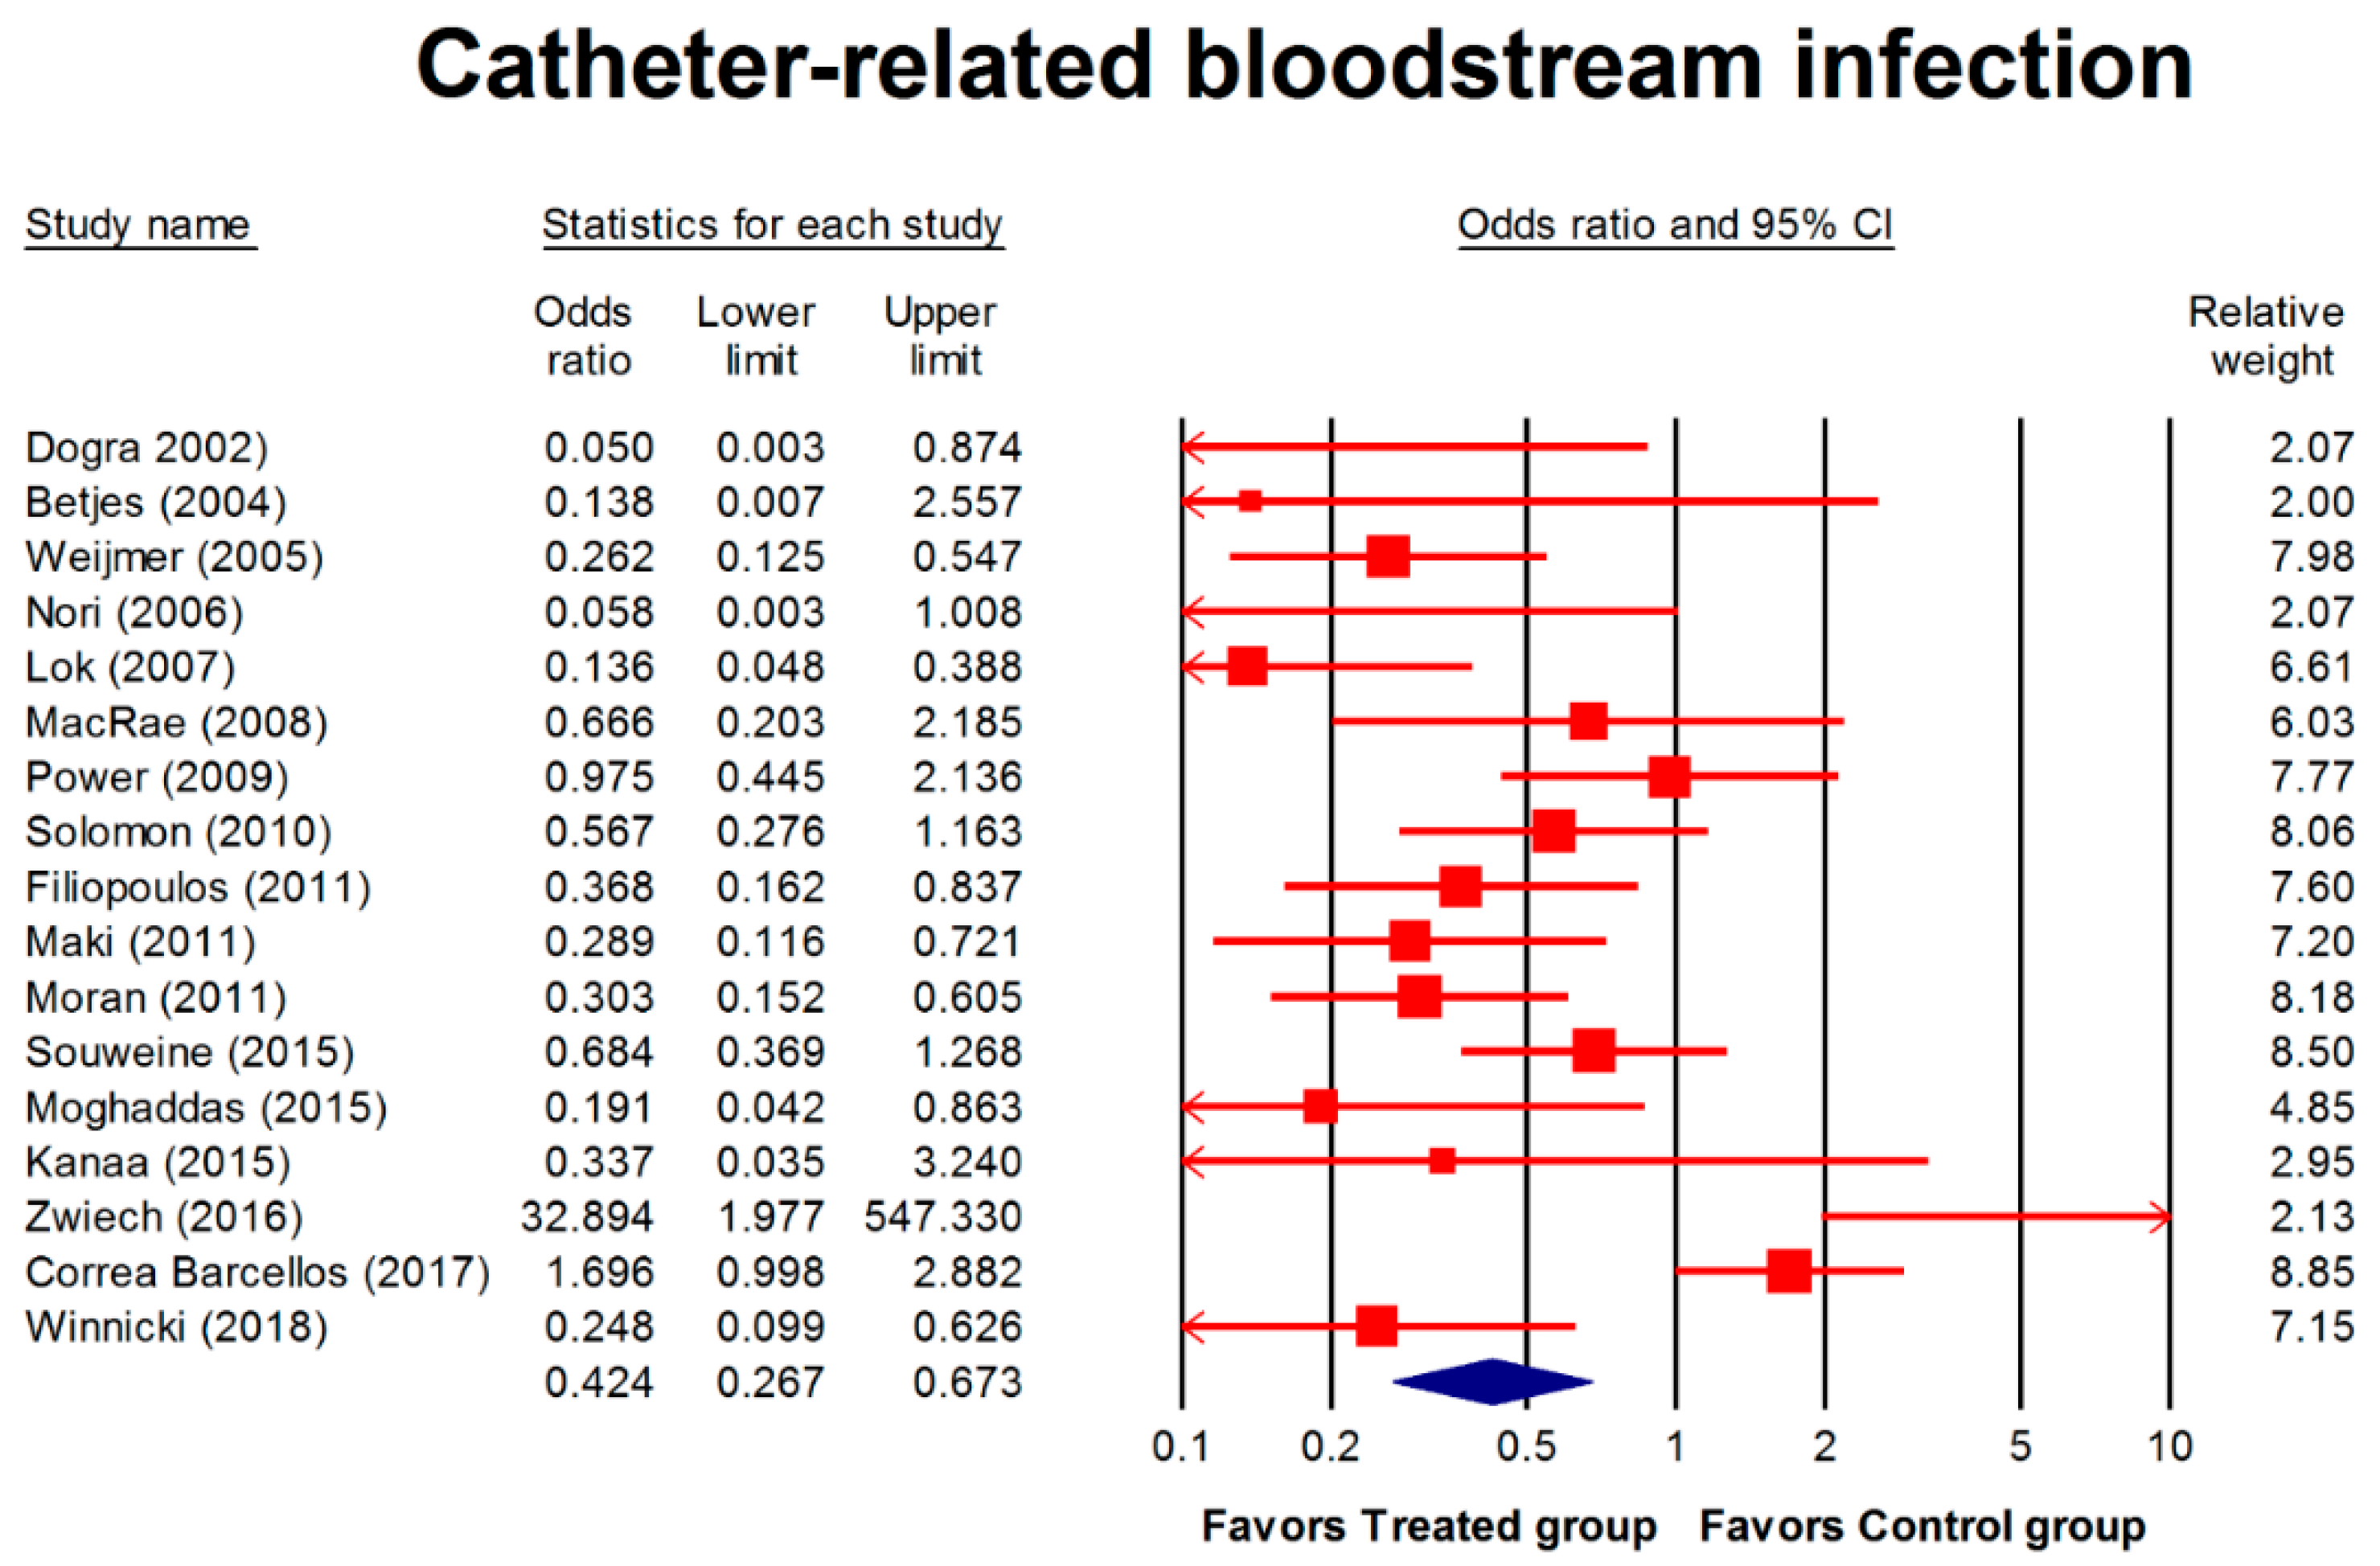
3.2.1. Catheter-Related Bloodstream Infection (CRBSI)
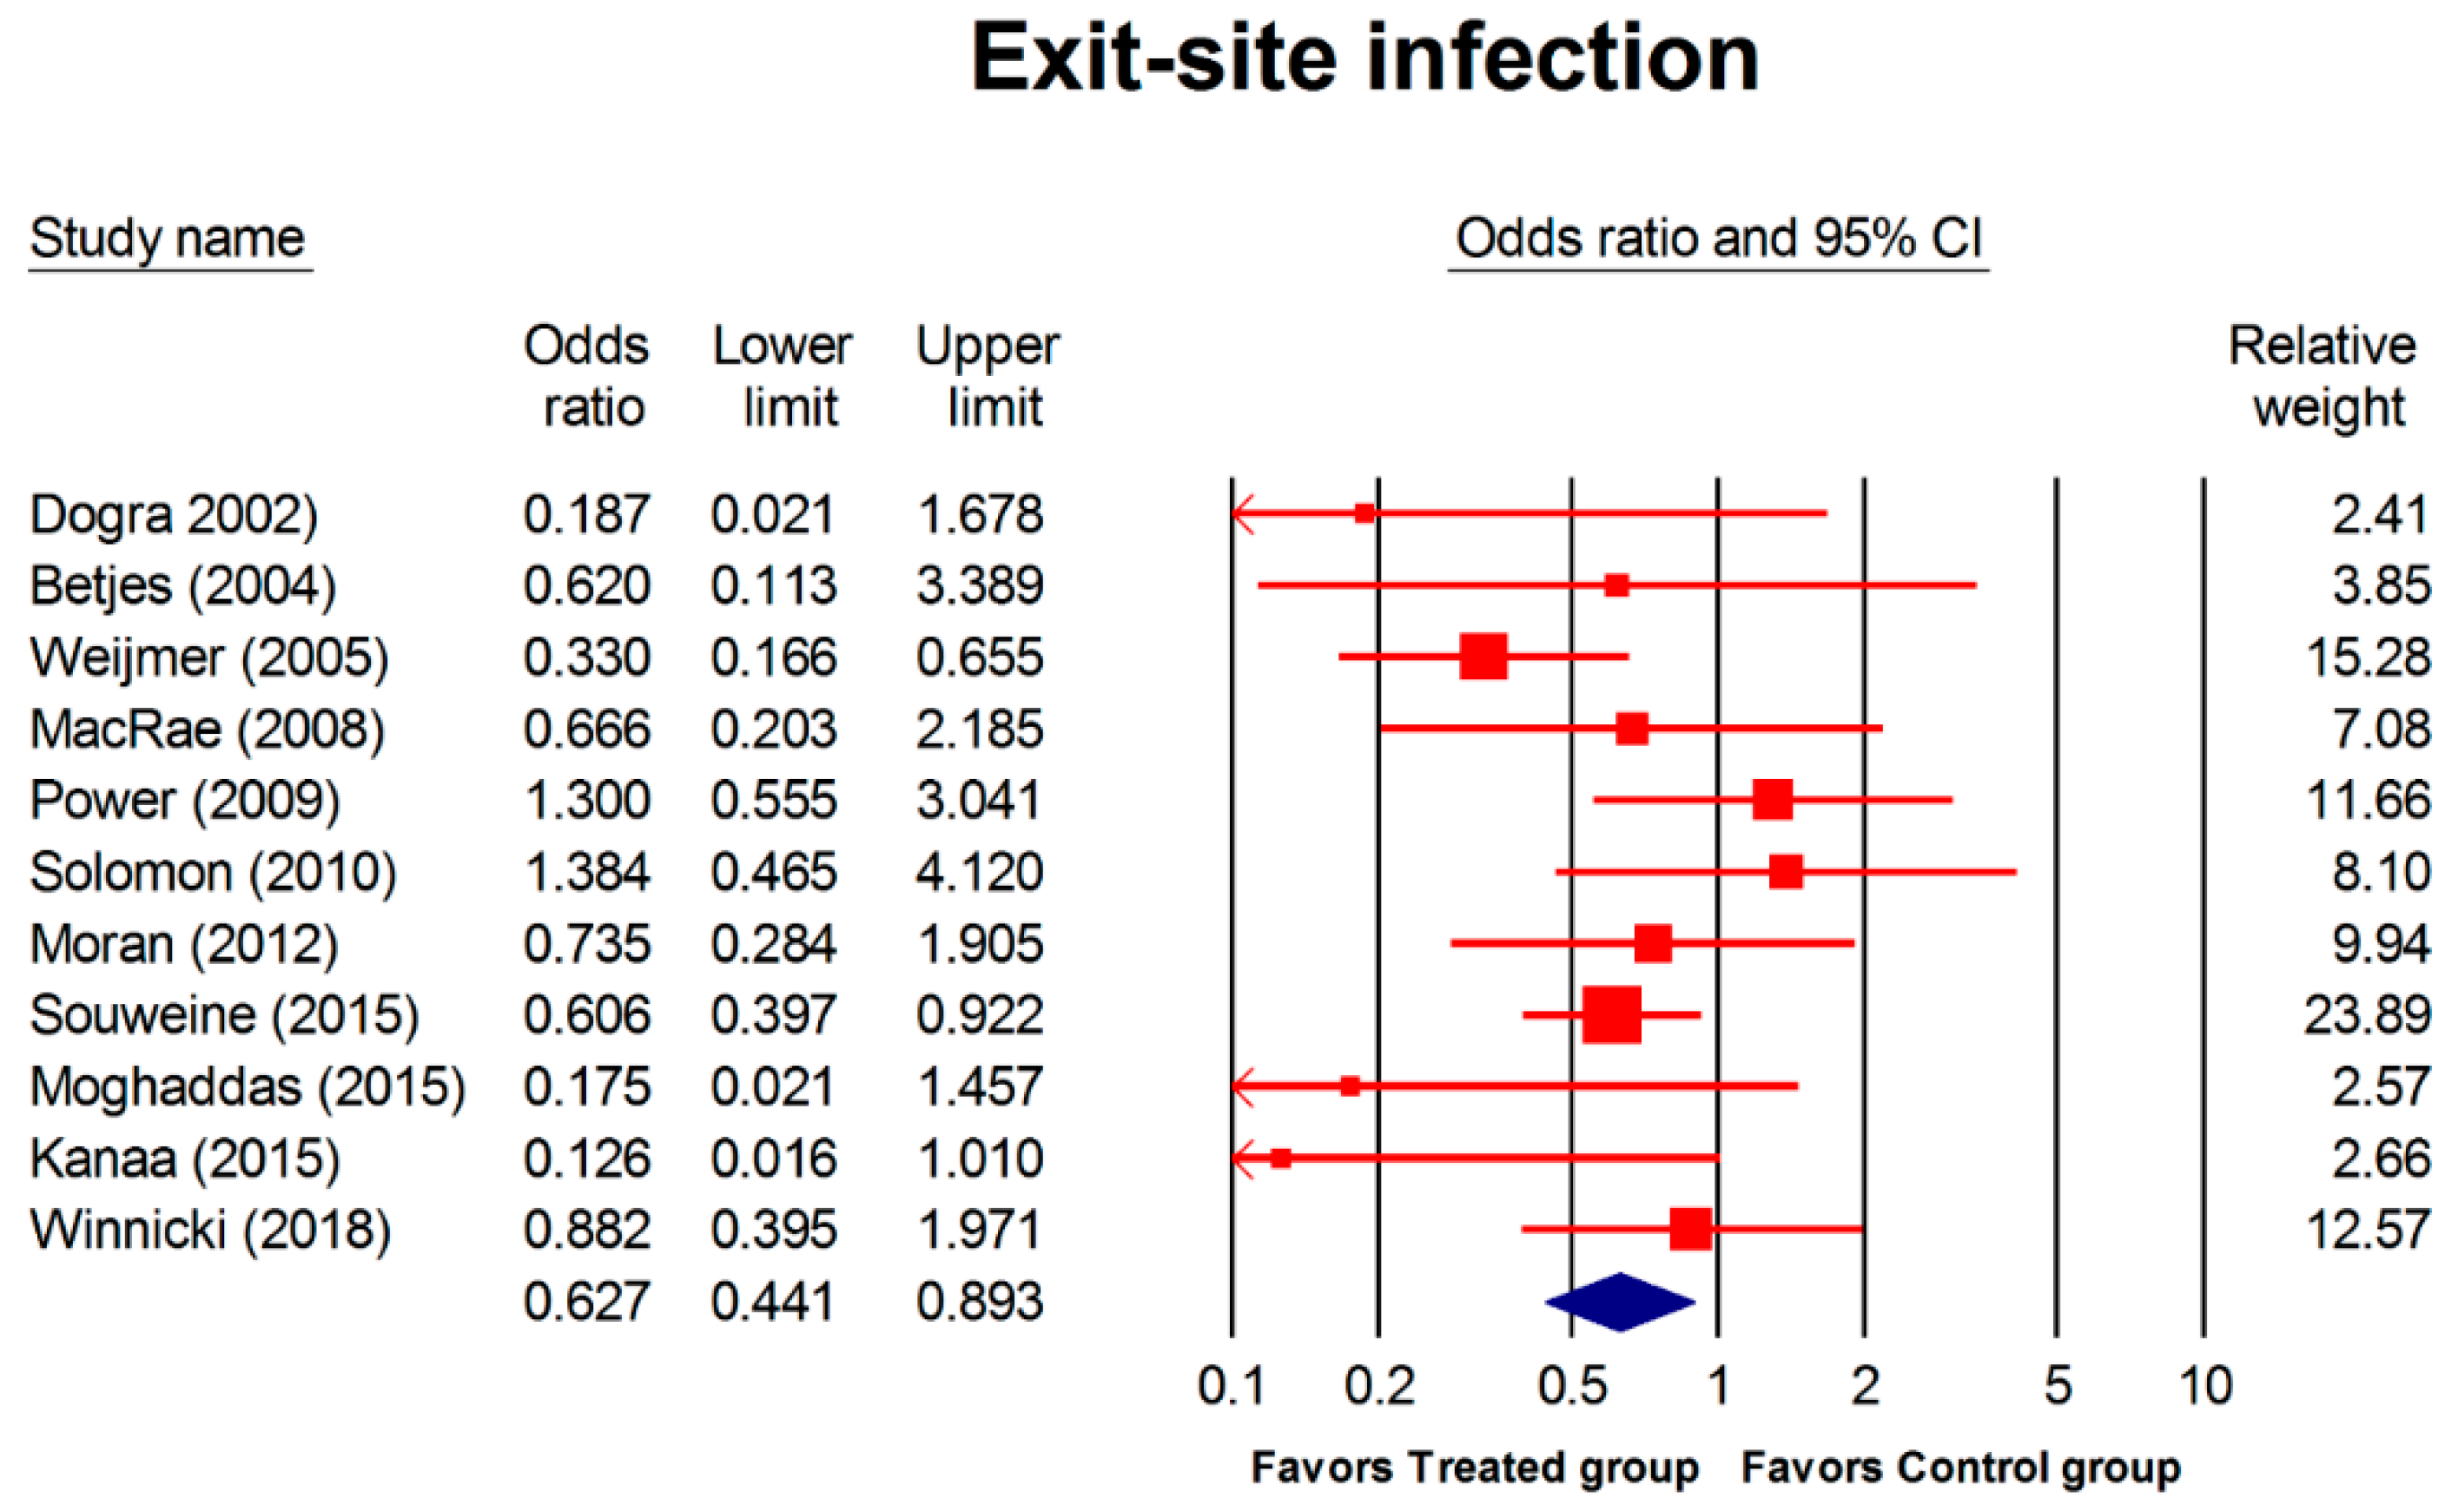
3.2.2. Exit-Site Infection (ESI)
3.3. Pooled Odds for Secondary Outcomes and Subgroup Analysis
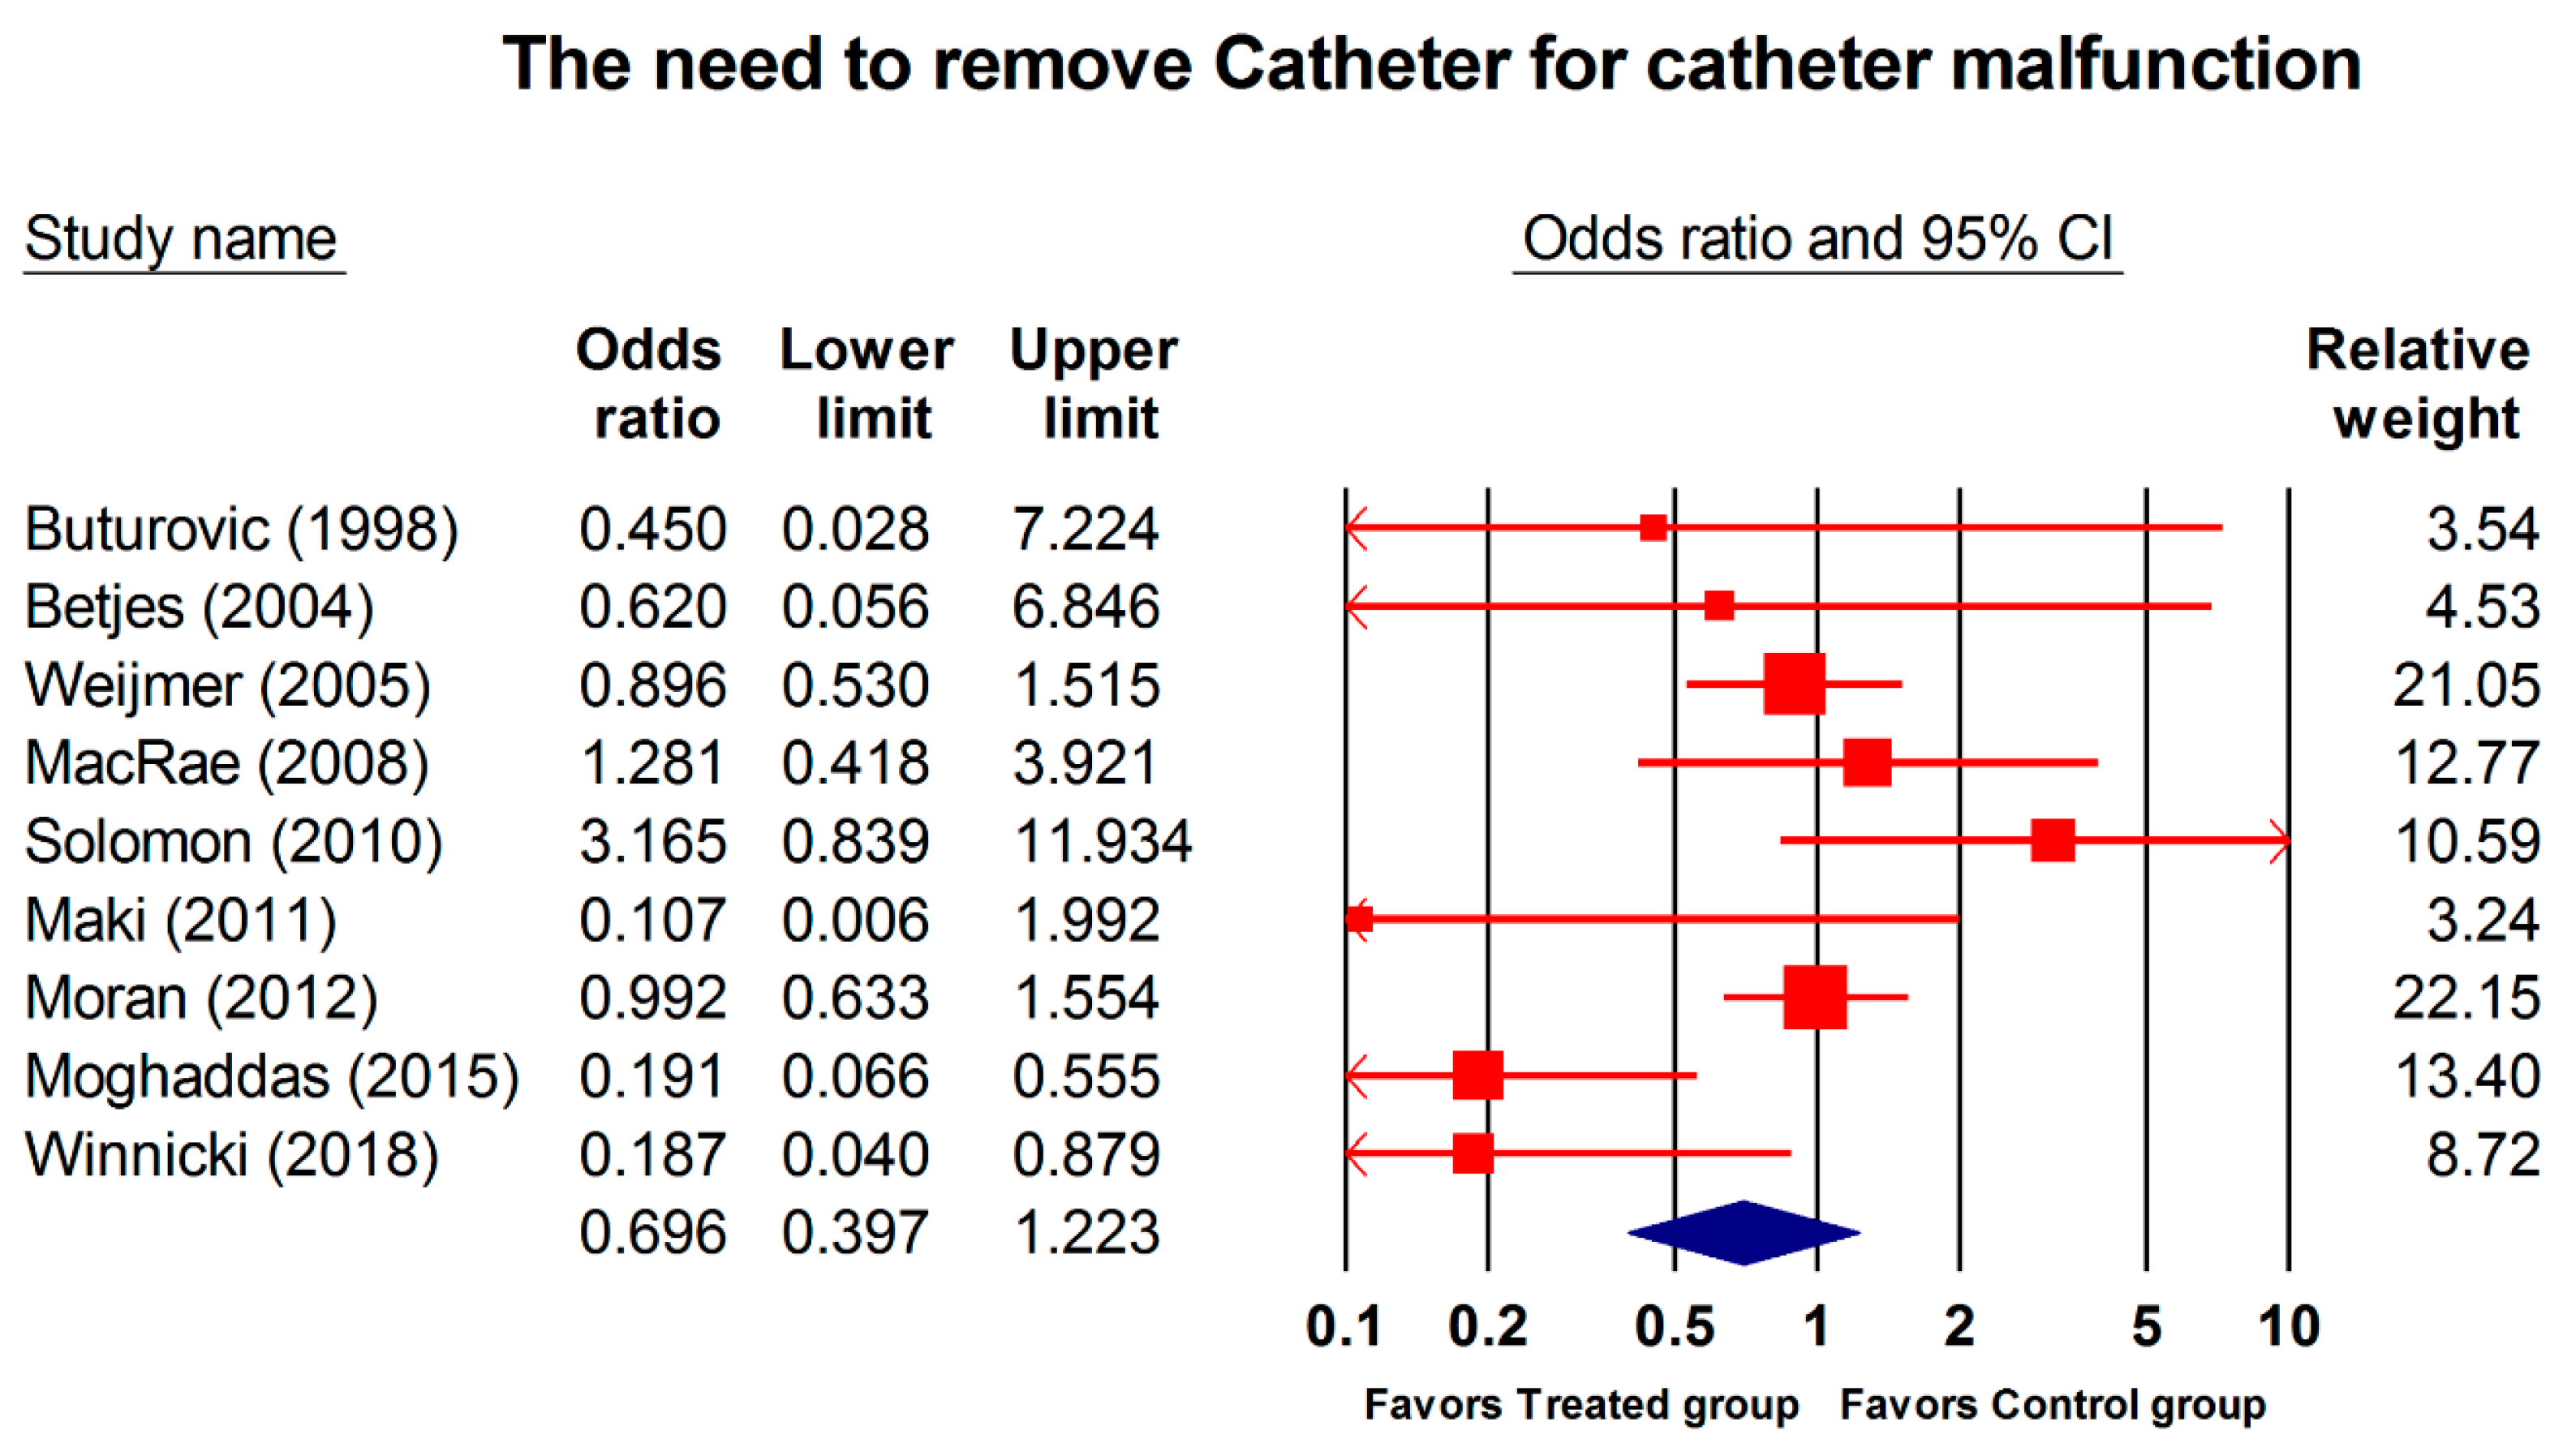
3.3.1. Catheter Withdrawal Due to Malfunction
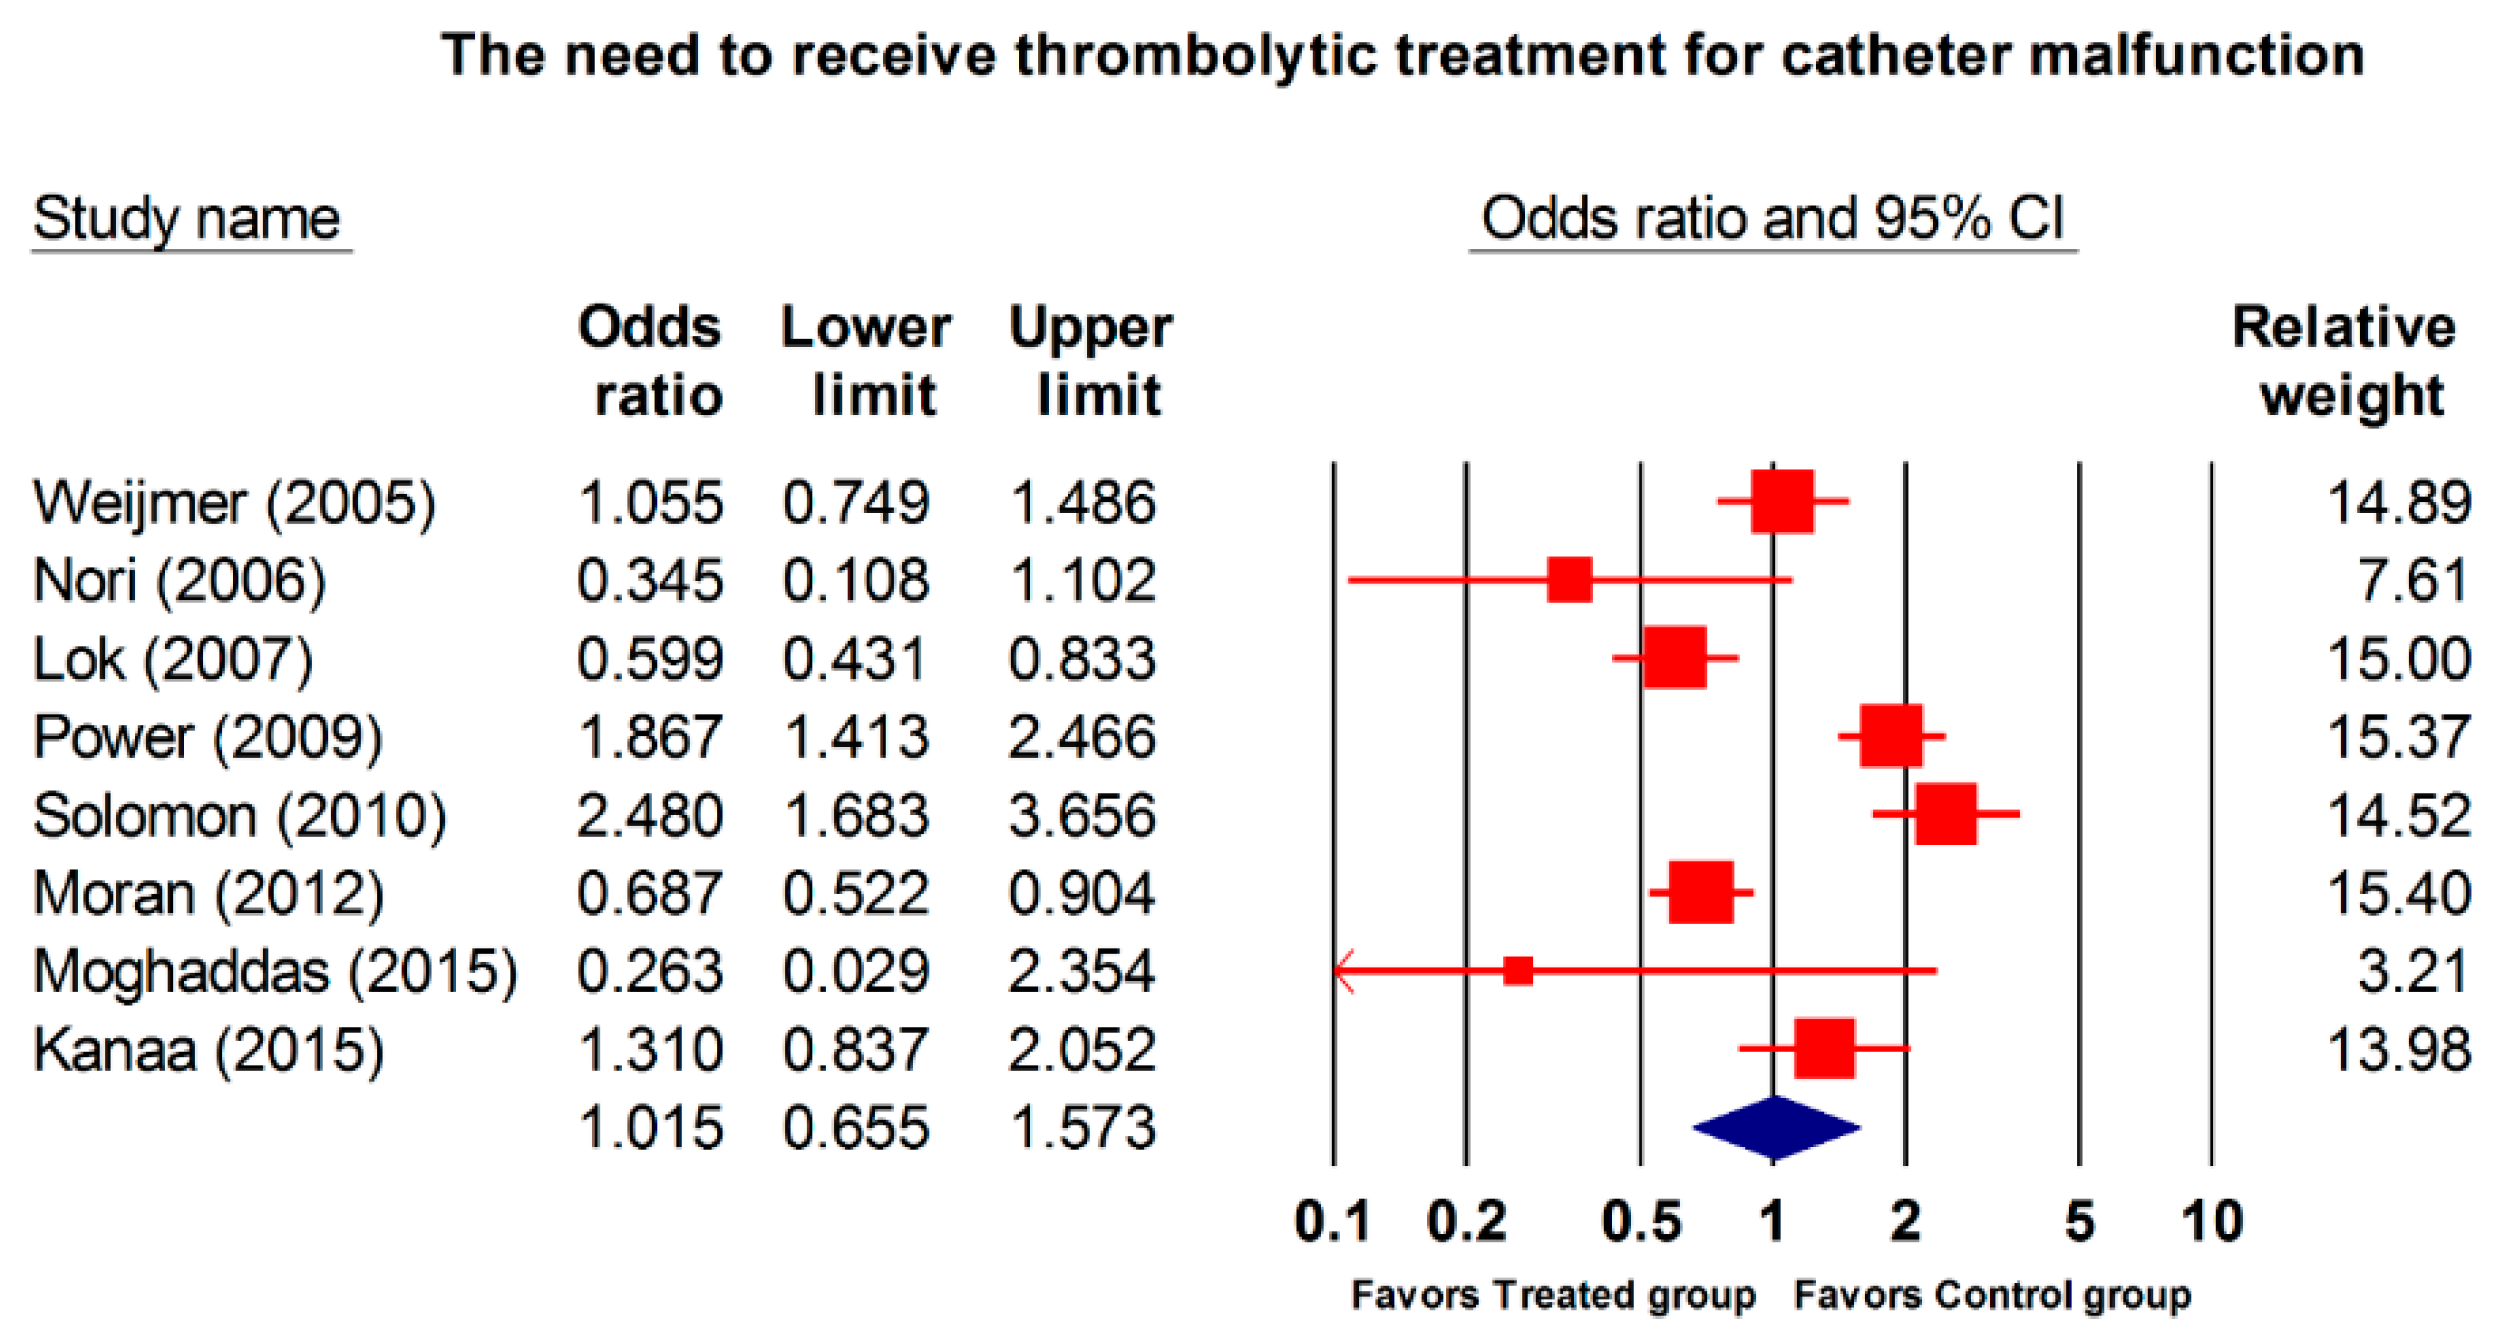
3.3.2. Thrombolytic Treatment Due to Catheter Malfunction
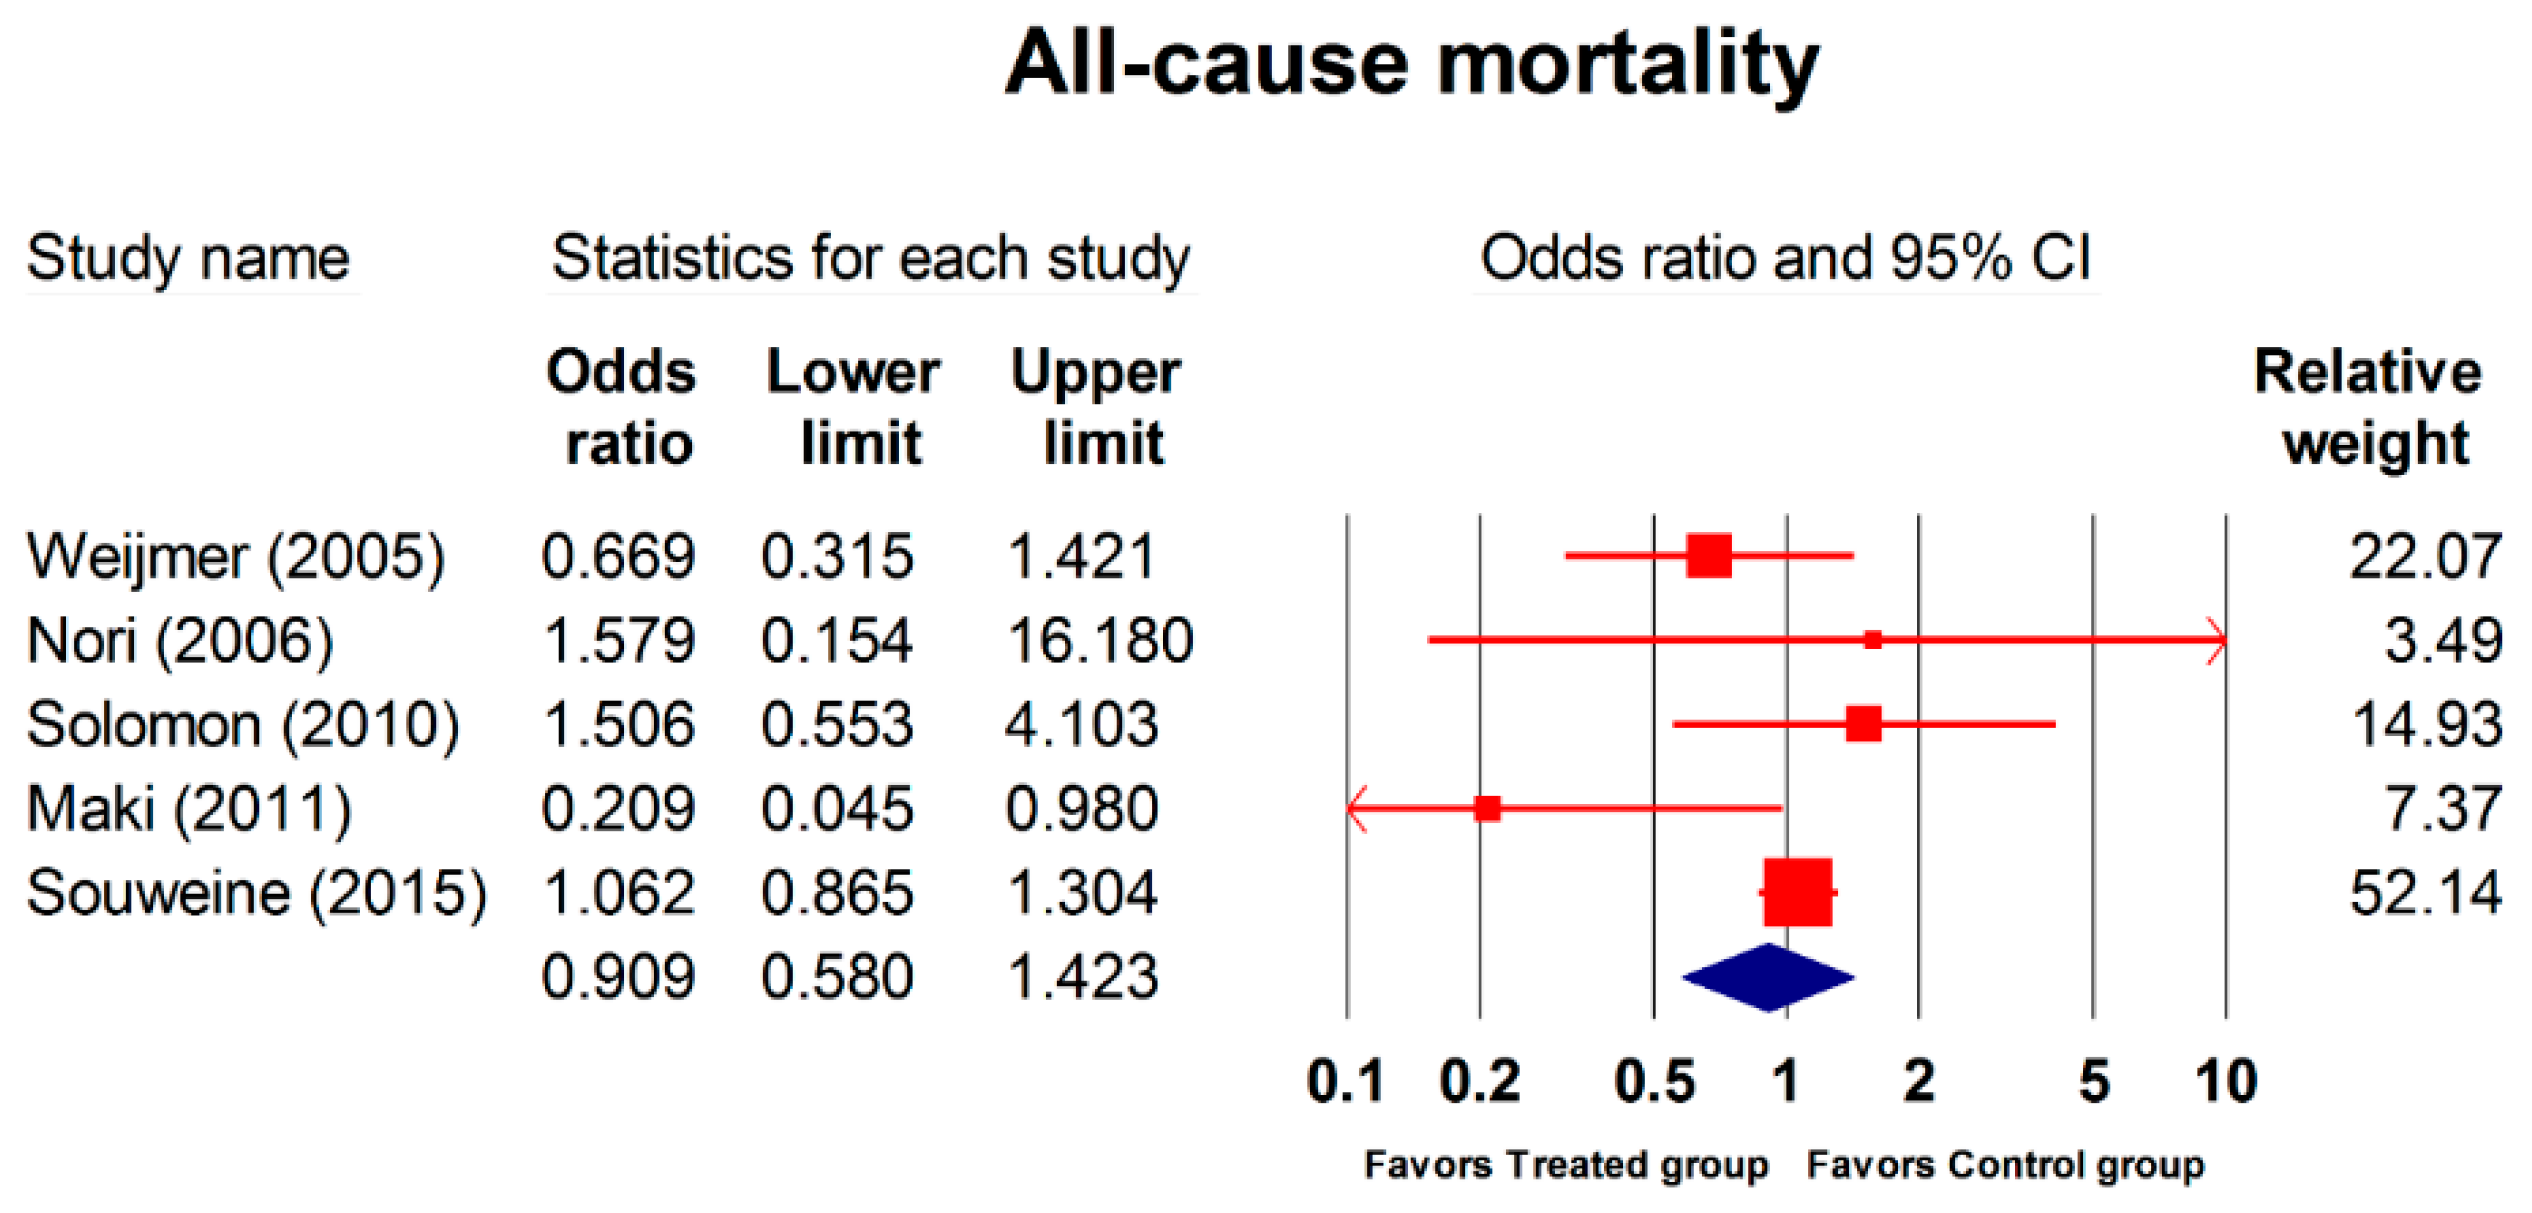
3.3.3. All-Cause Mortality
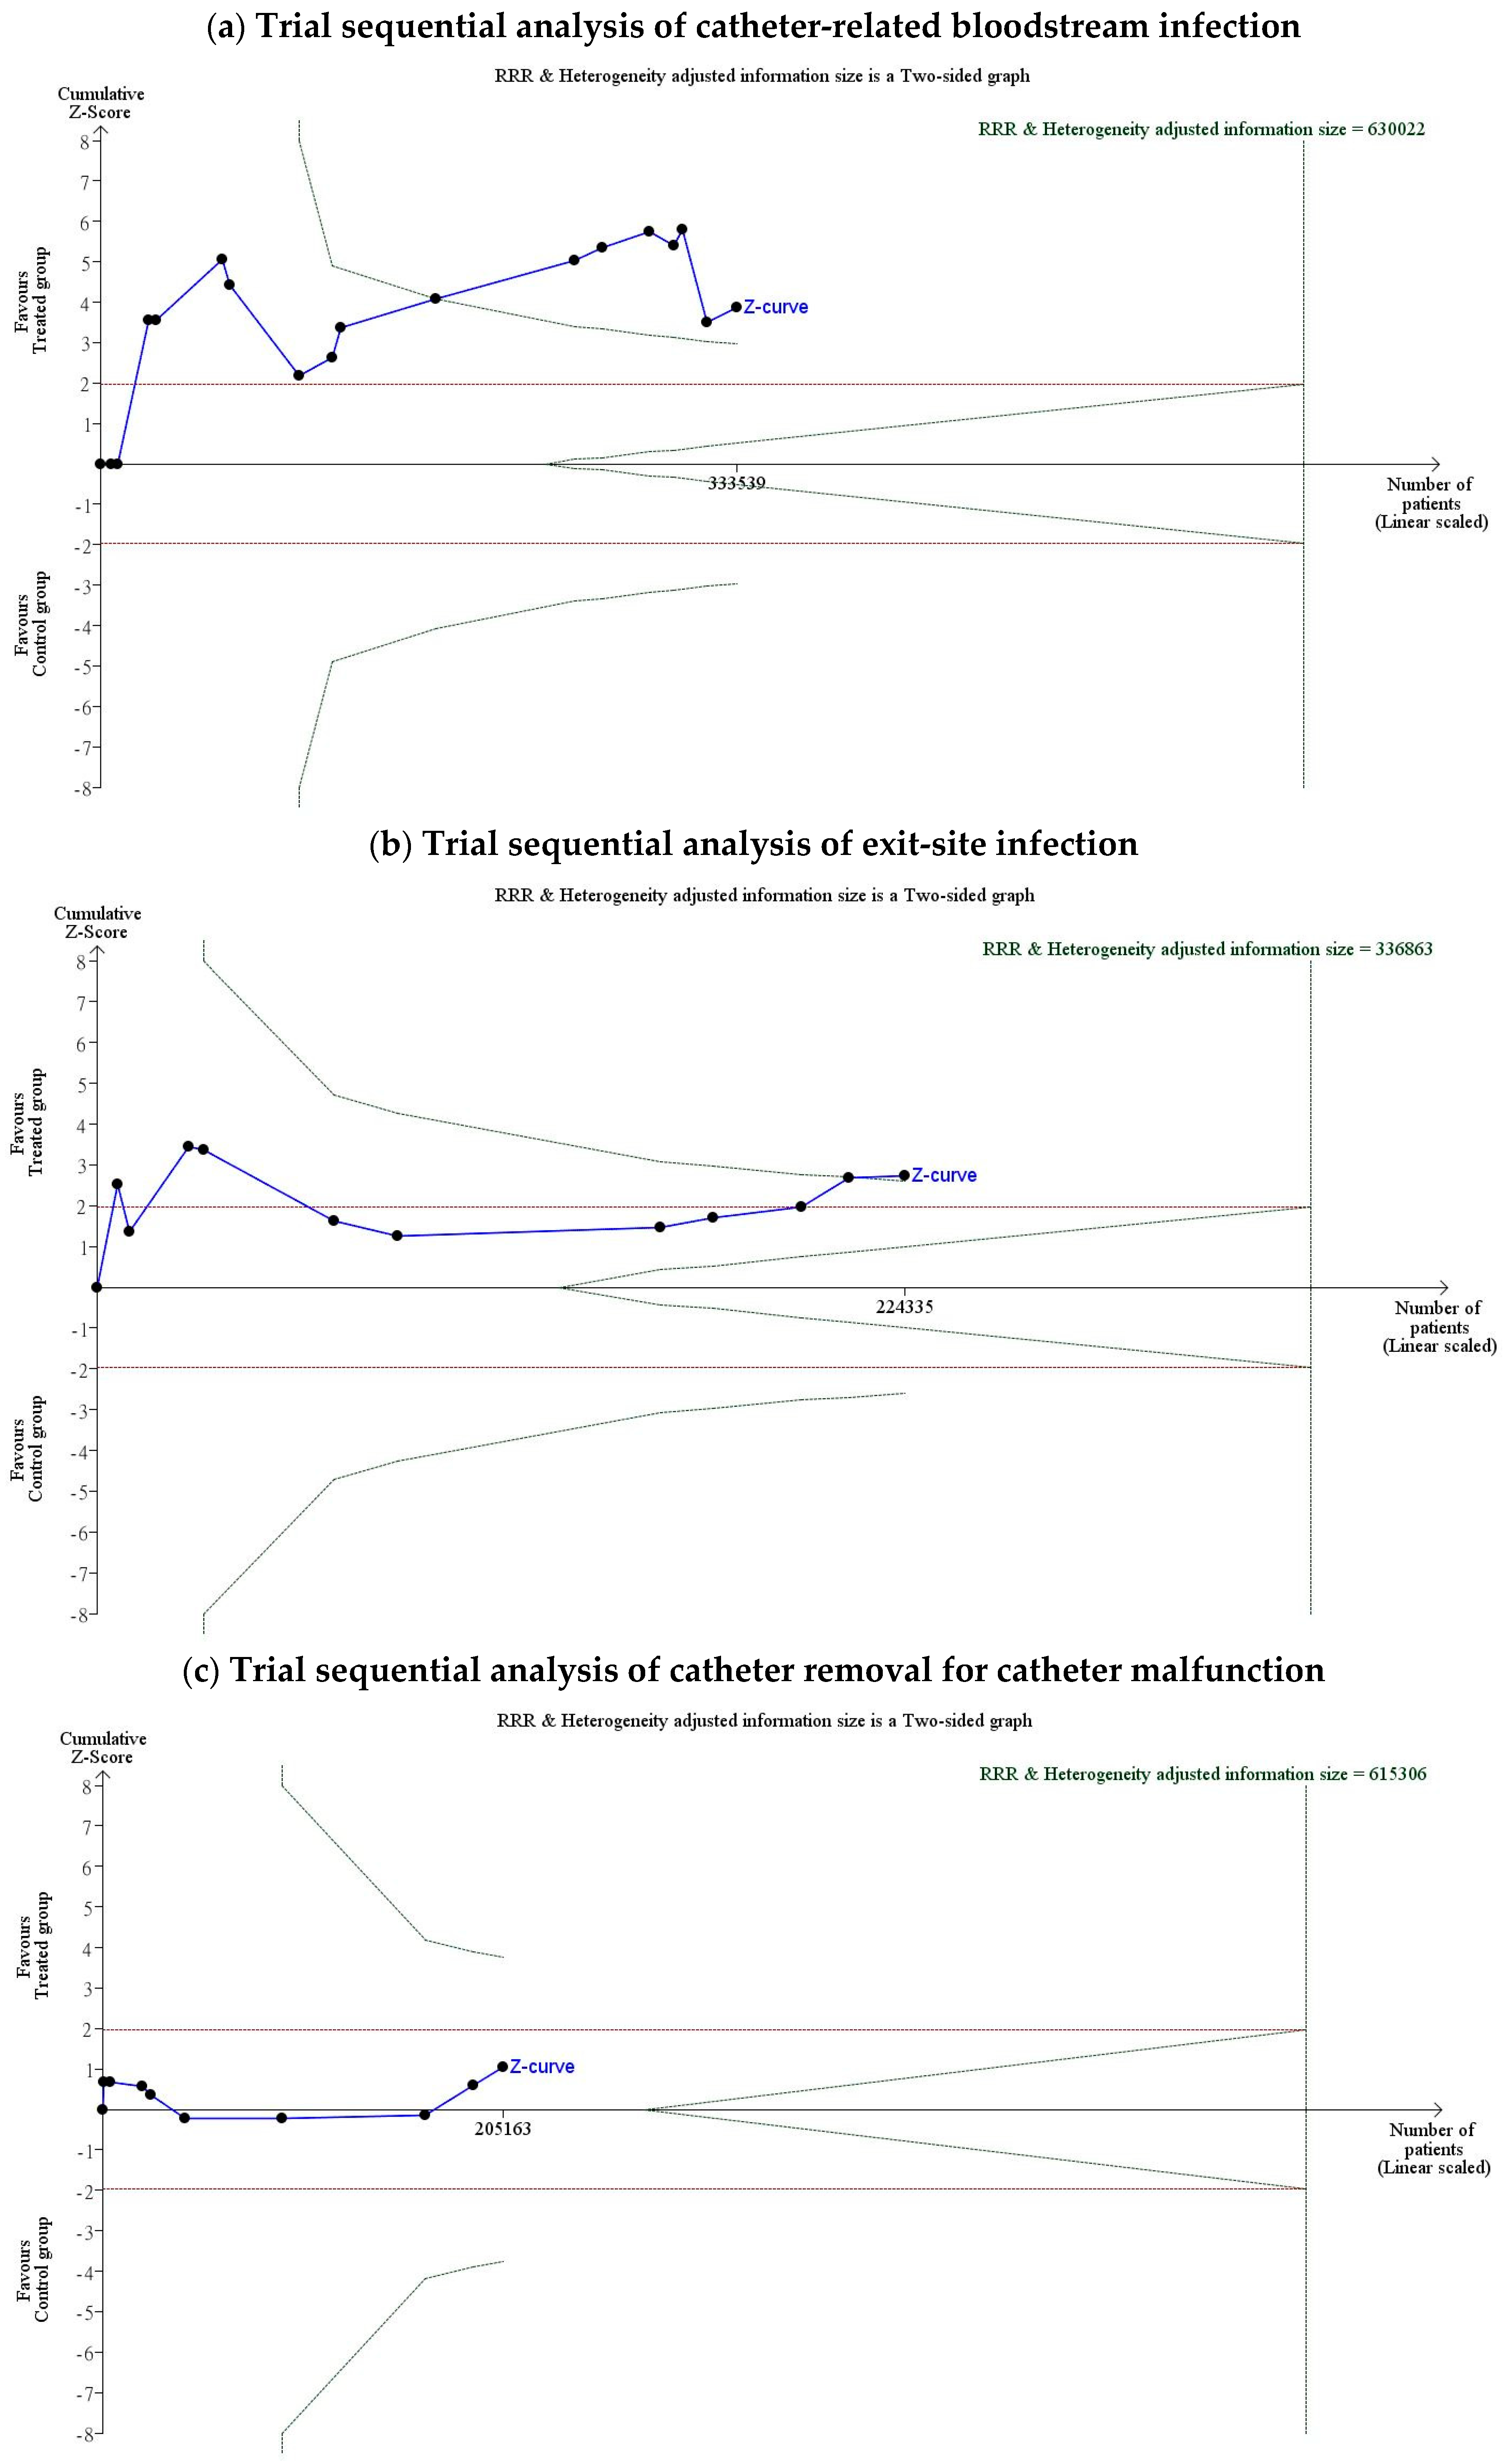
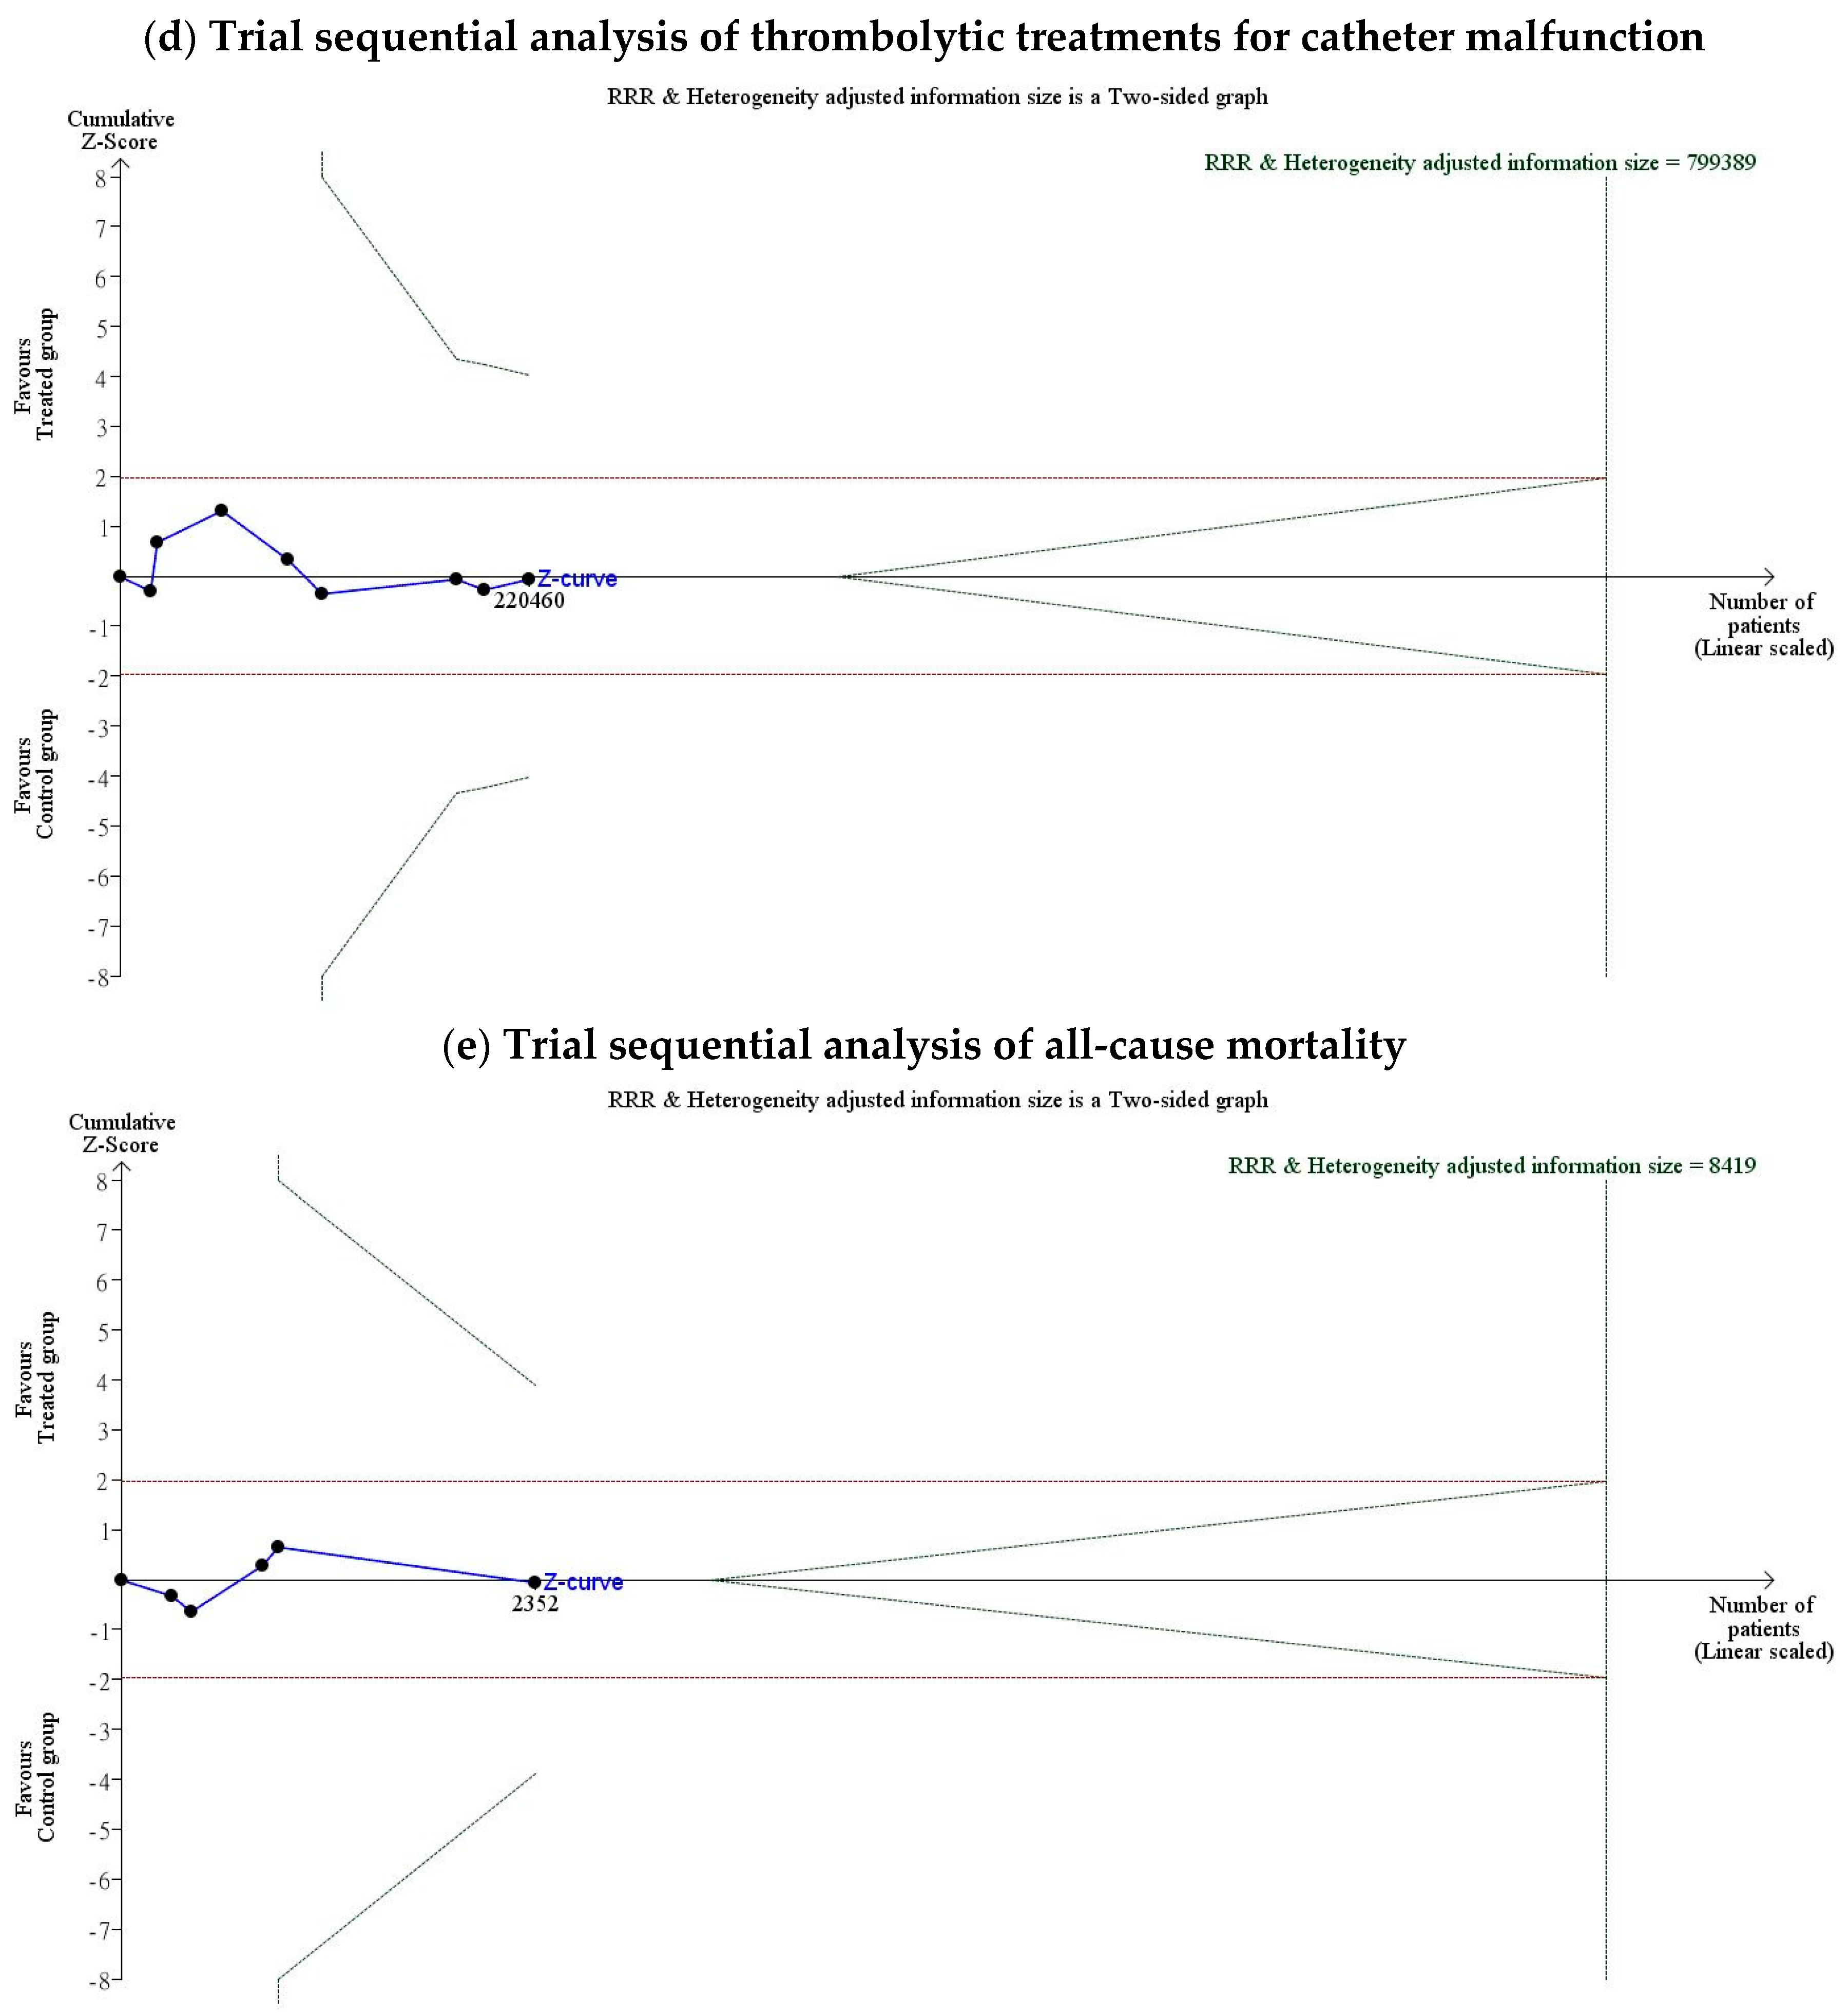
3.4. Pooled Odds for Outcomes in Trial Sequential Analysis
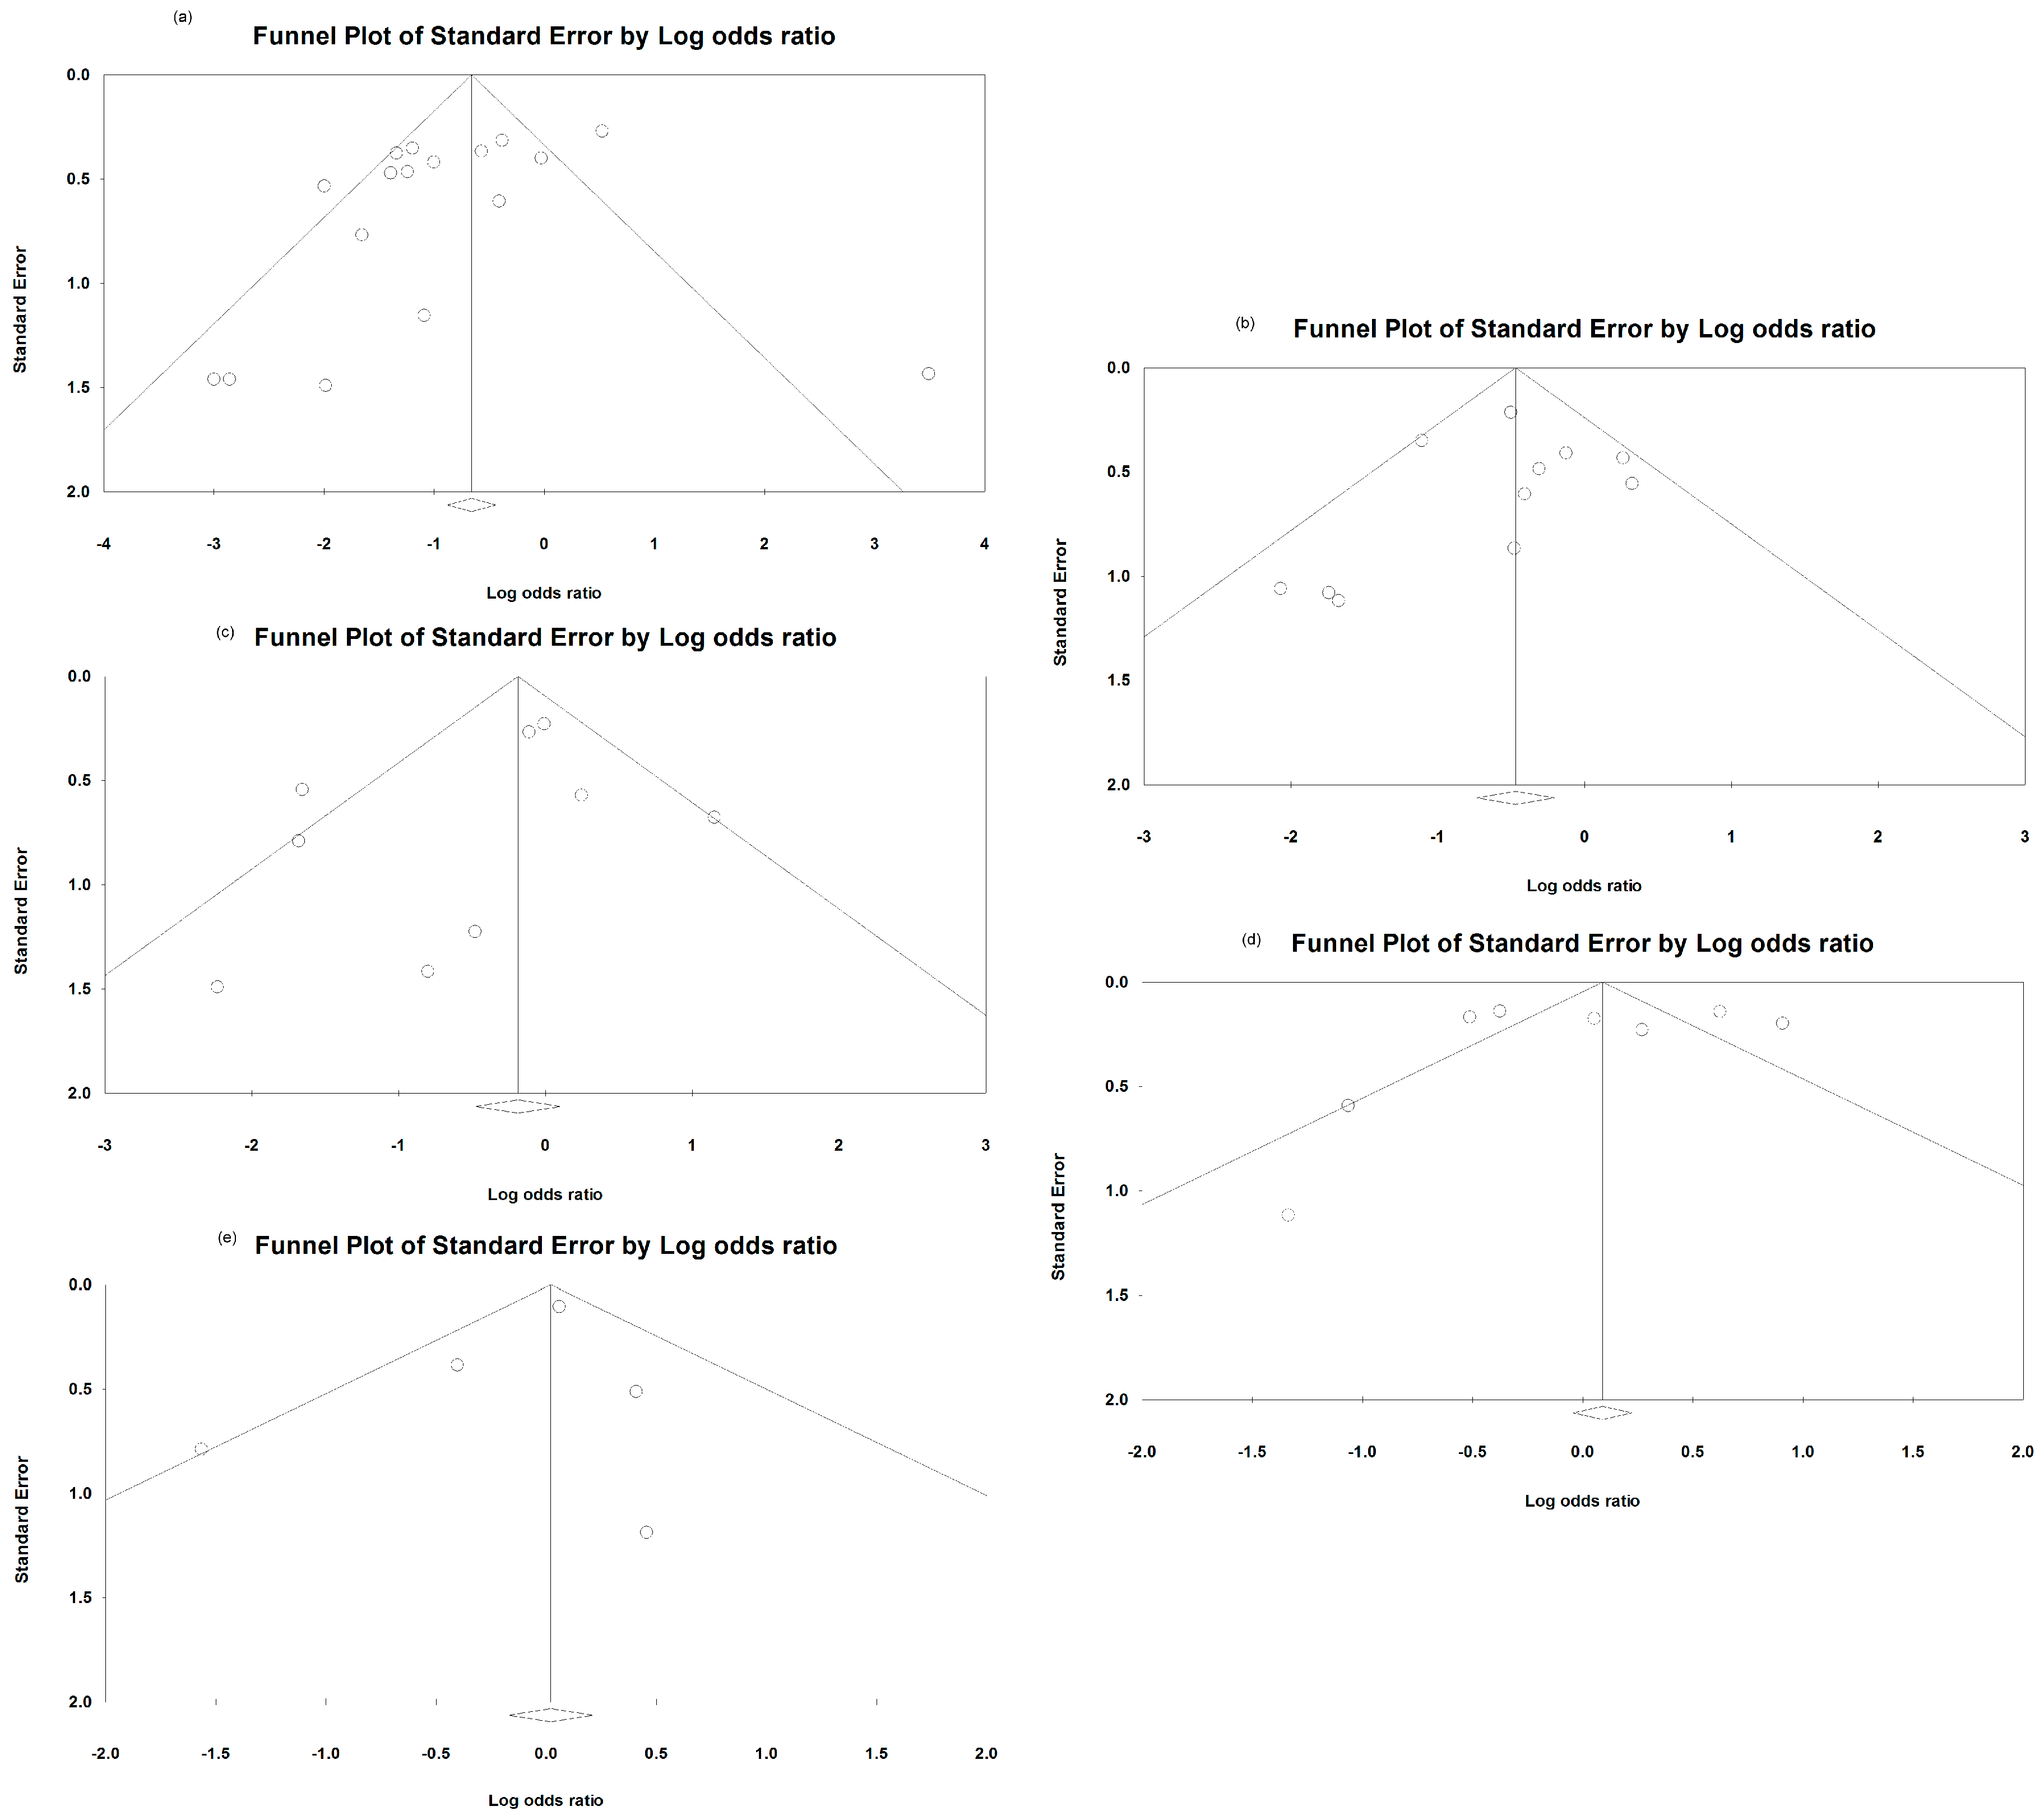
3.5. Funnel Plot for the Overall OR of the Included Studies among Four Outcomes
4. Discussion
5. Conclusions
Supplementary Materials
Author Contributions
Funding
Acknowledgments
Conflicts of Interest
Appendix A
- #1 lock
- #2 filling solution
- #3 #1 or #2
- #4 End-Stage Kidney Disease or Disease, End-Stage Kidney, End Stage Kidney Disease, End-Stage Chronic Kidney Failure, End-Stage Renal Disease, End-Stage Renal Disease, Chronic Chronic Renal Failure, or ESRD
- #5 Renal Dialyses, Renal Dialysis, Hemodialyses, Extracorporeal Dialysis or Renal replacement therapy
- #6 Catheter Related Infections, Catheter-Related Infection
- #7 #4 or #5 and #6
- #8 #3 and #7
References
- Liu, K.D.; Chertow, G.M. Dialysis in the Treatment of Renal Failure. In Harrison’s Principles of Internal Medicine, 20e; Jameson, J.L., Fauci, A.S., Kasper, D.L., Hauser, S.L., Longo, D.L., Loscalzo, J., Eds.; McGraw-Hill Education: New York, NY, USA, 2018. [Google Scholar]
- Schwab, S.J.; Beathard, G. The hemodialysis catheter conundrum: Hate living with them, but can’t live without them. Kidney Int. 1999, 56, 1–17. [Google Scholar] [CrossRef] [PubMed]
- Zhao, Y.; Li, Z.; Zhang, L.; Yang, J.; Yang, Y.; Tang, Y.; Fu, P. Citrate versus heparin locking for hemodialysis catheters: A systematic review and meta-analysis of randomized controlled trials. Am. J. Kidney Dis. 2014, 63, 479–490. [Google Scholar] [CrossRef] [PubMed]
- Power, A.; Duncan, N.; Singh, S.K.; Brown, W.; Dalby, E.; Edwards, C.; Lynch, K.; Prout, V.; Cairns, T.; Griffith, M.; et al. Sodium citrate versus heparin catheter lockings for cuffed central venous catheters: A single-center randomized controlled trial. Am. J. Kidney Dis. 2009, 53, 1034–1041. [Google Scholar] [CrossRef] [PubMed]
- Allon, M. Current management of vascular access. Clin. J. Am. Soc. Nephrol. 2007, 2, 786–800. [Google Scholar] [CrossRef]
- Maki, D.G.; Ash, S.R.; Winger, R.K.; Lavin, P.; Investigators, A.T. A novel antimicrobial and antithrombotic locking solution for hemodialysis catheters: A multi-center, controlled, randomized trial. Crit. Care Med. 2011, 39, 613–620. [Google Scholar] [CrossRef] [PubMed]
- Yevzlin, A.S.; Sanchez, R.J.; Hiatt, J.G.; Washington, M.H.; Wakeen, M.; Hofmann, R.M.; Becker, Y.T. Concentrated heparin locking is associated with major bleeding complications after tunneled hemodialysis catheter placement. In Seminars in Dialysis; Blackwell Publishing Ltd.: Oxford, UK, 2007; Volume 20, pp. 351–354. [Google Scholar]
- Moran, J.; Sun, S.; Khababa, I.; Pedan, A.; Doss, S.; Schiller, B. A randomized trial comparing gentamicin/citrate and heparin lockings for central venous catheters in maintenance hemodialysis patients. Am. J. Kidney Dis. 2012, 59, 102–107. [Google Scholar] [CrossRef]
- Shanks, R.M.; Donegan, N.P.; Graber, M.L.; Buckingham, S.E.; Zegans, M.E.; Cheung, A.L.; O’Toole, G.A. Heparin stimulates Staphylococcus aureus biofilm formation. Infect. Immun. 2005, 73, 4596–4606. [Google Scholar] [CrossRef]
- Shanks, R.M.; Sargent, J.L.; Martinez, R.M.; Graber, M.L.; O’Toole, G.A. Catheter locking solutions influence staphylococcal biofilm formation on abiotic surfaces. Nephrol. Dial. Transplant. 2006, 21, 2247–2255. [Google Scholar] [CrossRef]
- Ibberson, C.B.; Parlet, C.P.; Kwiecinski, J.; Crosby, H.A.; Meyerholz, D.K.; Horswill, A.R. Hyaluronan Modulation Impacts Staphylococcus aureus Biofilm Infection. Infect. Immun. 2016, 84, 1917–1929. [Google Scholar] [CrossRef] [PubMed]
- Macrae, J.M.; Dojcinovic, I.; Djurdjev, O.; Jung, B.; Shalansky, S.; Levin, A.; Kiaii, M. Citrate 4% versus heparin and the reduction of thrombosis study (CHARTS). Clin. J. Am. Soc. Nephrol. 2008, 3, 369–374. [Google Scholar] [CrossRef]
- Lok, C.E.; Appleton, D.; Bhola, C.; Khoo, B.; Richardson, R.M. Trisodium citrate 4%—An alternative to heparin capping of haemodialysis catheters. Nephrol. Dial. Transplant. 2007, 22, 477–483. [Google Scholar] [CrossRef] [PubMed]
- Weijmer, M.C.; van den Dorpel, M.A.; Van de Ven, P.J.; ter Wee, P.M.; van Geelen, J.A.; Groeneveld, J.O.; van Jaarsveld, B.C.; Koopmans, M.G.; le Poole, C.Y.; Schrander-Van der Meer, A.M.; et al. Randomized, clinical trial comparison of trisodium citrate 30% and heparin as catheter-lockinging solution in hemodialysis patients. J. Am. Soc. Nephrol. 2005, 16, 2769–2777. [Google Scholar] [CrossRef]
- O’grady, N.P.; Alexander, M.; Burns, L.A.; Dellinger, E.P.; Garland, J.; Heard, S.O.; Lipsett, P.A.; Masur, H.; Mermel, L.A.; Pearson, M.L. Guidelines for the prevention of intravascular catheter-related infections. Clin. Infect. Dis. 2011, 52, e162–e193. [Google Scholar] [CrossRef] [PubMed]
- Thorlund, K.; Imberger, G.; Walsh, M.; Chu, R.; Gluud, C.; Wetterslev, J.; Guyatt, G.; Devereaux, P.J.; Thabane, L. The number of patients and events required to limit the risk of overestimation of intervention effects in meta-analysis—A simulation study. PLoS ONE 2011, 6, e25491. [Google Scholar] [CrossRef] [PubMed]
- Kanaa, M.; Wright, M.J.; Akbani, H.; Laboi, P.; Bhandari, S.; Sandoe, J.A. Cathasept Line Locking and Microbial Colonization of Tunneled Hemodialysis Catheters: A Multicenter Randomized Controlled Trial. Am. J. Kidney Dis. 2015, 66, 1015–1023. [Google Scholar] [CrossRef] [PubMed]
- Moghaddas, A.; Abbasi, M.R.; Gharekhani, A.; Dashti-Khavidaki, S.; Razeghi, E.; Jafari, A.; Khalili, H. Prevention of hemodialysis catheter-related blood stream infections using a cotrimoxazole-locking technique. Future Microbiol. 2015, 10, 169–178. [Google Scholar] [CrossRef]
- Souweine, B.; Lautrette, A.; Gruson, D.; Canet, E.; Klouche, K.; Argaud, L.; Bohe, J.; Garrouste-Orgeas, M.; Mariat, C.; Vincent, F.; et al. Ethanol locking and risk of hemodialysis catheter infection in critically ill patients. A randomized controlled trial. Am. J. Respir. Crit. Care Med. 2015, 191, 1024–1032. [Google Scholar] [CrossRef]
- Chu, G.; Fogarty, G.M.; Avis, L.F.; Bergin, S.; McElduff, P.; Gillies, A.H.; Choi, P. Low dose heparin locking (1000 U/mL) maintains tunnelled hemodialysis catheter patency when compared with high dose heparin (5000 U/mL): A randomised controlled trial. Hemodial. Int. 2016, 20, 385–391. [Google Scholar] [CrossRef]
- Zwiech, R.; Adelt, M.; Chrul, S. A Taurolidine-Citrate-Heparin Locking Solution Effectively Eradicates Pathogens from the Catheter Biofilm in Hemodialysis Patients. Am. J. Ther. 2016, 23, e363–e368. [Google Scholar] [CrossRef]
- Correa Barcellos, F.; Pereira Nunes, B.; Jorge Valle, L.; Lopes, T.; Orlando, B.; Scherer, C.; Nunes, M.; Araujo Duarte, G.; Bohlke, M. Comparative effectiveness of 30% trisodium citrate and heparin locking solution in preventing infection and dysfunction of hemodialysis catheters: A randomized controlled trial (CITRIM trial). Infection 2017, 45, 139–145. [Google Scholar] [CrossRef] [PubMed]
- Sofroniadou, S.; Revela, I.; Kouloubinis, A.; Makriniotou, I.; Zerbala, S.; Smirloglou, D.; Kalocheretis, P.; Drouzas, A.; Samonis, G.; Iatrou, C. Ethanol combined with heparin as a lockinging solution for the prevention of catheter related blood stream infections in hemodialysis patients: A prospective randomized study. Hemodial. Int. 2017, 21, 498–506. [Google Scholar] [CrossRef] [PubMed]
- Winnicki, W.; Herkner, H.; Lorenz, M.; Handisurya, A.; Kikic, Z.; Bielesz, B.; Schairer, B.; Reiter, T.; Eskandary, F.; Sunder-Plassmann, G.; et al. Taurolidine-based catheter locking regimen significantly reduces overall costs, infection, and dysfunction rates of tunneled hemodialysis catheters. Kidney Int. 2018, 93, 753–760. [Google Scholar] [CrossRef]
- Jadad, A.R.; Moore, R.A.; Carroll, D.; Jenkinson, C.; Reynolds, D.J.M.; Gavaghan, D.J.; McQuay, H.J. Assessing the quality of reports of randomized clinical trials: Is blinding necessary? Control. Clin. Trials 1996, 17, 1–12. [Google Scholar] [CrossRef]
- Wells, G.; Shea, B.; O’Connell, D.; Peterson, J.; Welch, V.; Losos, M. Newcastle-Ottawa Quality Assessment Scale; Ottawa Hospital Research Institute: Ottawa, ON, Canada, 2013. [Google Scholar]
- Higgins, J.P.; Thompson, S.G. Quantifying heterogeneity in a meta-analysis. Stat. Med. 2002, 21, 1539–1558. [Google Scholar] [CrossRef]
- Moher, D.; Liberati, A.; Tetzlaff, J.; Altman, D.G. Preferred reporting items for systematic reviews and meta-analyses: The PRISMA statement. PLoS Med. 2009, 6, e1000097. [Google Scholar] [CrossRef]
- Buturovic, J.; Ponikvar, R.; Kandus, A.; Boh, M.; Klinkmann, J.; Ivanovich, P. Filling hemodialysis catheters in the interdialytic period: Heparin versus citrate versus polygeline: A prospective randomized study. Artif. Organs 1998, 22, 945–947. [Google Scholar] [CrossRef]
- Dogra, G.K. Prevention of Tunneled Hemodialysis Catheter-Related Infections Using Catheter-Restricted Filling with Gentamicin and Citrate: A Randomized Controlled Study. J. Am. Soc. Nephrol. 2002, 13, 2133–2139. [Google Scholar] [CrossRef]
- Betjes, M.G.; van Agteren, M. Prevention of dialysis catheter-related sepsis with a citrate-taurolidine-containing locking solution. Nephrol. Dial. Transplant. 2004, 19, 1546–1551. [Google Scholar] [CrossRef] [PubMed]
- Nori, U.S.; Manoharan, A.; Yee, J.; Besarab, A. Comparison of low-dose gentamicin with minocycline as catheter locking solutions in the prevention of catheter-related bacteremia. Am. J. Kidney Dis. 2006, 48, 596–605. [Google Scholar] [CrossRef] [PubMed]
- Solomon, L.R.; Cheesbrough, J.S.; Ebah, L.; Al-Sayed, T.; Heap, M.; Millband, N.; Waterhouse, D.; Mitra, S.; Curry, A.; Saxena, R.; et al. A randomized double-blind controlled trial of taurolidine-citrate catheter lockings for the prevention of bacteremia in patients treated with hemodialysis. Am. J. Kidney Dis. 2010, 55, 1060–1068. [Google Scholar] [CrossRef]
- Filiopoulos, V.; Hadjiyannakos, D.; Koutis, I.; Trompouki, S.; Micha, T.; Lazarou, D.; Vlassopoulos, D. Approaches to prolong the use of uncuffed hemodialysis catheters: Results of a randomized trial. Am. J. Nephrol. 2011, 33, 260–268. [Google Scholar] [CrossRef]
- Chen, F.K.; Li, J.J.; Song, Y.; Zhang, Y.Y.; Chen, P.; Zhao, C.Z.; Gong, H.Y.; Yao, D.F. Concentrated sodium chloride catheter locking solution—A new effective alternative method for hemodialysis patients with high bleeding risk. Ren. Fail. 2014, 36, 17–22. [Google Scholar] [CrossRef]
- Jaffer, Y.; Selby, N.M.; Taal, M.W.; Fluck, R.J.; McIntyre, C.W. A meta-analysis of hemodialysis catheter lockinging solutions in the prevention of catheter-related infection. Am. J. Kidney Dis. 2008, 51, 233–241. [Google Scholar] [CrossRef]
- Labriola, L.; Crott, R.; Jadoul, M. Preventing haemodialysis catheter-related bacteraemia with an antimicrobial locking solution: A meta-analysis of prospective randomized trials. Nephrol. Dial. Transplant. 2008, 23, 1666–1672. [Google Scholar] [CrossRef]
- Moran, J.E.; Ash, S.R. Lockinging solutions for hemodialysis catheters; heparin and citrate—A position paper by ASDIN. Semin. Dial. 2008, 21, 490–492. [Google Scholar] [CrossRef] [PubMed]
- Vanholder, R.; Canaud, B.; Fluck, R.; Jadoul, M.; Labriola, L.; Marti-Monros, A.; Tordoir, J.; Van Biesen, W. Catheter-related blood stream infections (CRBSI): A European view. Nephrol. Dial. Transplant. 2010, 25, 1753–1756. [Google Scholar] [CrossRef]
- Jenks, M.; Craig, J.; Green, W.; Hewitt, N.; Arber, M.; Sims, A. Tegaderm CHG IV Securement Dressing for Central Venous and Arterial Catheter Insertion Sites: A NICE Medical Technology Guidance. Appl. Health Econ. Health Policy 2016, 14, 135–149. [Google Scholar] [CrossRef]
- Yahav, D.; Rozen-Zvi, B.; Gafter-Gvili, A.; Leibovici, L.; Gafter, U.; Paul, M. Antimicrobial locking solutions for the prevention of infections associated with intravascular catheters in patients undergoing hemodialysis: Systematic review and meta-analysis of randomized, controlled trials. Clin. Infect. Dis. 2008, 47, 83–93. [Google Scholar] [CrossRef] [PubMed]
- Yon, C.K.; Low, C.L. Sodium citrate 4% versus heparin as a locking solution in hemodialysis patients with central venous catheters. Am. J. Health Syst. Pharm. 2013, 70, 131–136. [Google Scholar] [CrossRef] [PubMed]


| Author, Year, Country, Reference | RCT | Total N | Treated (N) | Control (N) | QA |
|---|---|---|---|---|---|
| Buturovic et al., 1998, SI, [29] | No | 30 | 4% CiT (20) | 1666 U/mL HpR (10) | 3 # |
| Dogra et al., 2002, AU, [30] | Yes | 79 | 26.7 mg/mL GM + 1.04% CiT (42) | 5000 U/mL HpR (37) | 8 * |
| Betjes et al., 2004, NL, [31] | No | 58 | 1.35% TRD +4% CiT (37) | 5000 U/mL HpR (39) | 3 # |
| Weijmer et al., 2005, NL, [14] | Yes | 291 | 30% CiT (148) | 5000 U/mL HpR (143) | 8 * |
| Nori et al., 2006, USA, [32] | No | 40 | 4 mg/mL GM + 3.13% CiT (41) | 5000 U/mL HpR (21) | 3 # |
| Lok et al., 2007, CA, [13] | No | 250 | 4% CiT (129) | 5000 U/mL HpR (121) | 3 # |
| MacRae et al., 2008, CA, [12] | No | 61 | 4% CiT (32) | 5000 U/mL HpR (29) | 3 # |
| Power et al., 2009, UK, [4] | Yes | 232 | 46.7% CiT (132) | 5000 U/mL HpR (100) | 8 * |
| Solomon et al., 2010, UK, [33] | Yes | 107 | 1.35% TRD + 4% CiT (53) | 5000 U/mL HpR (54) | 8 * |
| Filiopoulos et al., 2011, GR, [34] | Yes | 117 | 1.35% TRD + 4% CiT (119) | 5000 U/mL HpR (58) | 8 * |
| Maki et al., 2011, USA, [6] | Yes | 407 | 7.0% CiT + MMP (206) | 5000 U/mL HpR (201) | 8 * |
| Moran et al., 2012, USA, [8] | No | 303 | 320 μg/mL GM + 4% CiT (155) | 1000 U/mL HpR (148) | 3 # |
| Chen et al., 2014, CH, [35] | Yes | 72 | 10% NaCl (36) | 3125 U/mL HpR (36) | 8 * |
| Souweine et al., 2015, FR, [19] | Yes | 1460 | 60% w/w EtOH (730) | 0.9% NaCl (730) | 8 * |
| Moghaddas et al., 2015, IR, [18] | Yes | 87 | 10 mg/mL TMP/SMX + 2500 U/mL HpR (46) | 2500 U/mL HpR (41) | 8 * |
| Kanaa et al., 2015, UK, [17] | Yes | 115 | 4% EDTA (59) | 5000 U/mL HpR (56) | 8 * |
| Zwiech et al., 2016, PL, [21] | Yes | 50 | 4% CiT (26) | 5000 U/mL HpR (24) | 8 * |
| Chu et al., 2016, AU, [20] | Yes | 100 | 1000 U/mL HpR (52) | 5000 U/mL HpR (48) | 8 * |
| Correa Barcellos et al., 2017, BZ, [22] | Yes | 464 | 30% CiT (231) | 5000 U/mL HpR (233) | 8 * |
| Sofroniadou et al., 2017, GR, [23] | Yes | 103 | 70% w/w EtOH + UFH 2000 U/mL (52) | 2000 U/mL HpR (51) | 8 * |
| Winnicki et al., 2018, Au, [24] | No | 406 | 1.35% TRD + 4% CiT + HpR (52) | 4% CiT (54) | 3 # |
| Subgroup | Odds Ratio | 95% Confidence Interval |
|---|---|---|
| combined regimen | ||
| RCT | 0.606 | 0.298–1.230 |
| Not RCT | 0.206 | 0.058–0.730 |
| Not combined regimen | ||
| RCT | 0.417 | 0.192–0.905 |
| Not RCT | 0.289 | 0.083–0.365 |
| Regimen containing antibiotic | ||
| RCT | 0.191 | 0.023–1.564 |
| Not RCT | 0.136 | 0.051–0.365 |
| Regimen Not containing antibiotic | ||
| RCT | 0.546 | 0.314–0.949 |
| Not RCT | 0.342 | 0.191–0.614 |
| High Concentration of major regimen | ||
| RCT | 0.644 | 0.155–2.671 |
| Low Concentration of major regimen | ||
| RCT | 0.421 | 0.186–0.956 |
| Not RCT | 0.260 | 0.135–0.497 |
| Subgroup | Odds Ratio | 95% Confidence Interval |
|---|---|---|
| combined regimen | ||
| RCT | 0.849 | 0.358–2.011 |
| Not RCT | 0.706 | 0.307–1.62 |
| Not combined regimen | ||
| RCT | 0.503 | 0.276–0.918 |
| Not RCT | 0.620 | 0.113–3.389 |
| Regimen containing antibiotic | ||
| RCT | 0.571 | 0.189–1.725 |
| Not RCT | 0.735 | 0.284–1.905 |
| Regimen Not containing antibiotic | ||
| RCT | 0.599 | 0.334–1.071 |
| Not RCT | 0.650 | 0.246–1.722 |
| High Concentration of major regimen | ||
| RCT | 0.631 | 0.214–1.862 |
| Low Concentration of major regimen | ||
| RCT | 0.805 | 0.282–2.297 |
| Not RCT | 0.692 | 0.35–1.368 |
| Subgroup | Odds Ratio | 95% Confidence Interval |
|---|---|---|
| Combined regimen | ||
| RCT | 0.520 | 0.086–3.15 |
| Not RCT | 0.977 | 0.628–1.518 |
| Not combined regimen | ||
| RCT | 0.434 | 0.068–2.786 |
| Not RCT | 1.106 | 0.392–3.124 |
| Regimen containing antibiotic | ||
| RCT | 0.741 | 0.087–6.287 |
| Not RCT | 0.992 | 0.633–1.554 |
| Regimen not containing antibiotic | ||
| RCT | 0.329 | 0.051–2.138 |
| Not RCT | 1.010 | 0.39–2.619 |
| High concentration of major regimen | ||
| RCT | 0.896 | 0.029–27.554 |
| Low concentration of major regimen | ||
| RCT | 0.479 | 0.051–4.537 |
| Not RCT | 0.995 | 0.663–1.494 |
| Subgroup | Odds Ratio | 95% Confidence Interval |
|---|---|---|
| Combined regimen | ||
| RCT | 2.480 | 1.214–5.066 |
| Not RCT | 0.620 | 0.382–1.004 |
| Not combined regimen | ||
| RCT | 1.320 | 0.888–1.961 |
| Not RCT | 0.599 | 0.344–1.043 |
| Regimen containing antibiotic | ||
| RCT | 1.969 | 0.944–4.107 |
| Not RCT | 0.620 | 0.382–1.004 |
| Regimen not containing antibiotic | ||
| RCT | 1.385 | 0.893–2.149 |
| Not RCT | 0.345 | 0.108–1.102 |
| High concentration of major regimen | ||
| RCT | 1.415 | 0.784–2.554 |
| Low concentration of major regimen | ||
| RCT | 2.480 | 1.042–5.902 |
| Not RCT | 0.637 | 0.518–0.783 |
| Subgroup | Odds Ratio | 95% Confidence Interval |
|---|---|---|
| Combined regimen | ||
| RCT | 0.725 | 0.237–2.211 |
| Not RCT | 1.579 | 0.154–16.18 |
| Not combined regimen | ||
| RCT | 0.884 | 0.404–1.933 |
| Regimen containing antibiotic | ||
| RCT | 1.506 | 0.388–5.838 |
| Not RCT | 1.579 | 0.154–16.18 |
| Regimen not containing antibiotic | ||
| RCT | 0.723 | 0.367 – 1.425 |
| High concentration of major regimen | ||
| RCT | 0.669 | 0.054–8.324 |
| Low Concentration of major regimen | ||
| RCT | 0.615 | 0.09–4.22 |
| Not RCT | 1.579 | 0.154–16.18 |
© 2019 by the authors. Licensee MDPI, Basel, Switzerland. This article is an open access article distributed under the terms and conditions of the Creative Commons Attribution (CC BY) license (http://creativecommons.org/licenses/by/4.0/).
Share and Cite
Chen, C.-H.; Chen, Y.-M.; Yang, Y.; Chang, Y.-J.; Lin, L.-J.; Yen, H.-C. Re-Evaluating the Protective Effect of Hemodialysis Catheter Locking Solutions in Hemodialysis Patients. J. Clin. Med. 2019, 8, 412. https://doi.org/10.3390/jcm8030412
Chen C-H, Chen Y-M, Yang Y, Chang Y-J, Lin L-J, Yen H-C. Re-Evaluating the Protective Effect of Hemodialysis Catheter Locking Solutions in Hemodialysis Patients. Journal of Clinical Medicine. 2019; 8(3):412. https://doi.org/10.3390/jcm8030412
Chicago/Turabian StyleChen, Chang-Hua, Yu-Min Chen, Yu Yang, Yu-Jun Chang, Li-Jhen Lin, and Hua-Cheng Yen. 2019. "Re-Evaluating the Protective Effect of Hemodialysis Catheter Locking Solutions in Hemodialysis Patients" Journal of Clinical Medicine 8, no. 3: 412. https://doi.org/10.3390/jcm8030412
APA StyleChen, C.-H., Chen, Y.-M., Yang, Y., Chang, Y.-J., Lin, L.-J., & Yen, H.-C. (2019). Re-Evaluating the Protective Effect of Hemodialysis Catheter Locking Solutions in Hemodialysis Patients. Journal of Clinical Medicine, 8(3), 412. https://doi.org/10.3390/jcm8030412