Functional Brain Network Topology Discriminates between Patients with Minimally Conscious State and Unresponsive Wakefulness Syndrome

 ,
,  ,
,  ,
,  and
and
Abstract
1. Introduction
2. Materials and Methods
2.1. Participants
2.2. EEG Recording and Processing
2.3. Cortical Source and Functional Connectivity Estimation
2.4. Topological Network Analysis
2.5. Stochastic Measures
- -
- The small-worldness [48,49] was proposed for the characterization of a given network as SW, meaning that it exhibits a high average clustering coefficient and a low characteristic path length [50]. It relies on comparing a given network with an equivalent random network and a lattice network on the basis of the average clustering coefficient, a local measure, and the characteristic path length, a global measure.
- -
- -
- The structural consistency [53] is a global measure that quantifies the link predictability of a complex network. The link predictability characterizes the inherent difficulty to predict the missing or non-observed links of a network, regardless of the specific algorithm used for the prediction.
2.6. Deterministic Measures
- -
- The characteristic path length (L) [49,50] is a global measure and describes the average of the shortest path lengths between all the pairs of vertices. A small value of L in a connectome means that the information flow between the nodes across the network is facilitated, and that the nodes are able to exchange messages between each other easily. In other words, the nodes across connectomes are functionally convergent.
- -
- The average global efficiency (E) [54,55] is a global measure that quantifies how efficiently the information is exchanged within the network. The average local efficiency instead reflects the extent of integration between the immediate neighbors of a given node. In this way, local efficiency can be considered a generalization of the clustering coefficient that explicitly takes into account paths.
- -
- The average clustering coefficient (ACC) [50] is a local measure and offers an average evaluation of the cross-interaction density between the first neighbors of each node in the network.
- -
- The average node betweenness centrality (ANBC) [56] is a global measure based on the node betweenness centrality, an indicator of node centrality that evaluates how crucial a particular node is in maintaining a path of optimum information flow between any other pair of nodes.
- -
- In contrast to the existing node-neighborhood-based local measures, a new strategic shift has been introduced recently in which the focus is no longer only on groups of nodes and their common neighbors, but also on the organization of the links between them [57]. This new idea inspired a theory, which is known as the Local Community Paradigm (LCP) theory, and is valid both in monopartite [57,58] and in undirected unweighted bipartite networks [59,60]. The LCP theory was proposed to mechanistically and deterministically model local-topology-dependent link-growth in complex networks, and states that for modelling link prediction in complex networks, the information content related with the common neighbor nodes (CNs) of a given link should be complemented with the topological information emerging from the interactions between them. The cohort of CNs and their cross-interactions—which are called Local Community Links (LCLs)—form what is called a local community. This first part of the theory inspired the Cannistraci’s variation of the classical CN-based similarity indices for link prediction, named also LCP-based link predictors. For details, refer to [57,58,59,60]. Furthermore, the LCP theory holds that in many complex network topologies, the number of CNs of each link in the network is positively correlated with the respective number of LCLs. This second part of the LCP theory motivated a new network measure called local-community-paradigm correlation (LCP-corr) [57,59,60], which is a local measure that represents an exception with respect to the majority of the previous ones, for two main reasons. Firstly, it is not related with only the node neighborhood but with the node/link neighborhood. Secondly, the general statistic used to obtain a unique value is not the average but the Pearson correlation. The formula for computing the LCP-corr is:with CN > 0, where cov indicates the covariance operator and σ is the standard deviation. In normal conditions, brain connectomes follow LCP organization [57], and therefore they are characterized by high LCP-corr (usually > 0.8). A recent study [61] investigated the LCP organization in time-varying brain functional connectomes of a rat model of persistent peripheral neuropathic pain, obtained by means of local field potential and spike train analysis. LCP-corr was employed to quantitatively investigate the rewiring mechanisms of the brain regions responsible for development and upkeep of pain along time, from three hours to 16 days after nerve injury. The time trend (across the days) of LCP-corr was correlated with a behavioral test for rat pain, and surprisingly this analysis showed very high statistical correlations (higher than 0.9, the maximum value being 1) of LCP-corr with the behavioral test [61].
2.7. "Functional Network Topology" Exploration: An Overview
2.8. Network-Based Statistic of Network Connectivity
2.9. Statistical Analysis of Data
3. Results
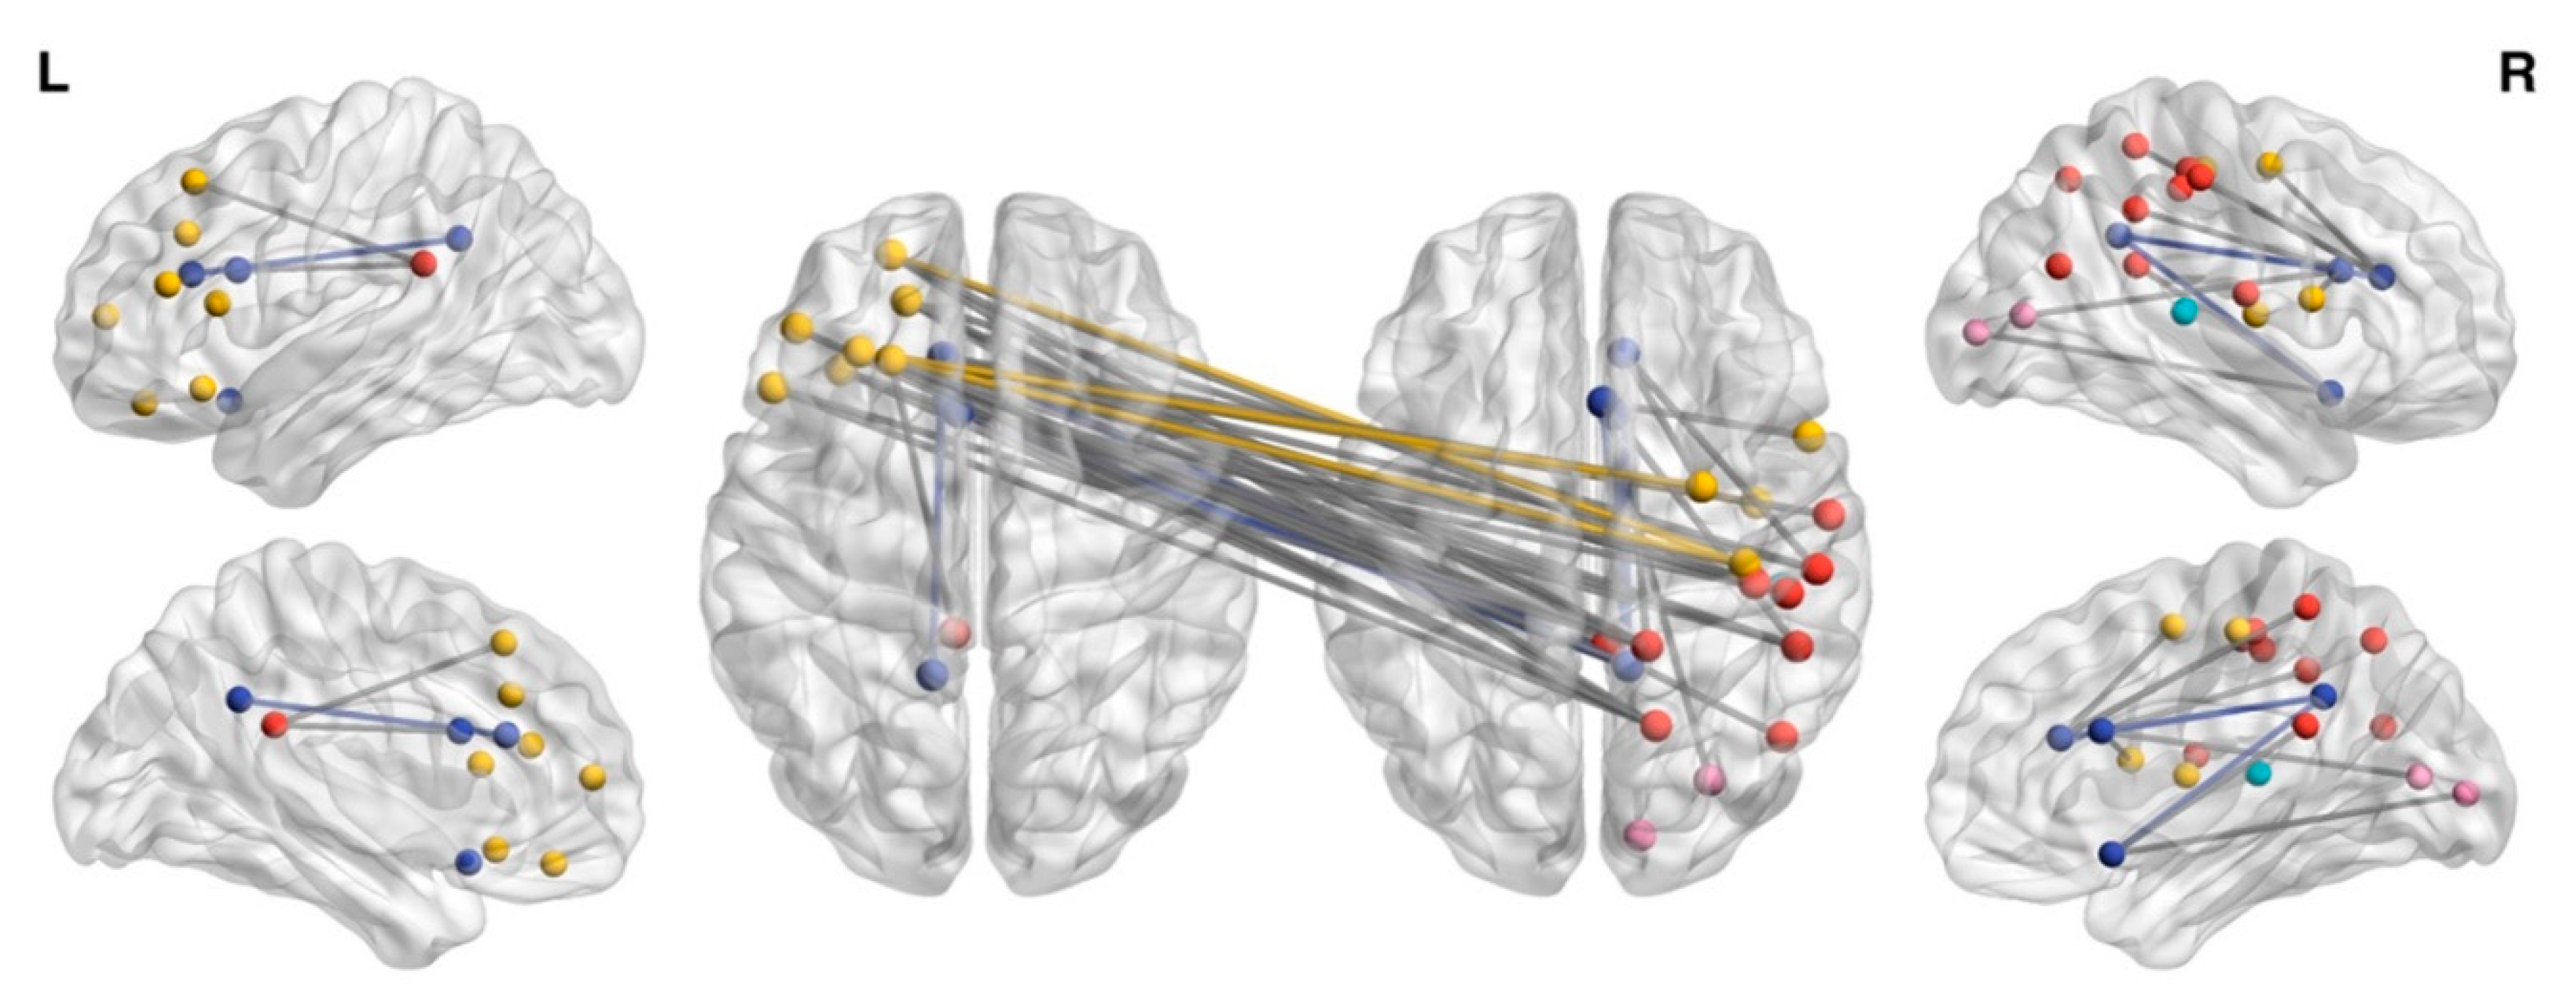
3.1. NBS Analysis
3.2. Whole-Brain Network Topology Measures
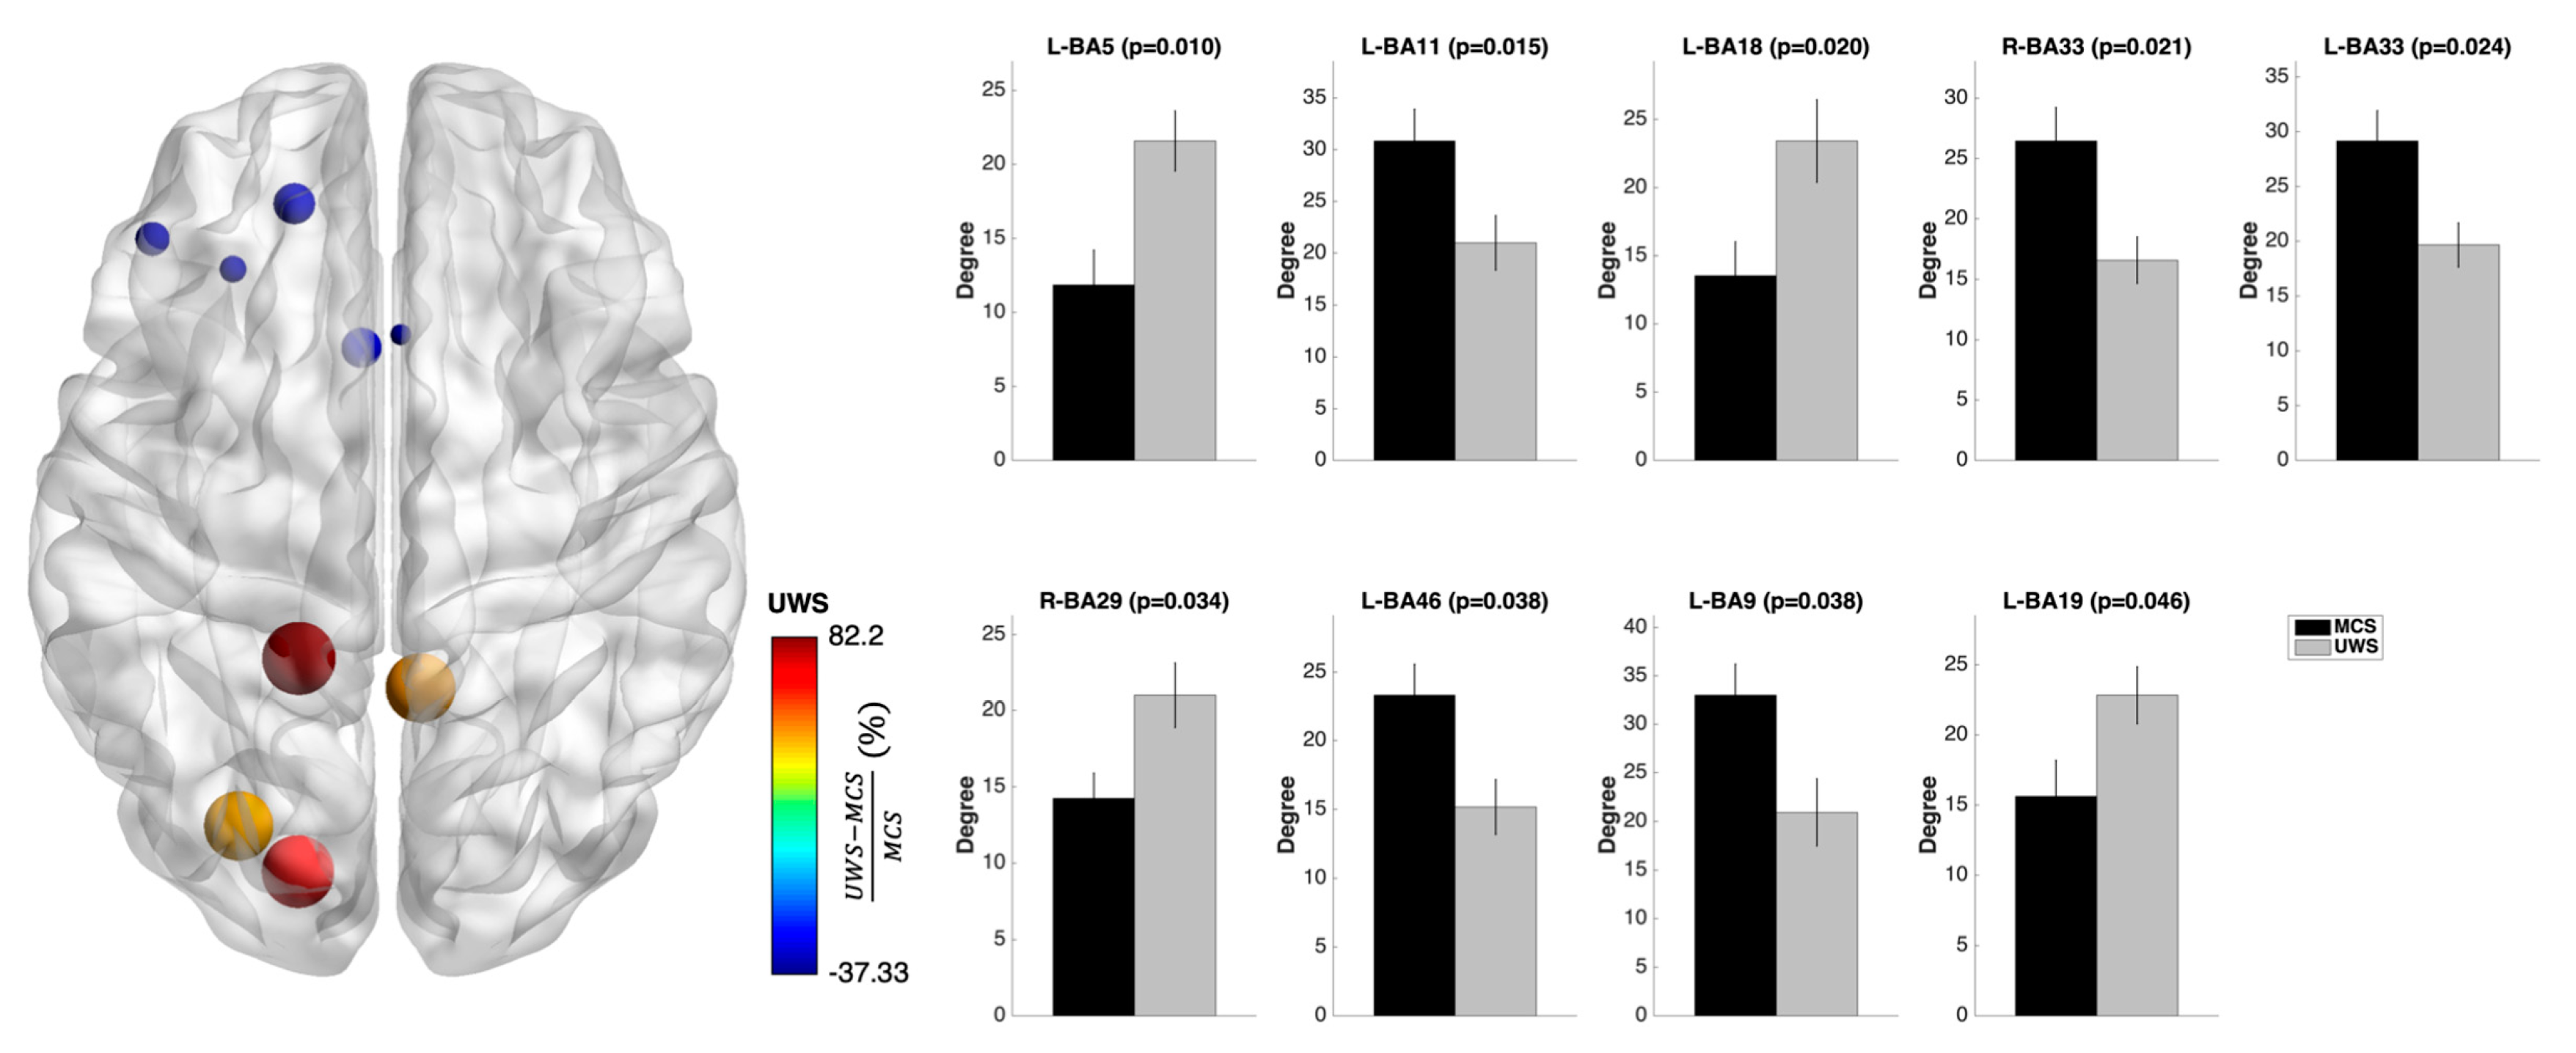
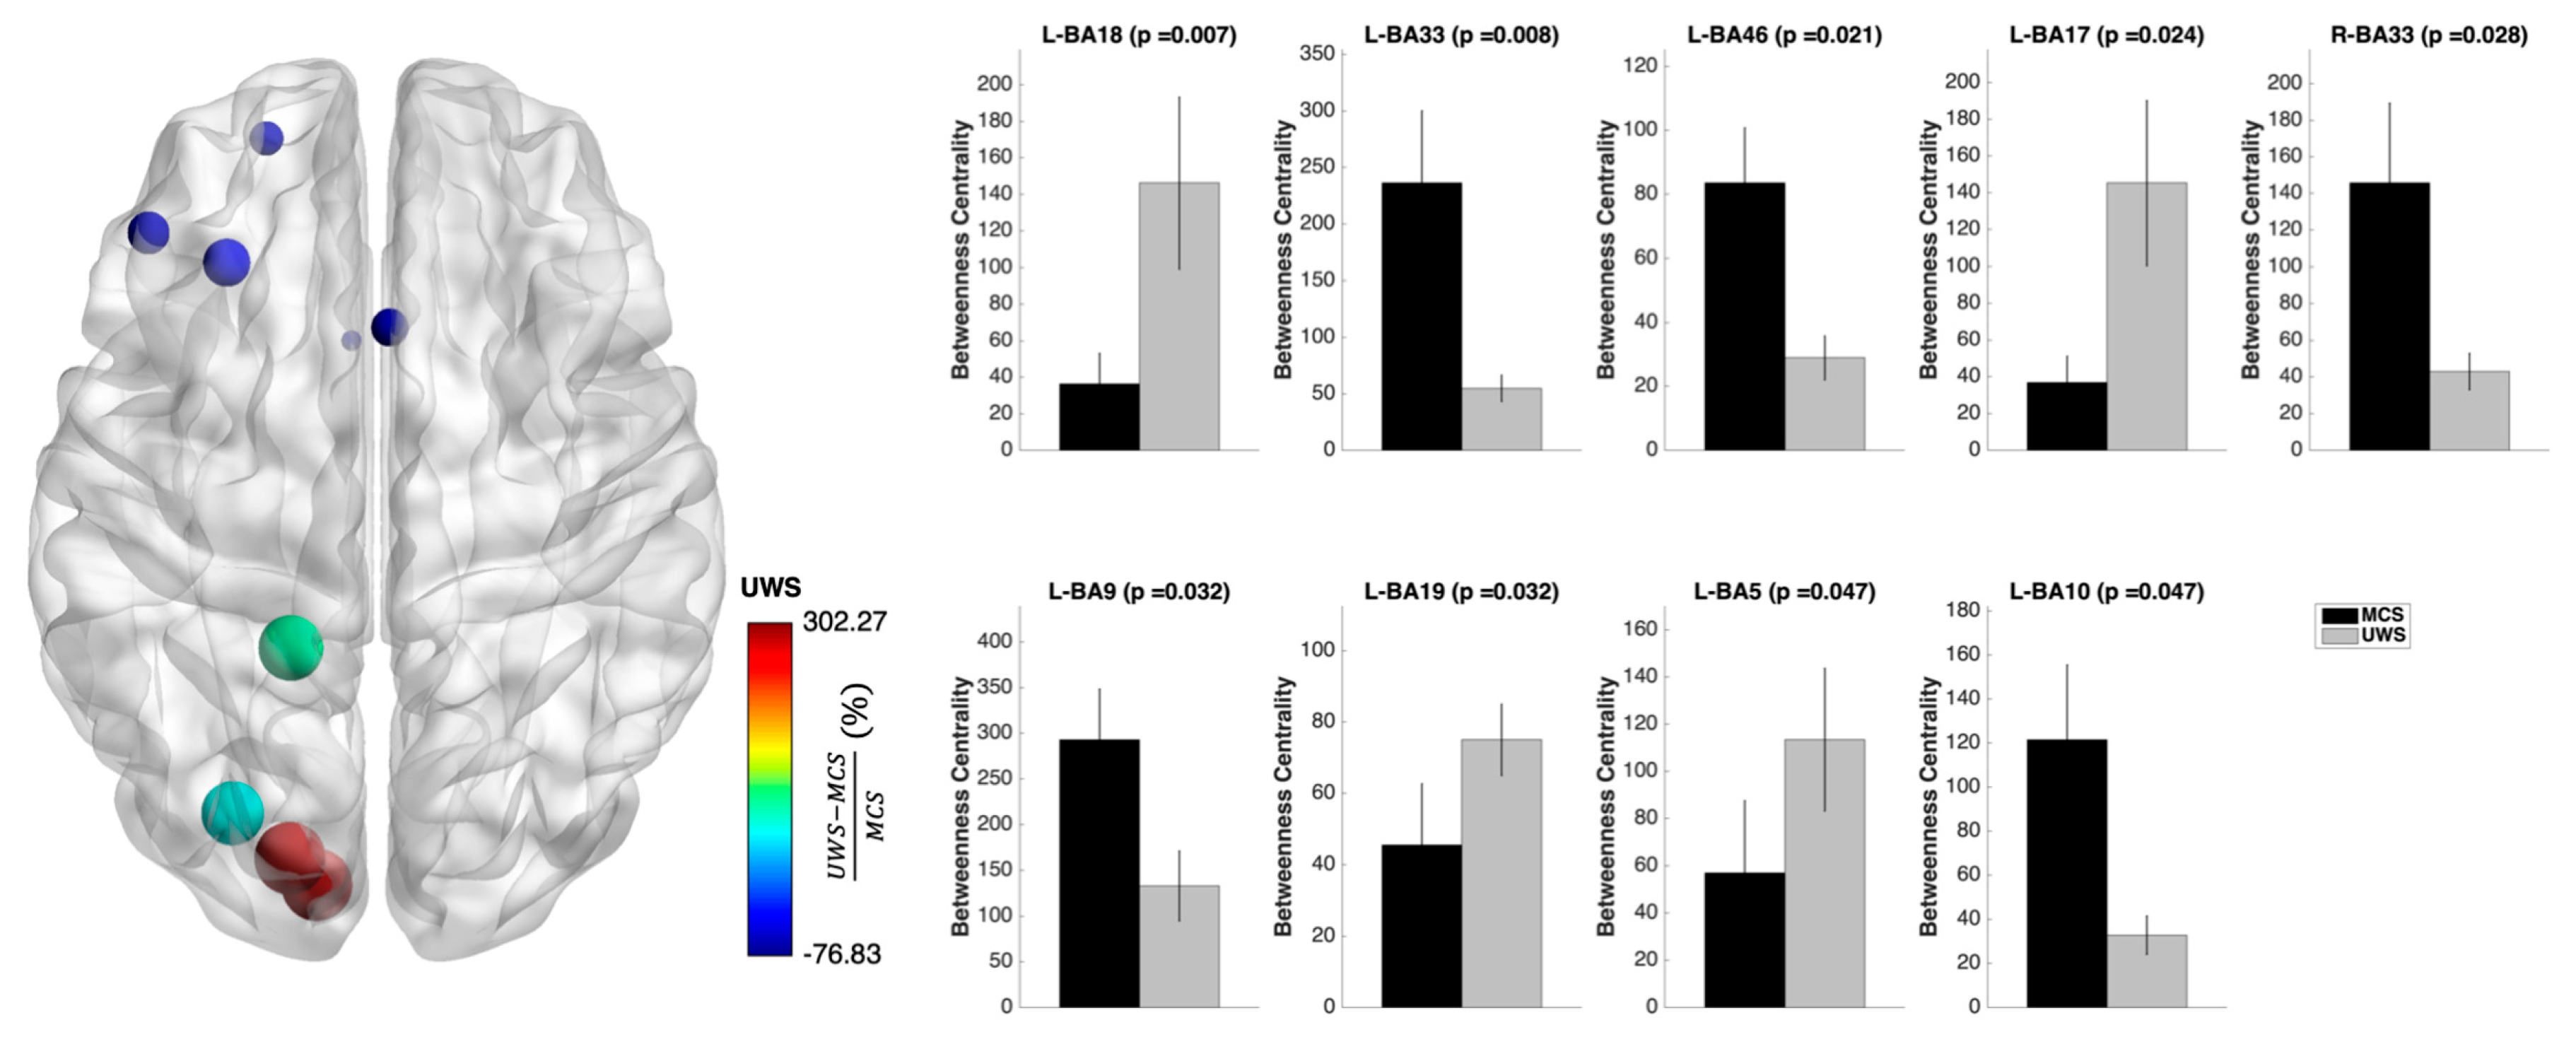
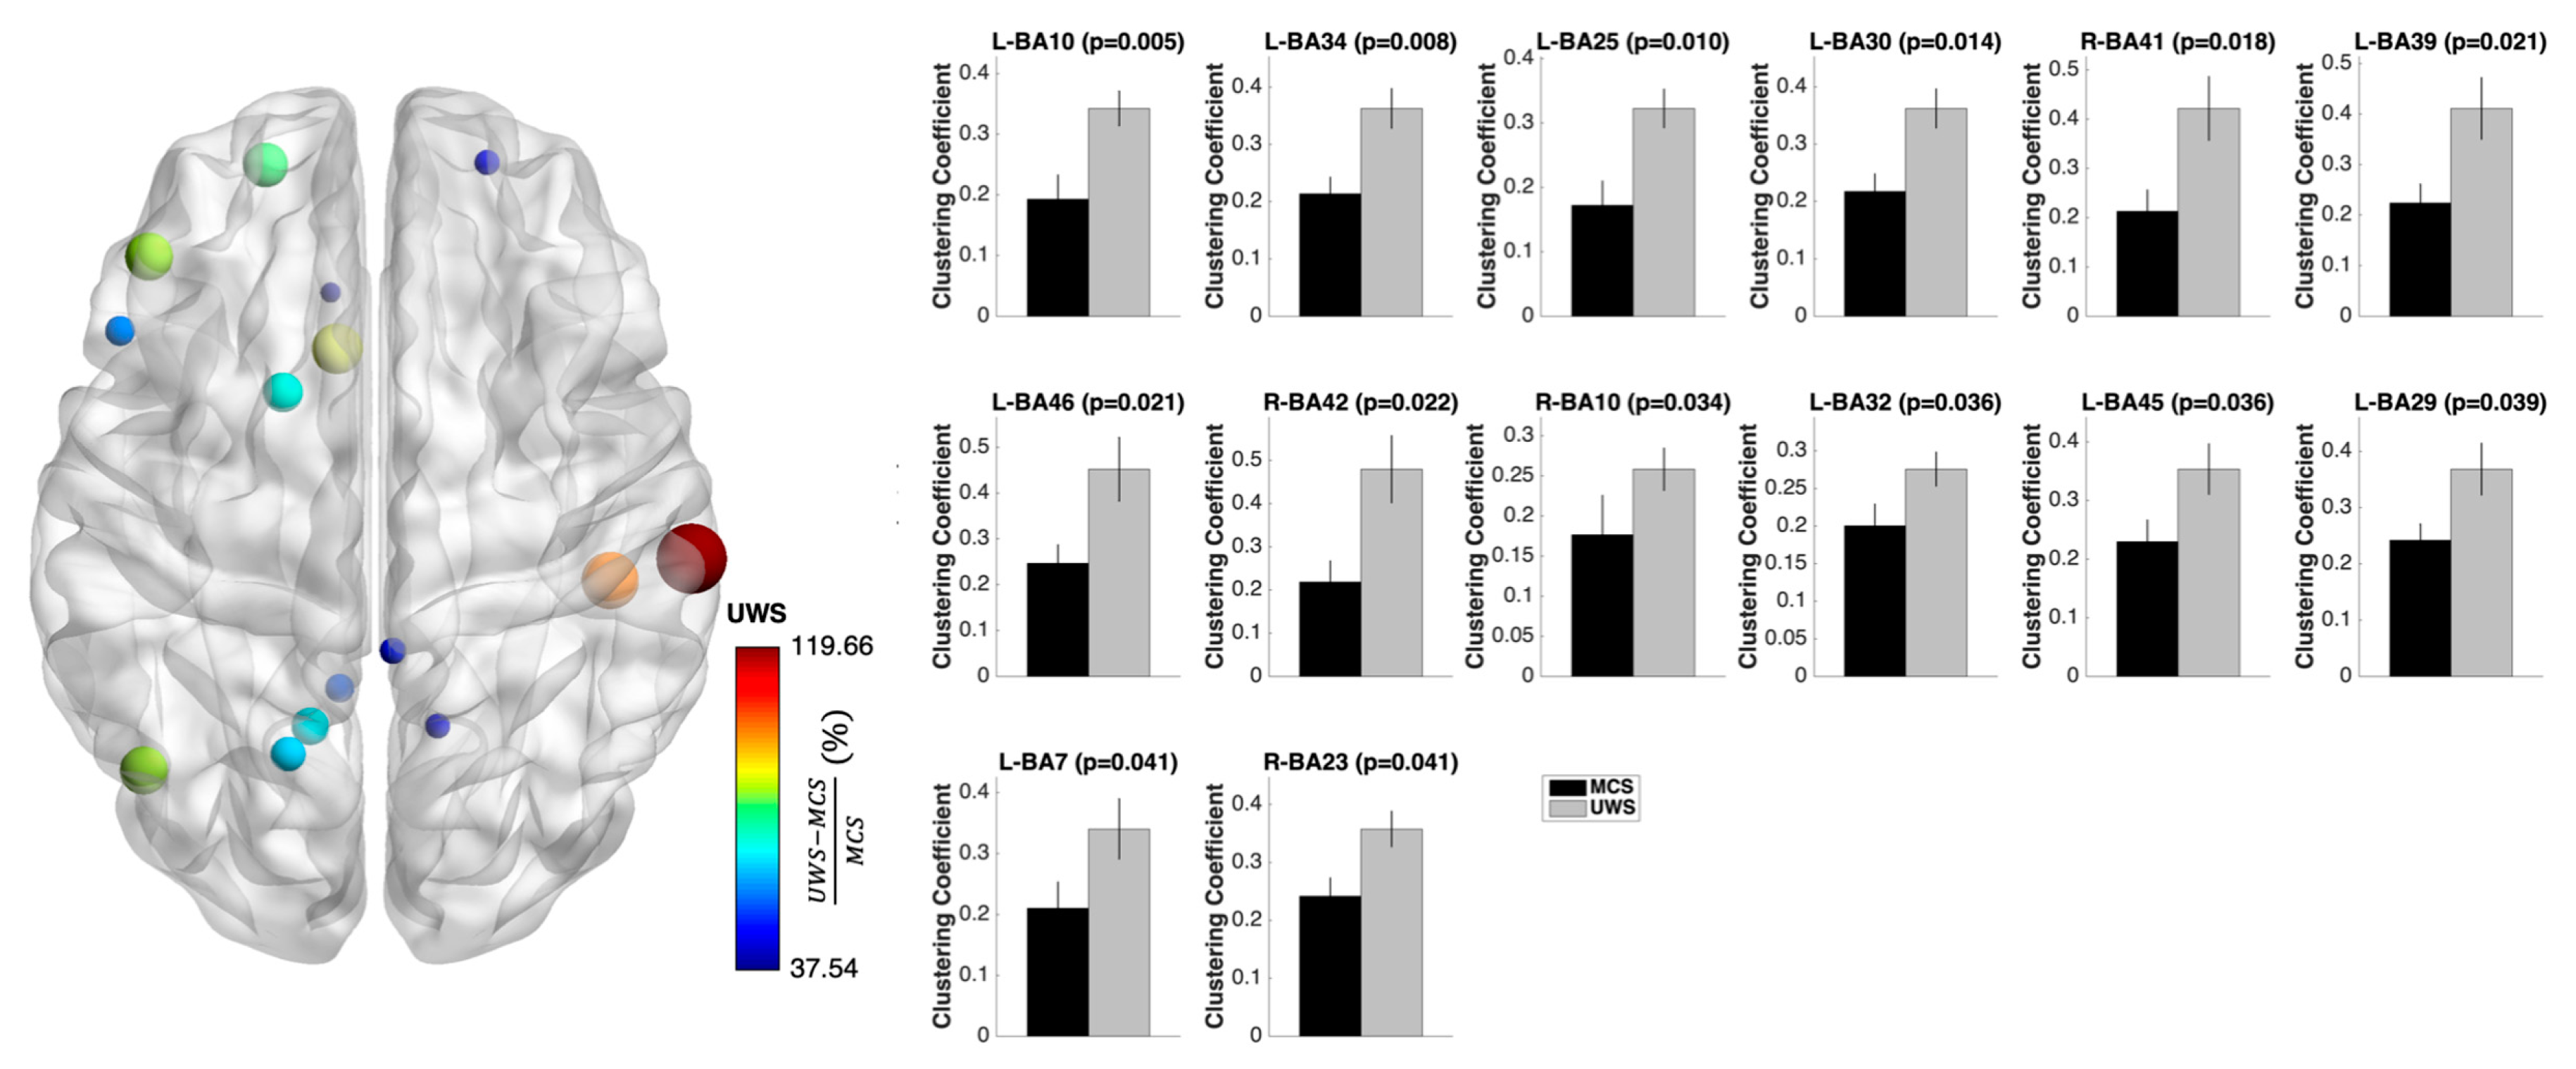
3.3. Nodal Measures
4. Discussion
Limitations
5. Conclusions
Supplementary Materials
Author Contributions
Conflicts of Interest
References
- Sporns, O.; Tononi, G.; Kötter, R. The human connectome: A structural description of the human brain. PLoS Comput. Biol. 2005, 1, e42. [Google Scholar] [CrossRef] [PubMed]
- Papo, D.; Buldu, J.M.; Boccaletti, S.; Bullmore, E.T. Complex network theory and the brain. Philos. Trans. R. Soc. B 2014, 369, 20130520. [Google Scholar] [CrossRef] [PubMed]
- Fornito, A.; Zalesky, A.; Bullmore, E.T. Fundamentals of Brain Network Analysis, 1st ed.; Zalesky, A., Bullmore, E.T., Eds.; Academic Press: San Diego, CA, USA, 2017; ISBN 9780124081185. [Google Scholar]
- De Vico Fallani, F.; Richiardi, J.; Chavez, M.; Achard, S. Graph analysis of functional brain networks: Practical issues in translational neuroscience. Philos. Trans. R. Soc. B Biol. Sci. 2014, 369, 20130521. [Google Scholar] [CrossRef] [PubMed]
- Gong, G.; He, Y.; Concha, L.; Lebel, C.; Gross, D.W.; Evans, A.C.; Beaulieu, C. Mapping anatomical connectivity patterns of human cerebral cortex using in vivo diffusion tensor imaging tractography. Cereb. Cortex 2009, 19, 524–536. [Google Scholar] [CrossRef] [PubMed]
- Hagmann, P.; Cammoun, L.; Gigandet, X.; Meuli, R.; Honey, C.J.; Van Wedeen, J.; Sporns, O. Mapping the structural core of human cerebral cortex. PLoS Biol. 2008, 6, 1479–1493. [Google Scholar] [CrossRef] [PubMed]
- Sporns, O.; Zwi, J.D. The small world of the cerebral cortex. Neuroinformatics 2004, 2, 145–162. [Google Scholar] [CrossRef]
- Hilgetag, C.C.; Kaiser, M. Clustered organization of cortical connectivity. Neuroinformatics 2004, 2, 353–360. [Google Scholar] [CrossRef]
- Tononi, G. An information integration theory of consciousness. BMC Neurosci. 2004, 5, 42. [Google Scholar] [CrossRef] [PubMed]
- Amico, E.; Marinazzo, D.; Di Perri, C.; Heine, L.; Annen, J.; Martial, C.; Dzemidzic, M.; Kirsch, M.; Bonhomme, V.; Laureys, S.; et al. Mapping the functional connectome traits of levels of consciousness. Neuroimage 2017, 148, 201–211. [Google Scholar] [CrossRef] [PubMed]
- Calabrò, R.S.; Cacciola, A.; Bramanti, P.; Milardi, D. Neural correlates of consciousness: What we know and what we have to learn! Neurol. Sci. 2015, 36, 505–513. [Google Scholar] [CrossRef] [PubMed]
- Calabrò, R.S.; Milardi, D.; Cacciola, A.; Marra, A.; Digangi, G.; Casella, C.; Manuli, A.; De Luca, R.; Silvestri, R.; Bramanti, P. Moving into the wide clinical spectrum of consciousness disorders: Pearls, perils and pitfalls. Medicina 2016, 52, 11–18. [Google Scholar]
- Naro, A.; Bramanti, P.; Leo, A.; Cacciola, A.; Bramanti, A.; Manuli, A.; Calabrò, R.S. Towards a method to differentiate chronic disorder of consciousness patients’ awareness: The Low-Resolution Brain Electromagnetic Tomography Analysis. J. Neurol. Sci. 2016, 368, 178–183. [Google Scholar] [CrossRef] [PubMed]
- Chillura, A.; Naro, A.; Cacciola, A.; Bramanti, A.; Bramanti, P.; Calabrò, R.S. Transcranial parenchymal sonography in patients with Chronic Disorders of Consciousness: Association with neuroimaging data, and beyond. Conscious. Cogn. 2017, 52, 32–38. [Google Scholar] [CrossRef] [PubMed]
- Naro, A.; Calabrò, R.S.; Leo, A.; Russo, M.; Milardi, D.; Cannavò, A.; Manuli, A.; Buda, A.; Casella, C.; Bramanti, P.; et al. Bridging the Gap Towards Awareness Detection in Disorders of Consciousness: An Experimental Study on the Mirror Neuron System. Brain Topogr. 2018, 31, 623–639. [Google Scholar] [CrossRef] [PubMed]
- Naro, A.; Leo, A.; Manuli, A.; Cannavò, A.; Bramanti, A.; Bramanti, P.; Calabrò, R.S. How far can we go in chronic disorders of consciousness differential diagnosis? The use of neuromodulation in detecting internal and external awareness. Neuroscience 2017, 349, 165–173. [Google Scholar] [CrossRef] [PubMed]
- Naro, A.; Bramanti, A.; Leo, A.; Cacciola, A.; Manuli, A.; Bramanti, P.; Calabrò, R.S. Shedding new light on disorders of consciousness diagnosis: The dynamic functional connectivity. Cortex 2018, 103, 316–328. [Google Scholar] [CrossRef] [PubMed]
- Naro, A.; Bramanti, A.; Leo, A.; Bramanti, P.; Calabrò, R.S. Metaplasticity: A Promising Tool to Disentangle Chronic Disorders of Consciousness Differential Diagnosis. Int. J. Neural Syst. 2017, 28, 1750059. [Google Scholar] [CrossRef] [PubMed]
- Crone, J.S.; Soddu, A.; Höller, Y.; Vanhaudenhuyse, A.; Schurz, M.; Bergmann, J.; Schmid, E.; Trinka, E.; Laureys, S.; Kronbichler, M. Altered network properties of the fronto-parietal network and the thalamus in impaired consciousness. NeuroImage Clin. 2014, 4, 240–248. [Google Scholar] [CrossRef] [PubMed]
- Boly, M.; Faymonville, M.E.; Peigneux, P.; Lambermont, B.; Damas, P.; Del Fiore, G.; Degueldre, C.; Franck, G.; Luxen, A.; Lamy, M.; et al. Auditory processing in severely brain injured patients: Differences between the minimally conscious state and the persistent vegetative state. Arch. Neurol. 2004, 61, 233–238. [Google Scholar] [CrossRef] [PubMed]
- Giacino, J.T.; Hirsch, J.; Schiff, N.; Laureys, S. Functional Neuroimaging Applications for Assessment and Rehabilitation Planning in Patients with Disorders of Consciousness. Arch. Phys. Med. Rehabil. 2006, 87, 67–76. [Google Scholar] [CrossRef] [PubMed]
- Di Perri, C.; Bastianello, S.; Bartsch, A.J.; Pistarini, C.; Maggioni, G.; Magrassi, L.; Imberti, R.; Pichiecchio, A.; Vitali, P.; Laureys, S.; et al. Limbic hyperconnectivity in the vegetative state. Neurology 2013, 81, 1417–1424. [Google Scholar] [CrossRef] [PubMed]
- Di Perri, C.; Bahri, M.A.; Amico, E.; Thibaut, A.; Heine, L.; Antonopoulos, G.; Charland-Verville, V.; Wannez, S.; Gomez, F.; Hustinx, R.; et al. Neural correlates of consciousness in patients who have emerged from a minimally conscious state: A cross-sectional multimodal imaging study. Lancet. Neurol. 2016, 15, 830–842. [Google Scholar] [CrossRef]
- Childs, N.L.; Mercer, W.N.; Childs, H.W. Accuracy of diagnosis of persistent vegetative state. Neurology 1993, 43, 1465–1467. [Google Scholar] [CrossRef] [PubMed]
- Schnakers, C.; Vanhaudenhuyse, A.; Giacino, J.; Ventura, M.; Boly, M.; Majerus, S.; Moonen, G.; Laureys, S. Diagnostic accuracy of the vegetative and minimally conscious state: Clinical consensus versus standardized neurobehavioral assessment. BMC Neurol. 2009, 9, 35. [Google Scholar] [CrossRef] [PubMed]
- Lehembre, R.; Marie-Aurélie, B.; Vanhaudenhuyse, A.; Chatelle, C.; Cologan, V.; Leclercq, Y.; Soddu, A.; Macq, B.; Laureys, S.; Noirhomme, Q. Resting-state EEG study of comatose patients: A connectivity and frequency analysis to find differences between vegetative and minimally conscious states. Funct. Neurol. 2012, 27, 41–47. [Google Scholar] [PubMed]
- King, J.-R.; Sitt, J.D.; Faugeras, F.; Rohaut, B.; El Karoui, I.; Cohen, L.; Naccache, L.; Dehaene, S. Information Sharing in the Brain Indexes Consciousness in Noncommunicative Patients. Curr. Biol. 2013, 23, 1914–1919. [Google Scholar] [CrossRef] [PubMed]
- Lechinger, J.; Bothe, K.; Pichler, G.; Michitsch, G.; Donis, J.; Klimesch, W.; Schabus, M. CRS-R score in disorders of consciousness is strongly related to spectral EEG at rest. J. Neurol. 2013, 260, 2348–2356. [Google Scholar] [CrossRef] [PubMed]
- Chennu, S.; Finoia, P.; Kamau, E.; Allanson, J.; Williams, G.B.; Monti, M.M.; Noreika, V.; Arnatkeviciute, A.; Canales-Johnson, A.; Olivares, F.; et al. Spectral signatures of reorganised brain networks in disorders of consciousness. PLoS Comput. Biol. 2014, 10, e1003887. [Google Scholar] [CrossRef] [PubMed]
- Chennu, S.; Annen, J.; Wannez, S.; Thibaut, A.; Chatelle, C.; Cassol, H.; Martens, G.; Schnakers, C.; Gosseries, O.; Menon, D.; et al. Brain networks predict metabolism, diagnosis and prognosis at the bedside in disorders of consciousness. Brain 2017, 140, 2120–2132. [Google Scholar] [CrossRef] [PubMed]
- Sitt, J.D.; King, J.-R.; El Karoui, I.; Rohaut, B.; Faugeras, F.; Gramfort, A.; Cohen, L.; Sigman, M.; Dehaene, S.; Naccache, L. Large scale screening of neural signatures of consciousness in patients in a vegetative or minimally conscious state. Brain 2014, 137, 2258–2270. [Google Scholar] [CrossRef] [PubMed]
- de Vico Fallani, F.; Astolfi, L.; Cincotti, F.; Mattia, D.; la Rocca, D.; Maksuti, E.; Salinari, S.; Babiloni, F.; Vegso, B.; Kozmann, G.; et al. Evaluation of the brain network organization from EEG signals: A preliminary evidence in stroke patient. Anat. Rec. (Hoboken). 2009, 292, 2023–2031. [Google Scholar] [CrossRef] [PubMed]
- Chen, Z.J.; He, Y.; Rosa-Neto, P.; Germann, J.; Evans, A.C. Revealing modular architecture of human brain structural networks by using cortical thickness from MRI. Cereb. Cortex 2008, 18, 2374–2381. [Google Scholar] [CrossRef] [PubMed]
- He, B.J.; Snyder, A.Z.; Vincent, J.L.; Epstein, A.; Shulman, G.L.; Corbetta, M. Breakdown of functional connectivity in frontoparietal networks underlies behavioral deficits in spatial neglect. Neuron 2007, 53, 905–918. [Google Scholar] [CrossRef] [PubMed]
- Honey, C.J.; Sporns, O. Dynamical consequences of lesions in cortical networks. Hum. Brain Mapp. 2008, 29, 802–809. [Google Scholar] [CrossRef] [PubMed]
- Achard, S.; Delon-Martin, C.; Vertes, P.E.; Renard, F.; Schenck, M.; Schneider, F.; Heinrich, C.; Kremer, S.; Bullmore, E.T. Hubs of brain functional networks are radically reorganized in comatose patients. Proc. Natl. Acad. Sci. USA 2012, 109, 20608–20613. [Google Scholar] [CrossRef] [PubMed]
- Long, J.; Xie, Q.; Ma, Q.; Urbin, M.A.; Liu, L.; Weng, L.; Huang, X.; Yu, R.; Li, Y.; Huang, R. Distinct Interactions between Fronto-Parietal and Default Mode Networks in Impaired Consciousness. Sci. Rep. 2016, 6, 38866. [Google Scholar] [CrossRef] [PubMed]
- Bodien, Y.; Chatelle, C.; Edlow, B. Functional Networks in Disorders of Consciousness. Semin. Neurol. 2017, 37, 485–502. [Google Scholar] [PubMed]
- Giacino, J.T.; Kalmar, K.; Whyte, J. The JFK Coma Recovery Scale-Revised: Measurement characteristics and diagnostic utility. Arch. Phys. Med. Rehabil. 2004, 85, 2020–2029. [Google Scholar] [CrossRef] [PubMed]
- Pascual-Marqui, R.D. Discrete, 3D Distributed, Linear Imaging Methods of Electric Neuronal Activity. Part 1: Exact, Zero Error Localization. Available online: https://arxiv.org/abs/0710.3341 (accessed on 27 January 2019).
- Fuchs, M.; Kastner, J.; Wagner, M.; Hawes, S.; Ebersole, J.S. A standardized boundary element method volume conductor model. Clin. Neurophysiol. 2002, 113, 702–712. [Google Scholar] [CrossRef]
- Lancaster, J.L.; Woldorff, M.G.; Parsons, L.M.; Liotti, M.; Freitas, C.S.; Rainey, L.; Kochunov, P.V.; Nickerson, D.; Mikiten, S.A.; Fox, P.T. Automated Talairach Atlas labels for functional brain mapping. Hum. Brain Mapp. 2000, 10, 120–131. [Google Scholar] [CrossRef]
- Brett, M.; Johnsrude, I.S.; Owen, A.M. The problem of functional localization in the human brain. Nat. Rev. Neurosci. 2002, 3, 243–249. [Google Scholar] [CrossRef] [PubMed]
- Kubicki, S.; Herrmann, W.M.M.; Fichte, K.; Freund, G. Reflections on the topics: EEG frequency bands and regulation of vigilance. Pharmakopsychiatr. Neuropsychopharmakol. 1979, 12, 237–245. [Google Scholar] [CrossRef] [PubMed]
- Pascual-Marqui, R.D.; Lehmann, D.; Koukkou, M.; Kochi, K.; Anderer, P.; Saletu, B.; Tanaka, H.; Hirata, K.; John, E.R.; Prichep, L.; et al. Assessing interactions in the brain with exact low-resolution electromagnetic tomography. Philos. Trans. R. Soc. London A Math. Phys. Eng. Sci. 2011, 369, 3768–3784. [Google Scholar] [CrossRef] [PubMed]
- Korgaonkar, M.S.; Fornito, A.; Williams, L.M.; Grieve, S.M. Abnormal structural networks characterize major depressive disorder: A connectome analysis. Biol. Psychiatry 2014, 76, 567–574. [Google Scholar] [CrossRef] [PubMed]
- van den Heuvel, M.P.; de Lange, S.C.; Zalesky, A.; Seguin, C.; Yeo, B.T.T.; Schmidt, R. Proportional thresholding in resting-state fMRI functional connectivity networks and consequences for patient-control connectome studies: Issues and recommendations. Neuroimage 2017, 152, 437–449. [Google Scholar] [CrossRef] [PubMed]
- Humphries, M.D.; Gurney, K. Network “small-world-ness”: A quantitative method for determining canonical network equivalence. PLoS ONE 2008, 3, e0002051. [Google Scholar] [CrossRef] [PubMed]
- Telesford, Q.K.; Joyce, K.E.; Hayasaka, S.; Burdette, J.H.; Laurienti, P.J. The ubiquity of small-world networks. Brain Connect. 2011, 1, 367–375. [Google Scholar] [CrossRef] [PubMed]
- Watts, D.J.; Strogatz, S.H. Collective dynamics of ‘small-world’ networks. Nature 1998, 393, 440–442. [Google Scholar] [CrossRef] [PubMed]
- Newman, M.E.J. Modularity and community structure in networks. Proc. Natl. Acad. Sci. USA 2006, 103, 8577–8582. [Google Scholar] [CrossRef] [PubMed]
- Newman, M.; Girvan, M. Finding and evaluating community structure in networks. Phys. Rev. E 2004, 69, 1–16. [Google Scholar] [CrossRef] [PubMed]
- Lü, L.; Pan, L.; Zhou, T.; Zhang, Y.-C.; Stanley, H.E. Toward link predictability of complex networks. Proc. Natl. Acad. Sci. USA 2015, 112, 2325–2330. [Google Scholar]
- Latora, V.; Marchiori, M. Efficient behavior of small-world networks. Phys. Rev. Lett. 2001, 87, 198701. [Google Scholar] [CrossRef] [PubMed]
- van den Heuvel, M.P.; Stam, C.J.; Kahn, R.S.; Hulshoff Pol, H.E. Efficiency of functional brain networks and intellectual performance. J. Neurosci. 2009, 29, 7619–7624. [Google Scholar] [CrossRef] [PubMed]
- Brandes, U. A faster algorithm for betweenness centrality. J. Math. Sociol. 2001, 25, 163–177. [Google Scholar] [CrossRef]
- Cannistraci, C.V.; Alanis-Lobato, G.; Ravasi, T. From link-prediction in brain connectomes and protein interactomes to the local-community-paradigm in complex networks. Sci. Rep. 2013, 3, 1–13. [Google Scholar] [CrossRef] [PubMed]
- Cannistraci, C.V. Modelling Self-Organization in Complex Networks Via a Brain-Inspired Network Automata Theory Improves Link Reliability in Protein Interactomes. Sci. Rep. 2018, 8, 15760. [Google Scholar] [CrossRef] [PubMed]
- Daminelli, S.; Thomas, J.M.; Durán, C.; Vittorio Cannistraci, C. Common neighbours and the local-community-paradigm for topological link prediction in bipartite networks. New J. Phys. 2015, 17, 113037. [Google Scholar] [CrossRef]
- Durán, C.; Daminelli, S.; Thomas, J.M.; Haupt, V.J.; Schroeder, M.; Cannistraci, C.V. Pioneering topological methods for network-based drug–target prediction by exploiting a brain-network self-organization theory. Brief Bioinform. 2018, 19, 1183–1202. [Google Scholar] [CrossRef] [PubMed]
- Narula, V.; Zippo, A.G.; Muscoloni, A.; Biella, G.E.M.; Cannistraci, C.V. Can local-community-paradigm and epitopological learning enhance our understanding of how local brain connectivity is able to process, learn and memorize chronic pain? Appl. Netw. Sci. 2017, 2, 28. [Google Scholar] [CrossRef] [PubMed]
- Zalesky, A.; Fornito, A.; Bullmore, E.T. Network-based statistic: Identifying differences in brain networks. Neuroimage 2010, 53, 1197–1207. [Google Scholar] [CrossRef] [PubMed]
- Ovadia-Caro, S.; Nir, Y.; Soddu, A.; Ramot, M.; Hesselmann, G.; Vanhaudenhuyse, A.; Dinstein, I.; Tshibanda, J.-F.L.; Boly, M.; Harel, M.; et al. Reduction in inter-hemispheric connectivity in disorders of consciousness. PLoS ONE 2012, 7, e37238. [Google Scholar] [CrossRef] [PubMed]
- Mäki-Marttunen, V.; Diez, I.; Cortes, J.M.; Chialvo, D.R.; Villarreal, M. Disruption of transfer entropy and inter-hemispheric brain functional connectivity in patients with disorder of consciousness. Front. Neuroinform. 2013, 7, 24. [Google Scholar] [CrossRef] [PubMed]
- Demertzi, A.; Antonopoulos, G.; Heine, L.; Voss, H.U.; Crone, J.S.; de Los Angeles, C.; Bahri, M.A.; Di Perri, C.; Vanhaudenhuyse, A.; Charland-Verville, V.; et al. Intrinsic functional connectivity differentiates minimally conscious from unresponsive patients. Brain 2015, 138, 2619–2631. [Google Scholar] [CrossRef] [PubMed]
- Koch, C.; Massimini, M.; Boly, M.; Tononi, G. Neural correlates of consciousness: Progress and problems. Nat. Rev. Neurosci. 2016, 17, 307–321. [Google Scholar] [CrossRef] [PubMed]
- Siclari, F.; Baird, B.; Perogamvros, L.; Bernardi, G.; LaRocque, J.J.; Riedner, B.; Boly, M.; Postle, B.R.; Tononi, G. The neural correlates of dreaming. Nat. Neurosci. 2017, 20, 872–878. [Google Scholar] [CrossRef] [PubMed]
- Cavanna, A.E.; Trimble, M.R. The precuneus: A review of its functional anatomy and behavioural correlates. Brain 2006, 129, 564–583. [Google Scholar] [CrossRef] [PubMed]
- Hannawi, Y.; Lindquist, M.A.; Caffo, B.S.; Sair, H.I.; Stevens, R.D. Resting brain activity in disorders of consciousness: A systematic review and meta-analysis. Neurology 2015, 84, 1272–1280. [Google Scholar] [CrossRef] [PubMed]
- Dell’Italia, J.; Johnson, M.A.; Vespa, P.M.; Monti, M.M. Network Analysis in Disorders of Consciousness: Four Problems and One Proposed Solution (Exponential Random Graph Models). Front. Neurol. 2018, 9, 439. [Google Scholar] [CrossRef] [PubMed]
- Monti, M.M. Cognition in the vegetative state. Annu. Rev. Clin. Psychol. 2012, 8, 431–454. [Google Scholar] [CrossRef] [PubMed]
- Golland, Y.; Bentin, S.; Gelbard, H.; Benjamini, Y.; Heller, R.; Nir, Y.; Hasson, U.; Malach, R. Extrinsic and intrinsic systems in the posterior cortex of the human brain revealed during natural sensory stimulation. Cereb. Cortex 2007, 17, 766–777. [Google Scholar] [CrossRef] [PubMed]
- Pandit, A.S.; Expert, P.; Lambiotte, R.; Bonnelle, V.; Leech, R.; Turkheimer, F.E.; Sharp, D.J. Traumatic brain injury impairs small-world topology. Neurology 2013, 80, 1826–1833. [Google Scholar] [CrossRef] [PubMed]
- Achard, S.; Kremer, S.; Schenck, M.; Renard, F.; Ong-Nicolas, C.; Namer, J.I.; Mutschler, V.; Schneider, F.; Delon-Martin, C. Global Functional Disconnections in Post-anoxic Coma Patient. Neuroradiol. J. 2011, 24, 311–315. [Google Scholar] [CrossRef] [PubMed]
- Raichle, M.E.; Snyder, A.Z. A default mode of brain function: A brief history of an evolving idea. Neuroimage 2007, 37, 1083–1090; discussion 1097–1099. [Google Scholar] [CrossRef] [PubMed]
- Vanhaudenhuyse, A.; Noirhomme, Q.; Tshibanda, L.J.-F.; Bruno, M.-A.; Boveroux, P.; Schnakers, C.; Soddu, A.; Perlbarg, V.; Ledoux, D.; Brichant, J.-F.; et al. Default network connectivity reflects the level of consciousness in non-communicative brain-damaged patients. Brain 2010, 133, 161–171. [Google Scholar] [CrossRef] [PubMed]
- Achard, S.; Bullmore, E. Efficiency and Cost of Economical Brain Functional Networks. PLoS Comput. Biol. 2007, 3, e17. [Google Scholar] [CrossRef] [PubMed]
- Bullmore, E.T.; Bassett, D.S. Brain Graphs: Graphical Models of the Human Brain Connectome. Annu. Rev. Clin. Psychol. 2011, 7, 113–140. [Google Scholar] [CrossRef] [PubMed]
- Bullmore, E.; Sporns, O. Complex brain networks: Graph theoretical analysis of structural and functional systems. Nat. Rev. Neurosci. 2009, 10, 186–198. [Google Scholar] [CrossRef] [PubMed]
- Salvador, R.; Suckling, J.; Schwarzbauer, C.; Bullmore, E. Undirected graphs of frequency-dependent functional connectivity in whole brain networks. Philos. Trans. R. Soc. B Biol. Sci. 2005, 360, 937–946. [Google Scholar] [CrossRef] [PubMed]
- Boly, M.; Massimini, M.; Garrido, M.I.; Gosseries, O.; Noirhomme, Q.; Laureys, S.; Soddu, A. Brain Connectivity in Disorders of Consciousness. Brain Connect. 2012, 2, 1–10. [Google Scholar] [CrossRef] [PubMed]
- Ragazzoni, A.; Pirulli, C.; Veniero, D.; Feurra, M.; Cincotta, M.; Giovannelli, F.; Chiaramonti, R.; Lino, M.; Rossi, S.; Miniussi, C. Vegetative versus Minimally Conscious States: A Study Using TMS-EEG, Sensory and Event-Related Potentials. PLoS ONE 2013, 8, e57069. [Google Scholar] [CrossRef] [PubMed]
- Rosanova, M.; Gosseries, O.; Casarotto, S.; Boly, M.; Casali, A.G.; Bruno, M.A.; Mariotti, M.; Boveroux, P.; Tononi, G.; Laureys, S.; et al. Recovery of cortical effective connectivity and recovery of consciousness in vegetative patients. Brain 2012, 135, 1308–1320. [Google Scholar] [CrossRef] [PubMed]
- Schartner, M.; Seth, A.; Noirhomme, Q.; Boly, M.; Bruno, M.A.; Laureys, S.; Barrett, A. Complexity of multi-dimensional spontaneous EEG decreases during propofol induced general anaesthesia. PLoS ONE 2015, 10, e0133532. [Google Scholar] [CrossRef] [PubMed]
- Hebb, D.O. The Organisation of Behavior, 1st ed.; Wiley & Sons: New York, NY, USA, 1949; ISBN 9780471367277. [Google Scholar]
- Corti, V.; Sanchez-Ruiz, Y.; Piccoli, G.; Bergamaschi, A.; Cannistraci, C.V.; Pattini, L.; Cerutti, S.; Bachi, A.; Alessio, M.; Malgaroli, A. Protein fingerprints of cultured CA3-CA1 hippocampal neurons: Comparative analysis of the distribution of synaptosomal and cytosolic proteins. BMC Neurosci. 2008, 9, 36. [Google Scholar] [CrossRef] [PubMed]
- Ziv, N.E.; Ahissar, E. Neuroscience: New tricks and old spines. Nature 2009, 462, 859–861. [Google Scholar] [CrossRef] [PubMed]
- Schiff, N.D. Cognitive Motor Dissociation Following Severe Brain Injuries. JAMA Neurol. 2015, 72, 1413–1415. [Google Scholar] [CrossRef] [PubMed]
- Fernández-Espejo, D.; Rossit, S.; Owen, A.M. A Thalamocortical Mechanism for the Absence of Overt Motor Behavior in Covertly Aware Patients. JAMA Neurol. 2015, 72, 1442–1450. [Google Scholar] [CrossRef] [PubMed]
- Kasthurirathna, D.; Piraveenan, M.; Thedchanamoorthy, G. Network robustness and topological characteristics in scale-free networks. In Proceedings of the 2013 IEEE Conference on Evolving and Adaptive Intelligent Systems (EAIS), Singapore, 16–19 April 2013; pp. 122–129. [Google Scholar] [CrossRef]
- Godwin, D.; Barry, R.L.; Marois, R. Breakdown of the brain’s functional network modularity with awareness. Proc. Natl. Acad. Sci. 2015, 112, 3799–3804. [Google Scholar] [CrossRef] [PubMed]
- Laureys, S.; Boly, M.; Maquet, P. Tracking the recovery of consciousness from coma. J. Clin. Invest. 2006, 116, 1823–1825. [Google Scholar] [CrossRef] [PubMed]
- Guldenmund, P.; Stender, J.; Heine, L.; Laureys, S. Mindsight: Diagnostics in disorders of consciousness. Crit. Care Res. Pract. 2012, 2012, 624724. [Google Scholar] [CrossRef] [PubMed]
- Majerus, S.; Gill-Thwaites, H.; Andrews, K.; Laureys, S. Behavioral evaluation of consciousness in severe brain damage. Prog. Brain Res. 2005, 150, 397–413. [Google Scholar] [PubMed]
- Bruno, M.A.; Vanhaudenhuyse, A.; Thibaut, A.; Moonen, G.; Laureys, S. From unresponsive wakefulness to minimally conscious PLUS and functional locked-in syndromes: Recent advances in our understanding of disorders of consciousness. J. Neurol. 2011, 258, 1373–1784. [Google Scholar] [CrossRef] [PubMed]
- Formisano, R.; Pistoia, F.; Sarà, M. Disorders of consciousness: A taxonomy to be changed? Brain Inj. 2011, 25, 638–639. [Google Scholar] [CrossRef] [PubMed]
- Formisano, R.; D’Ippolito, M.; Risetti, M.; Riccio, A.; Caravasso, C.F.; Catani, S.; Rizza, F.; Forcina, A.; Buzzi, M.G. Vegetative state, minimally conscious state, akinetic mutism and parkinsonism as a continuum of recovery from disorders of consciousness: An exploratory and preliminary study. Funct. Neurol. 2011, 26, 15–24. [Google Scholar] [PubMed]
- Formisano, R.; D’Ippolito, M.; Catani, S. Functional locked-in syndrome as recovery phase of vegetative state. Brain Inj. 2013, 27, 1332. [Google Scholar] [CrossRef] [PubMed]
- Gosseries, O.; Thibaut, A.; Boly, M.; Rosanova, M.; Massimini, M.; Laureys, S. Assessing consciousness in coma and related states using transcranial magnetic stimulation combined with electroencephalography. Ann. Fr. Anesth. Reanim. 2014, 33, 65–71. [Google Scholar] [CrossRef] [PubMed]
- Edelman, G.M. Naturalizing consciousness: A theoretical framework. Proc. Natl. Acad. Sci. USA 2003, 100, 5520–5524. [Google Scholar] [CrossRef] [PubMed]
- Fernández-Espejo, D.; Bekinschtein, T.; Monti, M.M.; Pickard, J.D.; Junque, C.; Coleman, M.R.; Owen, A.M. Diffusion weighted imaging distinguishes the vegetative state from the minimally conscious state. Neuroimage 2011, 54, 103–112. [Google Scholar] [CrossRef] [PubMed]
- Engel, A.K.; Fries, P. Beta-band oscillations-signalling the status quo? Curr. Opin. Neurobiol. 2010, 20, 156–165. [Google Scholar] [CrossRef] [PubMed]
- Donner, T.H.; Siegel, M. A framework for local cortical oscillation patterns. Trends Cogn. Sci. 2011, 15, 191–199. [Google Scholar] [CrossRef] [PubMed]
- Gilbertson, T.; Lalo, E.; Doyle, L.; Di Lazzaro, V.; Cioni, B.; Brown, P. Existing motor state is favored at the expense of new movement during 13-35 Hz oscillatory synchrony in the human corticospinal system. J. Neurosci. 2005, 25, 7771–7779. [Google Scholar] [CrossRef] [PubMed]
- Bonfiglio, L.; Piarulli, A.; Olcese, U.; Andre, P.; Arrighi, P.; Frisoli, A.; Rossi, B.; Bergamasco, M.; Carboncini, M.C. Spectral parameters modulation and source localization of blink-related alpha and low-beta oscillations differentiate minimally conscious state from vegetative state/unresponsive wakefulness syndrome. PLoS ONE 2014, 9, e93252. [Google Scholar] [CrossRef] [PubMed]
- Bai, Y.; Xia, X.; Li, X. A Review of Resting-State Electroencephalography Analysis in Disorders of Consciousness. Front. Neurol. 2017, 8, 471. [Google Scholar] [CrossRef] [PubMed]
- Schiff, N.D. Recovery of consciousness after brain injury: A mesocircuit hypothesis. Trends Neurosci. 2010, 33, 1–9. [Google Scholar] [CrossRef] [PubMed]
- Schiff, N.D.; Plum, F. The role of arousal and “gating” systems in the neurology of impaired consciousness. J. Clin. Neurophysiol. 2000, 17, 438–452. [Google Scholar] [CrossRef] [PubMed]
- Schiff, N.D. Central thalamic contributions to arousal regulation and neurological disorders of consciousness. Ann. N. Y. Acad. Sci. 2008, 1129, 105–118. [Google Scholar] [CrossRef] [PubMed]
- Jensen, O.; Goel, P.; Kopell, N.; Pohja, M.; Hari, R.; Ermentrout, B. On the human sensorimotor-cortex beta rhythm: Sources and modeling. Neuroimage 2005, 26, 347–355. [Google Scholar] [CrossRef] [PubMed]
- Hall, S.D.; Barnes, G.R.; Furlong, P.L.; Seri, S.; Hillebrand, A. Neuronal network pharmacodynamics of GABAergic modulation in the human cortex determined using pharmaco-magnetoencephalography. Hum. Brain Mapp. 2010, 31, 581–594. [Google Scholar] [CrossRef] [PubMed]
- Rossiter, H.E.; Davis, E.M.; Clark, E.V.; Boudrias, M.-H.; Ward, N.S. Beta oscillations reflect changes in motor cortex inhibition in healthy ageing. Neuroimage 2014, 91, 360–365. [Google Scholar] [CrossRef] [PubMed]
- Casarotto, S.; Comanducci, A.; Rosanova, M.; Sarasso, S.; Fecchio, M.; Napolitani, M.; Pigorini, A.; Casali, A.G.; Trimarchi, P.D.; Boly, M.; et al. Stratification of unresponsive patients by an independently validated index of brain complexity. Ann. Neurol. 2016, 80, 718–729. [Google Scholar] [CrossRef] [PubMed]


| DoC | Etiology | Gender | Age | BI Onset | MRI | CRS-R |
|---|---|---|---|---|---|---|
| MCS (n = 13) | T | F | 57 | 5 | PO_h | 12 ± 2 |
| A | F | 54 | 9 | WMH | 10 ± 3 | |
| T | M | 38 | 15 | FP_h | 12 ± 2 | |
| V | M | 60 | 14 | TP_IS | 11 ± 2 | |
| A | M | 36 | 15 | WMH | 8 ± 2 | |
| V | F | 46 | 16 | BG_h | 9 ± 1 | |
| T | M | 60 | 5 | F_h | 17 ± 3 | |
| T | F | 41 | 8 | SAH | 12 ± 4 | |
| V | M | 57 | 17 | P_IS | 9 ± 4 | |
| T | F | 42 | 8 | FP_h | 16 ± 2 | |
| V | M | 65 | 13 | FP_IS | 20 ± 4 | |
| A | M | 35 | 7 | WMH | 18 ± 1 | |
| V | F | 54 | 8 | SAH | 17 ± 3 | |
| 5T 3A 5V | 6F 7M | 50 ± 10 | 11 ± 4 | 13 ± 4 | ||
| UWS (n = 12) | A | F | 57 | 6 | WMH | 3 ± 2 |
| T | M | 58 | 16 | DAI | 4 ± 2 | |
| V | F | 62 | 11 | FTP_IS | 6 ± 2 | |
| A | F | 51 | 13 | WMH | 6 ± 2 | |
| T | M | 62 | 6 | DAI | 3 ± 2 | |
| A | F | 61 | 8 | WMH | 4 ± 2 | |
| V | M | 65 | 5 | FTP_IS | 6 ± 1 | |
| A | M | 64 | 18 | WMH | 7 ± 1 | |
| T | F | 56 | 5 | Fb_h | 6 ± 1 | |
| A | M | 40 | 12 | WMH | 5 ± 1 | |
| T | M | 41 | 17 | multiple_h | 5 ± 2 | |
| T | F | 53 | 7 | multiple_h | 5 ± 2 | |
| 5T 5A 2V | 6F 6M | 56 ± 8 | 10 ± 5 | 5 ± 1 | ||
| Sample (n = 25) | 10T 8A 7V | 12F 13M | 53 ± 12 | 11 ± 4 | 9 ± 5 | |
| Between-group p-value | 0.1 | 0.4 | 0.1 | 0.1 | 0.1 | <0.001 |
| Measure | UWS | MCS | MW p-Value | AUC | AUPR | Pearson Rho | Pearson p-Value | Spearman Rho | Spearman p-Value |
|---|---|---|---|---|---|---|---|---|---|
| LCP-corr | 0.91 ± 0.01 | 0.84 ± 0.03 | 0.03 | 0.75 | 0.66 | −0.21 | 0.31 | −0.30 | 0.14 |
| Eloc | 0.56 ± 0.02 | 0.48 ± 0.02 | 0.01 | 0.80 | 0.72 | −0.32 | 0.11 | −0.37 | 0.07 |
| ACC | 0.33 ± 0.02 | 0.27 ± 0.02 | 0.03 | 0.76 | 0.71 | −0.32 | 0.12 | −0.32 | 0.12 |
| SWω | 0.48 ± 0.08 | 0.58 ± 0.09 | 0.01 | 0.81 | 0.73 | 0.36 | 0.08 | 0.38 | 0.06 |
| SWω-E | 0.33 ± 0.08 | 0.42 ± 0.10 | 0.02 | 0.78 | 0.69 | 0.32 | 0.12 | 0.32 | 0.12 |
© 2019 by the authors. Licensee MDPI, Basel, Switzerland. This article is an open access article distributed under the terms and conditions of the Creative Commons Attribution (CC BY) license (http://creativecommons.org/licenses/by/4.0/).
Share and Cite
Cacciola, A.; Naro, A.; Milardi, D.; Bramanti, A.; Malatacca, L.; Spitaleri, M.; Leo, A.; Muscoloni, A.; Cannistraci, C.V.; Bramanti, P.; et al. Functional Brain Network Topology Discriminates between Patients with Minimally Conscious State and Unresponsive Wakefulness Syndrome. J. Clin. Med. 2019, 8, 306. https://doi.org/10.3390/jcm8030306
Cacciola A, Naro A, Milardi D, Bramanti A, Malatacca L, Spitaleri M, Leo A, Muscoloni A, Cannistraci CV, Bramanti P, et al. Functional Brain Network Topology Discriminates between Patients with Minimally Conscious State and Unresponsive Wakefulness Syndrome. Journal of Clinical Medicine. 2019; 8(3):306. https://doi.org/10.3390/jcm8030306
Chicago/Turabian StyleCacciola, Alberto, Antonino Naro, Demetrio Milardi, Alessia Bramanti, Leonardo Malatacca, Maurizio Spitaleri, Antonino Leo, Alessandro Muscoloni, Carlo Vittorio Cannistraci, Placido Bramanti, and et al. 2019. "Functional Brain Network Topology Discriminates between Patients with Minimally Conscious State and Unresponsive Wakefulness Syndrome" Journal of Clinical Medicine 8, no. 3: 306. https://doi.org/10.3390/jcm8030306
APA StyleCacciola, A., Naro, A., Milardi, D., Bramanti, A., Malatacca, L., Spitaleri, M., Leo, A., Muscoloni, A., Cannistraci, C. V., Bramanti, P., Calabrò, R. S., & Anastasi, G. P. (2019). Functional Brain Network Topology Discriminates between Patients with Minimally Conscious State and Unresponsive Wakefulness Syndrome. Journal of Clinical Medicine, 8(3), 306. https://doi.org/10.3390/jcm8030306