Exercise Training as a Treatment for Cardiometabolic Risk in Sedentary Adults: Are Physical Activity Guidelines the Best Way to Improve Cardiometabolic Health? The FIT-AGEING Randomized Controlled Trial

 ,
,  , ,
, ,  ,
,  and
and
Abstract
1. Introduction
2. Experimental Section
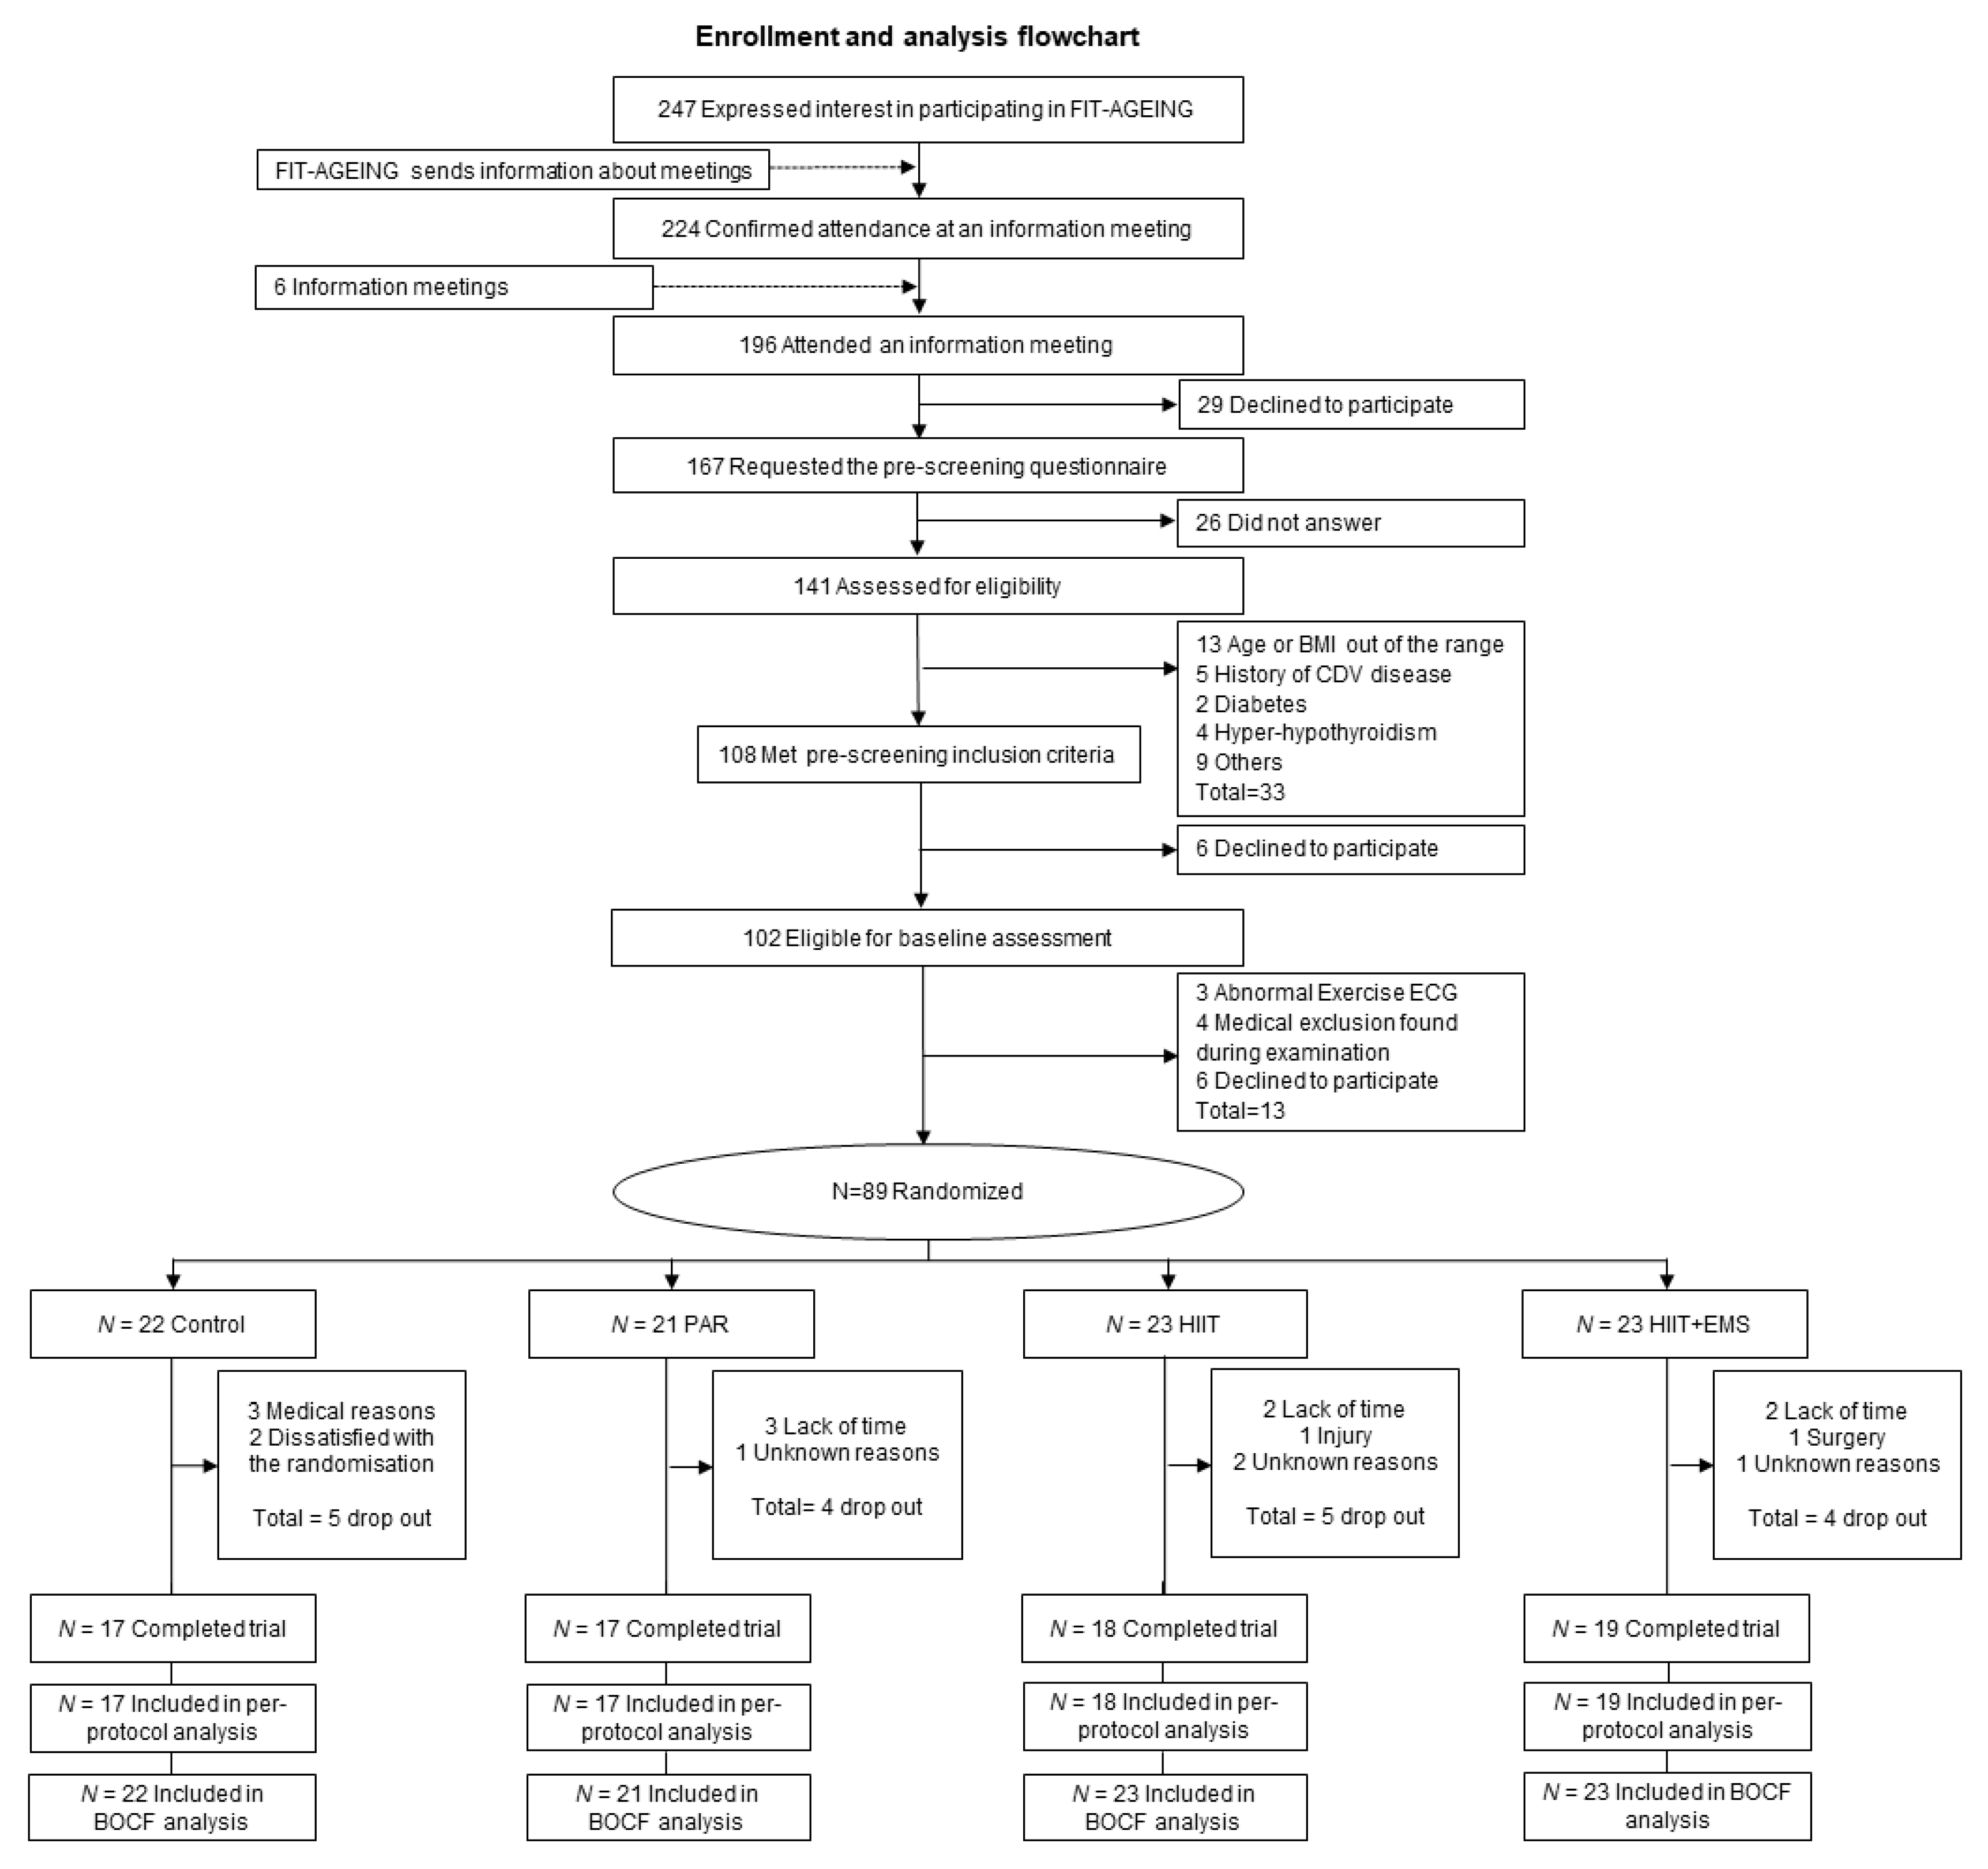
2.1. Ethics Statement and Reporting Philosophy
2.2. Study Subjects and Treatment Groups
2.3. Exercise Training
2.4. Outcomes
2.5. Statistical Analysis
3. Results
4. Discussion
5. Conclusions
Supplementary Materials
Author Contributions
Funding
Acknowledgments
Conflicts of Interest
References
- Jaacks, L.M.; Vandevijvere, S.; Pan, A.; McGowan, C.J.; Wallace, C.; Imamura, F.; Mozaffarian, D.; Swinburn, B.; Ezzati, M. The obesity transition: Stages of the global epidemic. Lancet Diabetes Endocrinol. 2019, 7, 231–340. [Google Scholar] [CrossRef]
- Go, A.S.; Mozaffarian, D.; Roger, V.L.; Benjamin, E.J.; Berry, J.D.; Blaha, M.J.; Dai, S.; Ford, E.S.; Fox, C.S.; Franco, S.; et al. Heart disease and stroke statistics—2014 update: A report from the American Heart Association. Circulation 2014, 129, e28–e292. [Google Scholar] [CrossRef] [PubMed]
- Gregg, E.W.; Cheng, Y.J.; Cadwell, B.L.; Imperatore, G.; Williams, D.E.; Flegal, K.M.; Narayan, K.M.V.; Williamson, D.F. Secular trends in cardiovascular disease risk factors according to body mass index in US adults. JAMA 2005, 293, 1868–1874. [Google Scholar] [CrossRef] [PubMed]
- Shaffer, M.L.; Chinchilli, V.M. Including multiple imputation in a sensitivity analysis for clinical trials with treatment failures. Contemp. Clin. Trials 2007, 28, 130–137. [Google Scholar] [CrossRef] [PubMed]
- Perumareddi, P. Prevention of Hypertension Related to Cardiovascular Disease. Prim. Care 2019, 46, 27–39. [Google Scholar] [CrossRef]
- McLaughlin, T.; Reaven, G.; Abbasi, F.; Lamendola, C.; Saad, M.; Waters, D.; Simon, J.; Krauss, R.M. Is there a simple way to identify insulin-resistant individuals at increased risk of cardiovascular disease? Am. J. Cardiol. 2005, 96, 399–404. [Google Scholar] [CrossRef]
- Orozco-Beltran, D.; Gil-Guillen, V.F.; Redon, J.; Martin-Moreno, J.M.; Pallares-Carratala, V.; Navarro-Perez, J.; Valls-Roca, F.; Sanchis-Domenech, C.; Fernandez-Gimenez, A.; Perez-Navarro, A.; et al. Lipid profile, cardiovascular disease and mortality in a Mediterranean high-risk population: The ESCARVAL-RISK study. PLoS ONE 2017, 12, e0186196. [Google Scholar] [CrossRef]
- Kaminsky, L.A.; Arena, R.; Ellingsen, Ø.; Harber, M.P.; Myers, J.; Ozemek, C.; Ross, R. Cardiorespiratory fitness and cardiovascular disease—The past, present, and future. Prog. Cardiovasc. Dis. 2019, 62, 86–93. [Google Scholar] [CrossRef]
- Rees, K.; Takeda, A.; Martin, N.; Ellis, L.; Wijesekara, D.; Vepa, A.; Das, A.; Hartley, L.; Stranges, S. Mediterranean-style diet for the primary and secondary prevention of cardiovascular disease. Cochrane Database Syst. Rev. 2019. [Google Scholar] [CrossRef]
- Fiuza-Luces, C.; Izquierdo, M.; Santos-Lozano, A.; Lucia, A.; Zugaza, J.L.; Carrera-Bastos, P.; Picazo, O.; Joyner, M.; Ruilope, L.M. Exercise benefits in cardiovascular disease: Beyond attenuation of traditional risk factors. Nat. Rev. Cardiol. 2018, 15, 731–743. [Google Scholar] [CrossRef]
- Piercy, K.L.; Troiano, R.P.; Ballard, R.M.; Carlson, S.A.; Fulton, J.E.; Galuska, D.A.; George, S.M.; Olson, R.D. The physical activity guidelines for Americans. JAMA J. Am. Med. Assoc. 2018, 320, 2020–2028. [Google Scholar] [CrossRef] [PubMed]
- WHO. Global Recommendations on Physical Activity for Health; WHO: Geneva, Switzerland, 2015. [Google Scholar]
- Álvarez, C.; Ramírez-Vélez, R.; Ramírez-Campillo, R.; Lucia, A.; Alonso-Martinez, A.M.; Faúndez, H.; Cadore, E.L.; Izquierdo, M. Improvements cardiometabolic risk factors in Latin American Amerindians (the Mapuche) with concurrent training. Scand. J. Med. Sci. Sports 2019. [Google Scholar] [CrossRef] [PubMed]
- Bennie, J.A.; Ding, D.; Khan, A.; Stamatakis, E.; Biddle, S.J.; Kim, J. Run, lift, or both? Associations between concurrent aerobic-muscle strengthening exercise with adverse cardiometabolic biomarkers among Korean adults. Eur. J. Prev. Cardiol. 2018. [Google Scholar] [CrossRef] [PubMed]
- Choi, J.; Lee, M.; Lee, J.-K.; Kang, D.; Choi, J.-Y. Correlates associated with participation in physical activity among adults: A systematic review of reviews and update. BMC Public Health 2017, 17, 356. [Google Scholar] [CrossRef]
- Gibala, M.J.; Little, J.P.; Macdonald, M.J.; Hawley, J.A. Physiological adaptations to low-volume, high-intensity interval training in health and disease. J. Physiol. 2012, 590, 1077–1084. [Google Scholar] [CrossRef]
- Burgomaster, K.A.; Howarth, K.R.; Phillips, S.M.; Rakobowchuk, M.; Macdonald, M.J.; McGee, S.L.; Gibala, M.J. Similar metabolic adaptations during exercise after low volume sprint interval and traditional endurance training in humans. J. Physiol. 2008, 586, 151–160. [Google Scholar] [CrossRef]
- Kemmler, W.; Kohl, M.; Freiberger, E.; Sieber, C.; Von Stengel, S. Effect of whole-body electromyostimulation and/or protein supplementation on obesity and cardiometabolic risk in older men with sarcopenic obesity: The randomized controlled FranSO trial. BMC Geriatr. 2018, 18, 70. [Google Scholar] [CrossRef]
- Amaro-Gahete, F.; De-la-O, A.; Jurado-Fasoli, L.; Dote-Montero, M.; Gutiérrez, A.; Ruiz, J.; Castillo, M. Changes in physical fitness after 12 weeks of structured concurrent exercise training, high intensity interval training, or whole-body electromyostimulation training in sedentary middle-aged adults: A randomised controlled trial. Front. Physiol. 2019, 10, 451. [Google Scholar] [CrossRef]
- Amaro-Gahete, F.J.; De-la-O, A.; Jurado-Fasoli, L.; Ruiz, J.R.; Castillo, M.J.; Gutiérrez, Á. Effects of different exercise training programs on body composition: A randomized control trial. Scand. J. Med. Sci. Sports 2019. [Google Scholar] [CrossRef]
- Amaro-Gahete, F.J.; De-la-O, A.; Jurado-Fasoli, L.; Espuch-Oliver, A.; Robles-Gonzalez, L.; Navarro-Lomas, G.; de Haro, T.; Femia, P.; Castillo, M.J.; Gutierrez, A. Exercise training as S-Klotho protein stimulator in sedentary healthy adults: Rationale, design, and methodology. Contemp. Clin. Trials Commun. 2018, 11, 10–19. [Google Scholar] [CrossRef]
- Schulz, K.F.; Altman, D.G.; Moher, D.; Jüni, P.; Altman, D.; Egger, M.; Chan, A.; Altman, D.; Glasziou, P.; Meats, E.; et al. CONSORT 2010 Statement: Updated guidelines for reporting parallel group randomised trials. BMC Med. 2010, 8, 18. [Google Scholar] [CrossRef] [PubMed]
- Schulz, K.F.; Grimes, D.A. Generation of allocation sequences in randomised trials: Chance, not choice. Lancet 2002, 359, 515–519. [Google Scholar] [CrossRef]
- Buchheit, M.; Laursen, P.B. High-intensity interval training, solutions to the programming puzzle: Part II: Anaerobic energy, neuromuscular load and practical applications. Sports Med. 2013, 43, 927–954. [Google Scholar] [CrossRef] [PubMed]
- Buchheit, M.; Laursen, P.B. High-intensity interval training, solutions to the programming puzzle: Part I: Cardiopulmonary emphasis. Sports Med. 2013, 43, 313–338. [Google Scholar] [CrossRef]
- Borg, G.A. Psychophysical bases of perceived exertion. Med. Sci. Sports Exerc. 1982, 14, 377–381. [Google Scholar] [CrossRef]
- Stöllberger, C.; Finsterer, J. Side effects of whole-body electro-myo-stimulation. Wien. Med. Wochenschr. 2019, 169, 173–180. [Google Scholar] [CrossRef]
- Amaro-Gahete, F.J.; De-la-O, A.; Jurado-Fasoli, L.; Espuch-Oliver, A.; de Haro, T.; Gutierrez, A.; Ruiz, J.R.; Castillo, M.J. Exercise training increases the S-Klotho plasma levels in sedentary middle-aged adults: A randomised controlled trial. The FIT-AGEING study. J. Sports Sci. 2019, 37, 2175–2183. [Google Scholar] [CrossRef]
- Whelton, P.K.; Williams, B. The 2018 European Society of Cardiology/European Society of Hypertension and 2017 American College of Cardiology/American Heart Association Blood Pressure Guidelines. JAMA 2018, 320, 1749. [Google Scholar] [CrossRef]
- Carracher, A.M.; Marathe, P.H.; Close, K.L. International Diabetes Federation 2017. J. Diabetes 2018, 10, 353–356. [Google Scholar] [CrossRef]
- Bedogni, G.; Bellentani, S.; Miglioli, L.; Masutti, F.; Passalacqua, M.; Castiglione, A.; Tiribelli, C. The Fatty Liver Index: A simple and accurate predictor of hepatic steatosis in the general population. BMC Gastroenterol. 2006, 6, 33. [Google Scholar] [CrossRef]
- Katz, A.; Nambi, S.S.; Mather, K.; Baron, A.D.; Follmann, D.A.; Sullivan, G.; Quon, M.J. Quantitative insulin sensitivity check index: A simple, accurate method for assessing insulin sensitivity in humans. J. Clin. Endocrinol. Metab. 2000, 85, 2402–2410. [Google Scholar] [CrossRef] [PubMed]
- Ascaso, J.F.; Romero, P.; Real, J.T.; Priego, A.; Valdecabres, C.; Carmena, R. Insulin resistance quantification by fasting insulin plasma values and HOMA index in a non-diabetic population. Med. Clin. 2001, 117, 530–533. [Google Scholar] [CrossRef]
- Balke, B.; Ware, R. An experimental study of physical fitness of Air Force personnel. U. S. Armed Forces Med. J. 1959, 10, 675–688. [Google Scholar] [PubMed]
- Midgley, A.W.; McNaughton, L.R.; Polman, R.; Marchant, D. Criteria for determination of maximal oxygen uptake: A brief critique and recommendations for future research. Sports Med. 2007, 37, 1019–1028. [Google Scholar] [CrossRef] [PubMed]
- Cornelissen, V.A.; Fagard, R.H.; Coeckelberghs, E.; Vanhees, L. Impact of Resistance Training on Blood Pressure and Other Cardiovascular Risk Factors. Hypertension 2011, 58, 950–958. [Google Scholar] [CrossRef] [PubMed]
- Greene, N.P.; Martin, S.E.; Crouse, S.F. Acute Exercise and Training Alter Blood Lipid and Lipoprotein Profiles Differently in Overweight and Obese Men and Women. Obesity 2012, 20, 1618–1627. [Google Scholar] [CrossRef]
- Kelley, G.A.; Kelley, K.S. Impact of progressive resistance training on lipids and lipoproteins in adults: A meta-analysis of randomized controlled trials. Prev. Med. 2009, 48, 9–19. [Google Scholar] [CrossRef]
- Mann, S.; Beedie, C.; Jimenez, A. Differential effects of aerobic exercise, resistance training and combined exercise modalities on cholesterol and the lipid profile: Review, synthesis and recommendations. Sports Med. 2014, 44, 211–221. [Google Scholar] [CrossRef]
- Umpierre, D.; Ribeiro, P.A.B.; Kramer, C.K.; Leitão, C.B.; Zucatti, A.T.N.; Azevedo, M.J.; Gross, J.L.; Ribeiro, J.P.; Schaan, B.D. Physical activity advice only or structured exercise training and association with HbA1c levels in type 2 diabetes: A systematic review and meta-analysis. JAMA 2011, 305, 1790–1799. [Google Scholar] [CrossRef]
- Ciolac, E.G.; Bocchi, E.A.; Bortolotto, L.A.; Carvalho, V.O.; Greve, J.M.; Guimarães, G.V. Effects of high-intensity aerobic interval training vs. moderate exercise on hemodynamic, metabolic and neuro-humoral abnormalities of young normotensive women at high familial risk for hypertension. Hypertens. Res. 2010, 33, 836–843. [Google Scholar] [CrossRef]
- Tjønna, A.E.; Lee, S.J.; Rognmo, Ø.; Stølen, T.O.; Bye, A.; Haram, P.M.; Loennechen, J.P.; Al-Share, Q.Y.; Skogvoll, E.; Slørdahl, S.A.; et al. Aerobic interval training versus continuous moderate exercise as a treatment for the metabolic syndrome: A pilot study. Circulation 2008, 118, 346–354. [Google Scholar] [CrossRef] [PubMed]
- Batacan, R.B.; Duncan, M.J.; Dalbo, V.J.; Tucker, P.S.; Fenning, A.S. Effects of high-intensity interval training on cardiometabolic health: A systematic review and meta-analysis of intervention studies. Br. J. Sports Med. 2017, 51, 494–503. [Google Scholar] [CrossRef] [PubMed]
- Fraser, B.J.; Huynh, Q.L.; Schmidt, M.D.; Dwyer, T.; Venn, A.J.; Magnussen, C.G. Childhood Muscular Fitness Phenotypes and Adult Metabolic Syndrome. Med. Sci. Sports Exerc. 2016, 48, 1715–1722. [Google Scholar] [CrossRef] [PubMed]
- Ramírez-Vélez, R.; Carrillo, H.A.; Correa-Bautista, J.E.; Schmidt-RioValle, J.; González-Jiménez, E.; Correa-Rodríguez, M.; González-Ruíz, K.; García-Hermoso, A. Fat-to-Muscle Ratio: A New Anthropometric Indicator as a Screening Tool for Metabolic Syndrome in Young Colombian People. Nutrients 2018, 10, 1027. [Google Scholar] [CrossRef] [PubMed]
- Chung, H.S.; Choi, K.M. Adipokines and Myokines: A Pivotal Role in Metabolic and Cardiovascular Disorders. Curr. Med. Chem. 2018, 25, 2401–2415. [Google Scholar] [CrossRef] [PubMed]
- Larose, J.; Sigal, R.J.; Khandwala, F.; Prud’homme, D.; Boulé, N.G.; Kenny, G.P. Diabetes Aerobic and Resistance Exercise (DARE) trial investigators Associations between physical fitness and HbA₁(c) in type 2 diabetes mellitus. Diabetologia 2011, 54, 93–102. [Google Scholar] [CrossRef]
- Sénéchal, M.; Swift, D.L.; Johannsen, N.M.; Blair, S.N.; Earnest, C.P.; Lavie, C.J.; Church, T.S. Changes in body fat distribution and fitness are associated with changes in hemoglobin A1c after 9 months of exercise training: Results from the HART-D study. Diabetes Care 2013, 36, 2843–2849. [Google Scholar] [CrossRef][Green Version]
- Balducci, S.; Zanuso, S.; Cardelli, P.; Salvi, L.; Mazzitelli, G.; Bazuro, A.; Iacobini, C.; Nicolucci, A.; Pugliese, G. Italian Diabetes Exercise Study (IDES) Investigators Changes in physical fitness predict improvements in modifiable cardiovascular risk factors independently of body weight loss in subjects with type 2 diabetes participating in the Italian Diabetes and Exercise Study (IDES). Diabetes Care 2012, 35, 1347–1354. [Google Scholar]
- Pandey, A.; Swift, D.L.; McGuire, D.K.; Ayers, C.R.; Neeland, I.J.; Blair, S.N.; Johannsen, N.; Earnest, C.P.; Berry, J.D.; Church, T.S. Metabolic Effects of Exercise Training Among Fitness-Nonresponsive Patients With Type 2 Diabetes: The HART-D Study. Diabetes Care 2015, 38, 1494–1501. [Google Scholar] [CrossRef]
- Brennan, A.M.; Lam, M.; Stotz, P.; Hudson, R.; Ross, R. Exercise-induced improvement in insulin sensitivity is not mediated by change in cardiorespiratory fitness. Diabetes Care 2014, 37, e95–e97. [Google Scholar] [CrossRef][Green Version]
- Wilmot, E.G.; Edwardson, C.L.; Achana, F.A.; Davies, M.J.; Gorely, T.; Gray, L.J.; Khunti, K.; Yates, T.; Biddle, S.J.H. Sedentary time in adults and the association with diabetes, cardiovascular disease and death: Systematic review and meta-analysis. Diabetologia 2012, 55, 2895–2905. [Google Scholar] [CrossRef] [PubMed]
- Kokkinos, P.; Myers, J. Exercise and physical activity: Clinical outcomes and applications. Circulation 2010, 122, 1637–1648. [Google Scholar] [CrossRef] [PubMed]


| All (n = 71) | Control (n = 17) | PAR (n = 17) | HIIT (n = 18) | HIIT + EMS (n = 19) | p Value | |
|---|---|---|---|---|---|---|
| Age (years) | 53.42 (4.91) | 52.09 (4.05) | 54.92 (4.54) | 53.14 (5.59) | 53.53 (5.25) | 0.414 |
| Sex (%) | ||||||
| Men | 34 (47.9) | 7 (41.2) | 8 (47.1) | 9 (50.0) | 10 (52.6) | |
| Women | 37 (52.1) | 10 (58.8) | 9 (52.9) | 9 (50.0) | 9 (47.4) | |
| Anthropometry and Body Composition | ||||||
| Body mass index (kg/m2) | 26.82 (3.79) | 26.67 (3.71) | 25.41 (2.86) | 26.43 (3.15) | 28.60 (4.64) | 0.077 |
| Waist circumference (cm) | 95.29 (11.89) | 93.35 (10.37) | 90.43 (11.01) | 97.53 (10.88) | 99.26 (13.69) | 0.107 |
| Fat mass (kg) | 30.15 (8.39) | 28.64 (6.84) | 26.83 (6.31) | 31.42 (8.30) | 33.27 (10.36) | 0.097 |
| Fat mass (%) | 39.75 (8.78) | 39.39 (9.30) | 37.38 (8.78) | 40.74 (8.56) | 41.26 (8.75) | 0.570 |
| Visceral adipose tissue (g) | 788.9 (391.8) | 710.6 (272.4) | 661.3 (262.6) | 813.6 (452.2) | 949.8 (477.1) | 0.122 |
| Lean mass (kg) | 43.92 (11.59) | 42.92 (12.06) | 43.60 (10.77) | 44.43 (13.52) | 44.60 (10.76) | 0.972 |
| Blood Pressure | ||||||
| Systolic blood pressure (mm Hg) | 127.09 (15.78) | 127.00 (18.45) | 128.88 (13.36) | 126.72 (16.68) | 125.88 (15.49) | 0.959 |
| Diastolic blood pressure (mm Hg) | 81.12 (11.72) | 82.38 (14.54) | 81.75 (10.96) | 80.50 (11.39) | 80.0 (10.70) | 0.936 |
| Mean blood pressure (mm Hg) | 104.10 (13.15) | 104.69 (16.00) | 105.31 (11.36) | 103.61 (13.78) | 102.94 (12.13) | 0.957 |
| Glucose Metabolism | ||||||
| Plasma glucose (mg/dL) | 93.56 (11.36) | 93.47 (10.82) | 93.35 (11.63) | 90.06 (5.56) | 96.95 (14.80) | 0.352 |
| Plasma insulin (UI/mL) | 8.08 (5.68) | 7.26 (5.05) | 7.52 (3.97) | 7.09 (4.51) | 10.22 (7.88) | 0.296 |
| Insulin glucose ratio | 12.58 (7.56) | 11.22 (6.73) | 12.02 (6.23) | 11.82 (7.05) | 14.98 (9.57) | 0.442 |
| QUICKI | 0.362 (0.036) | 0.366 (0.035) | 0.361 (0.032) | 0.370 (0.037) | 0.350 (0.040) | 0.402 |
| HOMA | 1.93 (1.67) | 1.73 (1.37) | 1.75 (0.99) | 1.59 (1.05) | 2.59 (2.55) | 0.255 |
| Lipid Metabolism | ||||||
| Total cholesterol (mg/dL) | 206.14 (32.17) | 201.47 (33.98) | 204.11 (17.73) | 214.06 (43.34) | 206.05 (28.87) | 0.696 |
| HDL-C (mg/dL) | 58.71 (12.28) | 61.06 (11.99) | 55.18 (12.03) | 57.82 (10.79) | 60.58 (14.03) | 0.473 |
| LDL-C (mg/dL) | 126.23 (27.07) | 123.82 (28.00) | 121.53 (19.74) | 131.24 (35.93) | 128.11 (23.77) | 0.733 |
| Triglycerides (mg/dL) | 134.24 (68.16) | 145.18 (81.62) | 130.88 (70.00) | 134.06 (61.48) | 127.63 (63.27) | 0.888 |
| LDL-C/HDL-C | 2.31 (0.90) | 2.20 (1.01) | 2.33 (0.70) | 2.45 (1.12) | 2.27 (0.79) | 0.870 |
| Triglycerides/HDL-C | 2.57 (1.92) | 2.68 (2.08) | 2.67 (2.02) | 2.58 (1.77) | 2.37 (1.93) | 0.961 |
| Cardiometabolic Risk Score | −0.0002 (0.3414) | −0.0448 (0.3249) | −0.0254 (0.2822) | 0.0039 (0.4164) | 0.0615 (0.3460) | 0.828 |
| Liver Function | ||||||
| ALT (IU/L) | 23.14 (12.53) | 24.41 (14.51) | 22.18 (10.06) | 20.71 (9.74) | 25.05 (15.13) | 0.724 |
| γ-GT (IU/L) | 33.99 (23.26) | 36.76 (27.56) | 30.47 (18.12) | 28.29 (17.01) | 39.74 (27.64) | 0.429 |
| Fatty liver index | 50.12 (26.55) | 49.04 (29.04) | 39.74 (23.43) | 50.46 (24.87) | 60.06 (26.59) | 0.151 |
| Dietary Intake | ||||||
| Energy (kcal/day) | 2141 (699) | 2079 (495) | 2288 (1152) | 2149 (514) | 2054 (455) | 0.767 |
| Fat (g/day) | 37.55 (6.90) | 37.09 (9.20) | 37.31 (8.03) | 36.32 (5.93) | 39.32 (4.08) | 0.601 |
| Carbohydrate (g/day) | 47.14 (8.19) | 49.82 (10.41) | 47.85 (8.45) | 47.17 (6.00) | 44.21 (7.30) | 0.236 |
| Protein (g/day) | 18.64 (4.91) | 16.94 (4.35) | 19.23 (6.84) | 19.36 (4.90) | 18.84 (2.97) | 0.467 |
| Ethanol (g/day) | 10.57 (11.69) | 9.43 (10.12) | 9.70 (10.73) | 10.64 (9.25) | 12.23 (15.84) | 0.894 |
| Cardiorespiratory Fitness | ||||||
| VO2max (mL/min) | 2339.2 (657.2) | 2163.4 (626.0) | 2320.4 (649.7) | 2461.8 (709.1) | 2397.1 (658.3) | 0.580 |
| VO2maxweight (mL/kg/min) | 30.49 (5.57) | 28.99 (4.96) | 31.64 (6.12) | 31.59 (6.22) | 29.74 (4.90) | 0.399 |
| Change from Baseline at Week 12 | Intervention | F | p Value | η2 | |||||||||||
|---|---|---|---|---|---|---|---|---|---|---|---|---|---|---|---|
| Control (n = 17) | PAR (n = 17) | HIIT (n = 18) | HIIT+EMS (n = 19) | ||||||||||||
| Pre | Post | Δ | Pre | Post | Δ | Pre | Post | Δ | Pre | Post | Δ | ||||
| Anthropometry | |||||||||||||||
| Body mass index (kg/m2) | 26.39 (3.80) | 26.21 (3.65) | −0.18 (0.34) | 25.41 (2.86) | 24.90 (2.43) | −0.51 (0.66) | 26.43 (3.15) | 26.37 (2.96) | −0.06 (0.53) | 28.60 (4.64) | 28.40 (4.64) | −0.20 (0.42) | 3.993 | 0.011 | 0.160 |
| Waist circumference (cm) | 92.46 (10.81) | 92.30 (11.63) | −0.16 (2.12) | 90.43 (11.01) | 88.54 (10.23) | −1.90 (3.45) | 97.53 (10.88) | 93.00 (11.11) | −4.53 (2.54) | 99.26 (13.69) | 95.26 (13.79) | −4.00 (2.38) | 7.749 | 0.011 | 0.270 |
| Blood pressure | |||||||||||||||
| Systolic blood pressure (mm Hg) | 129.85 (15.17) | 130.23 (15.50) | 0.38 (2.47) | 128.88 (13.36) | 125.38 (11.78) | −3.5 (2.19) | 126.72 (16.68) | 124.67 (15.4) | −2.06 (2.1) | 125.88 (15.49) | 119.41 (13.24) | −6.47 (3.34) | 8.651 | <0.001 | 0.593 |
| Diastolic blood pressure (mm Hg) | 84.92 (9.45) | 86.00 (10.44) | 1.08 (2.63) | 81.75 (10.96) | 80.19 (9.81) | −1.56 (1.90) | 80.50 (11.39) | 79.33 (10.63) | −1.17 (1.92) | 80.00 (10.70) | 75.65 (8.46) | −4.35 (3.20) | 7.840 | 0.001 | 0.476 |
| Mean blood pressure (mm Hg) | 107.39 (11.63) | 108.12 (12.28) | 0.73 (2.41) | 105.31 (11.36) | 102.78 (9.96) | −2.53 (1.82) | 103.61 (13.78) | 102.00 (12.73) | −1.61 (1.81) | 102.94 (12.13) | 97.53 (9.77) | −5.41 (3.14) | 27.422 | 0.001 | 0.582 |
| Glucose metabolism | |||||||||||||||
| Plasma glucose (mg/dL) | 94.87 (10.74) | 93.73 (7.78) | −1.13 (7.75) | 93.35 (11.63) | 91.29 (9.42) | −2.06 (8.12) | 89.75 (5.59) | 90.31 (8.55) | 0.56 (5.89) | 96.95 (14.80) | 92.89 (11.88) | −4.05 (6.28) | 0.568 | 0.638 | 0.027 |
| Plasma insulin (UI/mL) | 7.03 (5.28) | 8.96 (6.90) | 1.93 (2.63) | 7.52 (3.97) | 6.15 (2.65) | −1.37 (3.01) | 7.39 (4.48) | 5.84 (3.03) | −1.55 (2.66) | 10.22 (7.88) | 8.34 (6.55) | −1.88 (2.05) | 7.357 | <0.001 | 0.263 |
| Insulin glucose ratio | 10.48 (6.70) | 14.17 (9.61) | 3.69 (4.86) | 12.02 (6.23) | 10.04 (3.70) | −1.99 (5.14) | 12.26 (7.03) | 9.66 (4.69) | −2.59 (4.47) | 14.98 (9.57) | 13.12 (8.85) | −1.87 (3.11) | 6.474 | 0.001 | 0.239 |
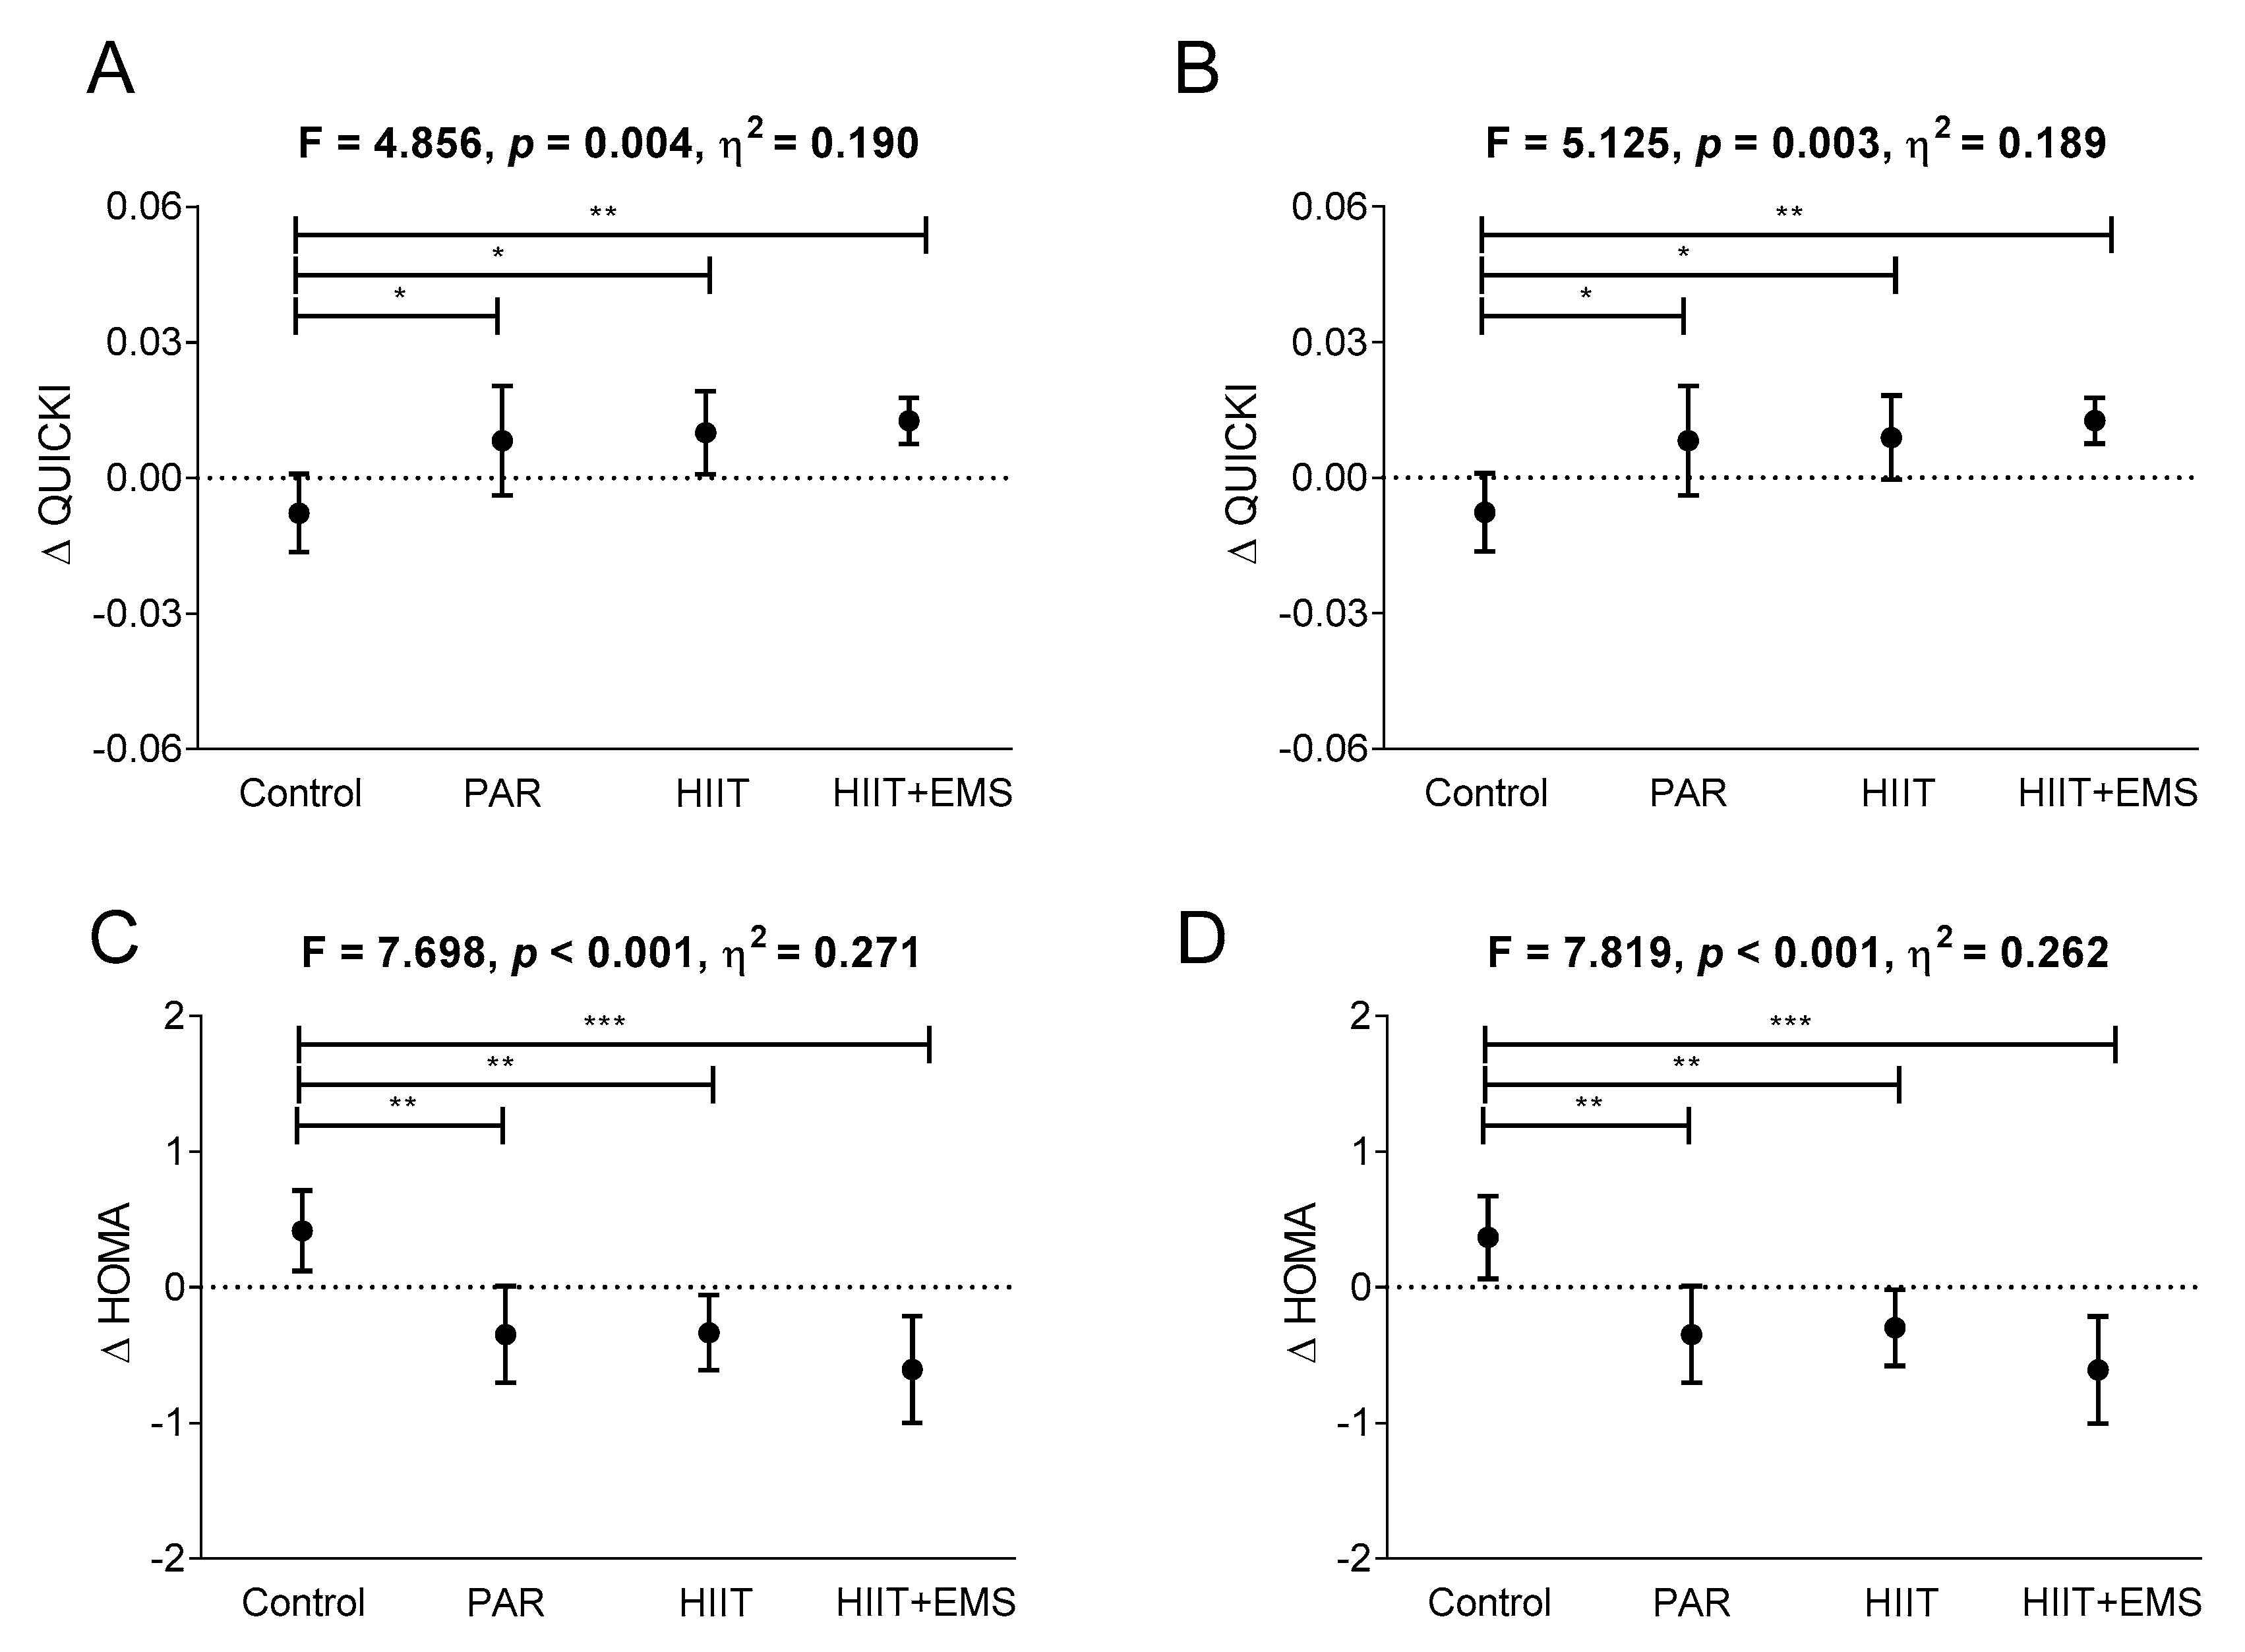
| QUICKI | 0.37 (0.04) | 0.36 (0.04) | −0.01 (0.02) | 0.36 (0.03) | 0.37 (0.03) | 0.01 (0.02) | 0.37 (0.03) | 0.38 (0.03) | 0.01 (0.02) | 0.35 (0.04) | 0.36 (0.04) | 0.01 (0.01) | 4.856 | 0.004 | 0.190 |
| HOMA | 1.71 (1.45) | 2.13 (1.74) | 0.42 (0.62) | 1.75 (0.99) | 1.40 (0.69) | −0.35 (0.69) | 1.65 (1.05) | 1.32 (0.72) | −0.33 (0.59) | 2.59 (2.55) | 1.98 (1.83) | −0.61 (0.82) | 7.696 | <0.001 | 0.271 |
| Lipid metabolism | |||||||||||||||
| Total cholesterol (mg/dL) | 200.53 (36.13) | 206.67 (30.83) | 6.13 (38.33) | 204.12 (17.73) | 203.12 (21.30) | −1.00 (19.49) | 217.56 (42.2) | 214.44 (38.76) | −3.13 (36.54) | 206.05 (28.87) | 190.74 (27.60) | −15.32 (12.17) | 2.230 | 0.093 | 0.097 |
| HDL-C (mg/dL) | 61.20 (12.12) | 60.53 (10.76) | −0.67 (11.88) | 55.18 (12.03) | 59.88 (15.59) | 4.71 (10.95) | 57.69 (11.13) | 62.81 (17.03) | 5.13 (12.93) | 60.58 (14.03) | 62.79 (18.03) | 2.21 (12.82) | 0.536 | 0.660 | 0.032 |
| LDL-C (mg/dL) | 124.53 (29.54) | 128.13 (31.65) | 3.60 (35.82) | 121.53 (19.74) | 125.76 (22.76) | 4.24 (21.14) | 133.38 (35.97) | 137.94 (38.26) | 4.56 (28.84) | 128.11 (23.77) | 110.05 (27.72) | −18.05 (18.88) | 3.562 | 0.019 | 0.147 |
| Triglycerides (mg/dL) | 131.20 (72.33) | 134.47 (108.83) | 3.27 (57.84) | 130.88 (70.00) | 104.18 (55.83) | −26.71 (60.07) | 135.94 (62.99) | 120.50 (71.99) | −15.44 (60.42) | 127.63 (63.27) | 97.21 (49.54) | −30.42 (41.10) | 3.869 | 0.013 | 0.158 |
| LDL-C/HDL-C | 2.21 (1.05) | 2.19 (0.71) | −0.01 (1.13) | 2.33 (0.70) | 2.19 (0.52) | −0.14 (0.57) | 2.50 (1.14) | 2.40 (1.06) | −0.10 (0.75) | 2.27 (0.79) | 1.95 (0.87) | −0.33 (0.55) | 0.920 | 0.436 | 0.043 |
| Triglycerides/HDL-C | 2.44 (1.97) | 2.41 (2.30) | −0.03 (1.38) | 2.67 (2.02) | 1.91 (1.38) | −0.76 (1.55) | 2.63 (1.82) | 2.24 (1.78) | −0.39 (1.38) | 2.37 (1.93) | 1.84 (1.51) | −0.53 (1.09) | 0.929 | 0.432 | 0.043 |
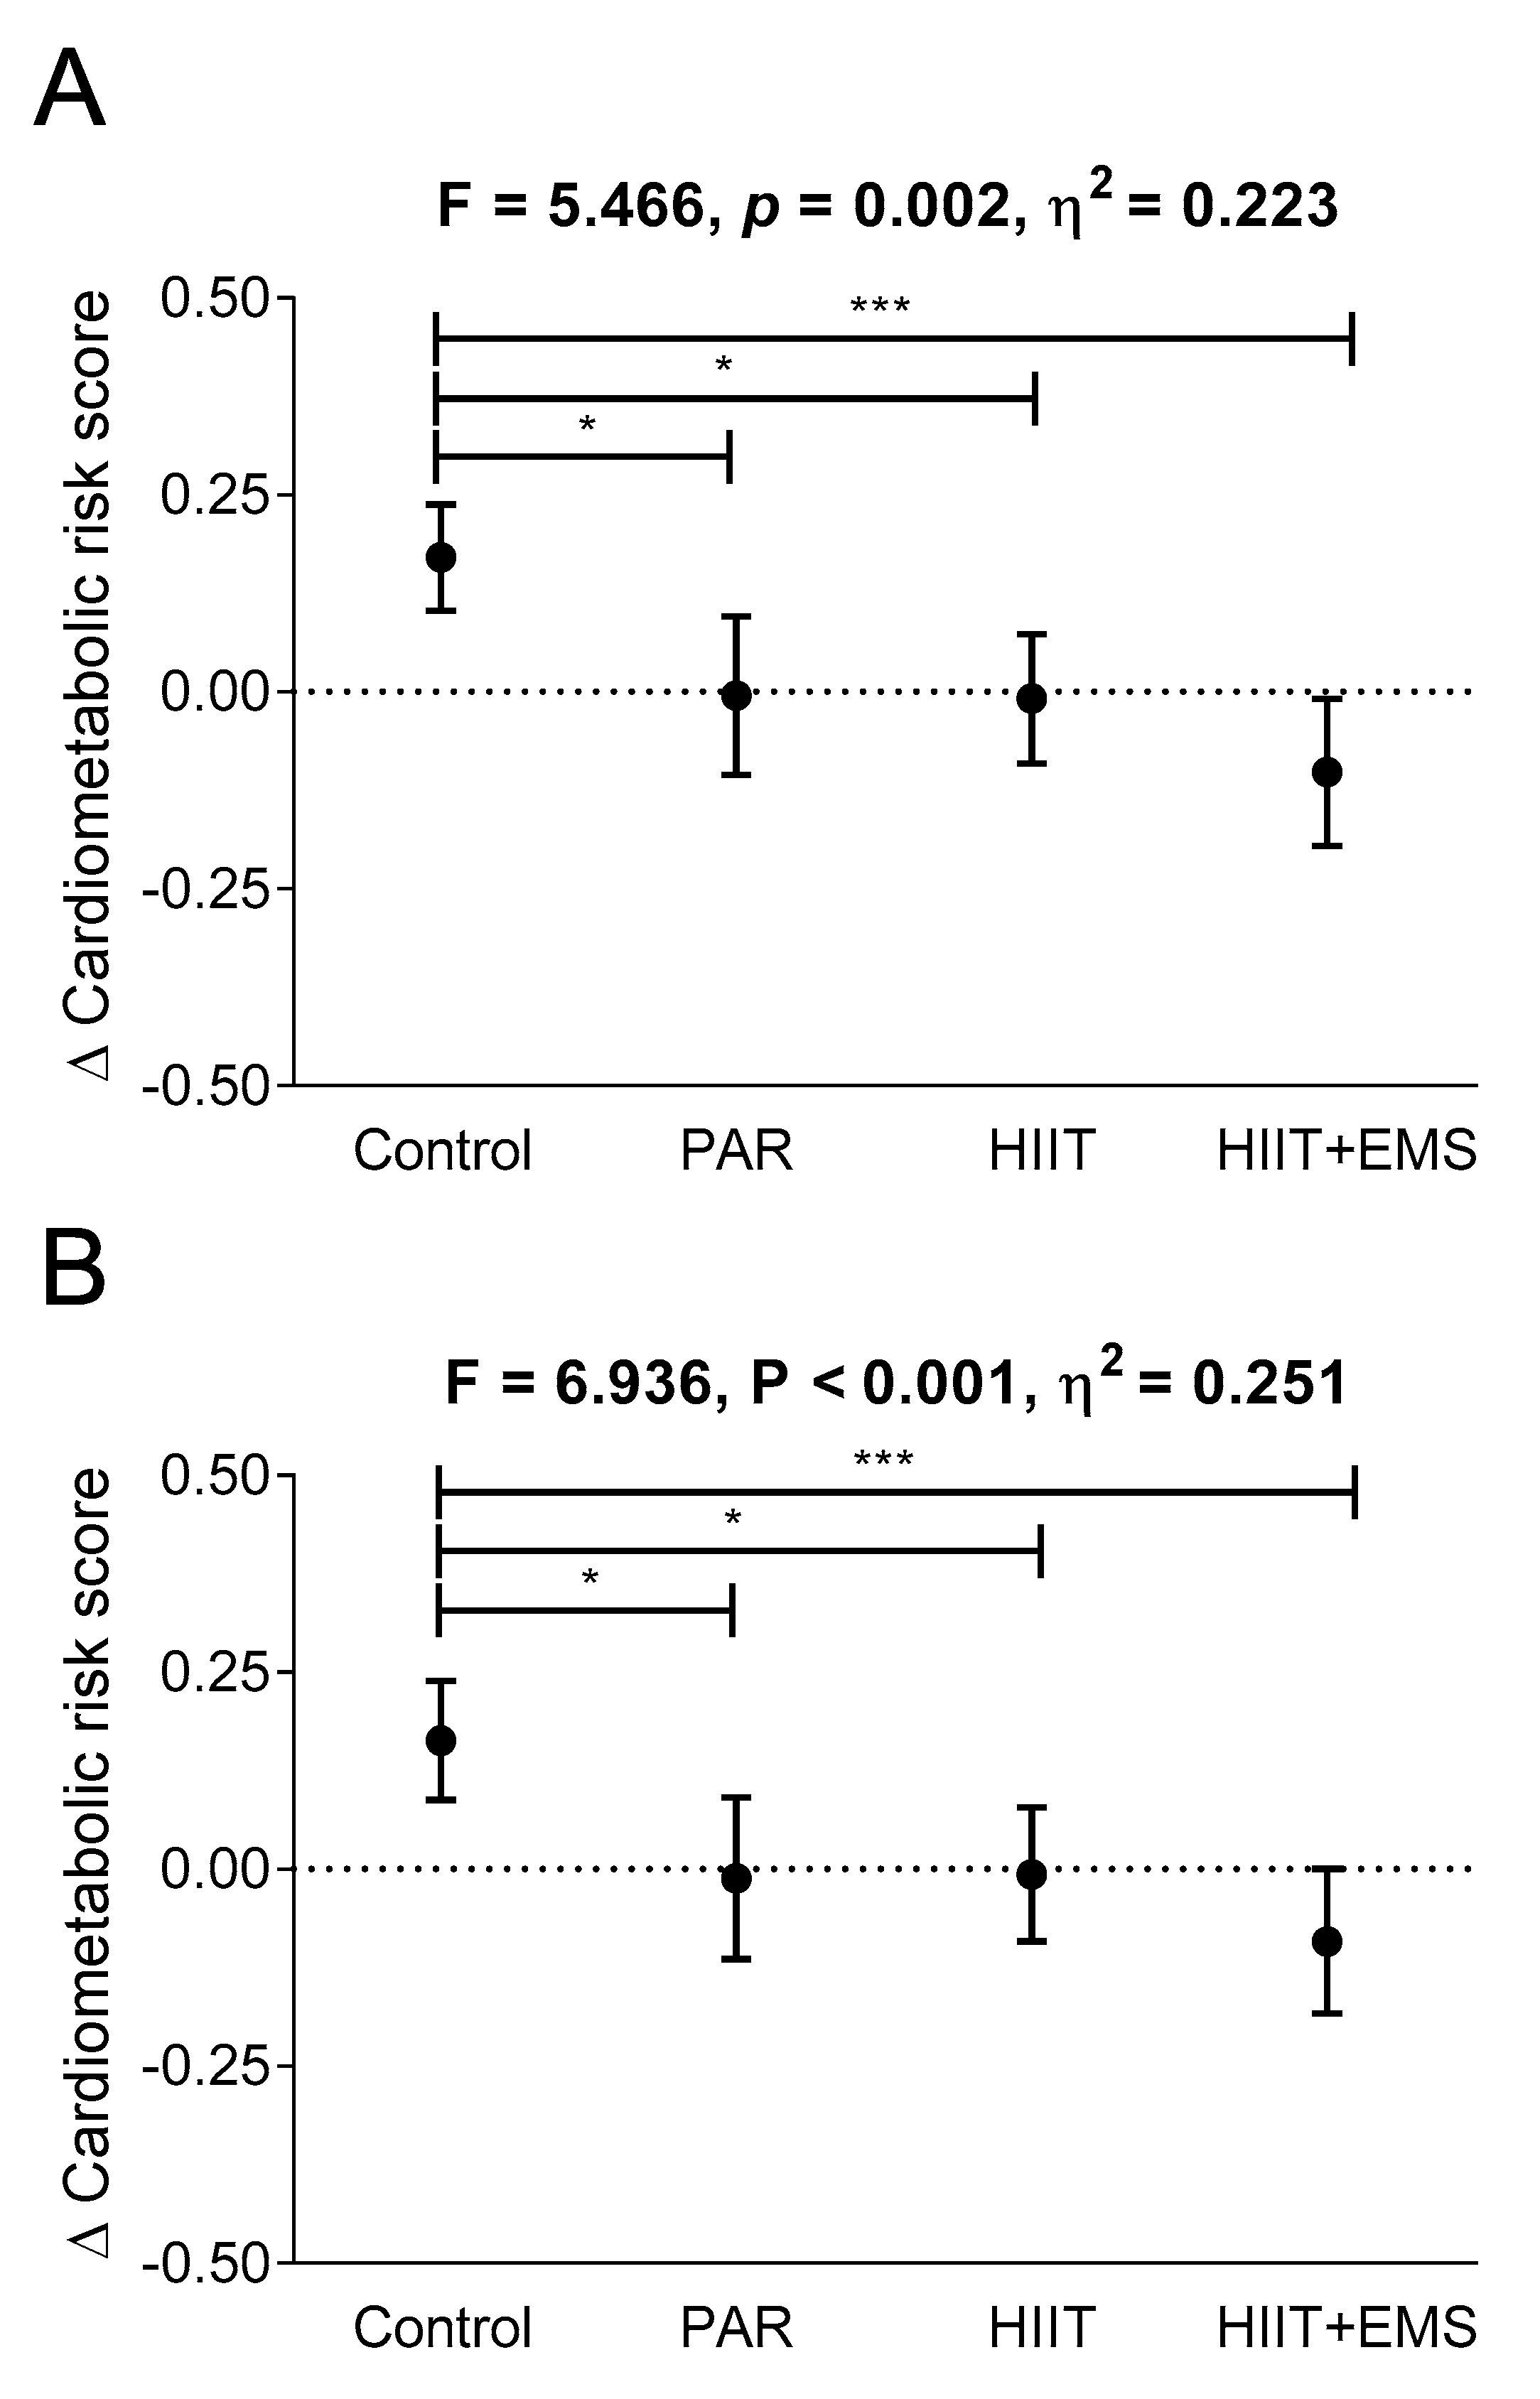
| Cardiometabolic risk score | −0.04 (0.32) | 0.13 (0.29) | 0.17 (0.14) | −0.03 (0.28) | −0.03 (0.24) | 0.01 (0.20) | 0.01 (0.43) | 0.00 (0.39) | −0.01 (0.18) | 0.06 (0.35) | −0.04 (0.32) | −0.10 (0.20) | 5.466 | 0.002 | 0.226 |
| Liver function | |||||||||||||||
| ALT (IU/L) | 24.60 (15.38) | 25.07 (14.84) | 0.47 (7.85) | 22.18 (10.06) | 21.65 (8.99) | −0.53 (6.76) | 20.06 (9.68) | 23.31 (13.02) | 3.25 (7.02) | 25.05 (15.13) | 25.84 (12.69) | 0.79 (8.72) | 0.594 | 0.621 | 0.028 |
| γ-GT (IU/L) | 39.07 (28.64) | 36.87 (30.05) | −2.20 (5.87) | 30.47 (18.12) | 27.65 (13.84) | −2.82 (7.88) | 28.38 (17.56) | 28.63 (16.18) | 0.25 (5.16) | 39.74 (27.64) | 39.21 (26.06) | −0.53 (10.17) | 0.680 | 0.568 | 0.032 |
| Fatty liver index | 45.70 (29.62) | 42.48 (30.16) | −3.22 (7.13) | 39.74 (23.44) | 30.89 (15.94) | −8.85 (12.99) | 49.32 (25.22) | 41.60 (23.74) | −7.72 (9.04) | 60.06 (26.6) | 49.83 (29.91) | −10.24 (10.51) | 1.167 | 0.330 | 0.054 |
| Δ Cardiometabolic Risk Score | Δ QUICKI Index | Δ HOMA Index | ||||
|---|---|---|---|---|---|---|
| Rs | p Value | Rs | p Value | Rs | p Value | |
| Δ Fat mass (%) | 0.258 | 0.083 | −0.043 | 0.769 | 0.155 | 0.287 |
| Δ Visceral adipose tissue (g) | 0.227 | 0.130 | −0.010 | 0.944 | 0.200 | 0.167 |
| Δ Lean mass (kg) | −0.291 | 0.045 | 0.071 | 0.629 | −0.173 | 0.235 |
| Δ VO2max (mL/kg/min) | −0.108 | 0.461 | −0.125 | 0.376 | 0.085 | 0.548 |
| Δ Energy intake (kcal/day) | −0.018 | 0.902 | −0.072 | 0.615 | −0.027 | 0.852 |
| Δ Fat (g/day) | −0.032 | 0.829 | 0.168 | 0.244 | −0.101 | 0.485 |
| Δ Carbohydrate (g/day) | 0.054 | 0.719 | 0.082 | 0.572 | −0.040 | 0.781 |
| Δ Protein (g/day) | −0.206 | 0.164 | −0.167 | 0.245 | 0.076 | 0.599 |
| Δ Ethanol (g/day) | 0.087 | 0.561 | 0.029 | 0.843 | 0.015 | 0.919 |
© 2019 by the authors. Licensee MDPI, Basel, Switzerland. This article is an open access article distributed under the terms and conditions of the Creative Commons Attribution (CC BY) license (http://creativecommons.org/licenses/by/4.0/).
Share and Cite
Amaro-Gahete, F.J.; De-la-O, A.; Jurado-Fasoli, L.; Martinez-Tellez, B.; R. Ruiz, J.; Castillo, M.J. Exercise Training as a Treatment for Cardiometabolic Risk in Sedentary Adults: Are Physical Activity Guidelines the Best Way to Improve Cardiometabolic Health? The FIT-AGEING Randomized Controlled Trial. J. Clin. Med. 2019, 8, 2097. https://doi.org/10.3390/jcm8122097
Amaro-Gahete FJ, De-la-O A, Jurado-Fasoli L, Martinez-Tellez B, R. Ruiz J, Castillo MJ. Exercise Training as a Treatment for Cardiometabolic Risk in Sedentary Adults: Are Physical Activity Guidelines the Best Way to Improve Cardiometabolic Health? The FIT-AGEING Randomized Controlled Trial. Journal of Clinical Medicine. 2019; 8(12):2097. https://doi.org/10.3390/jcm8122097
Chicago/Turabian StyleAmaro-Gahete, Francisco J., Alejandro De-la-O, Lucas Jurado-Fasoli, Borja Martinez-Tellez, Jonatan R. Ruiz, and Manuel J. Castillo. 2019. "Exercise Training as a Treatment for Cardiometabolic Risk in Sedentary Adults: Are Physical Activity Guidelines the Best Way to Improve Cardiometabolic Health? The FIT-AGEING Randomized Controlled Trial" Journal of Clinical Medicine 8, no. 12: 2097. https://doi.org/10.3390/jcm8122097
APA StyleAmaro-Gahete, F. J., De-la-O, A., Jurado-Fasoli, L., Martinez-Tellez, B., R. Ruiz, J., & Castillo, M. J. (2019). Exercise Training as a Treatment for Cardiometabolic Risk in Sedentary Adults: Are Physical Activity Guidelines the Best Way to Improve Cardiometabolic Health? The FIT-AGEING Randomized Controlled Trial. Journal of Clinical Medicine, 8(12), 2097. https://doi.org/10.3390/jcm8122097