Plasma Levels of Retinol Binding Protein 4 Relate to Large VLDL and Small LDL Particles in Subjects with and without Type 2 Diabetes


Abstract
1. Introduction
2. Experimental Section
2.1. Subjects
2.2. Laboratory Analysis
2.3. Statistical Analysis
3. Results
4. Discussion
5. Conclusions
Author Contributions
Funding
Acknowledgments
Conflicts of Interest
Abbreviations
References
- Sullivan, P.W.; Morrato, E.H.; Ghushchyan, V.; Wyatt, H.R.; Hill, J.O. Obesity, inactivity, and the prevalence of diabetes and diabetes-related cardiovascular comorbidities in the, U.S.; 2000–2002. Diabetes Care 2005, 28, 1599–1603. [Google Scholar] [CrossRef] [PubMed]
- Kendall, D.M.; Harmel, A.P. The metabolic syndrome, type 2 diabetes, and cardiovascular disease: Understanding the role of insulin resistance. Am. J. Manag. Care 2002, 8, 635–653. [Google Scholar]
- Kahn, S.E.; Hull, R.L.; Utzschneider, K.M. Mechanisms linking obesity to insulin resistance and type 2 diabetes. Nature 2006, 444, 840–846. [Google Scholar] [CrossRef] [PubMed]
- Yang, Q.; Graham, T.E.; Mody, N.; Preitner, F.; Peroni, O.D.; Zabolotny, J.M.; Kotani, K.; Quadro, L.; Kahn, B.B. Serum retinol binding protein 4 contributes to insulin resistance in obesity and type 2 diabetes. Nature 2005, 436, 356–362. [Google Scholar] [CrossRef]
- Graham, T.E.; Yang, Q.; Blüher, M.; Hammarstedt, A.; Ciaraldi, T.P.; Henry, R.R.; Wason, C.J.; Andreas Oberbach Andreas Oberbach, B.S.; Jansson, P.-A.; Smith, U.; et al. Retinol-binding protein 4 and insulin resistance in lean, obese, and diabetic subjects. N. Engl. J. Med. 2006, 354, 2552–2563. [Google Scholar] [CrossRef]
- Broch, M.; Gómez, J.M.; Auguet, M.T.; Vilarrasa, N.; Pastor, R.; Elio, I.; Olona, M.; García-España, A.; Richart, C. Association of retinol-binding protein-4 (RBP4) with lipid parameters in obese women. Obes. Surg. 2010, 20, 1258–1264. [Google Scholar] [CrossRef]
- Haider, D.G.; Schindler, K.; Prager, G.; Bohdjalian, A.; Luger, A.; Wolzt, M.; Ludvik, B. Serum retinol-binding protein 4 is reduced after weight loss in morbidly obese subjects. J. Clin. Endocrinol. Metab. 2007, 92, 1168–1171. [Google Scholar] [CrossRef]
- Gómez-Ambrosi, J.; Rodríguez, A.; Catalán, V.; Ramírez, B.; Silva, C.; Rotellar, F.; Gil, M.J.; Salvador, J.; Frühbeck, G. Serum retinol-binding protein 4 is not increased in obesity or obesity-associated type 2 diabetes mellitus, but is reduced after relevant reductions in body fat following gastric bypass. Clin. Endocrinol. (Oxf). 2008, 69, 208–215. [Google Scholar] [CrossRef]
- Abahusain, M.A.; Wright, J.; Dickerson, J.W.; de Vol, E.B. Retinol, alpha-tocopherol and carotenoids in diabetes. Eur. J. Clin. Nutr. 1999, 53, 630–635. [Google Scholar] [CrossRef][Green Version]
- Basualdo, CG.; Wein, E.E.; Basu, T.K. Vitamin A (retinol) status of first nation adults with non-insulin-dependent diabetes mellitus. J. Am. Coll. Nutr. 1997, 16, 39–45. [Google Scholar] [CrossRef]
- Cho, Y.M.; Youn, B.S.; Lee, H.; Lee, N.; Min, S.S.; Kwak, S.H.; Lee, H.K.; Park, K.S. Plasma retinol-binding protein-4 concentrations are elevated in human subjects with impaired glucose tolerance and type 2 diabetes. Diabetes Care 2006, 29, 2457–2461. [Google Scholar] [CrossRef] [PubMed]
- von Eynatten, M.; Lepper, P.M.; Liu, D.; Lang, K.; Baumann, M.; Nawroth, P.P.; Bierhaus, A.; Dugi, K.A.; Heemann, U.; Allolio, B.; et al. Retinol-binding protein 4 is associated with components of the metabolic syndrome, but not with insulin resistance, in men with type 2 diabetes or coronary artery disease. Diabetologia 2007, 50, 1930–1937. [Google Scholar] [CrossRef] [PubMed]
- Erikstrup, C.; Mortensen, O.H.; Nielsen, A.R.; Fischer, C.P.; Plomgaard, P.; Petersen, A.M.; Krogh-Madsen, R.; Lindegaard, B.; Erhardt, J.G.; Ullum, H.; et al. RBP-to-retinol ratio, but not total RBP, is elevated in patients with type 2 diabetes. Diabetes Obes. Metab. 2009, 11, 204–212. [Google Scholar] [CrossRef] [PubMed]
- Aeberli, I.; Biebinger, R.; Lehmann, R.; l’Allemand, D.; Spinas, G.A.; Zimmermann, M.B. Serum retinol-binding protein 4 concentration and its ratio to serum retinol are associated with obesity and metabolic syndrome components in children. J. Clin. Endocrinol. Metab. 2007, 92, 4359–4365. [Google Scholar] [CrossRef]
- Ingelsson, E.; Lind, L. Circulating retinol-binding protein 4 and subclinical cardiovascular disease in the elderly. Diabetes Care 2009, 32, 733–735. [Google Scholar] [CrossRef]
- Comerford, K.B.; Buchan, W.; Karakas, S.E. The effects of weight loss on FABP4 and RBP4 in obese women with metabolic syndrome. Horm. Metab. Res. 2014, 46, 224–231. [Google Scholar] [CrossRef]
- Wu, J.; Shi, Y.H.; Niu, D.M.; Li, H.Q.; Zhang, C.N.; Wang, J.J. Association among retinol-binding protein 4, small dense LDL cholesterol and oxidized LDL levels in dyslipidemia subjects. Clin. Biochem. 2012, 45, 619–622. [Google Scholar] [CrossRef]
- Taskinen, M.R.; Borén, J. New insights into the pathophysiology of dyslipidemia in type 2 diabetes. Atherosclerosis 2015, 239, 483–495. [Google Scholar] [CrossRef]
- Dallinga-Thie, G.M.; Dullaart, R.P.; van Tol, A. Derangements of intravascular remodeling of lipoproteins in type 2 diabetes mellitus: Consequences for atherosclerosis development. Curr. Diabete Rep. 2008, 8, 65–70. [Google Scholar] [CrossRef]
- Dullaart, R.P.; de Vries, R.; Kwakernaak, A.J.; Perton, F.; Dallinga-Thie, G.M. Increased large VLDL particles confer elevated cholesteryl ester transfer in diabetes. Eur. J. Clin. Investig. 2015, 45, 36–44. [Google Scholar] [CrossRef]
- Shah, A.S.; Davidson, W.S.; Gao, Z.; Dolan, L.M.; Kimball, T.R.; Urbina, E.M. Superiority of lipoprotein particle number to detect associations with arterial thickness and stiffness in obese youth with and without prediabetes. J. Clin. Lipidol. 2016, 10, 610–618. [Google Scholar] [CrossRef] [PubMed]
- Usui, S.; Ichimura, M.; Ikeda, S.; Okamoto, M. Association between serum retinol-binding protein 4 and small dense low-density lipoprotein cholesterol levels in young adult women. Clin. Chim. Acta 2009, 399, 45–48. [Google Scholar] [CrossRef] [PubMed]
- Mallat, Z.; Simon, T.; Benessiano, J.; Clément, K.; Taleb, S.; Wareham, N.J.; Luben, R.; Khaw, K.-T.; Tedgui, A.; Boekholdt, S.M. Retinol-binding protein 4 and prediction of incident coronary events in healthy men and women. J. Clin. Endocrinol. Metab. 2009, 94, 255–260. [Google Scholar] [CrossRef] [PubMed]
- Sun, Q.; Kiernan, U.A.; Shi, L.; Phillips, D.A.; Kahn, B.B.; Hu, F.B.; Manson, J.E.; Albert, C.M.; Rexrode, K.M. Plasma retinol-binding protein 4 (RBP4) levels and risk of coronary heart disease: A prospective analysis among women in the nurses’ health study. Circulation 2013, 127, 1938–1947. [Google Scholar] [CrossRef]
- Liu, Y.; Wang, D.; Chen, H.; Xia, M. Circulating retinol binding protein 4 is associated with coronary lesion severity of patients with coronary artery disease. Atherosclerosis 2015, 238, 45–51. [Google Scholar] [CrossRef]
- Liu, Y.; Zhong, Y.; Chen, H.; Wang, D.; Wang, M.; Ou, J.S.; Xia, M. Retinol-Binding Protein-Dependent Cholesterol Uptake Regulates Macrophage Foam Cell Formation and Promotes Atherosclerosis. Circulation 2017, 135, 1339–1354. [Google Scholar] [CrossRef]
- Grundy, S.M.; Cleeman, J.I.; Daniels, S.R.; Donato, K.A.; Eckel, R.H.; Franklin, B.A.; Gordon, D.J.; Krauss, R.M.; Savage, P.J.; Smith, S.C.; et al. Diagnosis and management of the metabolic syndrome: An American Heart Association/National Heart, Lung, and Blood Institute Scientific Statement. Circulation 2005, 112, 2735–2752. [Google Scholar] [CrossRef]
- Zaman, Z.; Fielden, P.; Frost, P.G. Simultaneous determination of vitamins A and E and carotenoids in plasma by reversed-phase HPLC in elderly and younger subjects. Clin. Chem. 1993, 39, 2229–2234. [Google Scholar]
- Nijstad, N.; Wiersma, H.; Gautier, T.; van der Giet, M.; Maugeais, C.; Tietge, U.J. Scavenger receptor BI-mediated selective uptake is required for the remodeling of high density lipoprotein by endothelial lipase. J. Biol. Chem. 2009, 284, 6093–6100. [Google Scholar] [CrossRef]
- Jeyarajah, E.J.; Cromwell, W.C.; Otvos, J.D. Lipoprotein particle analysis by nuclear magnetic resonance spectroscopy. Clin. Lab. Med. 2006, 26, 847–870. [Google Scholar] [CrossRef]
- Matyus, S.P.; Braun, P.J.; Wolak-Dinsmore, J.; Jeyarajah, E.J.; Shalaurova, I.; Xu, Y.; Warner, S.M.; Clement, T.S.; Connelly, M.A.; Fischer, T.J. NMR measurement of LDL particle number using the Vantera Clinical Analyzer. Clin. Biochem. 2014, 47, 203–210. [Google Scholar] [CrossRef] [PubMed]
- Packard, C.J.; Shepherd, J. Lipoprotein heterogeneity and apolipoprotein B metabolism. Arterioscler. Thromb. Vasc. Biol. 1997, 17, 3542–3556. [Google Scholar] [CrossRef] [PubMed]
- Adiels, M.; Olofsson, S.O.; Taskinen, M.R.; Borén, J. Overproduction of very low-density lipoproteins is the hallmark of the dyslipidemia in the metabolic syndrome. Arterioscler. Thromb. Vasc. Biol. 2008, 28, 1225–1236. [Google Scholar] [CrossRef] [PubMed]
- Nassir, F.; Adewole, O.L.; Brunt, E.M.; Abumrad, N.A. CD36 deletion reduces VLDL secretion, modulates liver prostaglandins, and exacerbates hepatic steatosis in ob/ob mice. J. Lipid Res. 2013, 54, 2988–2997. [Google Scholar] [CrossRef]
- Saeed, A.; Dullaart, R.P.F.; Schreuder, T.C.M.A.; Blokzijl, H.; Faber, K.N. Disturbed Vitamin A Metabolism in Non-Alcoholic Fatty Liver Disease (NAFLD). Nutrients 2017, 10, 29. [Google Scholar] [CrossRef]
- Flajollet, S.; Staels, B.; Lefebvre, P. Retinoids and nuclear retinoid receptors in white and brown adipose tissues: Physiopathologic aspects. Horm. Mol. Biol. Clin. Investig. 2013, 14, 75–86. [Google Scholar] [CrossRef]
- Gerber, L.E.; Erdman, J.W. Retinoic acid and hypertriglyceridemia. Ann. N. Y. Acad. Sci. 1981, 359, 391–392. [Google Scholar] [CrossRef]
- Ma, Y.; Belyaeva, O.V.; Brown, P.M.; Fujita, K.; Valles, K.; Karki, S.; de Boer, Y.S.; Koh, C.; Chen, Y.; Du, X.; et al. HSD17B13 is a Hepatic Retinol Dehydrogenase Associated with Histological Features of Non-Alcoholic Fatty Liver Disease. Hepatology 2019, 69, 1504–1509. [Google Scholar] [CrossRef]
- Misra, S.; Kumar, A.; Kumar, P.; Yadav, A.K.; Mohania, D.; Pandit, A.K.; Prasad, K.; Vibha, D. Blood-based protein biomarkers for stroke differentiation: A systematic review. Proteom. Clin. Appl. 2017, 11, 1700007. [Google Scholar] [CrossRef]
- Rist, P.M.; Jiménez, M.C.; Tworoger, S.S.; Hu, F.B.; Manson, J.E.; Sun, Q.; Rexrode, K.M. Plasma Retinol-Binding Protein 4 Levels and the Risk of Ischemic Stroke among Women. J. Stroke Cerebrovasc. Dis. 2018, 27, 68–75. [Google Scholar] [CrossRef]
- Kuller, L.; Arnold, A.; Tracy, R.; Otvos, J.; Burke, G.; Psaty, B.; Siscovick, D.; Freedman, D.S.; Kronmal, R. Nuclear magnetic resonance spectroscopy of lipoproteins and risk of coronary heart disease in the cardiovascular health study. Arterioscler. Thromb. Vasc. Biol. 2002, 22, 1175–1180. [Google Scholar] [CrossRef] [PubMed]
- Tsai, M.Y.; Steffen, B.T.; Guan, W.; McClelland, R.L.; Warnick, R.; McConnell, J.; Hoefner, D.M.; Remaley, A.T. New automated assay of small dense low-density lipoprotein cholesterol identifies risk of coronary heart disease: The Multi-ethnic Study of Atherosclerosis. Arterioscler. Thromb. Vasc. Biol. 2014, 34, 196–201. [Google Scholar] [CrossRef] [PubMed]
- Hoogeveen, R.C.; Gaubatz, J.W.; Sun, W.; Dodge, R.C.; Crosby, J.R.; Jiang, J.; Couper, D.; Virani, S.S.; Kathiresan, S.; Boerwinkle, E.; et al. Small dense low-density lipoprotein-cholesterol concentrations predict risk for coronary heart disease: The Atherosclerosis Risk In Communities (ARIC) study. Arterioscler. Thromb. Vasc. Biol. 2014, 34, 1069–1077. [Google Scholar] [CrossRef] [PubMed]
- Chang, C.Y.; Chen, C.H.; Chen, Y.M.; Hsieh, T.Y.; Li, J.P.; Shen, M.Y.; Lan, J.L.; Chen, D.Y. Association between Negatively Charged Low-Density Lipoprotein L5 and Subclinical Atherosclerosis in Rheumatoid Arthritis Patients. J. Clin. Med. 2019, 8, 177. [Google Scholar] [CrossRef] [PubMed]
- Niccoli, G.; Bacà, M.; De Spirito, M.; Parasassi, T.; Cosentino, N.; Greco, G.; Conte, M.; Montone, R.A.; Arcovito, G.; Crea, F. Impact of electronegative low- density lipoprotein on angiographic coronary atherosclerotic burden. Atherosclerosis 2012, 223, 166–170. [Google Scholar] [CrossRef]


| T2DM Subjects (n = 41) | Non-Diabetic Subjects (n = 37) | p-Value | |
|---|---|---|---|
| Age (years) | 60 ± 10 | 52 ± 9 | <0.001 |
| Gender (men/women) | 19/22 | 10/27 | 0.127 |
| Metabolic syndrome (yes/no) | 29/12 | 7/30 | <0.001 |
| Systolic blood pressure (mm Hg) | 145 ± 20 | 129 ± 20 | 0.001 |
| Diastolic blood pressure (mm Hg) | 87 ± 9 | 81 ± 12 | 0.025 |
| BMI (kg/m2) | 29.0 ± 4.9 | 25.5 ± 4.1 | 0.001 |
| Waist (cm) | 100 ± 14 | 84 ± 13 | <0.001 |
| Glucose (mmol/L) | 8.9 ± 2.3 | 5.6 ± 0.7 | <0.001 |
| HbA1c (mmol/mol) | 50 ± 9 | 33 ± 3 | <0.001 |
| HOMA-IR (mU mmol/L2/22.5) | 4.01 (2.94–6.99) | 1.56 (1.13–2.03) | <0.001 |
| Total cholesterol (mmol/L) | 5.53 ± 0.97 | 5.65 ± 0.98 | 0.578 |
| Non-HDL cholesterol (mmol/L) | 4.21 ± 1.05 | 4.06 ± 1.10 | 0.547 |
| LDL cholesterol (mmol/L) | 3.39 ± 0.88 | 3.46 ± 0.97 | 0.73 |
| HDL cholesterol (mmol/L) | 1.31 ± 0.39 | 1.59 ± 0.35 | 0.002 |
| Triglycerides (mmol/L) | 1.90 ± 1.60 | 1.34 ± 0.53 | 0.021 |
| ApoB (g/L) | 0.97 ± 0.24 | 0.91 ± 0.26 | 0.324 |
| Apo A-1 (g/L) | 1.37 ± 0.26 | 1.46 ± 0.21 | 0.080 |
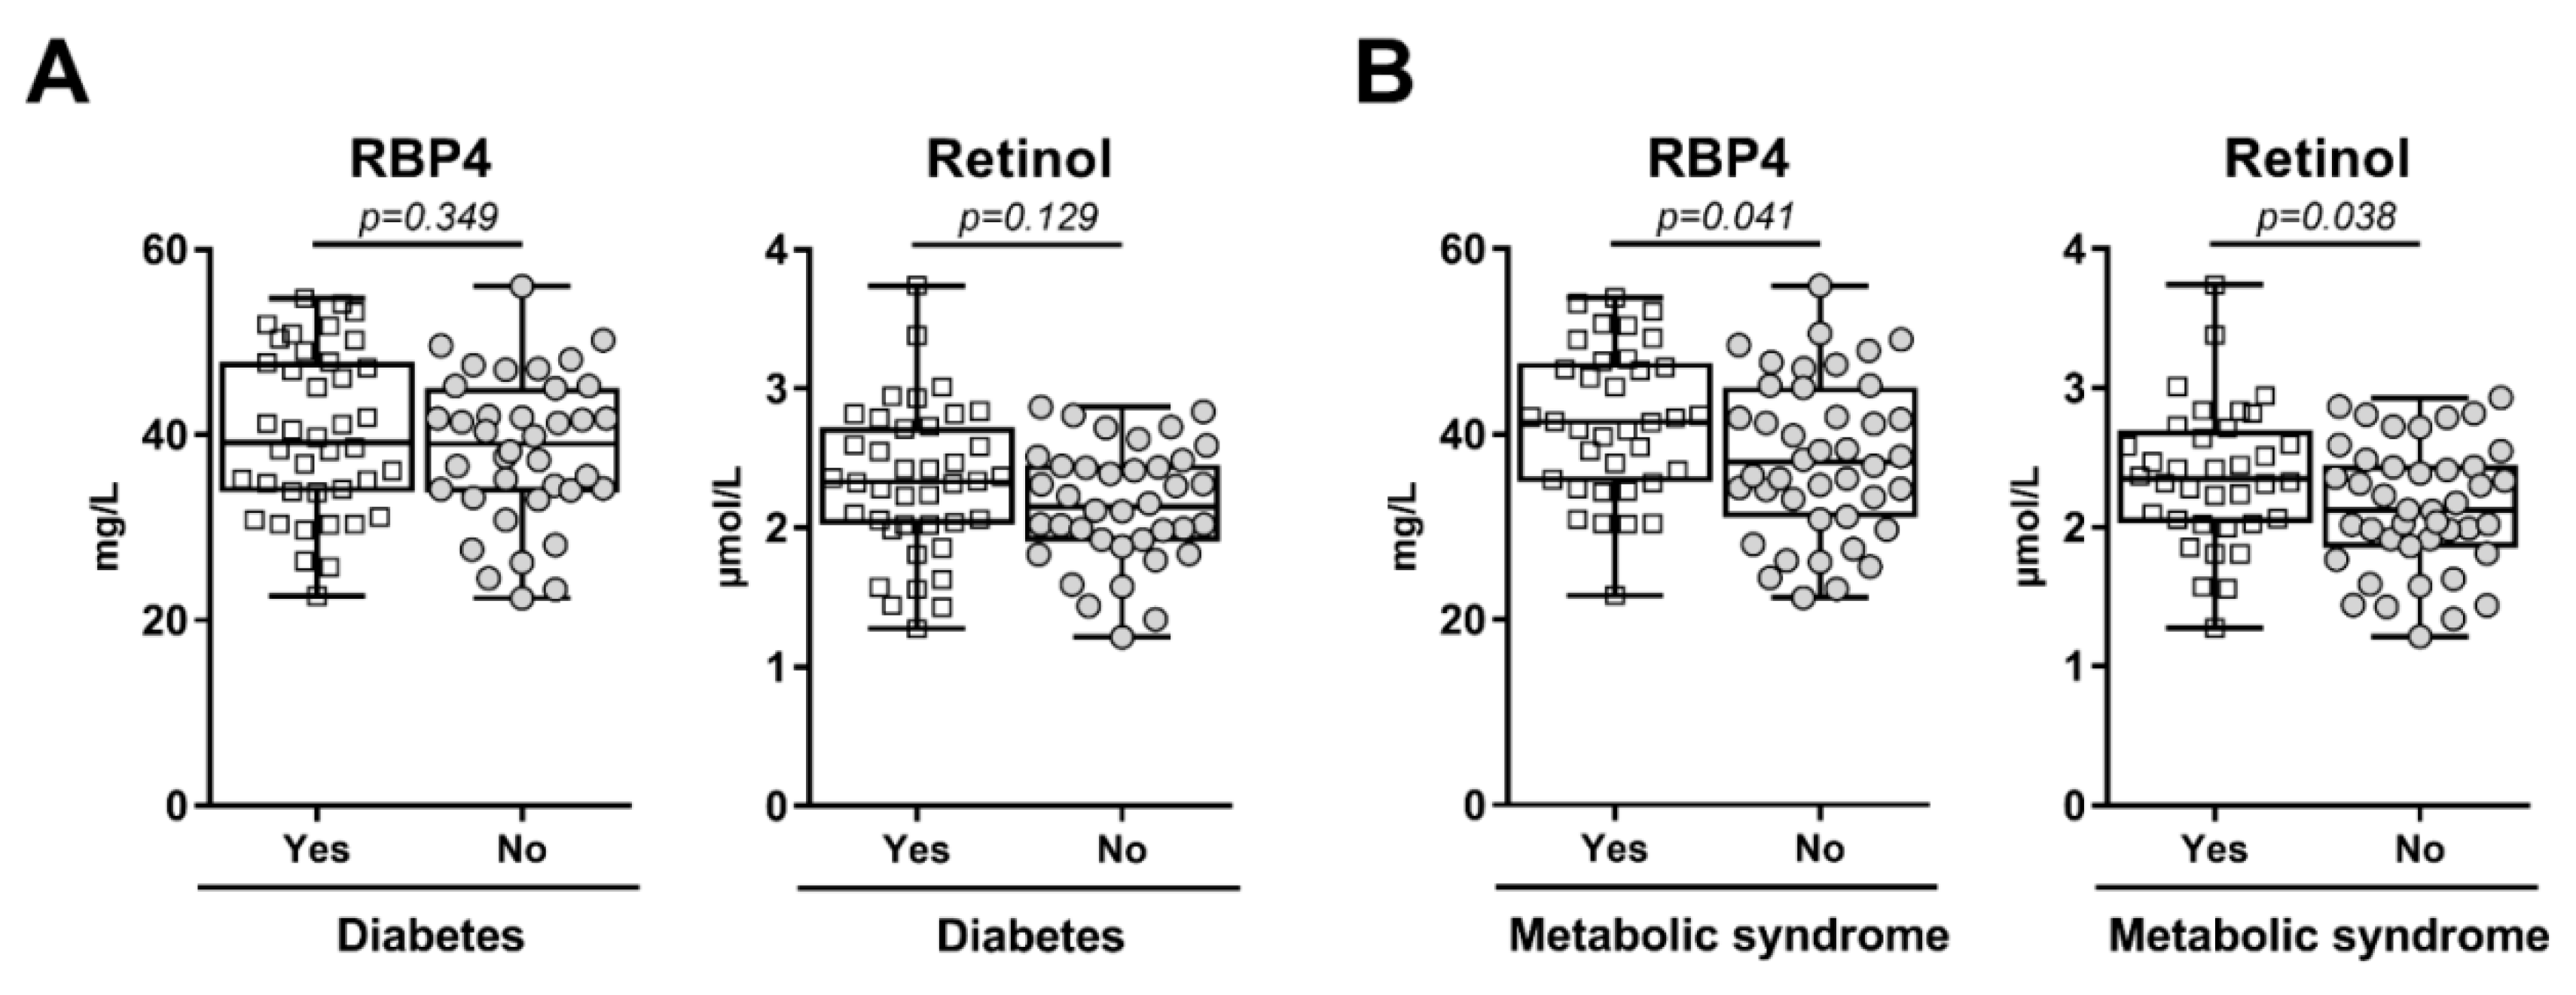
| RBP4 (mg/L) | 40.13 ± 8.71 | 38.33 ± 8.11 | 0.349 |
| Retinol (µmol/L) | 2.33 ± 0.53 | 2.16 ± 0.43 | 0.129 |
| RBP4/retinol ratio (mg/µmol) | 17.38 ± 1.70 | 17.82 ± 1.94 | 0.290 |
| T2DM Subjects (n = 36) | Non-Diabetic Subjects (n = 27) | p-Value | |
|---|---|---|---|
| Total VLDL (nmol/L) | 68.9 (48.6–82.1) | 58.7 (51.4–86.7) | 0.56 |
| Large VLDL (nmol/L) | 6.8 (2.8–9.9) | 2.9 (2.3–4.7) | 0.035 |
| Medium VLDL (nmol/L) | 23.0 (15.8–40.6) | 24.8 (12.5–38.2) | 0.45 |
| Small VLDL (nmol/L) | 29.9 (20.2–42.9) | 32.2 (21.1–44.3) | 0.51 |
| Total LDL (nmol/L) | 1257 (1022–1540) | 981 (856–1284) | 0.004 |
| IDL (nmol/L) | 170 (118–234) | 188 (140–257) | 0.14 |
| Large LDL (nmol/L) | 509 (345–612) | 469 (435–597) | 0.57 |
| Small LDL (nmol/L) | 586 (400–850) | 338 (149–442) | 0.003 |
| Total HDL (µmol/L) | 32.9 (29.3–37.9) | 33.8 (32.0–36.1) | 0.75 |
| Large HDL (µmol/L) | 5.0 (2.6–6.6) | 6.7 (4.6–9.9) | 0.021 |
| Medium HDL (µmol/L) | 10.1 (8.3–14.4) | 12.8 (11.5–16.1) | 0.007 |
| Small HDL (µmol/L) | 17.7 (14.6–20.9) | 14.3 (10.1–16.30 | 0.006 |
| All Subjects (A) | RBP4 | Retinol |
|---|---|---|
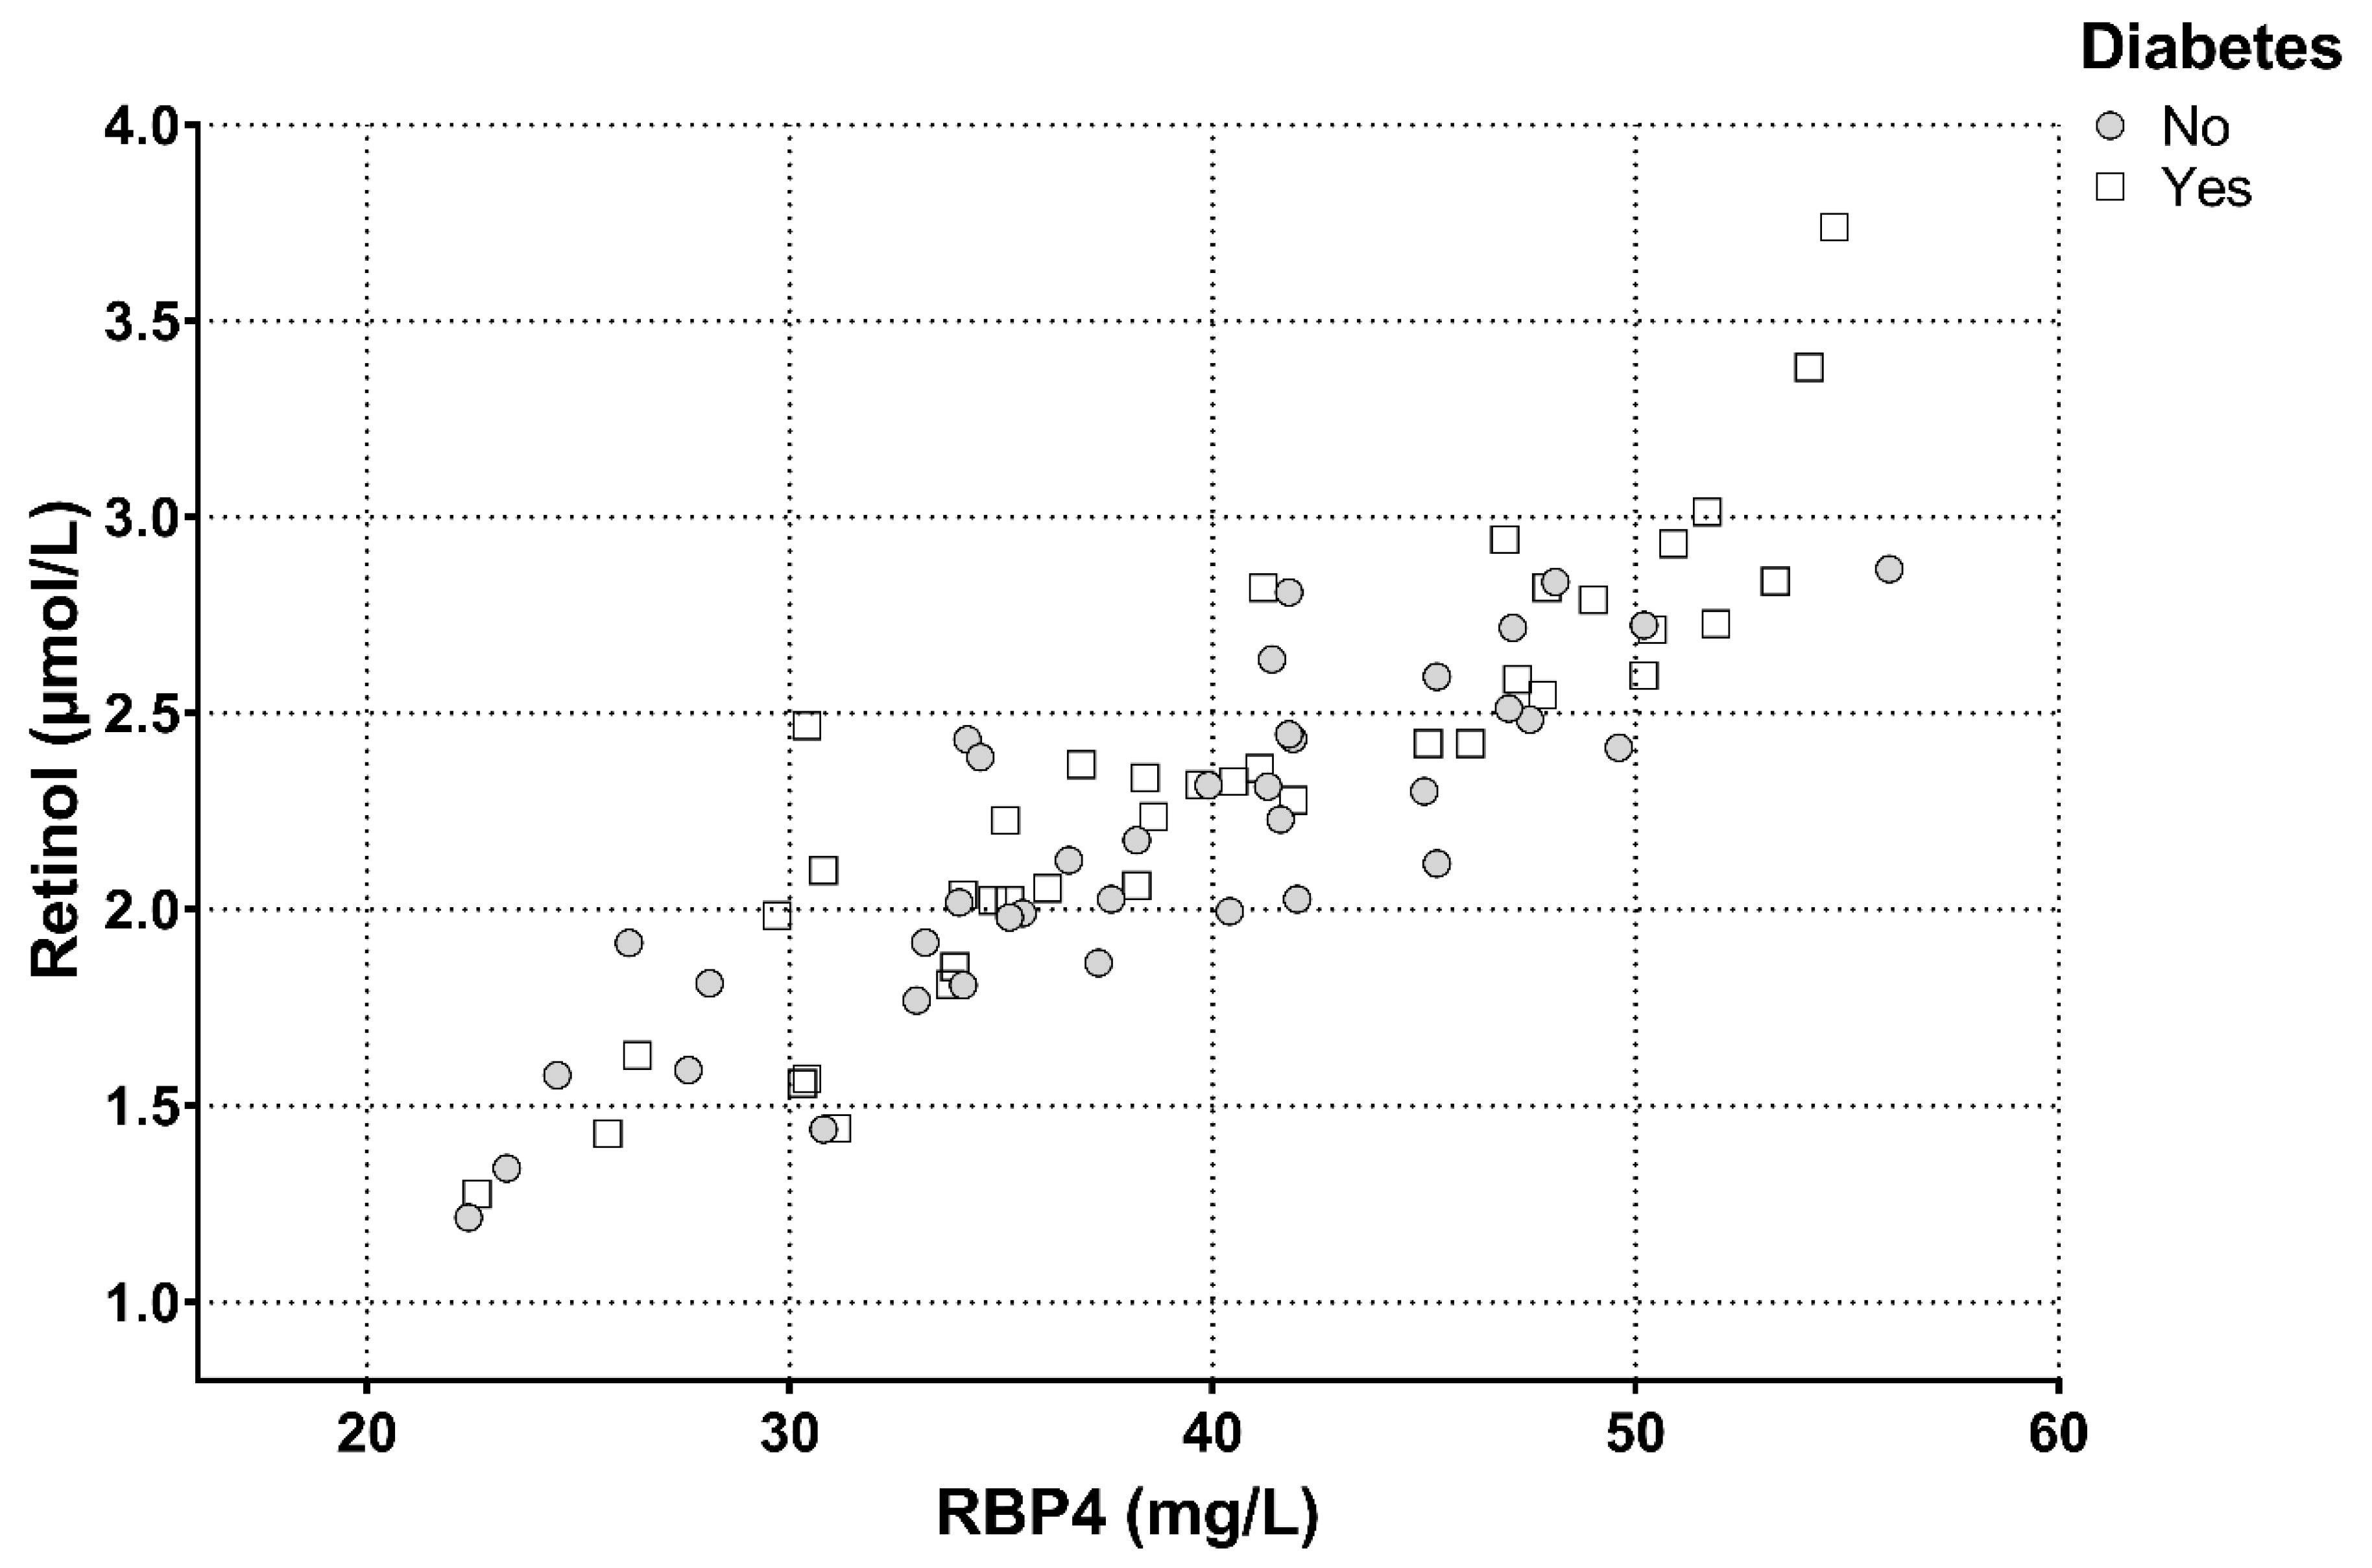
| RBP4 | 0.881 *** | |
| Retinol | 0.881 *** | |
| Age | 0.153 | 0.117 |
| Systolic blood pressure | 0.151 | 0.133 |
| Diastolic blood pressure | 0.099 | 0.139 |
| BMI | 0.021 | 0.005 |
| Waist | 0.099 | 0.167 |
| Glucose | 0.104 | 0.196 |
| HbA1c | 0.176 | 0.171 |
| Total cholesterol | 0.435 *** | 0.399 *** |
| Non-HDL cholesterol | 0.463 *** | 0.421 *** |
| LDL cholesterol | 0.384 *** | 0.368 *** |
| HDL cholesterol | −0.186 | −0.163 |
| Triglycerides | 0.391 *** | 0.313 ** |
| ApoB | 0.445 *** | 0.372 ** |
| ApoA-I | −0.007 | −0.039 |
| T2DM Subjects (B) | ||
| RBP4 | 0.859 *** | |
| Retinol | 0.859 *** | |
| Age | −0.082 | −0.008 |
| Systolic blood pressure | 0.022 | 0.026 |
| Diastolic blood pressure | 0.030 | 0.065 |
| BMI | −0.117 | −0.091 |
| Waist | −0.039 | 0.030 |
| Glucose | 0.082 | 0.161 |
| HbA1c | 0.184 | 0.089 |
| Total cholesterol | 0.376 * | 0.321 * |
| Non-HDL cholesterol | 0.425 ** | 0.340 * |
| LDL cholesterol | 0.315 * | 0.271 |
| HDL cholesterol | −0.212 | −0.122 |
| Triglycerides | 0.415 ** | 0.293 |
| ApoB | 0.394 * | 0.262 |
| ApoA-I | −0.150 | −0.091 |
| Non-Diabetic Subjects (C) | ||
| RBP4 | 0.900 *** | |
| Retinol | 0.900 *** | |
| Age | 0.381 * | 0.258 |
| Systolic blood pressure | 0.235 | 0.140 |
| Diastolic blood pressure | 0.115 | 0.144 |
| BMI | −0.117 | −0.018 |
| Waist | 0.170 | 0.186 |
| Glucose | −0.100 | −0.099 |
| HbA1c | 0.051 | 0.041 |
| Total cholesterol | 0.528 *** | 0.555 *** |
| Non-HDL cholesterol | 0.500 *** | 0.526 *** |
| LDL cholesterol | 0.514 *** | 0.463 ** |
| HDL cholesterol | −0.090 | −0.096 |
| Triglycerides | 0.416 * | 0.332 * |
| ApoB | 0.489 *** | 0.494 *** |
| ApoA-I | 0.184 | 0.146 |
| All Subjects (A) (n = 63) | RBP4 | Retinol |
|---|---|---|
| Total VLDL | 0.452 *** | 0.381 ** |
| Large VLDL | 0.433 *** | 0.341 ** |
| Medium VLDL | 0.293* | 0.248 * |
| Small VLDL | 0.178 | 0.187 |
| Total LDL | 0.398 *** | 0.340 ** |
| IDL | –0.053 | –0.098 |
| Large LDL | –0.007 | 0.118 |
| Small LDL | 0.423 *** | 0.353 ** |
| Total HDL | 0.136 | 0.126 |
| Large HDL | –0.243 | –0.258 * |
| Medium HDL | –0.056 | –0.010 |
| Small HDL | 0.317 * | 0.290 * |
| T2DM Subjects (B) (n = 36) | RBP4 | Retinol |
| Total VLDP | 0.423 * | 0.322 |
| Large VLDL | 0.401 * | 0.262 |
| Medium VLDL | 0.238 | 0.168 |
| Small VLDL | 0.160 | 0.176 |
| Total LDL | 0.255 | 0.191 |
| IDL | –0.227 | –0.233 |
| Large LDL | –0.079 | 0.082 |
| Small LDL | 0.351 * | 0.266 |
| Total HDL | 0.016 | 0.010 |
| Large HDL | –0.170 | –0.190 |
| Medium HDL | –0.004 | 0.064 |
| Small HDL | 0.019 | 0.002 |
| Non-Diabetic Subjects (C) (n = 27) | RBP4 | Retinol |
| Total VLDP | 0.487 ** | 0.472 * |
| Large VLDL | 0.433 * | 0.385 * |
| Medium VLDL | 0.344 | 0.333 |
| Small VLDL | 0.270 | 0.293 |
| Total LDL | 0.529 ** | 0.442 * |
| IDL | 0.309 | 0.257 |
| Large LDL | 0.223 | 0.301 |
| Small LDL | 0.467 * | 0.366 |
| Total HDL | 0.478 * | 0.502 ** |
| Large HDL | –0.287 | –0.254 |
| Medium HDL | –0.027 | 0.051 |
| Small HDL | 0.523 ** | 0.476 * |
| A VLDL Subfractions | Model A | Model B | ||
|---|---|---|---|---|
| β | p-Value | β | p-Value | |
| Age | 0.305 | 0.027 | 0.226 | 0.12 |
| Sex (men vs. women) | –0.072 | 0.57 | 0.018 | 0.89 |
| T2DM | –0.079 | 0.60 | 0.017 | 0.92 |
| Large VLDL | 0.444 | 0.005 | 0.324 | 0.046 |
| Medium VLDL | 0.044 | 0.770 | 0.032 | 0.84 |
| Small VLDL | 0.183 | 0.13 | 0.206 | 0.105 |
| B LDL Subfractions | Model A | Model B | ||
| β | p-Value | β | p-Value | |
| Age | 0.306 | 0.035 | 0.195 | 0.19 |
| Sex (men vs. women) | –0.180 | 0.19 | –0.099 | 0.48 |
| T2DM | 0.157 | 0.33 | –0.030 | 0.86 |
| IDL | –0.150 | 0.24 | –0.138 | 0.30 |
| Large LDL | 0.106 | 0.39 | 0.221 | 0.090 |
| Small LDL | 0.539 | <0.001 | 0.440 | 0.003 |
| B HDL Subfractions | Model A | Model B | ||
| β | p-value | β | p-value | |
| Age | 0.309 | 0.044 | 0.257 | 0.095 |
| Sex (men vs. women) | –0.180 | 0.26 | 0.006 | 0.97 |
| T2DM | –0.073 | 0.65 | –0.008 | 0.96 |
| Large HDL | –0.336 | 0.034 | –0.323 | 0.043 |
| Medium HDL | 0.145 | 0.38 | 0.302 | 0.073 |
| Small HDL | 0.262 | 0.076 | 0.254 | 0.086 |
© 2019 by the authors. Licensee MDPI, Basel, Switzerland. This article is an open access article distributed under the terms and conditions of the Creative Commons Attribution (CC BY) license (http://creativecommons.org/licenses/by/4.0/).
Share and Cite
Wessel, H.; Saeed, A.; Heegsma, J.; Connelly, M.A.; Faber, K.N.; Dullaart, R.P.F. Plasma Levels of Retinol Binding Protein 4 Relate to Large VLDL and Small LDL Particles in Subjects with and without Type 2 Diabetes. J. Clin. Med. 2019, 8, 1792. https://doi.org/10.3390/jcm8111792
Wessel H, Saeed A, Heegsma J, Connelly MA, Faber KN, Dullaart RPF. Plasma Levels of Retinol Binding Protein 4 Relate to Large VLDL and Small LDL Particles in Subjects with and without Type 2 Diabetes. Journal of Clinical Medicine. 2019; 8(11):1792. https://doi.org/10.3390/jcm8111792
Chicago/Turabian StyleWessel, Hanna, Ali Saeed, Janette Heegsma, Margery A. Connelly, Klaas Nico Faber, and Robin P. F. Dullaart. 2019. "Plasma Levels of Retinol Binding Protein 4 Relate to Large VLDL and Small LDL Particles in Subjects with and without Type 2 Diabetes" Journal of Clinical Medicine 8, no. 11: 1792. https://doi.org/10.3390/jcm8111792
APA StyleWessel, H., Saeed, A., Heegsma, J., Connelly, M. A., Faber, K. N., & Dullaart, R. P. F. (2019). Plasma Levels of Retinol Binding Protein 4 Relate to Large VLDL and Small LDL Particles in Subjects with and without Type 2 Diabetes. Journal of Clinical Medicine, 8(11), 1792. https://doi.org/10.3390/jcm8111792