A Low Tacrolimus Concentration/Dose Ratio Increases the Risk for the Development of Acute Calcineurin Inhibitor-Induced Nephrotoxicity

 , ,
, ,
Abstract
:1. Introduction
2. Experimental Section
2.1. Patients and Histology
2.2. Assessment of Pulse Wave Velocity and Glycocalyx
2.3. Cell Culture
2.4. Lysate Preparation and Western Blot Analysis
2.5. MTT Test
2.6. Statistical Analysis
3. Results
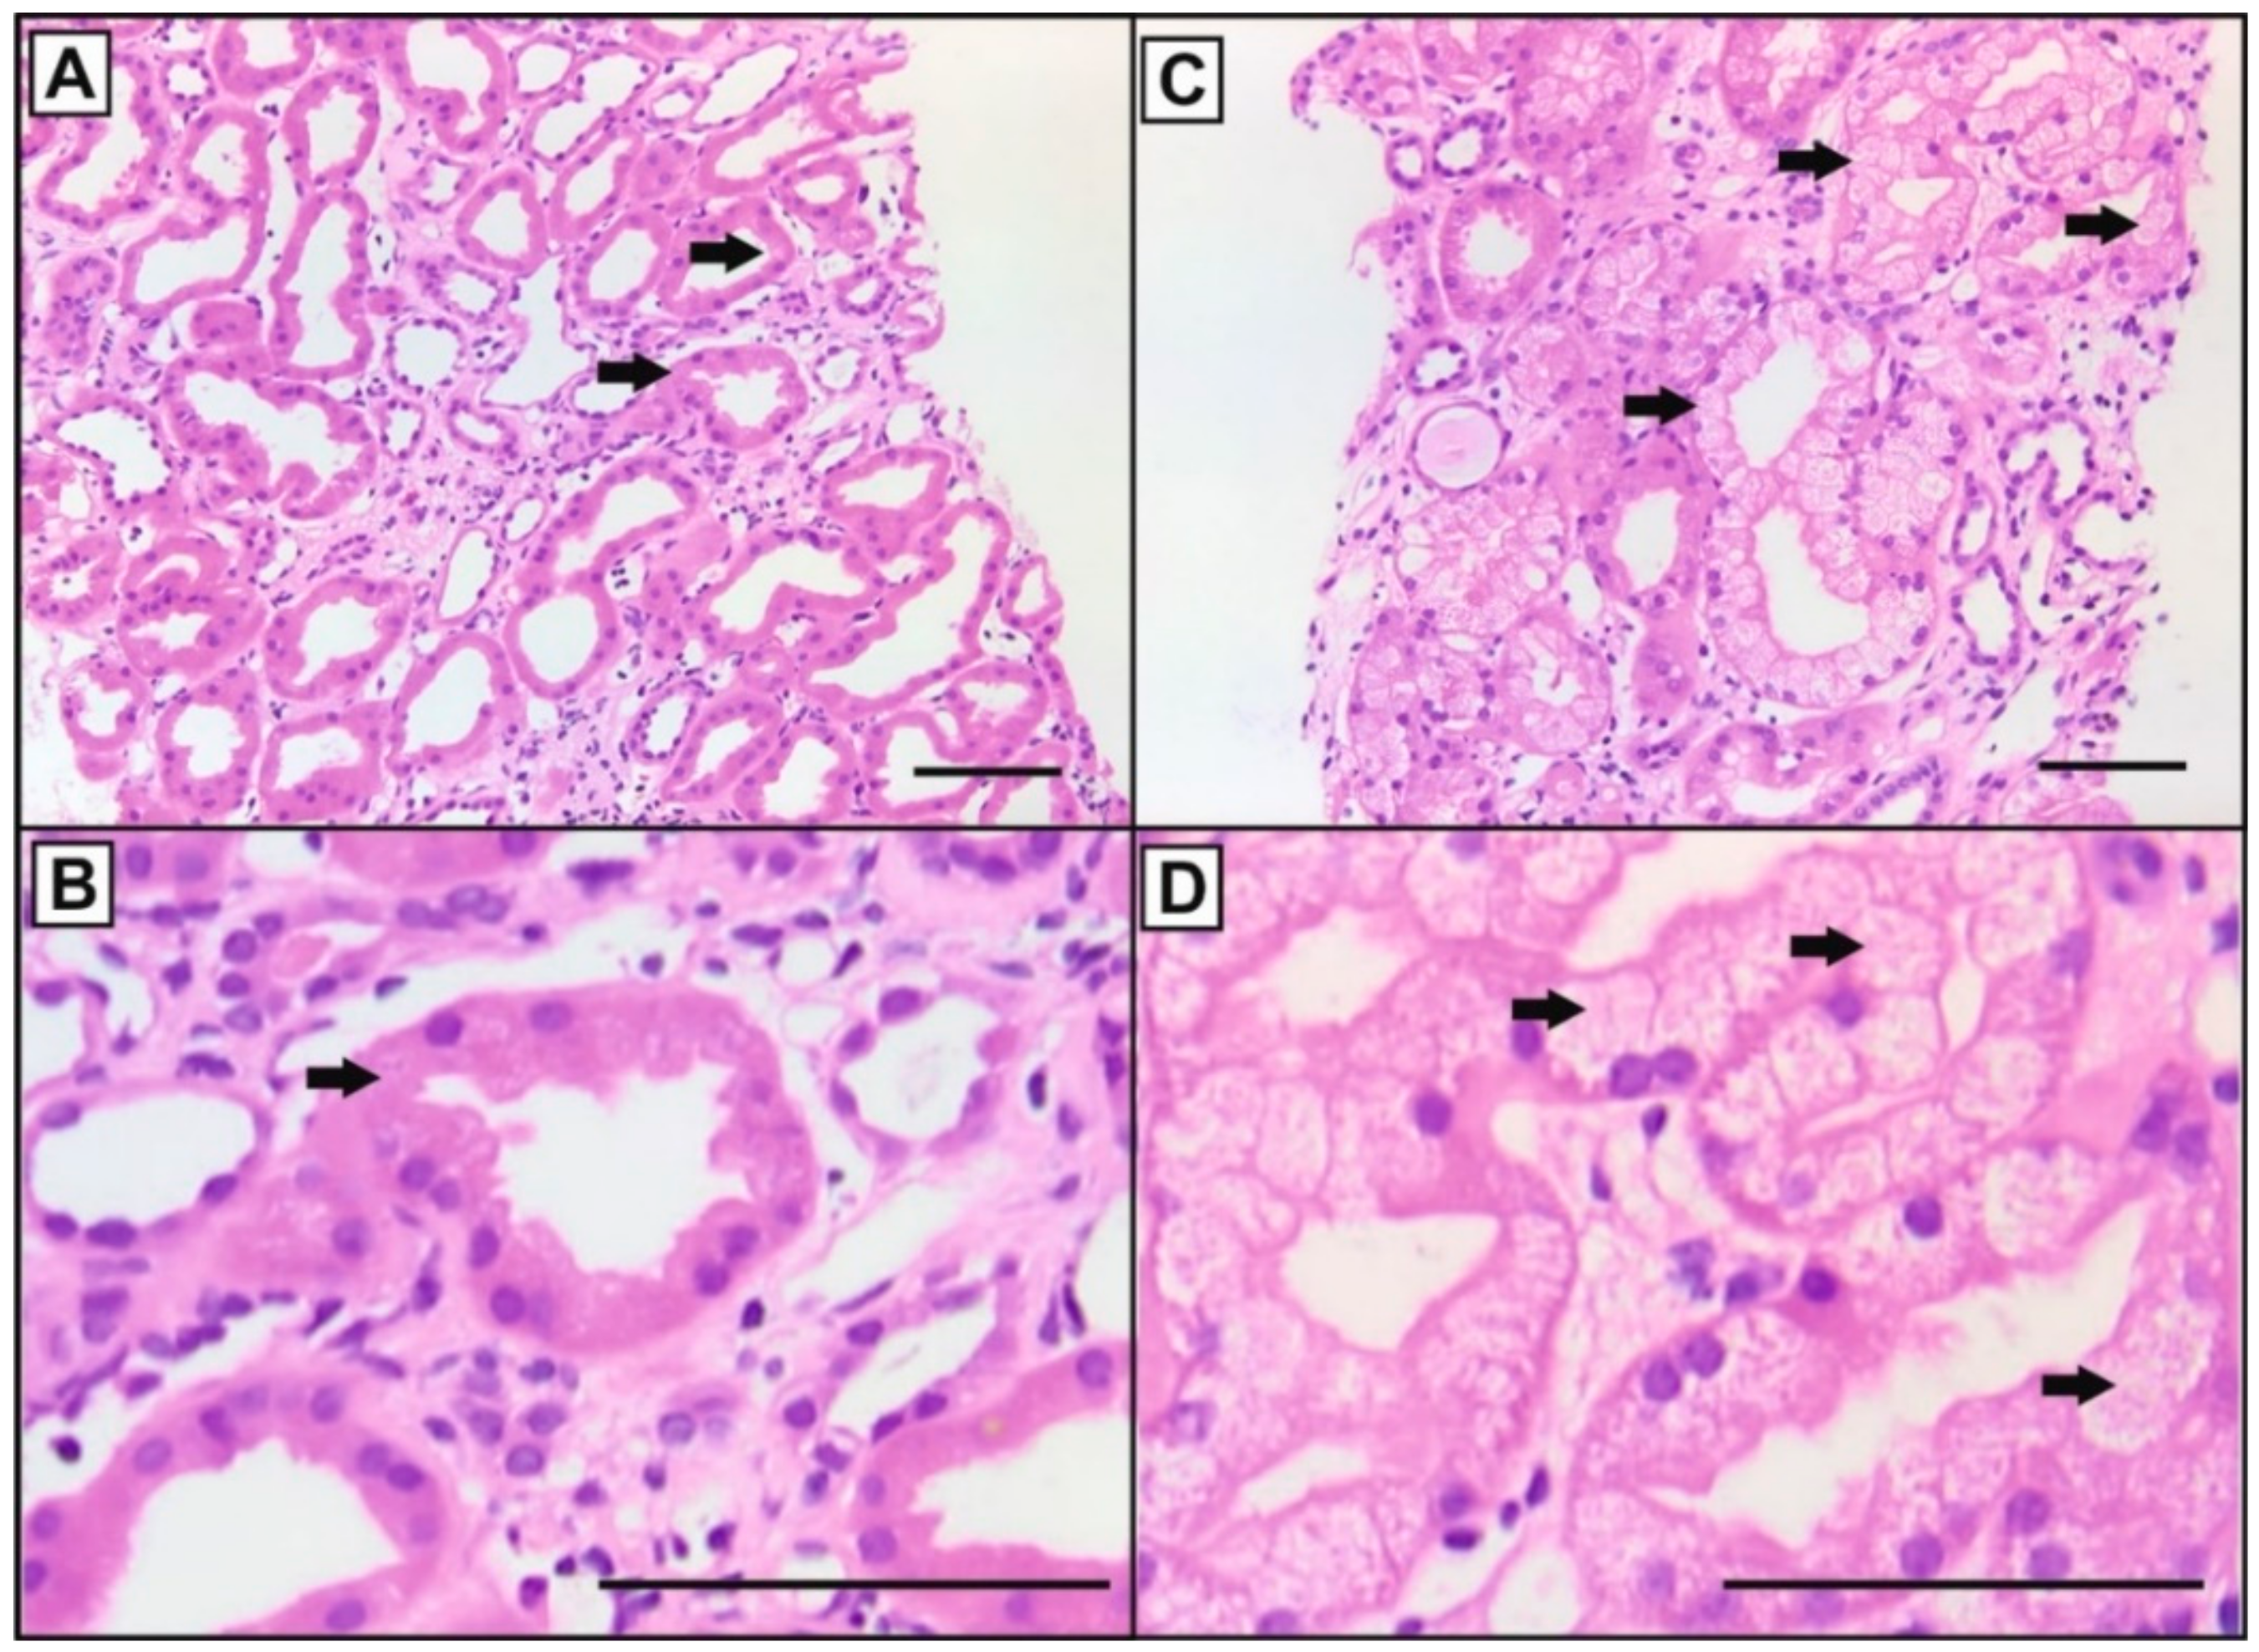
3.1. Histology
3.2. Pulse Wave Velocity Analysis
3.3. Glycocalyx Analysis
3.4. Cell Culture
4. Discussion
Supplementary Materials
Author Contributions
Funding
Acknowledgments
Conflicts of Interest
References
- Schütte-Nütgen, K.; Thölking, G.; Suwelack, B.; Reuter, S. Tacrolimus-Pharmacokinetic Considerations for Clinicians. Curr. Drug Metab. 2018, 19, 342–350. [Google Scholar] [CrossRef] [PubMed]
- Naesens, M.; Kuypers, D.R.; Sarwal, M. Calcineurin inhibitor nephrotoxicity. Clin. J. Am. Soc. Nephrol. 2009, 4, 481–508. [Google Scholar] [CrossRef] [PubMed]
- Claus, M.; Herro, R.; Wolf, D.; Buscher, K.; Rudloff, S.; Huynh-Do, U.; Burkly, L.; Croft, M.; Sidler, D. The TWEAK/Fn14 pathway is required for calcineurin inhibitor toxicity of the kidneys. Am. J. Transplant. 2018, 18, 1636–1645. [Google Scholar] [CrossRef]
- Egeland, E.J.; Reisaeter, A.V.; Robertsen, I.; Midtvedt, K.; Strom, E.H.; Holdaas, H.; Hartmann, A.; Asberg, A. High tacrolimus clearance—A risk factor for development of interstitial fibrosis and tubular atrophy in the transplanted kidney: A retrospective single-center cohort study. Transpl. Int. 2019, 32, 257–269. [Google Scholar] [CrossRef] [PubMed]
- Gwinner, W.; Hinzmann, K.; Erdbruegger, U.; Scheffner, I.; Broecker, V.; Vaske, B.; Kreipe, H.; Haller, H.; Schwarz, A.; Mengel, M. Acute tubular injury in protocol biopsies of renal grafts: Prevalence, associated factors and effect on long-term function. Am. J. Transplant. 2008, 8, 1684–1693. [Google Scholar] [CrossRef] [PubMed]
- Kershner, R.P.; Fitzsimmons, W.E. Relationship of FK506 whole blood concentrations and efficacy and toxicity after liver and kidney transplantation. Transplantation 1996, 62, 920–926. [Google Scholar] [CrossRef] [PubMed]
- Kuypers, D.R.; Naesens, M.; De Jonge, H.; Lerut, E.; Verbeke, K.; Vanrenterghem, Y. Tacrolimus dose requirements and CYP3A5 genotype and the development of calcineurin inhibitor-associated nephrotoxicity in renal allograft recipients. Ther. Drug Monit. 2010, 32, 394–404. [Google Scholar] [CrossRef] [PubMed]
- Shimizu, T.; Tanabe, K.; Tokumoto, T.; Ishikawa, N.; Shinmura, H.; Oshima, T.; Toma, H.; Yamaguchi, Y. Clinical and histological analysis of acute tacrolimus (TAC) nephrotoxicity in renal allografts. Clin. Transplant. 1999, 13 (Suppl. 1), 48–53. [Google Scholar]
- Thölking, G.; Fortmann, C.; Koch, R.; Gerth, H.U.; Pabst, D.; Pavenstädt, H.; Kabar, I.; Hüsing, A.; Wolters, H.; Reuter, S.; et al. The tacrolimus metabolism rate influences renal function after kidney transplantation. PLoS ONE 2014, 9, e111128. [Google Scholar] [CrossRef]
- Bardou, F.N.; Guillaud, O.; Erard-Poinsot, D.; Chambon-Augoyard, C.; Thimonier, E.; Vallin, M.; Boillot, O.; Dumortier, J. Tacrolimus exposure after liver transplantation for alcohol-related liver disease: Impact on complications. Transpl. Immunol. 2019, 56, 101227. [Google Scholar] [CrossRef]
- Genvigir, F.D.; Salgado, P.C.; Felipe, C.R.; Luo, E.Y.; Alves, C.; Cerda, A.; Tedesco-Silva, H., Jr.; Medina-Pestana, J.O.; Oliveira, N.; Rodrigues, A.C.; et al. Influence of the CYP3A4/5 genetic score and ABCB1 polymorphisms on tacrolimus exposure and renal function in Brazilian kidney transplant patients. Pharmacogenet. Genom. 2016, 26, 462–472. [Google Scholar] [CrossRef] [PubMed]
- Thölking, G.; Siats, L.; Fortmann, C.; Koch, R.; Hüsing, A.; Cicinnati, V.R.; Gerth, H.U.; Wolters, H.H.; Anthoni, C.; Pavenstädt, H.; et al. Tacrolimus Concentration/Dose Ratio is Associated with Renal Function After Liver Transplantation. Ann. Transplant. 2016, 21, 167–179. [Google Scholar] [CrossRef] [PubMed]
- Jouve, T.; Fonrose, X.; Noble, J.; Janbon, B.; Fiard, G.; Malvezzi, P.; Stanke-Labesque, F.; Rostaing, L. The TOMATO study (TacrOlimus MetabolizAtion in kidney TransplantatiOn): Impact of the concentration-dose ratio on death-censored graft survival. Transplantation 2019. [Google Scholar] [CrossRef] [PubMed]
- Nowicka, M.; Gorska, M.; Nowicka, Z.; Edyko, K.; Edyko, P.; Wislicki, S.; Zawiasa-Bryszewska, A.; Strzelczyk, J.; Matych, J.; Kurnatowska, I. Tacrolimus: Influence of the Posttransplant Concentration/Dose Ratio on Kidney Graft Function in a Two-Year Follow-Up. Kidney Blood Press Res. 2019, 1–14. [Google Scholar] [CrossRef] [PubMed]
- Bartlett, F.E.; Carthon, C.E.; Hagopian, J.C.; Horwedel, T.A.; January, S.E.; Malone, A. Tacrolimus Concentration-to-Dose Ratios in Kidney Transplant Recipients and Relationship to Clinical Outcomes. Pharmacotherapy 2019, 39, 827–836. [Google Scholar] [CrossRef] [PubMed]
- Schütte-Nütgen, K.; Tholking, G.; Steinke, J.; Pavenstädt, H.; Schmidt, R.; Suwelack, B.; Reuter, S. Fast Tac Metabolizers at Risk (-) It is Time for a C/D Ratio Calculation. J. Clin. Med. 2019, 8, 587. [Google Scholar] [CrossRef] [PubMed]
- Thölking, G.; Schmidt, C.; Koch, R.; Schütte-Nütgen, K.; Pabst, D.; Wolters, H.; Kabar, I.; Hüsing, A.; Pavenstädt, H.; Reuter, S.; et al. Influence of tacrolimus metabolism rate on BKV infection after kidney transplantation. Sci. Rep. 2016, 6, 32273. [Google Scholar] [CrossRef] [PubMed]
- Milan, A.; Zocaro, G.; Leone, D.; Tosello, F.; Buraioli, I.; Schiavone, D.; Veglio, F. Current assessment of pulse wave velocity: Comprehensive review of validation studies. J. Hypertens. 2019, 37, 1547–1557. [Google Scholar] [CrossRef]
- Seibert, F.; Behrendt, C.; Schmidt, S.; Van der Giet, M.; Zidek, W.; Westhoff, T.H. Differential effects of cyclosporine and tacrolimus on arterial function. Transpl. Int. 2011, 24, 708–715. [Google Scholar] [CrossRef]
- Van Bortel, L.M.; Laurent, S.; Boutouyrie, P.; Chowienczyk, P.; Cruickshank, J.K.; De, B.T.; Filipovsky, J.; Huybrechts, S.; Mattace-Raso, F.U.; Protogerou, A.D.; et al. Expert consensus document on the measurement of aortic stiffness in daily practice using carotid-femoral pulse wave velocity. J. Hypertens. 2012, 30, 445–448. [Google Scholar] [CrossRef] [Green Version]
- Rovas, A.; Lukasz, A.H.; Vink, H.; Urban, M.; Sackarnd, J.; Pavenstädt, H.; Kümpers, P. Bedside analysis of the sublingual microvascular glycocalyx in the emergency room and intensive care unit-The GlycoNurse study. Scand. J. Trauma Resusc. Emerg. Med. 2018, 26, 16. [Google Scholar] [CrossRef] [PubMed]
- Lamoureux, F.; Mestre, E.; Essig, M.; Sauvage, F.L.; Marquet, P.; Gastinel, L.N. Quantitative proteomic analysis of cyclosporine-induced toxicity in a human kidney cell line and comparison with tacrolimus. J. Proteom. 2011, 75, 677–694. [Google Scholar] [CrossRef] [PubMed]
- Schütte-Nütgen, K.; Edeling, M.; Mendl, G.; Krahn, M.P.; Edemir, B.; Weide, T.; Kremerskothen, J.; Michgehl, U.; Pavenstadt, H. Getting a Notch closer to renal dysfunction: Activated Notch suppresses expression of the adaptor protein Disabled-2 in tubular epithelial cells. FASEB J. 2019, 33, 821–832. [Google Scholar] [CrossRef] [PubMed]
- Ciarimboli, G.; Holle, S.K.; Vollenbrocker, B.; Hagos, Y.; Reuter, S.; Burckhardt, G.; Bierer, S.; Herrmann, E.; Pavenstädt, H.; Rossi, R.; et al. New clues for nephrotoxicity induced by ifosfamide: Preferential renal uptake via the human organic cation transporter 2. Mol. Pharm. 2011, 8, 270–279. [Google Scholar] [CrossRef] [PubMed]
- Mosmann, T. Rapid colorimetric assay for cellular growth and survival: Application to proliferation and cytotoxicity assays. J. Immunol. Methods 1983, 65, 55–63. [Google Scholar] [CrossRef]
- Hryniewiecka, E.; Zegarska, J.; Zochowska, D.; Samborowska, E.; Jazwiec, R.; Kosieradzki, M.; Nazarewski, S.; Dadlez, M.; Pa, C.L. Dose-adjusted and dose/kg-adjusted concentrations of mycophenolic acid precursors reflect metabolic ratios of their metabolites in contrast to tacrolimus and cyclosporine. Biosci. Rep. 2019, 39, BSR20182031. [Google Scholar] [CrossRef]
- Tremblay, S.; Nigro, V.; Weinberg, J.; Woodle, E.S.; Alloway, R.R. A Steady-State Head-to-Head Pharmacokinetic Comparison of All FK-506 (Tacrolimus) Formulations (ASTCOFF): An Open-Label, Prospective, Randomized, Two-Arm, Three-Period Crossover Study. Am. J. Transplant. 2017, 17, 432–442. [Google Scholar] [CrossRef]
- Miura, M.; Satoh, S.; Niioka, T.; Kagaya, H.; Saito, M.; Hayakari, M.; Habuchi, T.; Suzuki, T. Early phase limited sampling strategy characterizing tacrolimus and mycophenolic acid pharmacokinetics adapted to the maintenance phase of renal transplant patients. Ther. Drug Monit. 2009, 31, 467–474. [Google Scholar] [CrossRef]
- Trofe-Clark, J.; Brennan, D.C.; West-Thielke, P.; Milone, M.C.; Lim, M.A.; Neubauer, R.; Nigro, V.; Bloom, R.D. Results of ASERTAA, a Randomized Prospective Crossover Pharmacogenetic Study of Immediate-Release Versus Extended-Release Tacrolimus in African American Kidney Transplant Recipients. Am. J. Kidney Dis. 2018, 71, 315–326. [Google Scholar] [CrossRef] [Green Version]
- Langone, A.; Steinberg, S.M.; Gedaly, R.; Chan, L.K.; Shah, T.; Sethi, K.D.; Nigro, V.; Morgan, J.C. Switching STudy of Kidney TRansplant PAtients with Tremor to LCP-TacrO (STRATO): An open-label, multicenter, prospective phase 3b study. Clin. Transplant. 2015, 29, 796–805. [Google Scholar] [CrossRef]
- Ikonomidis, I.; Voumvourakis, A.; Makavos, G.; Triantafyllidi, H.; Pavlidis, G.; Katogiannis, K.; Benas, D.; Vlastos, D.; Trivilou, P.; Varoudi, M.; et al. Association of impaired endothelial glycocalyx with arterial stiffness, coronary microcirculatory dysfunction, and abnormal myocardial deformation in untreated hypertensives. J. Clin. Hypertens. (Greenwich.) 2018, 20, 672–679. [Google Scholar] [CrossRef] [PubMed] [Green Version]
- Zaltzman, J.S. A comparison of short-term exposure of once-daily extended release tacrolimus and twice-daily cyclosporine on renal function in healthy volunteers. Transplantation 2010, 90, 1185–1191. [Google Scholar] [CrossRef] [PubMed]
- Goto, M.; Masuda, S.; Kiuchi, T.; Ogura, Y.; Oike, F.; Okuda, M.; Tanaka, K.; Inui, K. CYP3A5*1-carrying graft liver reduces the concentration/oral dose ratio of tacrolimus in recipients of living-donor liver transplantation. Pharmacogenetics 2004, 14, 471–478. [Google Scholar] [CrossRef] [PubMed]


| CNI Nephrotoxicity | x < 25% (n = 35) | x ≥ 25% (n = 20) | p-Value |
|---|---|---|---|
| Age (years, mean ± SD) | 57.8 ± 12.4 | 50.2 ± 20.2 | 0.014 a |
| Male sex, n (%) | 24 (68.6) | 12 (60) | 0.566 b |
| BMI (kg/m2, mean ± SD) | 25.5 ± 5.2 | 25.6 ± 5.3 | 0.981 a |
| Prednisolone dose (mg, mean ± SD) | 10.0 ± 6.3 | 14.9 ± 17.5 | 0.239 a |
| Living donor transplantation, n (%) | 26 (74.3) | 14 (70) | 0.761 b |
| ESP, n (%) | 9 (25.7) | 1 (5) | 0.075 b |
| Combined RTx + liver Tx, n (%) | 3 (8.6) | 1 (5) | 1 b |
| Previous Tx, n (%) | 3 (8.6) | 0 | 0.293 b |
| ABOi, n (%) | 4 (11.4) | 2 (10) | 1 b |
| CIT (hours, mean ± SD) | 9.2 ± 5.0 | 8.5 ± 5.0 | 0.669 a |
| WIT (min, mean ± SD) | 32.5 ± 8.1 | 32.5 ± 5.4 | 0.418 a |
| DGF | 11 (31.4) | 2 (10) | 0.107 b |
| Donor data | |||
| Male donor sex, n (%) | 13 (47,1) | 14 (70) | 0.026 b |
| Donor age (years, mean ± SD) | 61.1 ± 15.7 | 52.2±14.7 | 0.073 a |
| Time from RTx to biopsy (days) | 63 (3–2877) | 223 (10–5057) | 0.059 c |
| x < 25% (n = 35) | x ≥ 25% (n = 20) | p-Value | |
|---|---|---|---|
| Tac trough level (ng/mL ± SD) | 6.0 (3.1–15.1) | 5.8 (2.4–12.5) | 0.431 |
| Tac dose (mg, mean ± SD) | 5.0 (1.0–18.0) | 8.0 (3.0–16.0) | 0.009 |
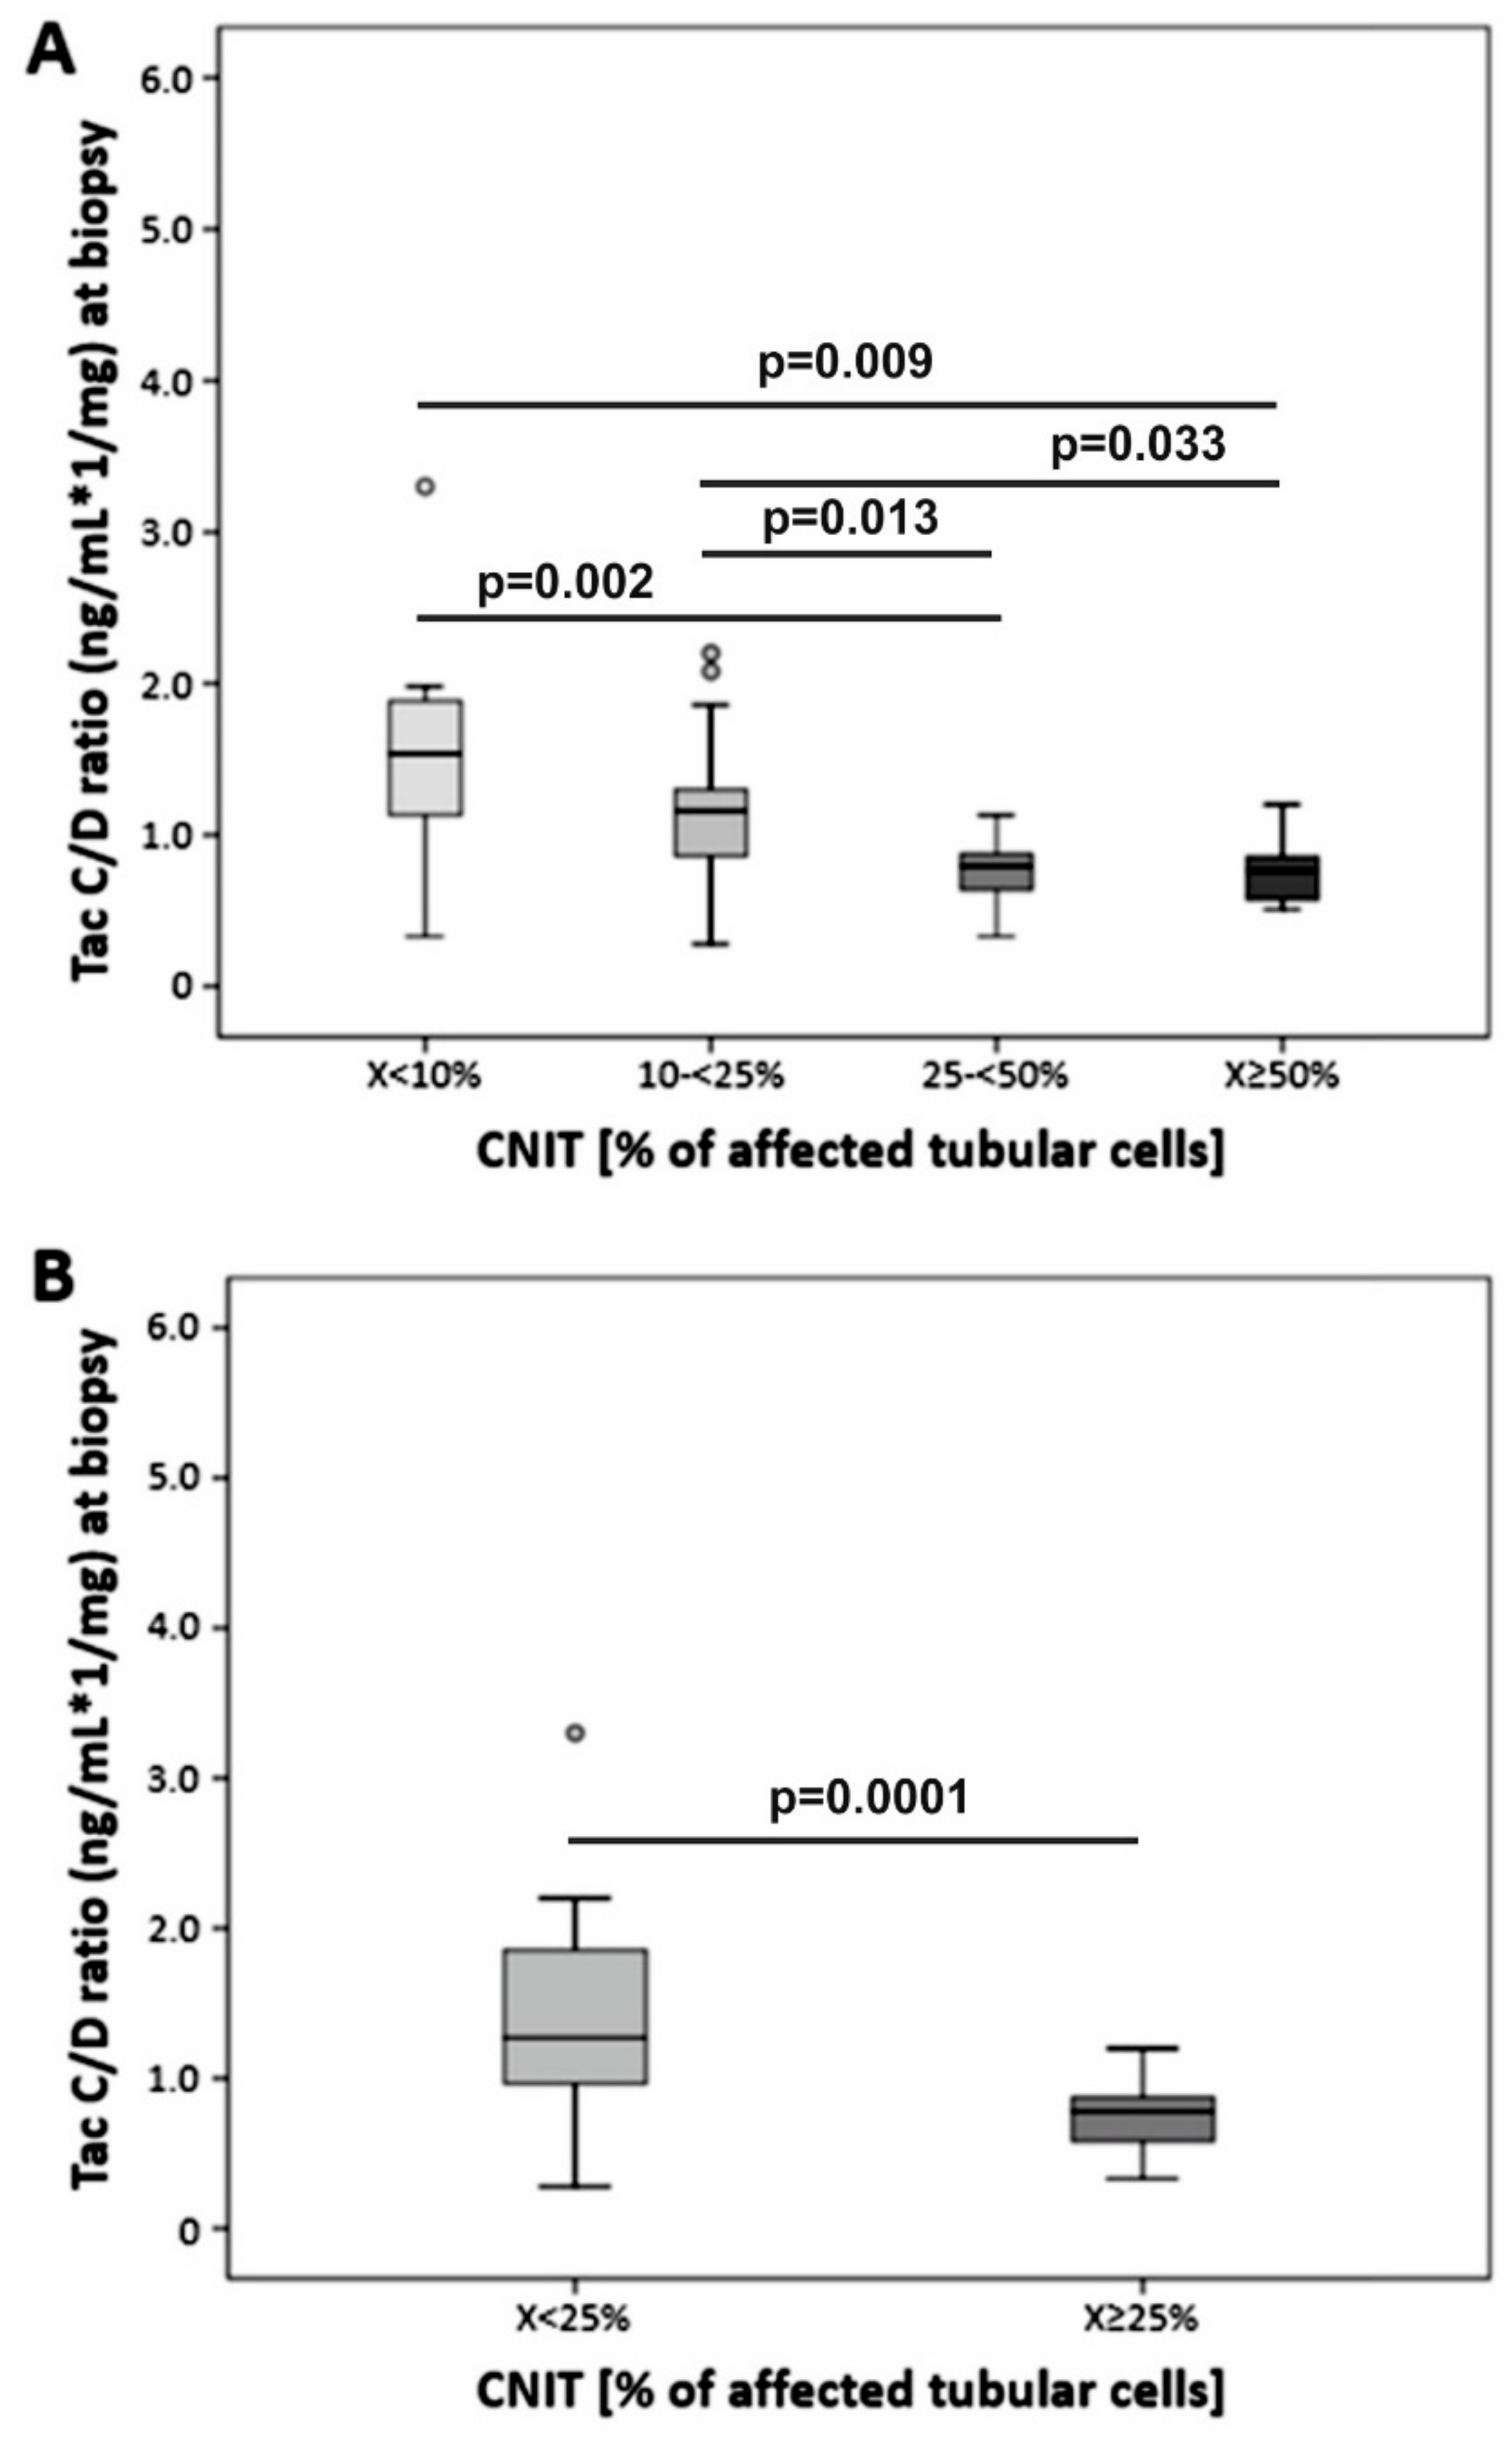
| C/D ratio, ng/mL×1/mg, median (min-max) | 1.27 (0.28–5.03) | 0.78 (0.33–1.20) | < 0.001 |
© 2019 by the authors. Licensee MDPI, Basel, Switzerland. This article is an open access article distributed under the terms and conditions of the Creative Commons Attribution (CC BY) license (http://creativecommons.org/licenses/by/4.0/).
Share and Cite
Thölking, G.; Schütte-Nütgen, K.; Schmitz, J.; Rovas, A.; Dahmen, M.; Bautz, J.; Jehn, U.; Pavenstädt, H.; Heitplatz, B.; Van Marck, V.; et al. A Low Tacrolimus Concentration/Dose Ratio Increases the Risk for the Development of Acute Calcineurin Inhibitor-Induced Nephrotoxicity. J. Clin. Med. 2019, 8, 1586. https://doi.org/10.3390/jcm8101586
Thölking G, Schütte-Nütgen K, Schmitz J, Rovas A, Dahmen M, Bautz J, Jehn U, Pavenstädt H, Heitplatz B, Van Marck V, et al. A Low Tacrolimus Concentration/Dose Ratio Increases the Risk for the Development of Acute Calcineurin Inhibitor-Induced Nephrotoxicity. Journal of Clinical Medicine. 2019; 8(10):1586. https://doi.org/10.3390/jcm8101586
Chicago/Turabian StyleThölking, Gerold, Katharina Schütte-Nütgen, Julia Schmitz, Alexandros Rovas, Maximilian Dahmen, Joachim Bautz, Ulrich Jehn, Hermann Pavenstädt, Barbara Heitplatz, Veerle Van Marck, and et al. 2019. "A Low Tacrolimus Concentration/Dose Ratio Increases the Risk for the Development of Acute Calcineurin Inhibitor-Induced Nephrotoxicity" Journal of Clinical Medicine 8, no. 10: 1586. https://doi.org/10.3390/jcm8101586
APA StyleThölking, G., Schütte-Nütgen, K., Schmitz, J., Rovas, A., Dahmen, M., Bautz, J., Jehn, U., Pavenstädt, H., Heitplatz, B., Van Marck, V., Suwelack, B., & Reuter, S. (2019). A Low Tacrolimus Concentration/Dose Ratio Increases the Risk for the Development of Acute Calcineurin Inhibitor-Induced Nephrotoxicity. Journal of Clinical Medicine, 8(10), 1586. https://doi.org/10.3390/jcm8101586