Impact of Body Composition Status on 90-Day Mortality in Cancer Patients with Septic Shock: Sex Differences in the Skeletal Muscle Index

 ,
,
Abstract
1. Introduction
2. Materials and Methods
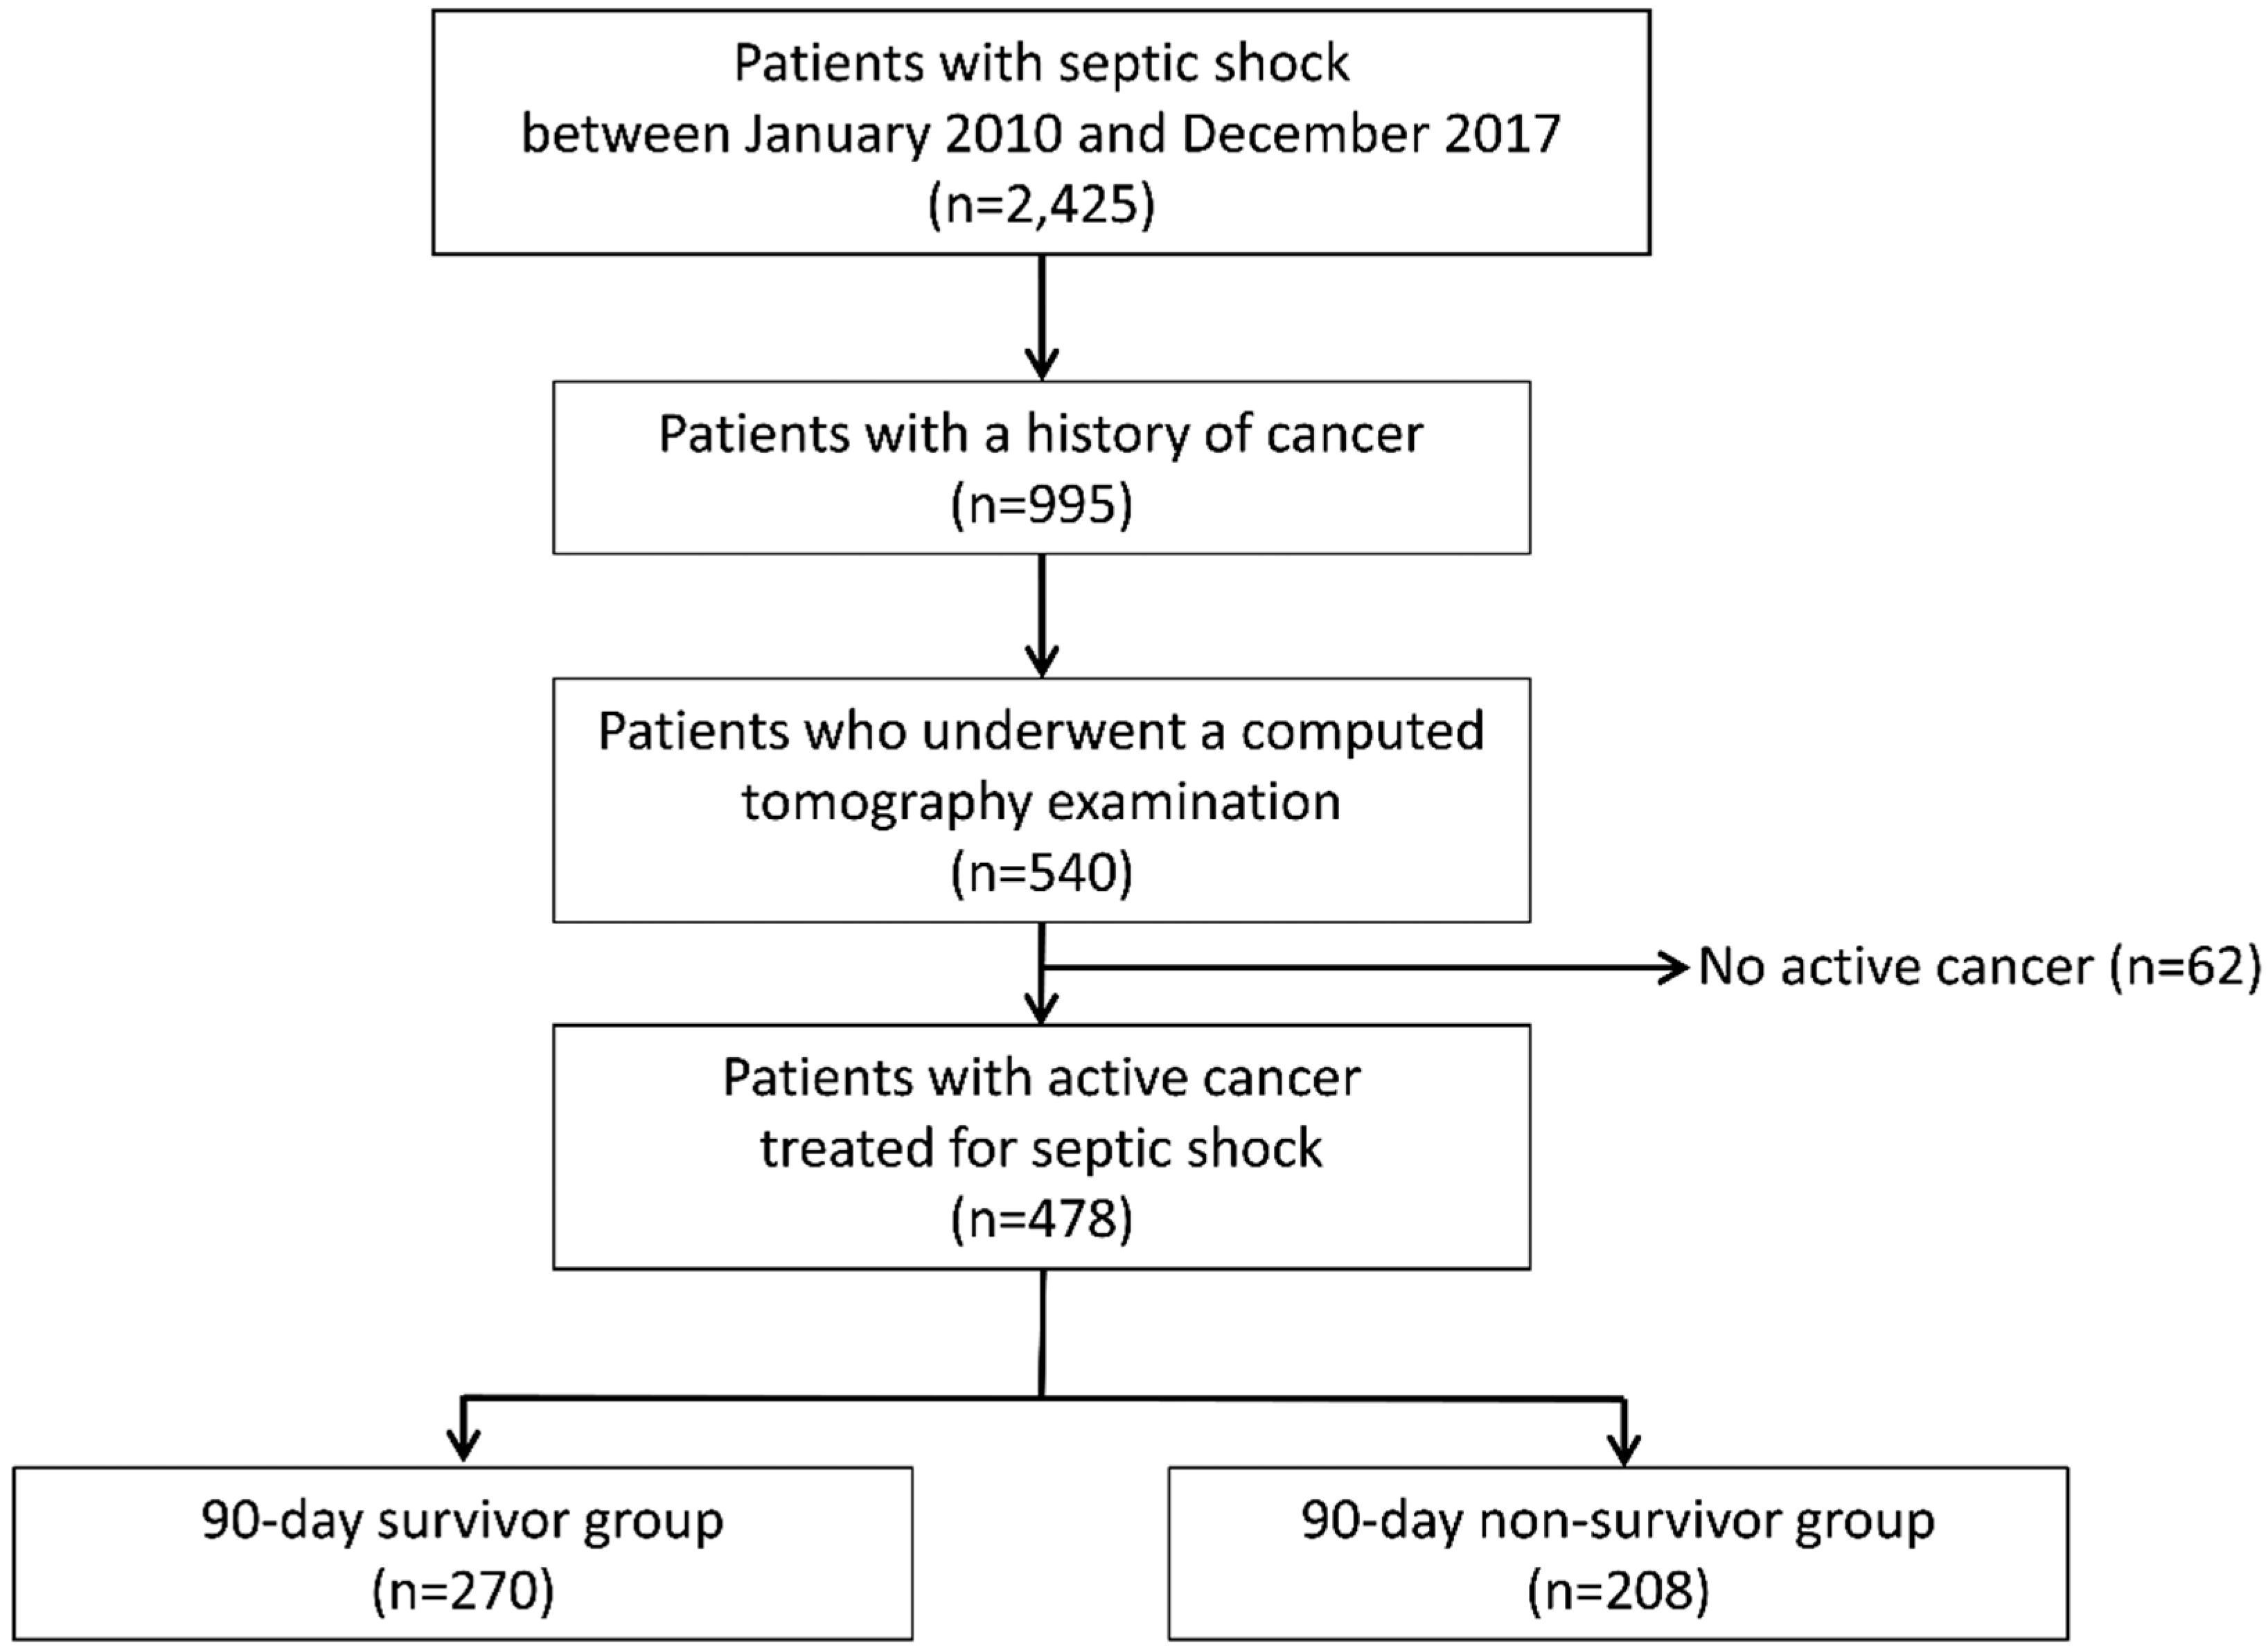
2.1. Study Design and Population
2.2. Data Collection
2.3. Statistical Analysis
3. Results
4. Discussion
5. Conclusions
Supplementary Materials
Author Contributions
Funding
Conflicts of Interest
References
- Puxty, K.; McLoone, P.; Quasim, T.; Sloan, B.; Kinsella, J.; Morrison, D.S. Risk of critical illness among patients with solid cancers: A population-based observational study. JAMA Oncol. 2015, 1, 1078–1085. [Google Scholar] [CrossRef] [PubMed]
- Legrand, M.; Max, A.; Peigne, V.; Mariotte, E.; Canet, E.; Debrumetz, A.; Lemiale, V.; Seguin, A.; Darmon, M.; Schlemmer, B. Survival in neutropenic patients with severe sepsis or septic shock. Crit. Care Med. 2012, 40, 43–49. [Google Scholar] [CrossRef] [PubMed]
- Williams, M.D.; Braun, L.A.; Cooper, L.M.; Johnston, J.; Weiss, R.V.; Qualy, R.L.; Linde-Zwirble, W. Hospitalized cancer patients with severe sepsis: Analysis of incidence, mortality, and associated costs of care. Crit. Care 2004, 8, R291. [Google Scholar] [CrossRef] [PubMed]
- Kim, Y.-J.; Jung, S.M.; Kang, J.; Ryoo, S.M.; Sohn, C.H.; Seo, D.-W.; Lim, K.S.; Huh, J.W.; Kim, S.-H.; Kim, W.Y. Risk factors for extended-spectrum beta-lactamase-producing Enterobacteriaceae infection causing septic shock in cancer patients with chemotherapy-induced febrile neutropenia. Intern. Emerg. Med. 2019, 14, 433–440. [Google Scholar] [CrossRef] [PubMed]
- Kim, Y.-J.; Kang, J.; Ryoo, S.M.; Ahn, S.; Huh, J.W.; Kim, W.Y. Platelet-Lymphocyte Ratio after Granulocyte Colony Stimulating Factor Administration: An Early Prognostic Marker in Septic Shock Patients with Chemotherapy-Induced Febrile Neutropenia. Shock 2019, 52, 160–165. [Google Scholar] [CrossRef] [PubMed]
- Pamoukdjian, F.; Bouillet, T.; Lévy, V.; Soussan, M.; Zelek, L.; Paillaud, E. Prevalence and predictive value of pre-therapeutic sarcopenia in cancer patients: A systematic review. Clin. Nutr. 2018, 37, 1101–1113. [Google Scholar] [CrossRef] [PubMed]
- Prado, C.M.; Lieffers, J.R.; McCargar, L.J.; Reiman, T.; Sawyer, M.B.; Martin, L.; Baracos, V.E. Prevalence and clinical implications of sarcopenic obesity in patients with solid tumours of the respiratory and gastrointestinal tracts: A population-based study. Lancet Oncol. 2008, 9, 629–635. [Google Scholar] [CrossRef]
- Shachar, S.S.; Williams, G.R.; Muss, H.B.; Nishijima, T.F. Prognostic value of sarcopenia in adults with solid tumours: A meta-analysis and systematic review. Eur. J. Cancer 2016, 57, 58–67. [Google Scholar] [CrossRef] [PubMed]
- Kazemi-Bajestani, S.M.R.; Mazurak, V.C.; Baracos, V. Computed tomography-defined muscle and fat wasting are associated with cancer clinical outcomes. Semin. Cell Dev. Biol. 2016, 54, 2–10. [Google Scholar] [CrossRef] [PubMed]
- Mintziras, I.; Miligkos, M.; Waechter, S.; Manoharan, J.; Maurer, E.; Bartsch, D.K. Sarcopenia and sarcopenic obesity are significantly associated with poorer overall survival in patients with pancreatic cancer: Systematic review and meta-analysis. Int. J. Surg. 2018. [Google Scholar] [CrossRef] [PubMed]
- Cruz-Jentoft, A.J.; Baeyens, J.P.; Bauer, J.M.; Boirie, Y.; Cederholm, T.; Landi, F.; Martin, F.C.; Michel, J.-P.; Rolland, Y.; Schneider, S.M.; et al. Sarcopenia: European consensus on definition and diagnosis: Report of the European Working Group on Sarcopenia in Older People. Age Ageing 2010, 39, 412–423. [Google Scholar] [CrossRef] [PubMed]
- Argiles, J.M.; Busquets, S.; Stemmler, B.; Lopez-Soriano, F.J. Cachexia and sarcopenia: Mechanisms and potential targets for intervention. Curr. Opin. Pharmacol. 2015, 22, 100–106. [Google Scholar] [CrossRef] [PubMed]
- Yoshida, T.; Delafontaine, P. Mechanisms of cachexia in chronic disease states. Am. J. Med Sci. 2015, 350, 250–256. [Google Scholar] [CrossRef] [PubMed]
- Sadeghi, M.; Keshavarz-Fathi, M.; Baracos, V.; Arends, J.; Mahmoudi, M.; Rezaei, N. Cancer cachexia: Diagnosis, assessment, and treatment. Crit. Rev. Oncol./Hematol. 2018, 127, 91–104. [Google Scholar] [CrossRef] [PubMed]
- Lucidi, C.; Lattanzi, B.; Di Gregorio, V.; Incicco, S.; D’ambrosio, D.; Venditti, M.; Riggio, O.; Merli, M. A low muscle mass increases mortality in compensated cirrhotic patients with sepsis. Liver Int. 2018, 38, 851–857. [Google Scholar] [CrossRef] [PubMed]
- Shibahashi, K.; Sugiyama, K.; Kashiura, M.; Hamabe, Y. Decreasing skeletal muscle as a risk factor for mortality in elderly patients with sepsis: A retrospective cohort study. J. Intensive Care 2017, 5, 8. [Google Scholar] [CrossRef]
- Ji, Y.; Cheng, B.; Xu, Z.; Ye, H.; Lu, W.; Luo, X.; Fu, S.; Fang, X. Impact of sarcopenic obesity on 30-day mortality in critically ill patients with intra-abdominal sepsis. J. Crit. Care 2018, 46, 50–54. [Google Scholar] [CrossRef] [PubMed]
- Martin, L.; Birdsell, L.; MacDonald, N.; Reiman, T.; Clandinin, M.T.; McCargar, L.J.; Murphy, R.; Ghosh, S.; Sawyer, M.B.; Baracos, V.E. Cancer cachexia in the age of obesity: Skeletal muscle depletion is a powerful prognostic factor, independent of body mass index. J. Clin. Oncol. 2013, 31, 1539–1547. [Google Scholar] [CrossRef]
- Dellinger, R.P.; Levy, M.M.; Rhodes, A.; Annane, D.; Gerlach, H.; Opal, S.M.; Sevransky, J.E.; Sprung, C.L.; Douglas, I.S.; Jaeschke, R. Surviving Sepsis Campaign: International guidelines for management of severe sepsis and septic shock, 2012. Intensive Care Med. 2013, 39, 165–228. [Google Scholar] [CrossRef]
- Casserly, B.; Phillips, G.S.; Schorr, C.; Dellinger, R.P.; Townsend, S.R.; Osborn, T.M.; Reinhart, K.; Selvakumar, N.; Levy, M.M. Lactate measurements in sepsis-induced tissue hypoperfusion: Results from the Surviving Sepsis Campaign database. Crit. Care Med. 2015, 43, 567–573. [Google Scholar] [CrossRef]
- Chae, B.-R.; Kim, Y.-J.; Lee, Y.-S. Prognostic accuracy of the sequential organ failure assessment (SOFA) and quick SOFA for mortality in cancer patients with sepsis defined by systemic inflammatory response syndrome (SIRS). Support. Care Cancer 2019, 1–7. [Google Scholar] [CrossRef] [PubMed]
- AsanJ-Morphometry. Available online: http://datasharing.aim-aicro.com/en/morphometry (accessed on 10 August 2019).
- Yip, C.; Dinkel, C.; Mahajan, A.; Siddique, M.; Cook, G.J.; Goh, V. Imaging body composition in cancer patients: Visceral obesity, sarcopenia and sarcopenic obesity may impact on clinical outcome. Insights Imaging 2015, 6, 489–497. [Google Scholar] [CrossRef] [PubMed]
- Organization, W.H. The Asia-Pacific Perspective: Redefining Obesity and Its Treatment; Health Communications Australia: Sydney, Australia, 2000. [Google Scholar]
- Muscaritoli, M.; Anker, S.; Argiles, J.; Aversa, Z.; Bauer, J.; Biolo, G.; Boirie, Y.; Bosaeus, I.; Cederholm, T.; Costelli, P. Consensus definition of sarcopenia, cachexia and pre-cachexia: Joint document elaborated by Special Interest Groups (SIG)“cachexia-anorexia in chronic wasting diseases” and “nutrition in geriatrics”. Clin. Nutr. 2010, 29, 154–159. [Google Scholar] [CrossRef] [PubMed]
- Prado, C.M.; Purcell, S.A.; Alish, C.; Pereira, S.L.; Deutz, N.E.; Heyland, D.K.; Goodpaster, B.H.; Tappenden, K.A.; Heymsfield, S.B. Implications of low muscle mass across the continuum of care: A narrative review. Ann. Med. 2018, 50, 675–693. [Google Scholar] [CrossRef] [PubMed]
- Purcell, S.; Elliott, S.; Baracos, V.; Chu, Q.; Prado, C. Key determinants of energy expenditure in cancer and implications for clinical practice. Eur. J. Clin. Nutr. 2016, 70, 1230. [Google Scholar] [CrossRef]
- Reisinger, K.W.; van Vugt, J.L.; Tegels, J.J.; Snijders, C.; Hulsewé, K.W.; Hoofwijk, A.G.; Stoot, J.H.; Von Meyenfeldt, M.F.; Beets, G.L.; Derikx, J.P. Functional compromise reflected by sarcopenia, frailty, and nutritional depletion predicts adverse postoperative outcome after colorectal cancer surgery. Ann. Surg. 2015, 261, 345–352. [Google Scholar] [CrossRef]
- Peterson, S.J.; Braunschweig, C.A. Prevalence of sarcopenia and associated outcomes in the clinical setting. Nutr. Clin. Pract. 2016, 31, 40–48. [Google Scholar] [CrossRef]
- Martin, C.M.; Hill, A.D.; Burns, K.; Chen, L.M. Characteristics and outcomes for critically ill patients with prolonged intensive care unit stays. Crit. Care Med. 2005, 33, 1922–1927. [Google Scholar] [CrossRef]
- Yoon, S.L.; Grundmann, O.; Williams, J.J.; Gordan, L.; George, T.J., Jr. Body composition changes differ by gender in stomach, colorectal, and biliary cancer patients with cachexia: Results from a pilot study. Cancer Med. 2018, 7, 3695–3703. [Google Scholar] [CrossRef]
- Montalvo, R.N.; Counts, B.R.; Carson, J.A. Understanding sex differences in the regulation of cancer-induced muscle wasting. Curr. Opin. Support. Palliat. Care 2018, 12, 394–403. [Google Scholar] [CrossRef]
- Blaak, E. Gender differences in fat metabolism. Curr. Opin. Clin. Nutr. Metab. Care 2001, 4, 499–502. [Google Scholar] [CrossRef] [PubMed]
- Haizlip, K.; Harrison, B.; Leinwand, L. Sex-based differences in skeletal muscle kinetics and fiber-type composition. Physiology 2015, 30, 30–39. [Google Scholar] [CrossRef] [PubMed]
- Bouffard, J.; Yang, C.; Begon, M.; Côté, J. Sex differences in kinematic adaptations to muscle fatigue induced by repetitive upper limb movements. Biol. Sex Differ. 2018, 9, 17. [Google Scholar] [CrossRef] [PubMed]
- Ciciliot, S.; Rossi, A.C.; Dyar, K.A.; Blaauw, B.; Schiaffino, S. Muscle type and fiber type specificity in muscle wasting. Int. J. Biochem. Cell Biol. 2013, 45, 2191–2199. [Google Scholar] [CrossRef] [PubMed]
- Schiaffino, S.; Reggiani, C. Fiber types in mammalian skeletal muscles. Physiol. Rev. 2011, 91, 1447–1531. [Google Scholar] [CrossRef] [PubMed]
- Stephens, N.A.; Gray, C.; MacDonald, A.J.; Tan, B.H.; Gallagher, I.J.; Skipworth, R.J.; Ross, J.A.; Fearon, K.C.; Greig, C.A. Sexual dimorphism modulates the impact of cancer cachexia on lower limb muscle mass and function. Clin. Nutr. 2012, 31, 499–505. [Google Scholar] [CrossRef] [PubMed]
- Choi, Y.; Oh, D.-Y.; Kim, T.-Y.; Lee, K.-H.; Han, S.-W.; Im, S.-A.; Kim, T.-Y.; Bang, Y.-J. Skeletal muscle depletion predicts the prognosis of patients with advanced pancreatic cancer undergoing palliative chemotherapy, independent of body mass index. PLoS ONE 2015, 10, e0139749. [Google Scholar] [CrossRef] [PubMed]
- Azoulay, E.; Schellongowski, P.; Darmon, M.; Bauer, P.R.; Benoit, D.; Depuydt, P.; Divatia, J.V.; Lemiale, V.; van Vliet, M.; Meert, A.-P. The Intensive Care Medicine research agenda on critically ill oncology and hematology patients. Intensive Care Med. 2017, 43, 1366–1382. [Google Scholar] [CrossRef]
- Shrime, M.G.; Ferket, B.S.; Scott, D.J.; Lee, J.; Barragan-Bradford, D.; Pollard, T.; Arabi, Y.M.; Al-Dorzi, H.M.; Baron, R.M.; Hunink, M.M. Time-limited trials of intensive care for critically ill patients with cancer: How long is long enough? JAMA Oncol. 2016, 2, 76–83. [Google Scholar] [CrossRef] [PubMed]
- Taaffe, D.R.; Cauley, J.A.; Danielson, M.; Nevitt, M.C.; Lang, T.F.; Bauer, D.C.; Harris, T.B. Race and sex effects on the association between muscle strength, soft tissue, and bone mineral density in healthy elders: The Health, Aging, and Body Composition Study. J. Bone Miner. Res. 2001, 16, 1343–1352. [Google Scholar] [CrossRef]


| Characteristics | Overall patients (n = 478) | Survivors (n = 270) | Non-survivors (n = 208) | P-Value |
|---|---|---|---|---|
| Age, years | 65.0 (58.0–72.0) | 65.0 (58.0–72.0) | 65.0 (58.0–72.0) | 0.848 |
| Male | 297 (62.1%) | 171 (63.3%) | 126 (60.6%) | 0.538 |
| Comorbidities | ||||
| Hypertension | 169 (35.4%) | 94 (34.8%) | 75 (36.1%) | 0.778 |
| Diabetes mellitus | 124 (25.9%) | 71 (26.3%) | 53 (25.5%) | 0.840 |
| Type of solid cancer | 0.219 | |||
| Hepatobiliary | 247 (51.7%) | 137 (50.7%) | 110 (52.9%) | |
| Gastrointestinal | 91 (19.0%) | 52 (19.3%) | 39 (18.8%) | |
| Gynecologic | 48 (10.0%) | 33 (12.2%) | 15 (7.2%) | |
| Lung | 31 (6.5%) | 13 (4.8%) | 18 (8.7%) | |
| Others | 61 (12.8%) | 35 (13.0%) | 26 (12.5%) | |
| Focus of infection | 0.029 | |||
| Hepatobiliary | 243 (50.8%) | 136 (50.4%) | 107 (51.4%) | |
| Respiratory | 63 (13.2%) | 27 (10.0%) | 36 (17.3%) | |
| Others | 172 (36.0%) | 107 (39.6%) | 65 (31.3%) | |
| SOFA score | 7.0 (5.0–10.0) | 7.0 (5.0–9.0) | 7.0 (5.0–10.0) | 0.225 |
| Body Composition | Overall | Survivors | Non-Survivors | P-Value |
|---|---|---|---|---|
| Overall patients | ||||
| Number | 478 | 270 | 208 | |
| BMI, kg/m2 | 22.0 (19.6–24.3) | 22.1 (20.0–24.4) | 21.7 (19.4–24.1) | 0.292 |
| SFA, cm2 | 89.40 (53.71–144.18) | 95.14 (59.25–148.25) | 85.35 (49.35–140.31) | 0.154 |
| VFA, cm2 | 95.29 (56.96–134.44) | 100.06 (58.06–140.23) | 89.78 (54.16–128.66) | 0.212 |
| SMA, cm2 | 89.64 (73.46–107.68) | 93.32 (76.67–111.42) | 84.88 (71.23–102.26) | 0.002 |
| SMI, cm2/m2 | 34.54 (7.58) | 35.48 (7.54) | 33.32 (7.48) | 0.002 |
| Skeletal muscle attenuation, HU | 34.51 (6.94) | 35.40 (6.76) | 33.36 (7.00) | 0.001 |
| VFA/SFA ratio | 1.07 (0.72–1.67) | 1.04 (0.69–1.61) | 1.13 (0.73–1.73) | 0.306 |
| Obesity | 90 (18.8%) | 50 (18.5%) | 40 (19.2%) | 0.843 |
| Muscle depletion | 419 (87.7%) | 231 (85.6%) | 188 (90.4%) | 0.112 |
| Low skeletal muscle attenuation | 202 (42.3%) | 102 (37.8%) | 100 (48.1%) | 0.024 |
| Male | ||||
| Number | 297 | 171 | 126 | |
| BMI, kg/m2 | 21.8 (19.4–23.8) | 21.9 (19.5–23.7) | 21.3 (19.1–23.9) | 0.401 |
| SFA, cm2 | 73.65 (44.88–118.68) | 78.03 (51.38–118.13) | 67.90 (36.83–119.54) | 0.133 |
| VFA, cm2 | 100.49 (55.09–148.09) | 105.23 (57.61–152.68) | 95.75 (53.24–143.99) | 0.573 |
| SMA, cm2 | 99.51 (85.99–115.74) | 106.01 (90.99–118.78) | 93.12 (82.32–110.71) | 0.002 |
| SMI, cm2/m2 | 36.55 (7.64) | 37.55 (7.40) | 35.18 (7.79) | 0.008 |
| Skeletal muscle attenuation, HU | 36.33 (6.75) | 37.51 (6.08) | 34.72 (7.30) | <0.001 |
| VFA/SFA ratio | 1.33 (1.00–1.96) | 1.30 (0.93–1.93) | 1.42 (1.07–2.03) | 0.083 |
| Obesity | 45 (15.2%) | 24 (14.0%) | 21 (16.7%) | 0.532 |
| Muscle depletion | 247 (83.2%) | 138 (80.7%) | 109 (86.5%) | 0.186 |
| Low skeletal muscle attenuation | 105 (35.4%) | 51 (29.8%) | 54 (42.9%) | 0.020 |
| Female | ||||
| Number | 181 | 99 | 82 | |
| BMI, kg/m2 | 22.8 (3.9) | 23.0 (4.0) | 22.6 (3.8) | 0.496 |
| SFA, cm2 | 132.92 (75.82) | 137.64 (75.26) | 127.22 (76.57) | 0.359 |
| VFA, cm2 | 92.93 (49.68) | 97.95 (54.30) | 86.85 (42.99) | 0.135 |
| SMA, cm2 | 74.27 (15.61) | 75.66 (15.47) | 72.59 (15.72) | 0.190 |
| SMI, cm2/m2 | 31.25 (6.21) | 31.91 (6.37) | 30.45 (5.96) | 0.116 |
| Skeletal muscle attenuation, HU | 31.52 (6.17) | 31.73 (6.33) | 31.27 (5.99) | 0.613 |
| VFA/SFA ratio | 0.74 (0.52–0.96) | 0.75 (0.52–1.00) | 0.74 (0.51–0.95) | 0.782 |
| Obesity | 45 (24.9%) | 26 (26.3%) | 19 (23.2%) | 0.632 |
| Muscle depletion | 172 (95.0%) | 93 (93.9%) | 79 (96.3%) | 0.515 |
| Low skeletal muscle attenuation | 97 (53.6%) | 51 (51.5%) | 46 (56.1%) | 0.538 |
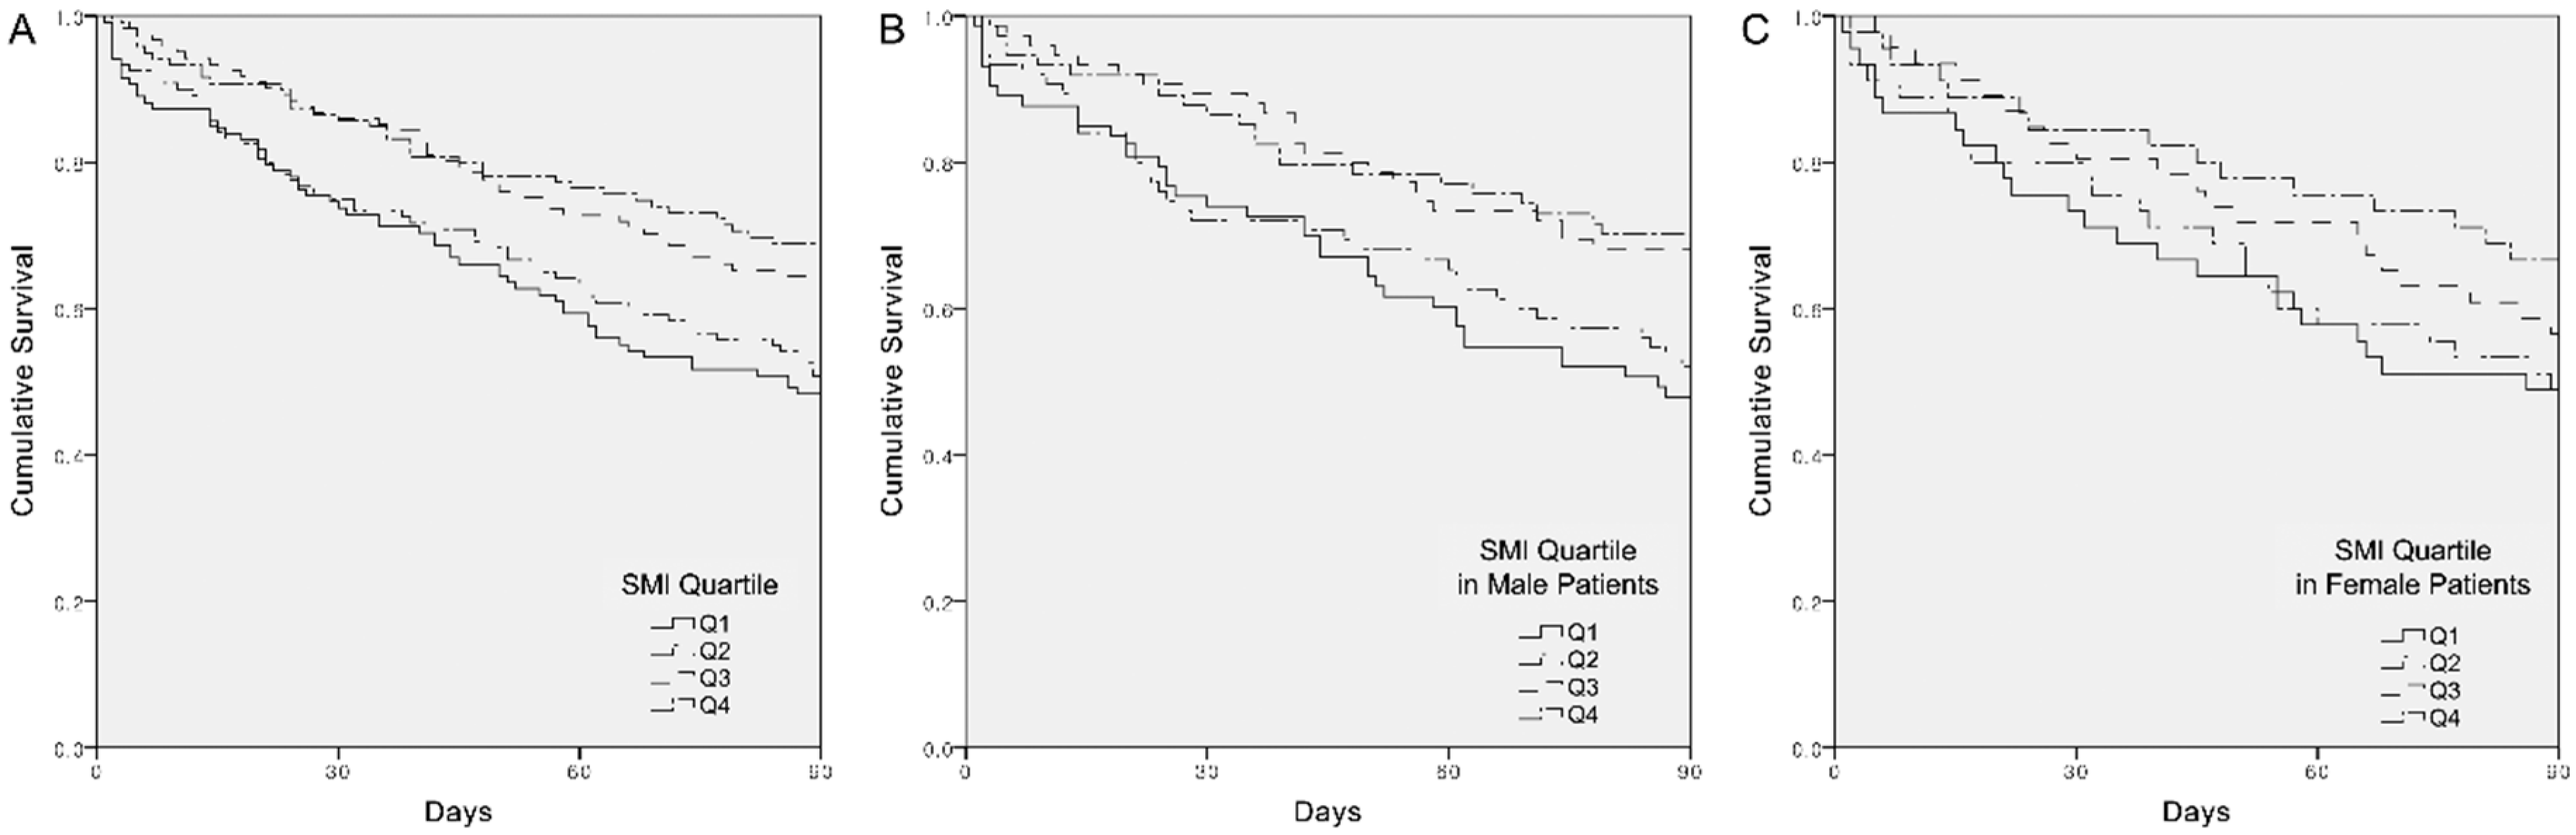
| Population | HR (95% CI) | P-Value | Multivariable-Adjusted HR (95% CI) | P-Value |
|---|---|---|---|---|
| Overall population | ||||
| Q1 | Reference | Reference | ||
| Q2 | 0.920 (0.645–1.312) | 0.646 | 0.958 (0.667–1.376) | 0.817 |
| Q3 | 0.620 (0.423–0.908) | 0.014 | 0.644 (0.438–0.946) | 0.025 |
| Q4 | 0.539 (0.362–0.802) | 0.002 | 0.559 (0.373–0.837) | 0.005 |
| Male | ||||
| Q1 (<31.03) | Reference | Reference | ||
| Q2 (31.03–36.45) | 0.894 (0.570–1.402) | 0.627 | 0.950 (0.598–1.511) | 0.829 |
| Q3 (36.46–42.06) | 0.527 (0.319–0.871) | 0.012 | 0.539 (0.324–0.895) | 0.017 |
| Q4 (>42.06) | 0.534 (0.323–0.883) | 0.014 | 0.577 (0.344–0.967) | 0.037 |
| Female | ||||
| Q1 (<27.22) | Reference | Reference | ||
| Q2 (27.22–31.35) | 0.970 (0.544–1.729) | 0.917 | 0.840 (0.452–1.561) | 0.581 |
| Q3 (31.36–35.47) | 0.787 (0.435–1.421) | 0.426 | 0.614 (0.314–1.199) | 0.153 |
| Q4 (>35.47) | 0.549 (0.286–1.053) | 0.071 | 0.418 (0.204–0.856) | 0.017 |
© 2019 by the authors. Licensee MDPI, Basel, Switzerland. This article is an open access article distributed under the terms and conditions of the Creative Commons Attribution (CC BY) license (http://creativecommons.org/licenses/by/4.0/).
Share and Cite
Kim, Y.-J.; Seo, D.-W.; Kang, J.; Huh, J.W.; Kim, K.W.; Kim, W.Y. Impact of Body Composition Status on 90-Day Mortality in Cancer Patients with Septic Shock: Sex Differences in the Skeletal Muscle Index. J. Clin. Med. 2019, 8, 1583. https://doi.org/10.3390/jcm8101583
Kim Y-J, Seo D-W, Kang J, Huh JW, Kim KW, Kim WY. Impact of Body Composition Status on 90-Day Mortality in Cancer Patients with Septic Shock: Sex Differences in the Skeletal Muscle Index. Journal of Clinical Medicine. 2019; 8(10):1583. https://doi.org/10.3390/jcm8101583
Chicago/Turabian StyleKim, Youn-Jung, Dong-Woo Seo, Jihoon Kang, Jin Won Huh, Kyung Won Kim, and Won Young Kim. 2019. "Impact of Body Composition Status on 90-Day Mortality in Cancer Patients with Septic Shock: Sex Differences in the Skeletal Muscle Index" Journal of Clinical Medicine 8, no. 10: 1583. https://doi.org/10.3390/jcm8101583
APA StyleKim, Y.-J., Seo, D.-W., Kang, J., Huh, J. W., Kim, K. W., & Kim, W. Y. (2019). Impact of Body Composition Status on 90-Day Mortality in Cancer Patients with Septic Shock: Sex Differences in the Skeletal Muscle Index. Journal of Clinical Medicine, 8(10), 1583. https://doi.org/10.3390/jcm8101583