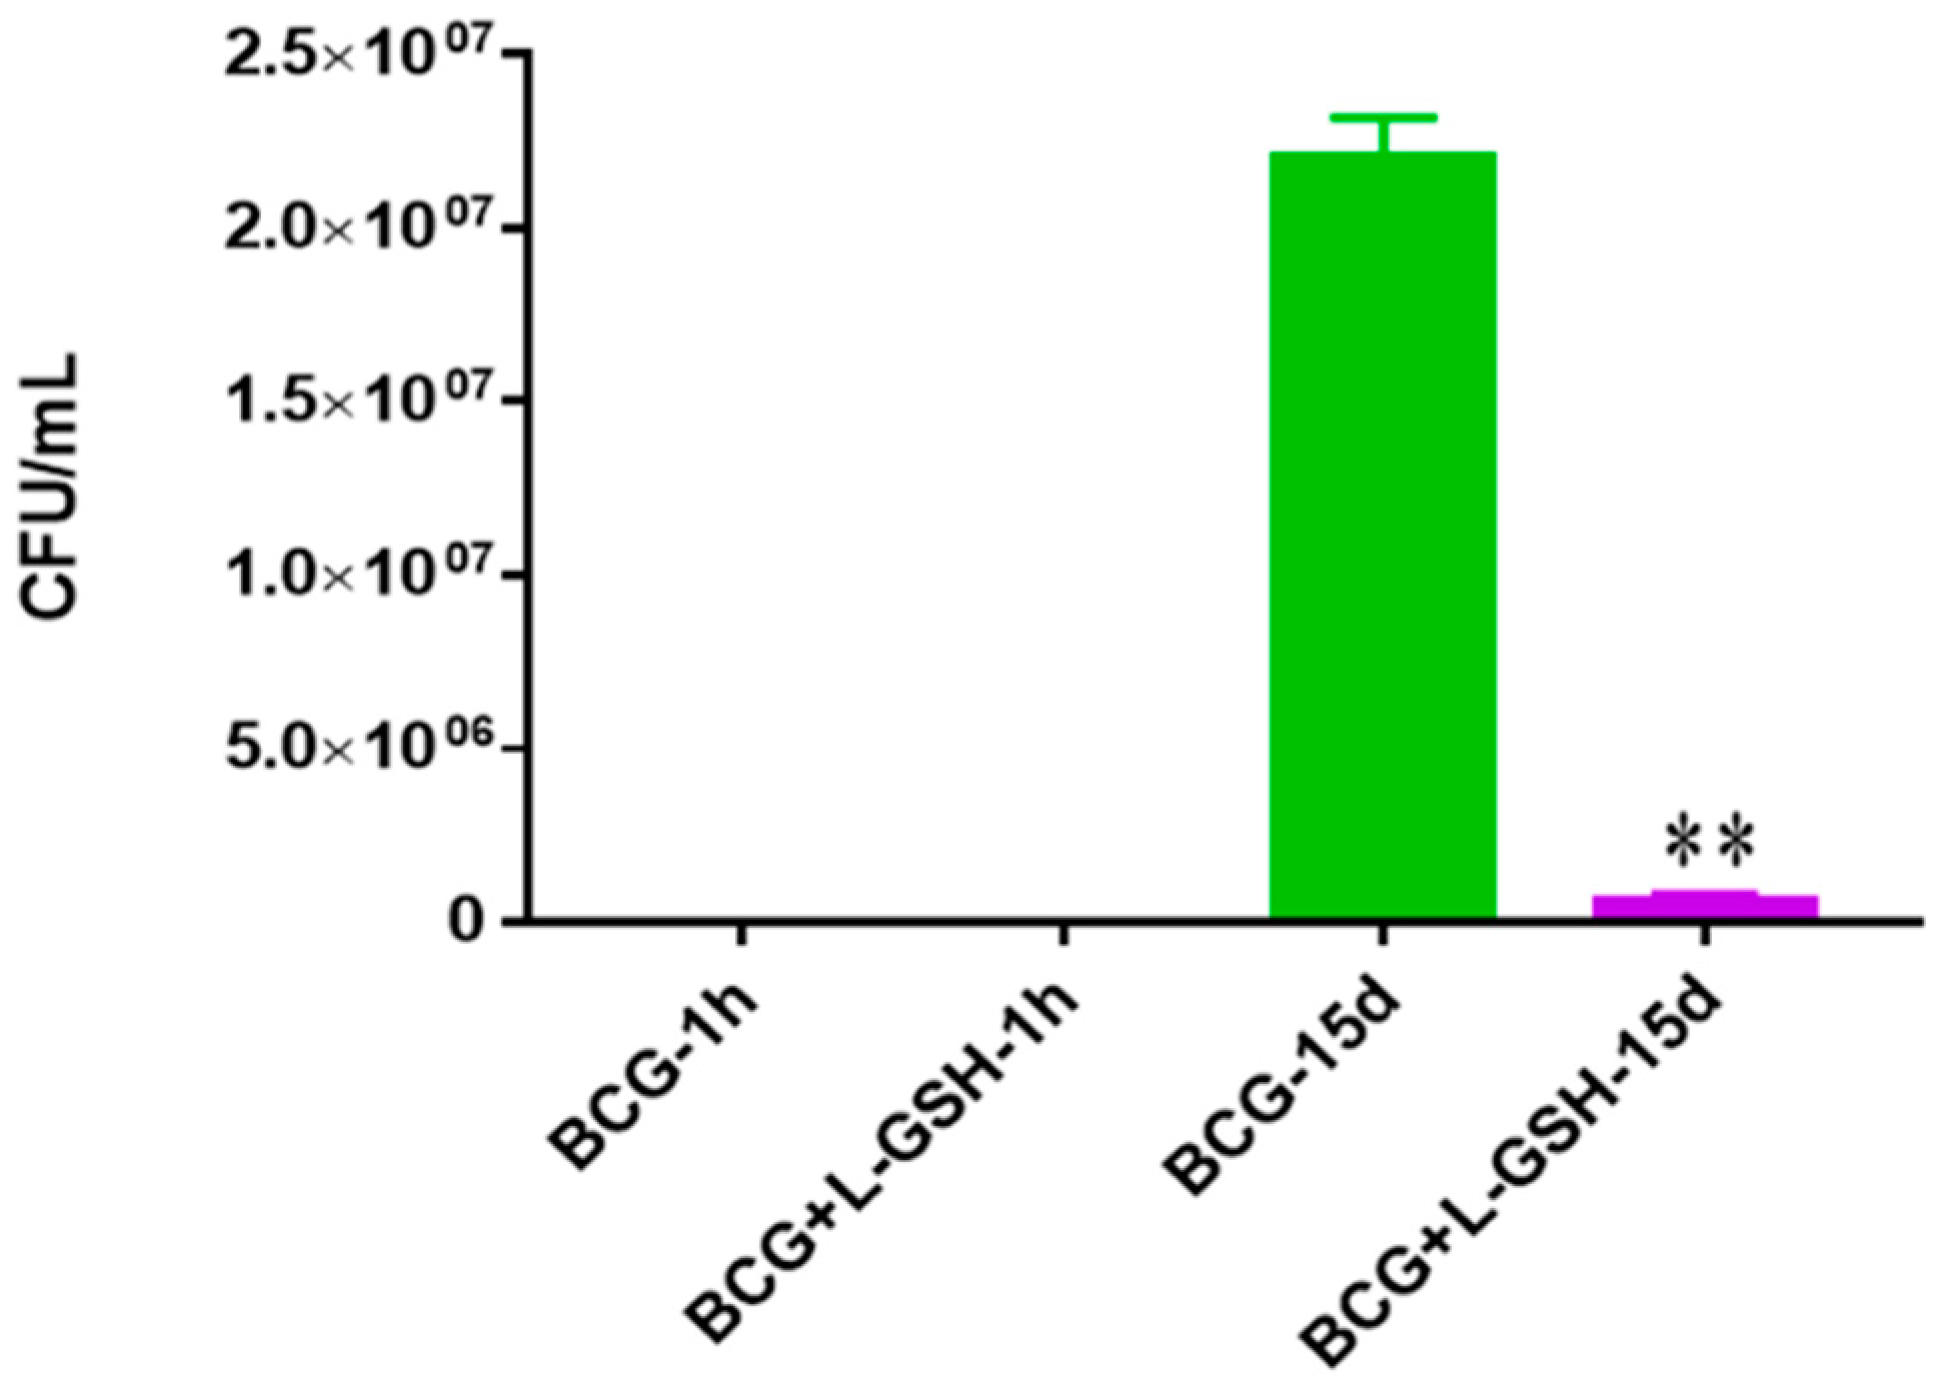
Figure 1.
Survival of BCG in 7H9. This experiment was done in order to determine direct killing effects of L-GSH on BCG without the help of immune cells present. M. bovis BCG was grown in 7H9 in the presence and absence of L-GSH (40 μM), the same concentration of L-GSH used in treatment of granulomas from healthy and T2DM individuals. There was a significant reduction of bacterial numbers when treated with L-GSH at 15 days. Data represent means ± SE from 2 trials and plating each multiple times. ** p < 0.005 when comparing L-GSH treated samples to untreated samples at 15 days.
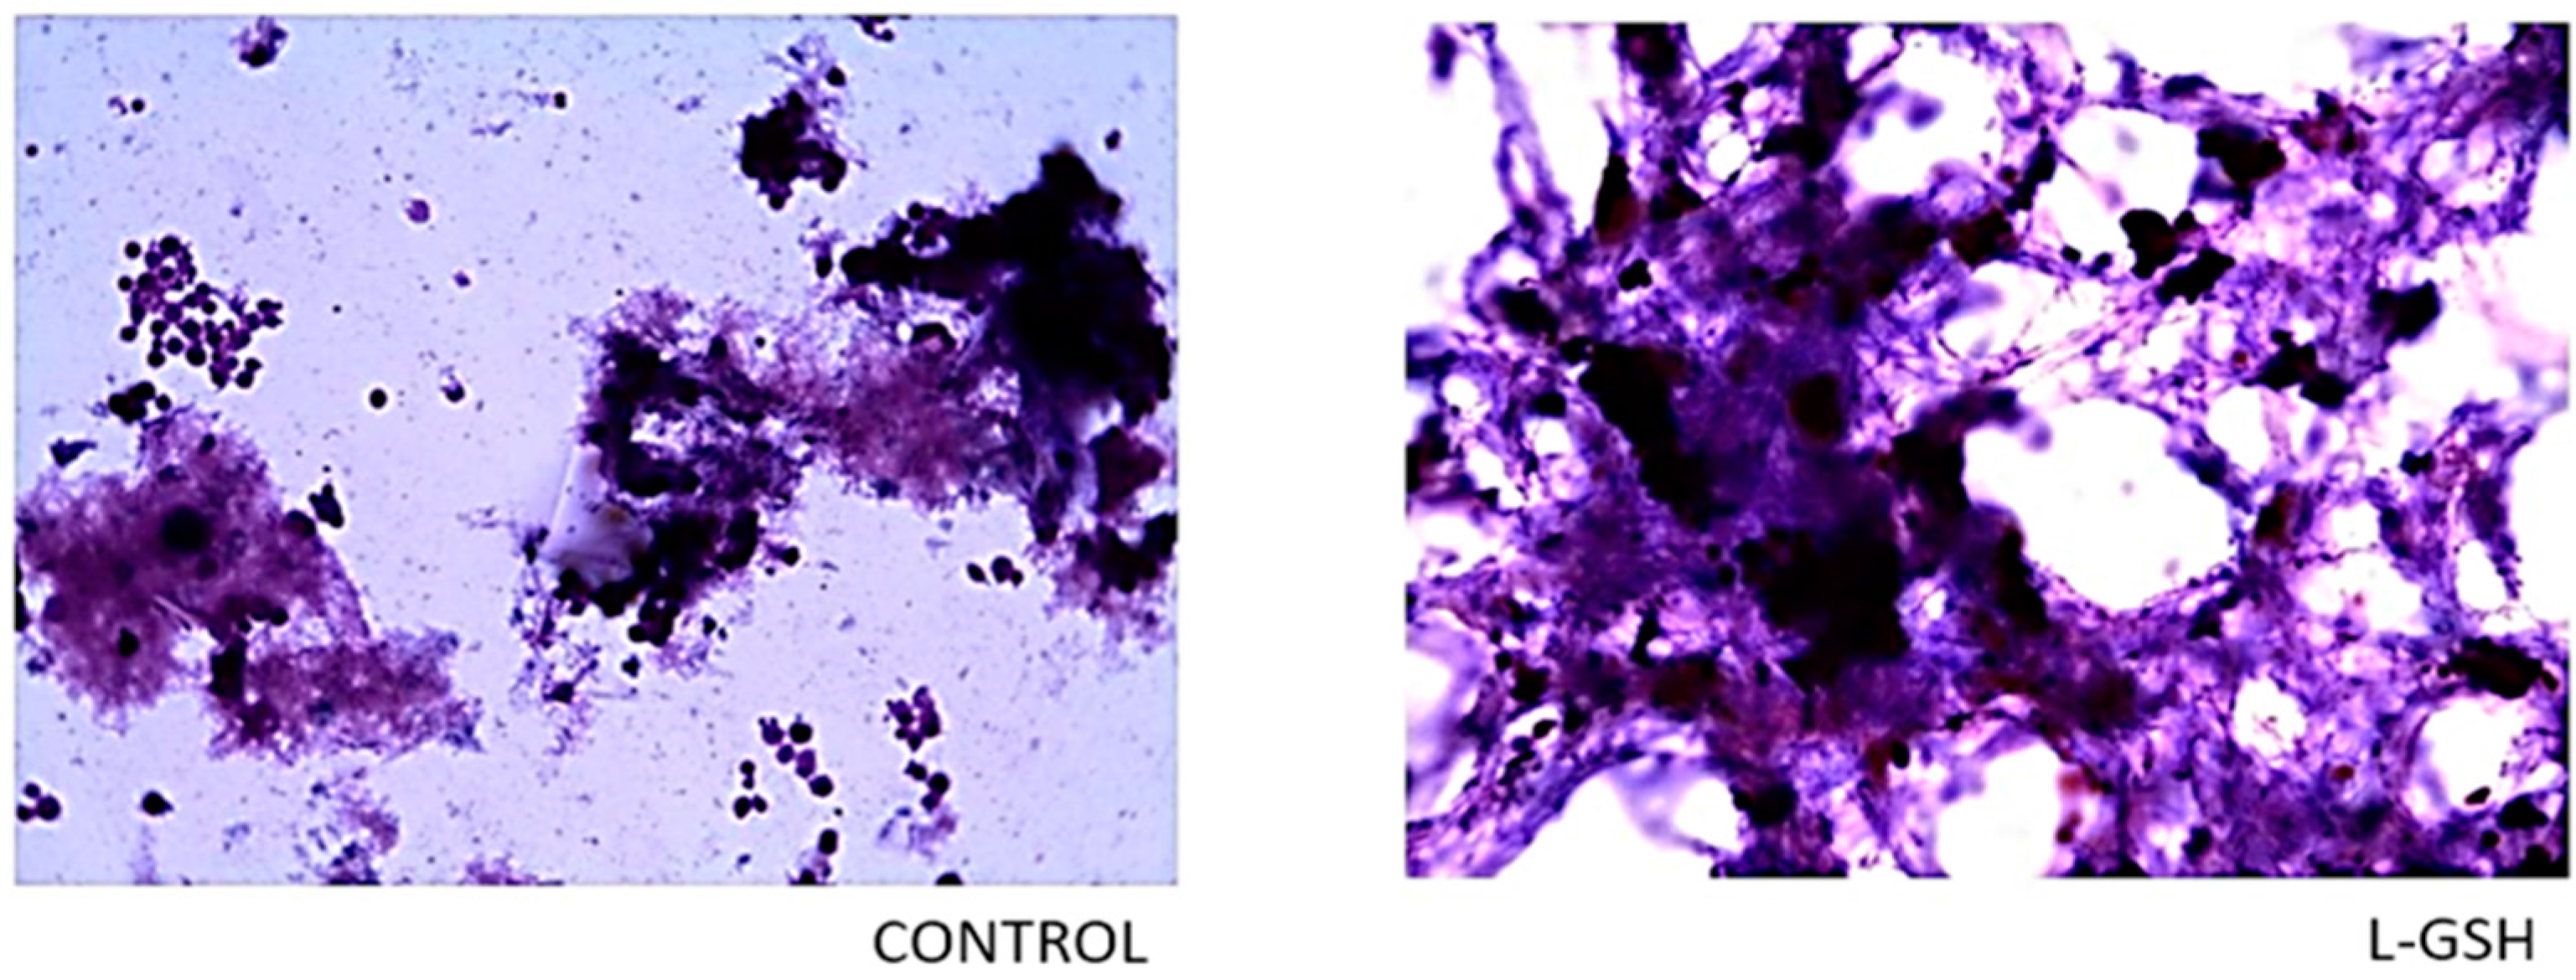
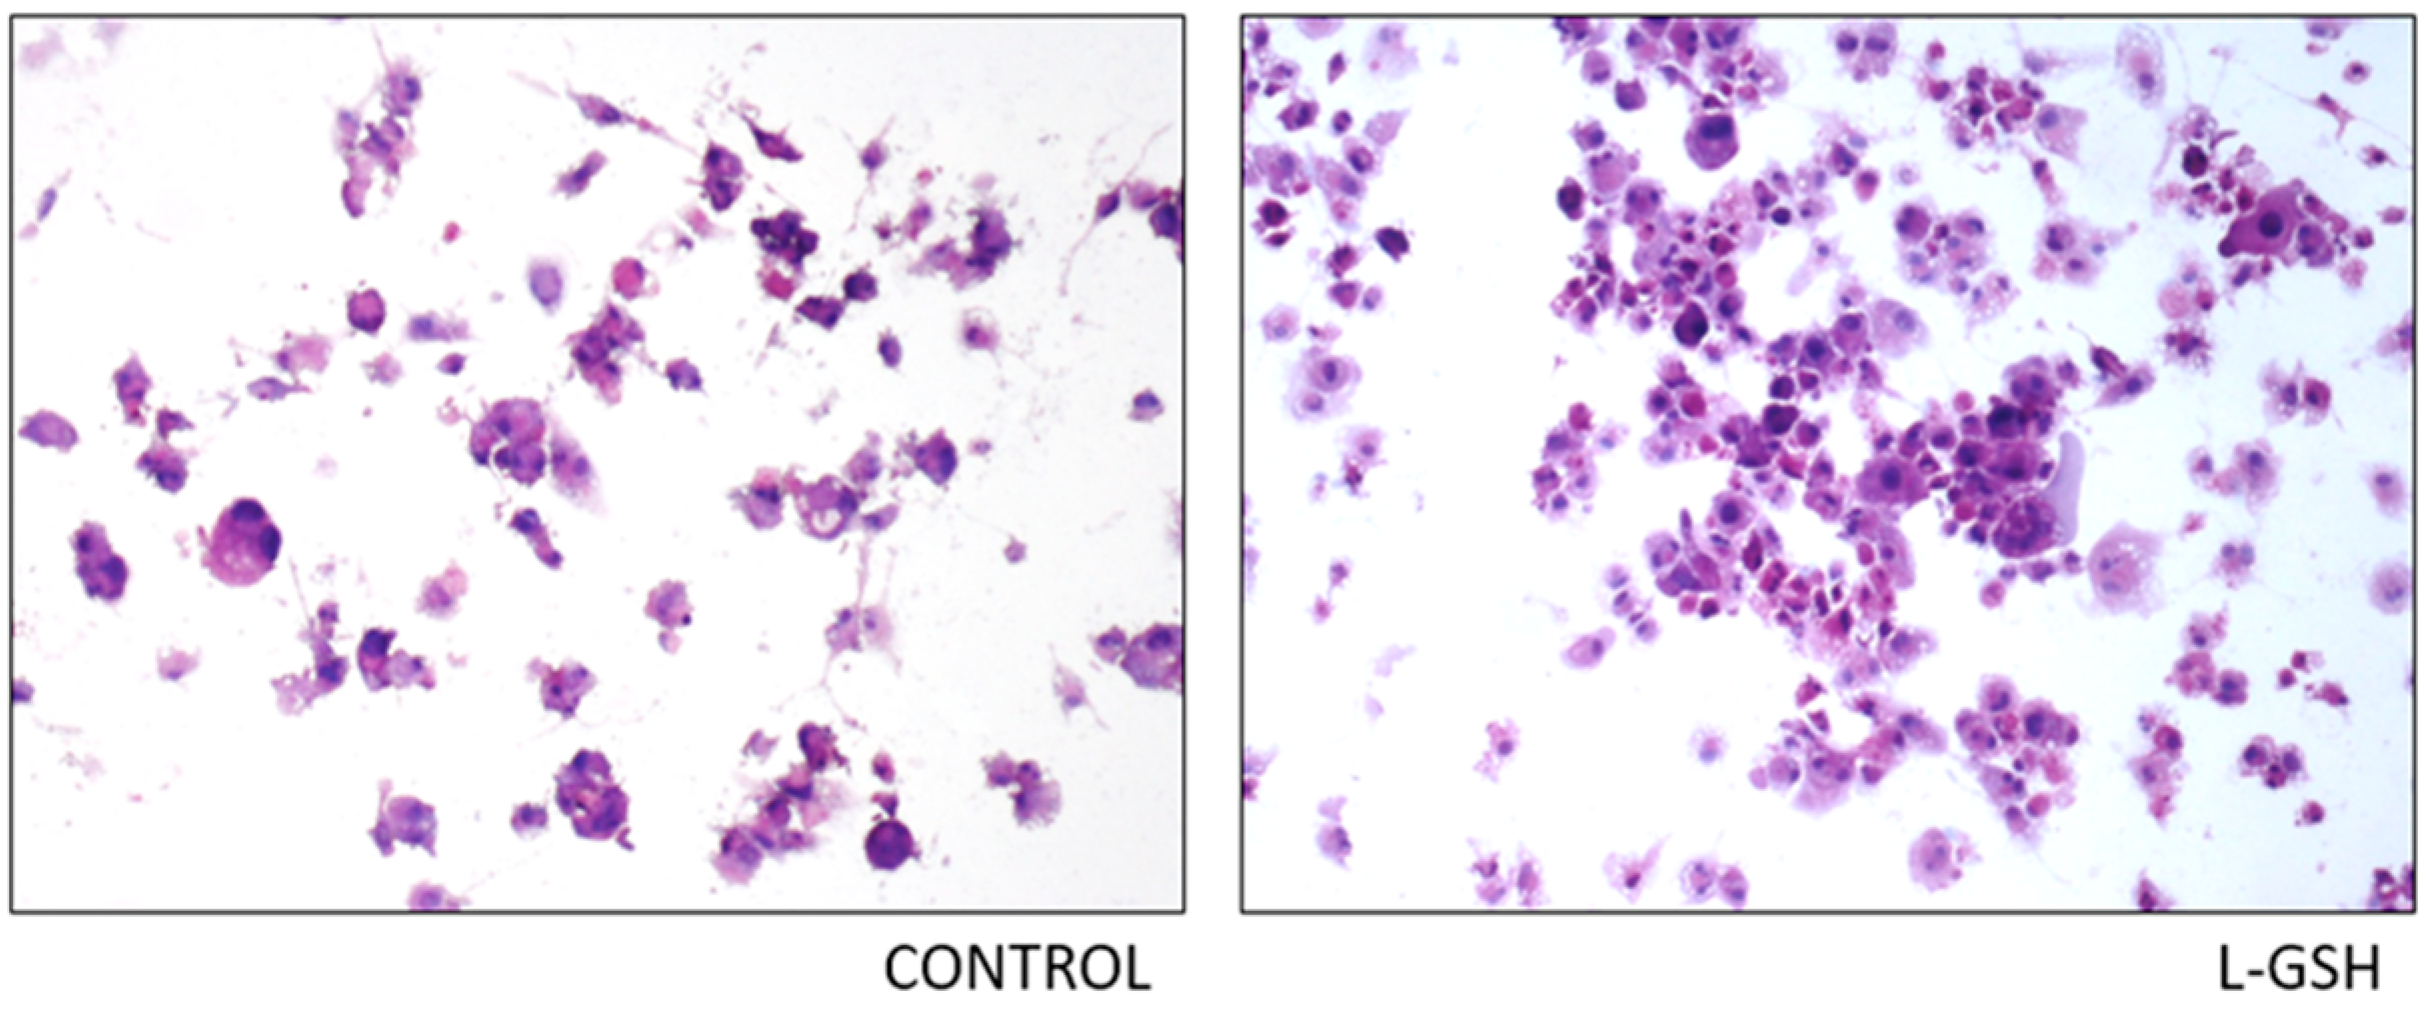
Figure 2.
Hematoxylin and eosin staining of granulomas from healthy individuals infected with BCG. Histological staining of granulomas from healthy individuals’ PBMCs infected with BCG showed a more organized structure when treated with L-GSH. Microscopy work was done with a light microscope at 1000 × magnification under oil immersion.
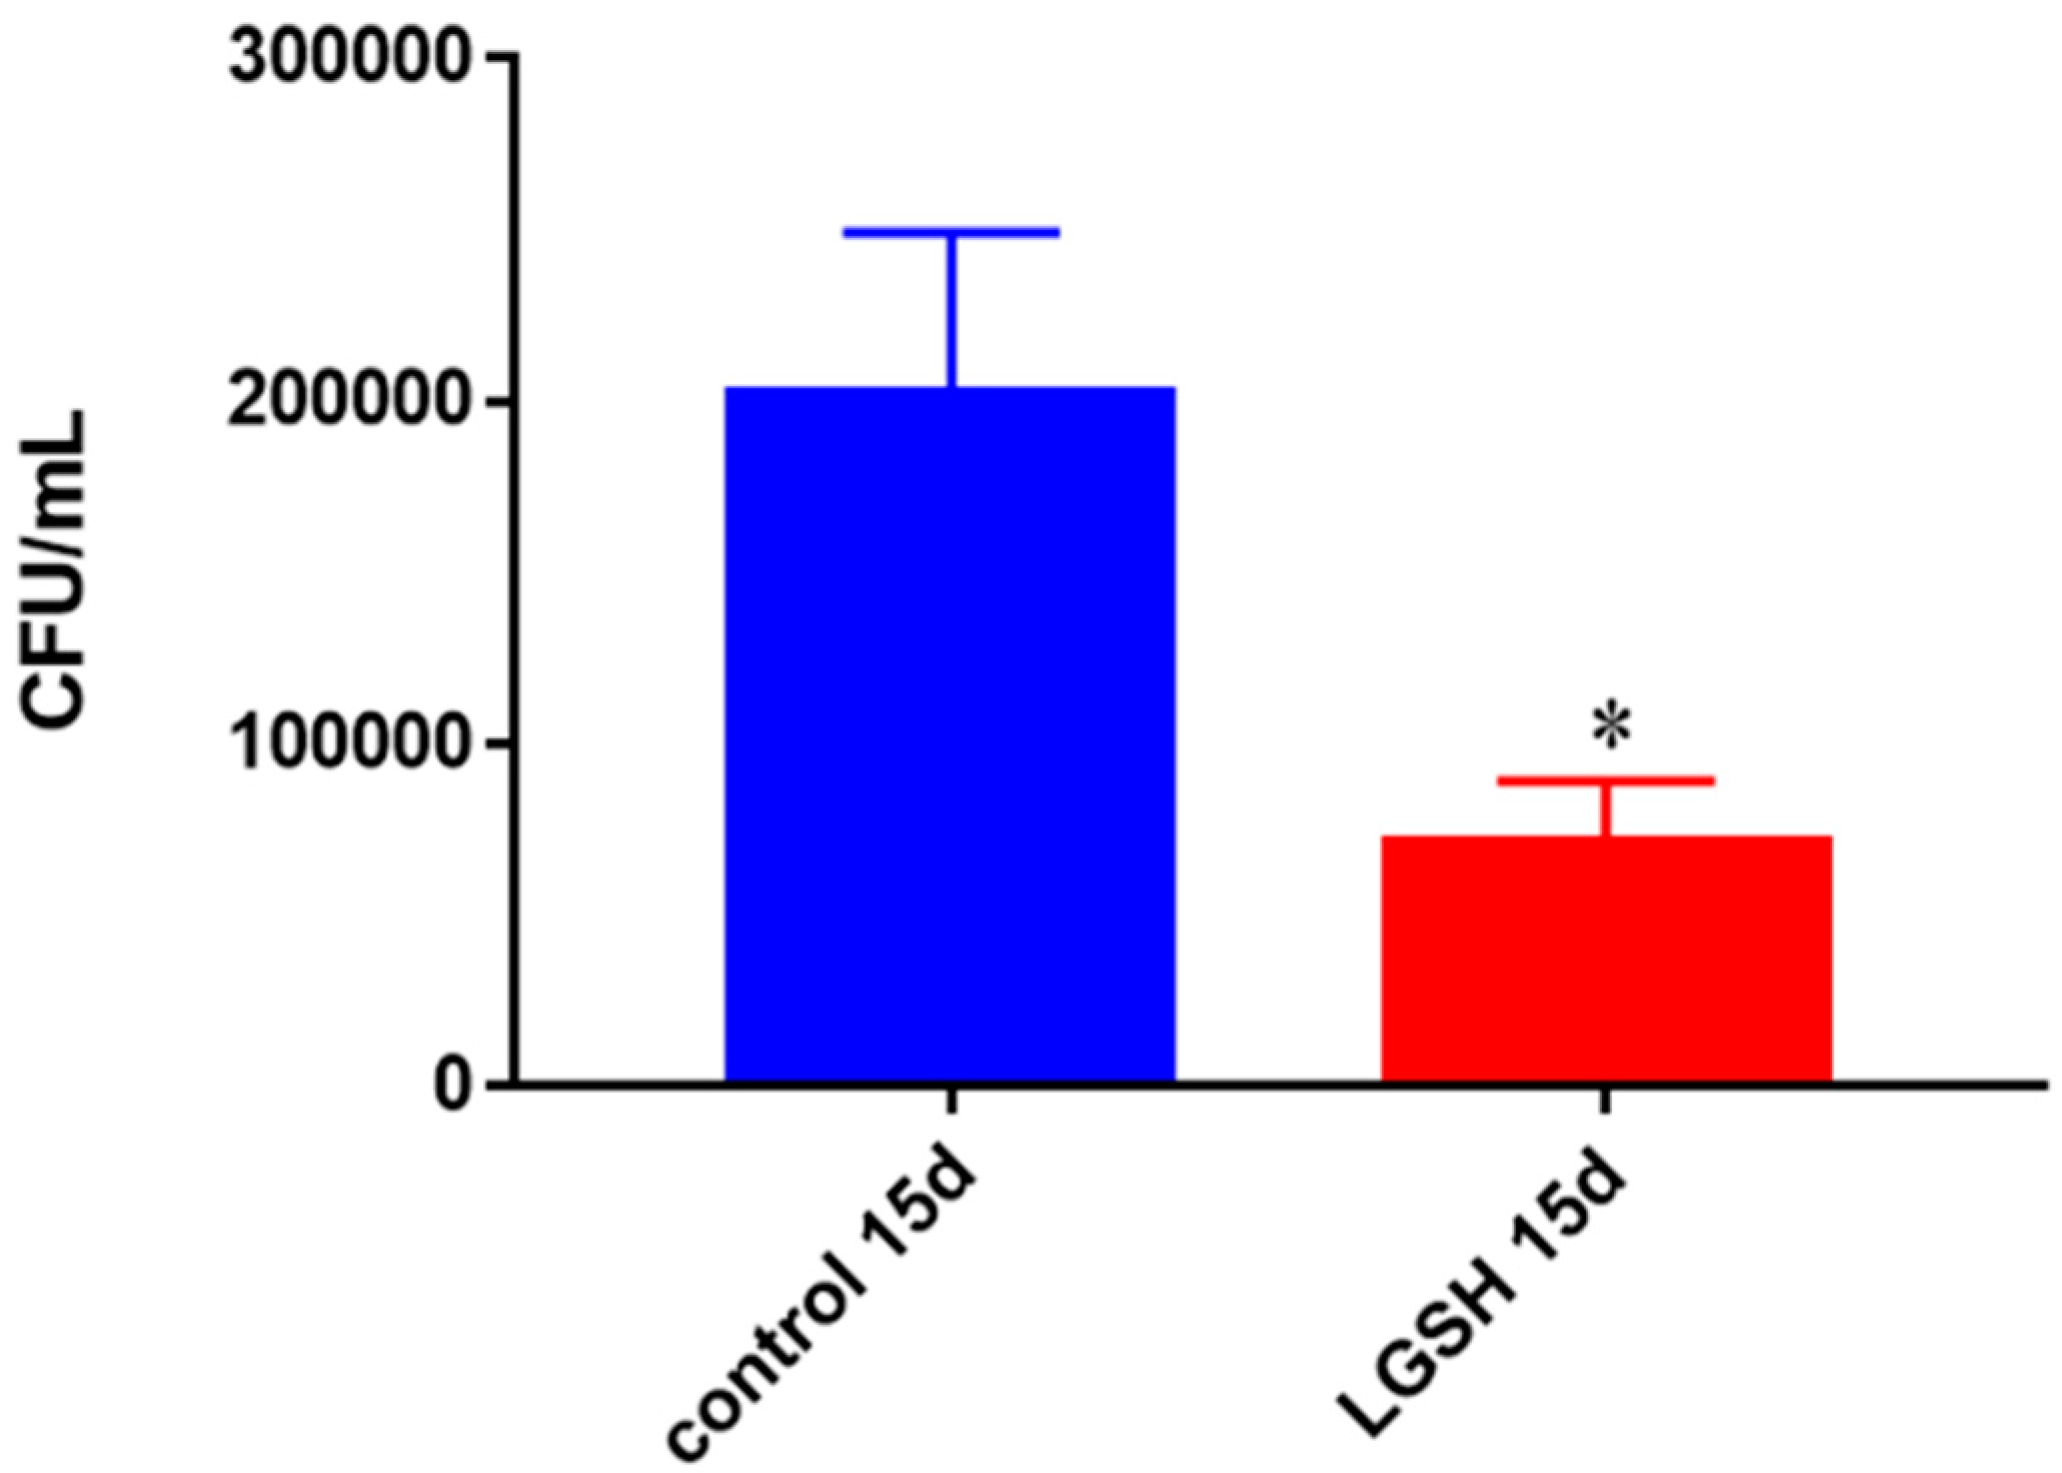
Figure 3.
Survival of BCG in in vitro granulomas of healthy individuals. All samples were separated through density dependent centrifugation from peripheral blood of volunteers and PBMCs were isolated after washes with PBS. In each category 6 × 10⁴ bacteria and 6 × 10⁵ immune cells were used for an MOI of 0.1:1. CFU counts of granulomas formed from healthy individuals’ PBMCs showed a decrease at 15 days when treated with L-GSH. Data represent means ± SE from eight healthy individuals. * p < 0.05 when comparing L-GSH treated samples to untreated samples at 15 days.
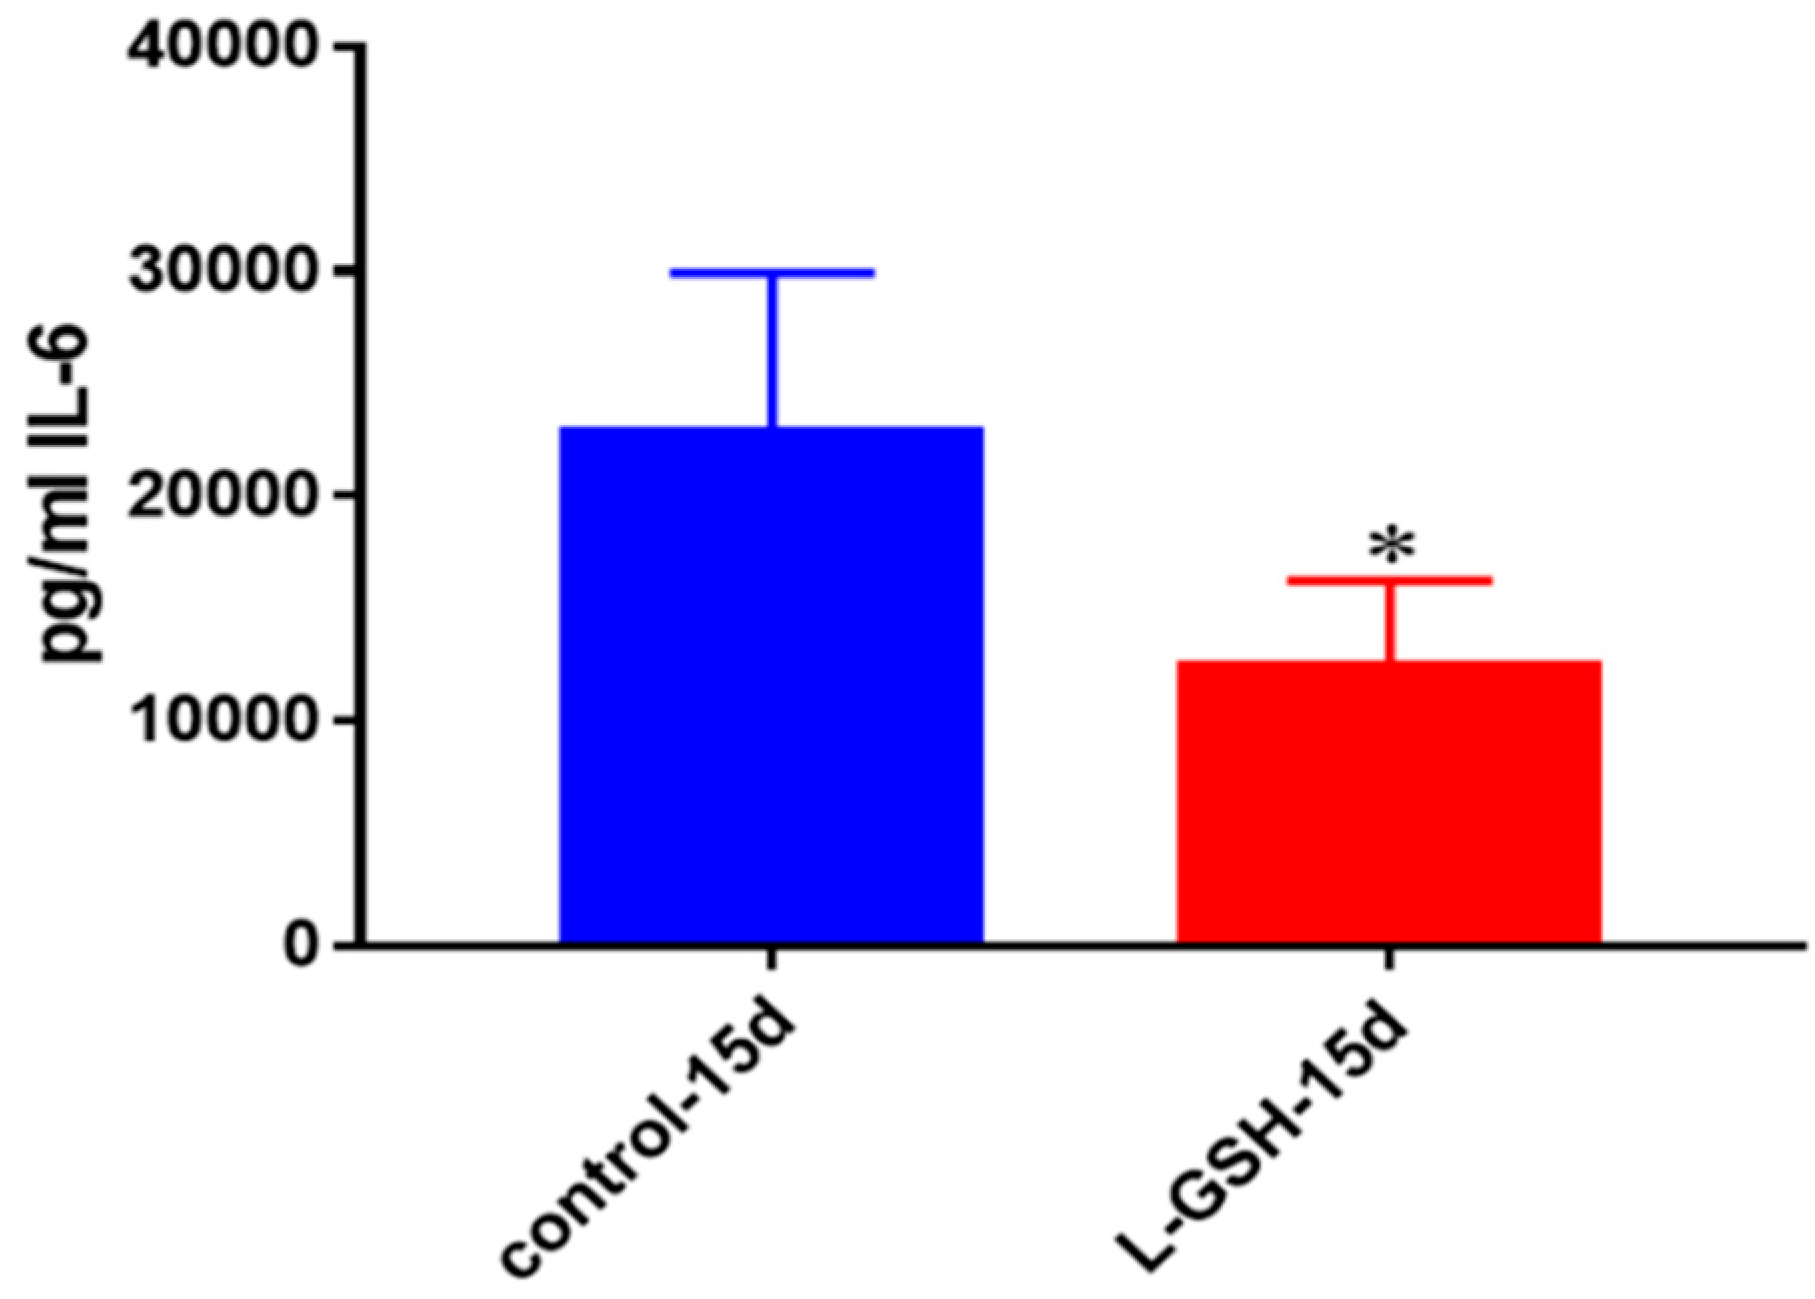
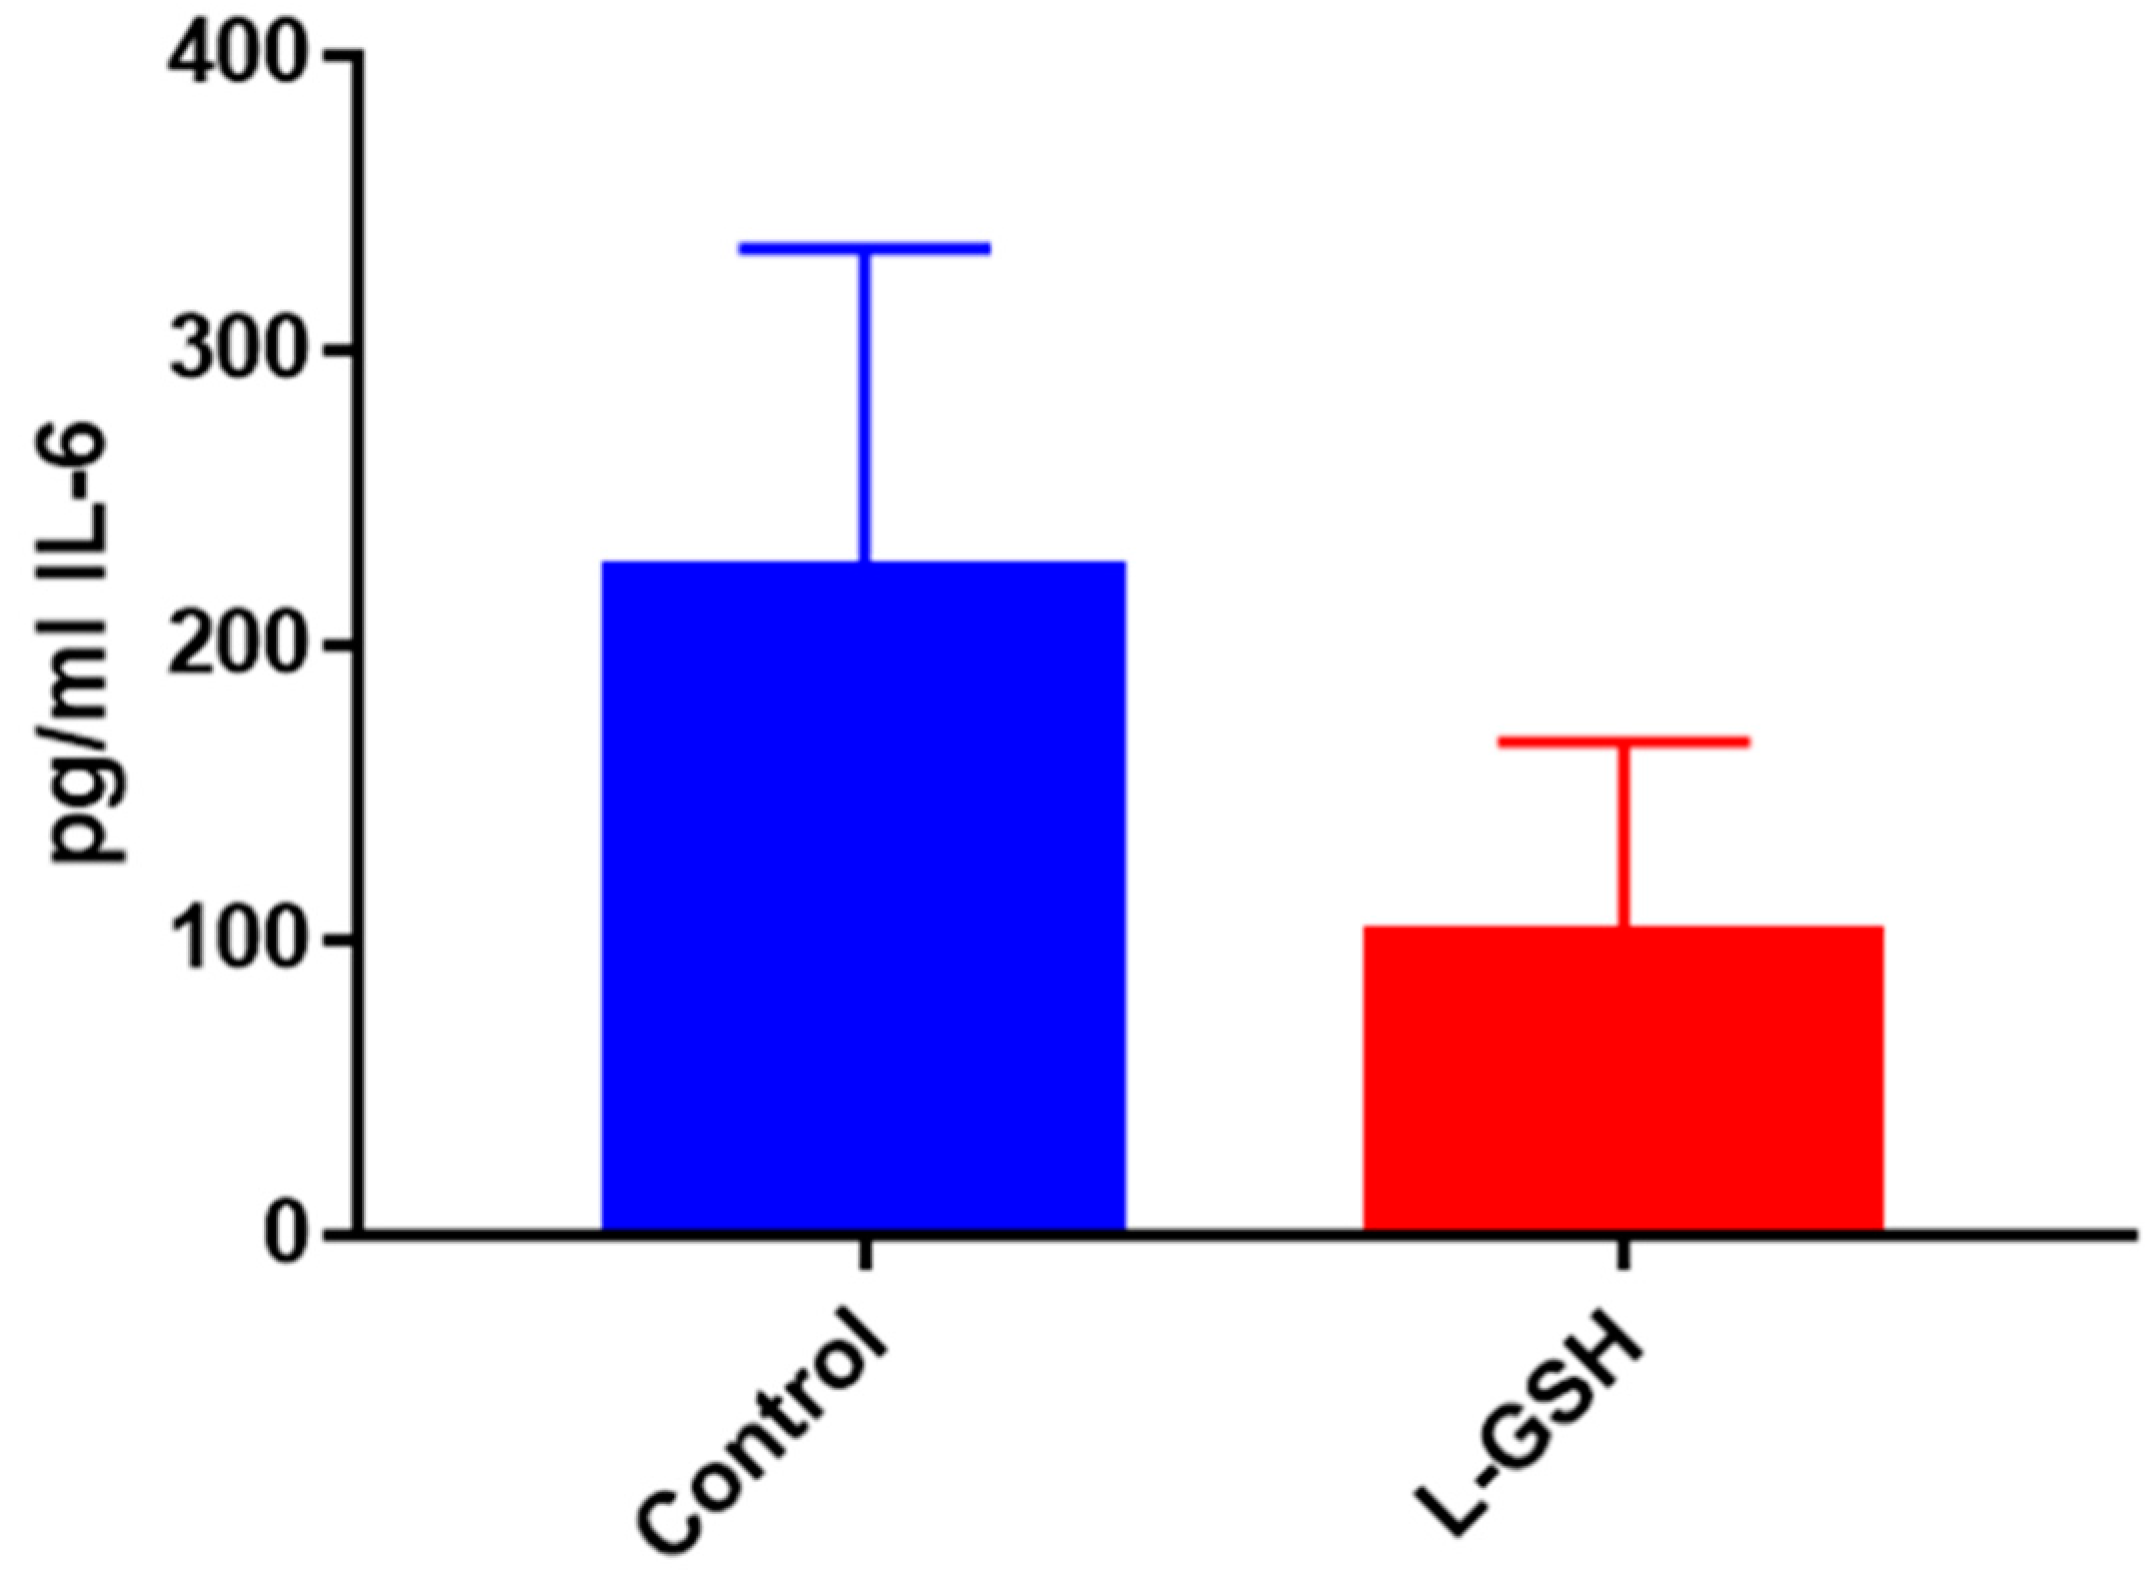
Figure 4.
IL-6 levels in granulomas from healthy individuals infected with BCG. Assay of IL-6 was performed using an ELISA Ready-Set-Go kit from eBioscience. There was a two-fold reduction in levels of IL-6 when healthy individuals’ PBMCs were treated with LGSH after infection with BCG. Data represent means ± SE from eight healthy individuals. * p < 0.05 when comparing L-GSH treated samples to untreated samples at 15 days.
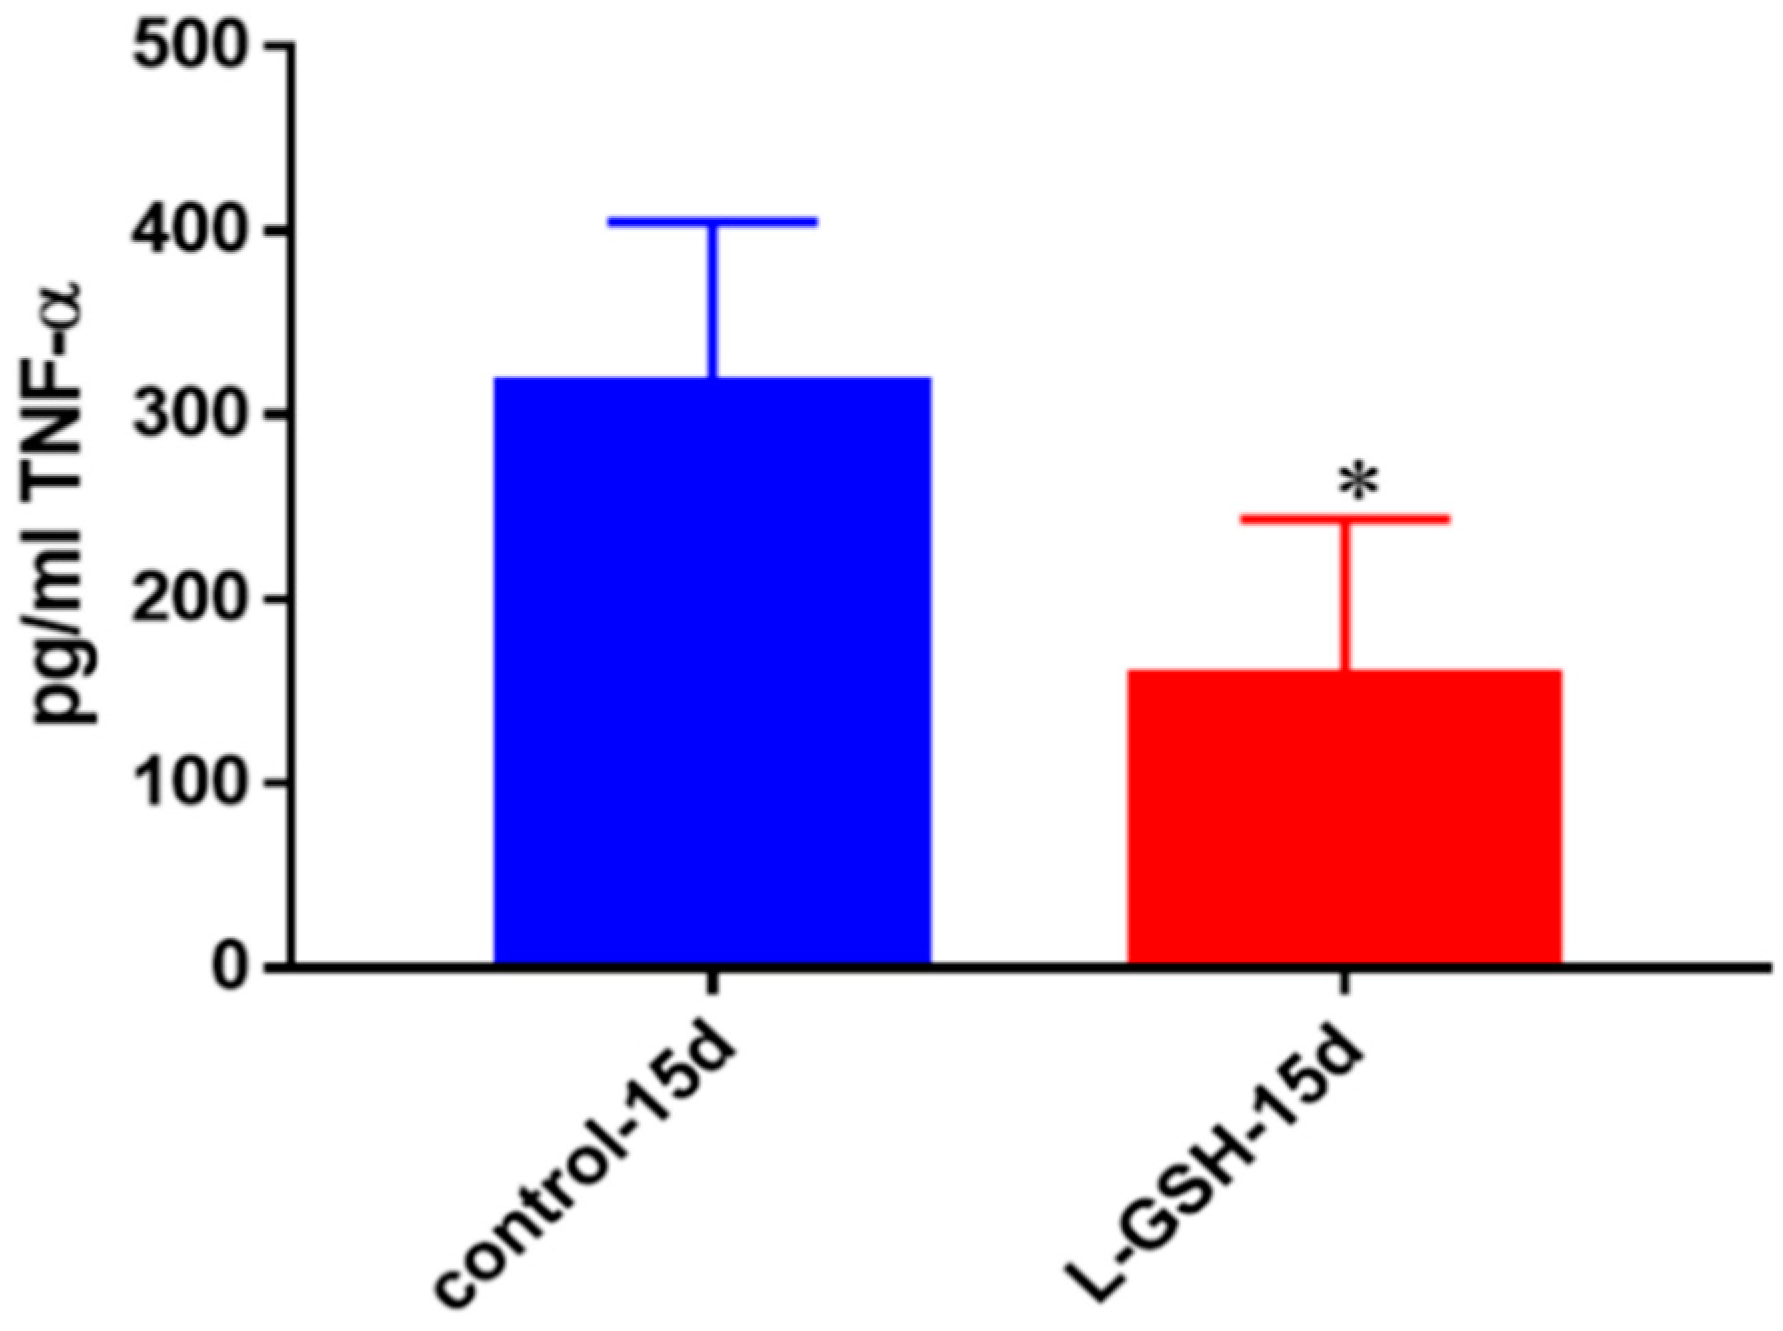
Figure 5.
TNF-α levels in granulomas from healthy individuals infected with BCG. Assay of TNF-α was performed using an ELISA Ready-Set-Go kit from eBioscience. There was a significant reduction in levels of TNF-α when healthy individuals’ PBMCs were treated with LGSH after infection with BCG. Data represent means ± SE from eight healthy individuals. * p < 0.05 when comparing L-GSH treated samples to untreated samples at 15 days.
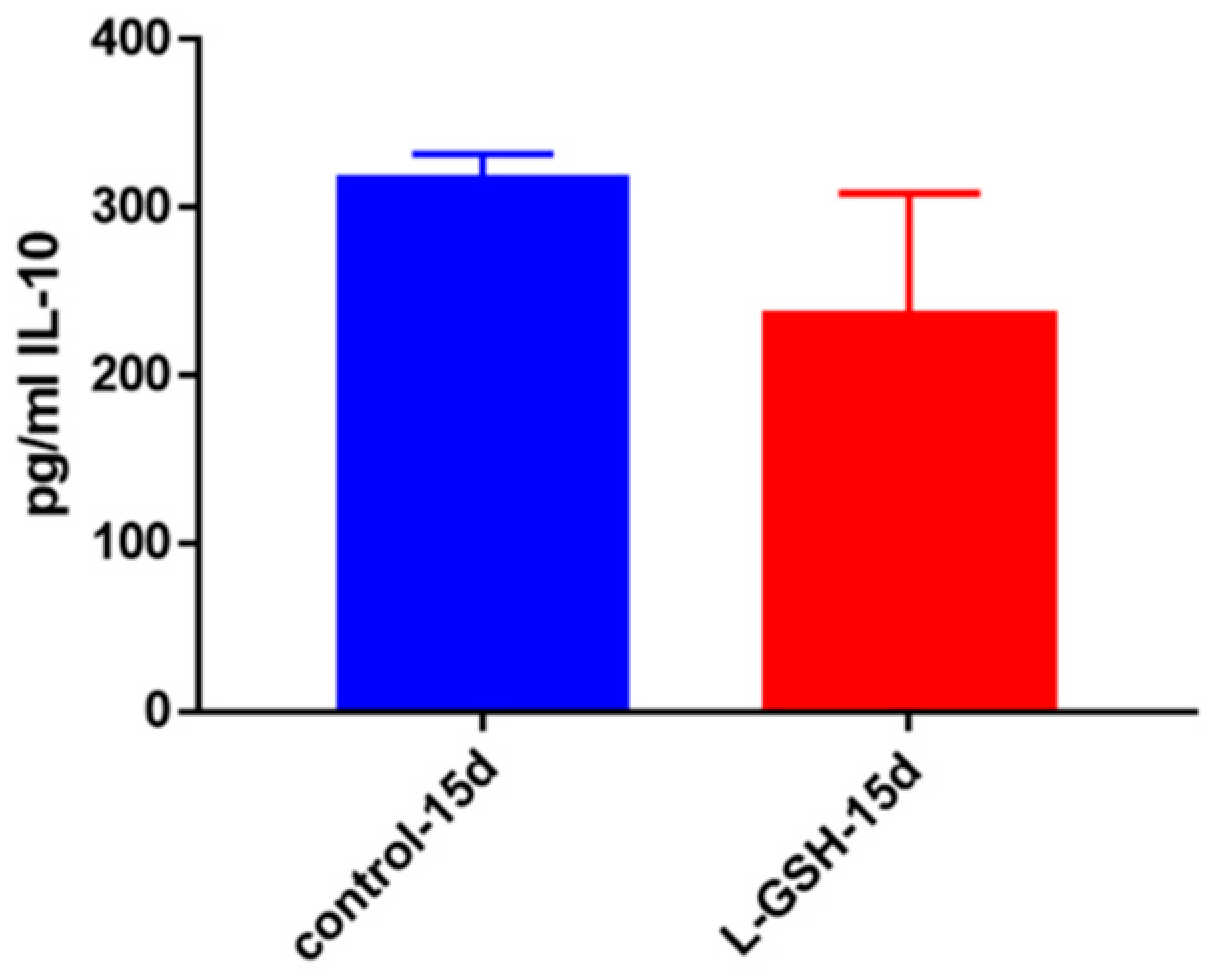
Figure 6.
IL-10 levels in granulomas from healthy individuals infected with BCG. Assay of IL-10 was performed using an ELISA Ready-Set-Go kit from eBioscience. Although not significant, there was a reduction in levels of IL-10 when healthy individuals’ PBMCs were treated with L-GSH after infection with BCG. Data represent means ± SE from eight healthy individuals.
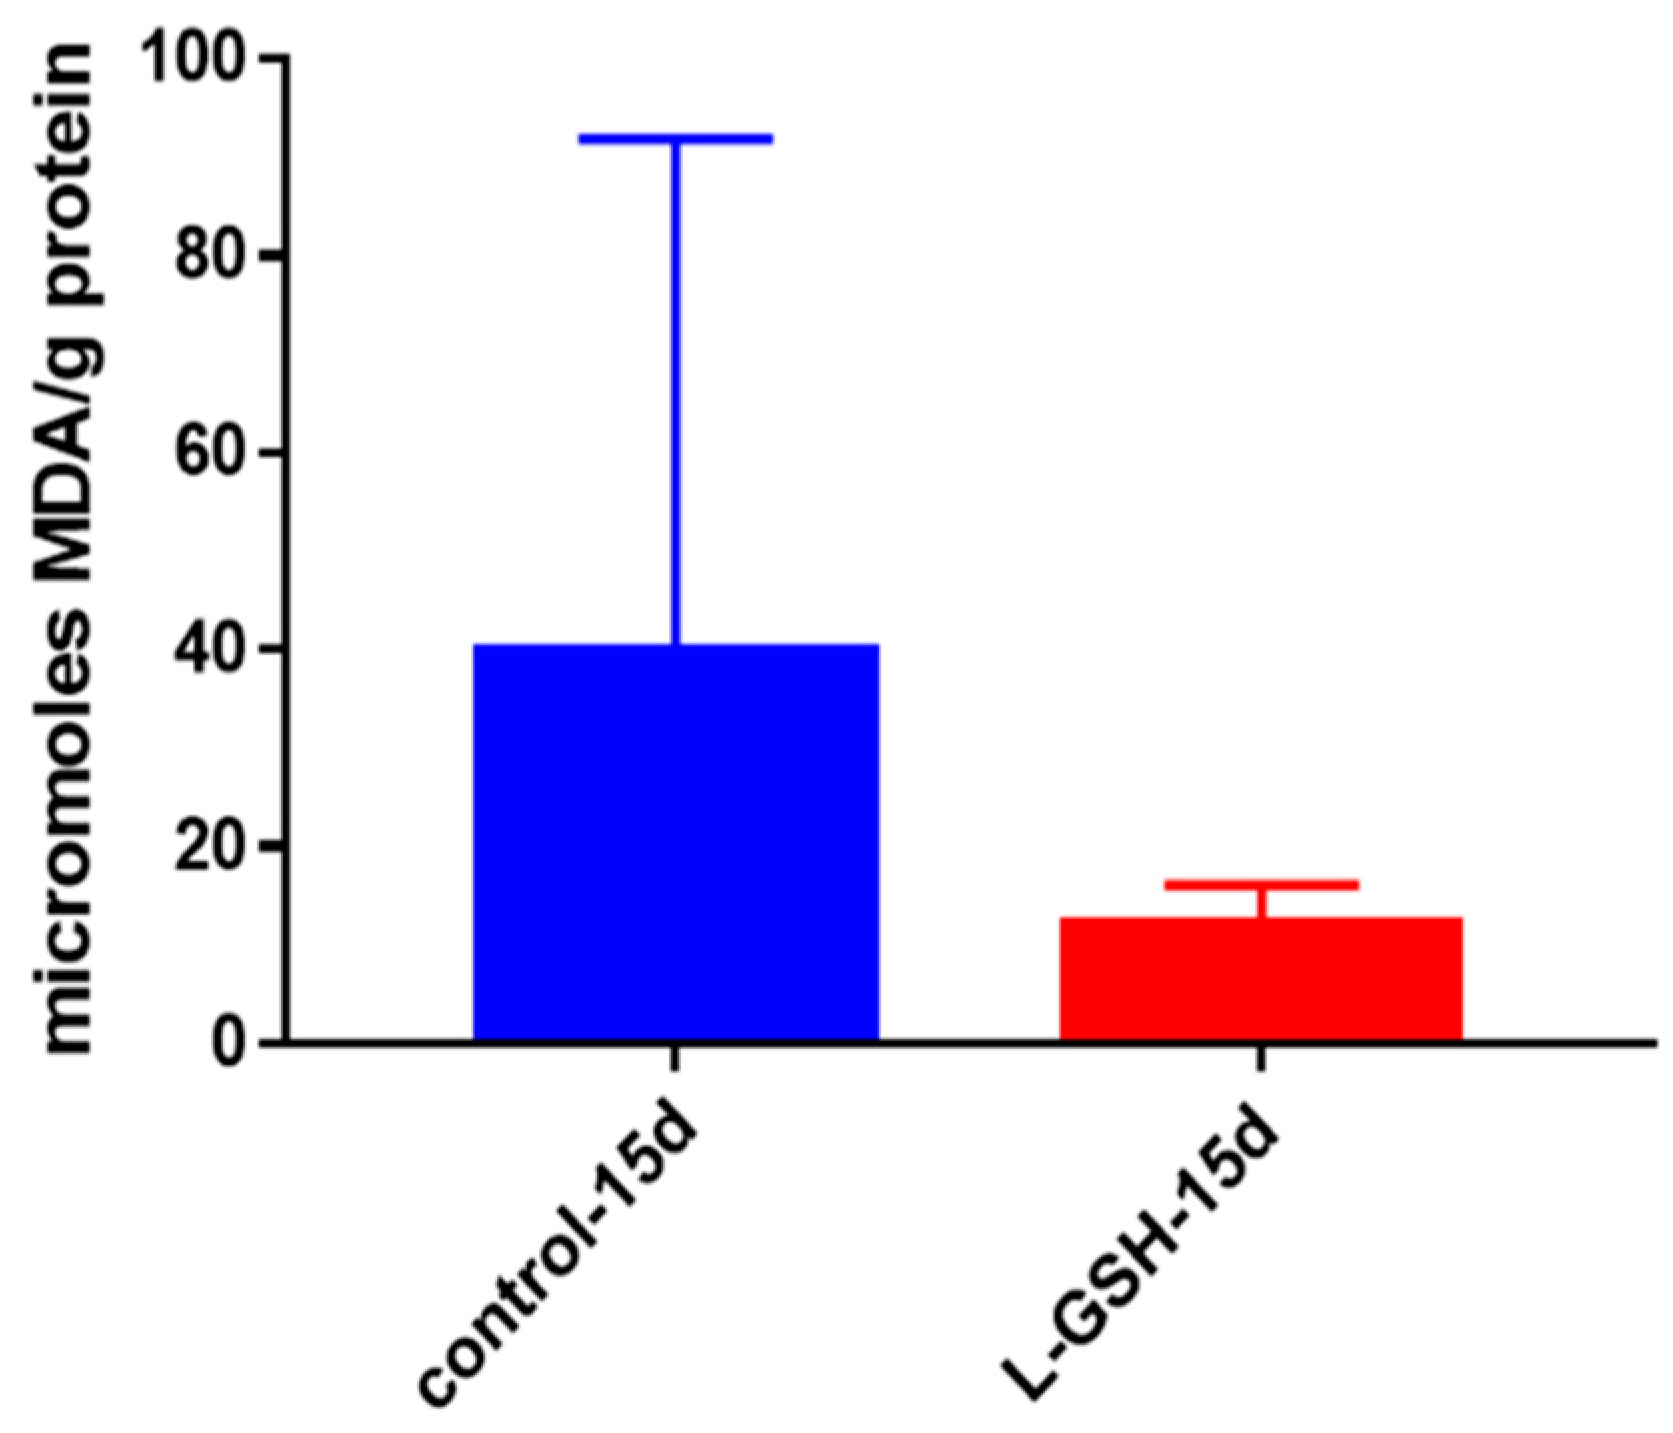
Figure 7.
MDA levels in granulomas from healthy individuals infected with BCG. Assay of MDA was performed using a TBARS kit from Cayman Chemical. Although not significant, there was a notable reduction in the levels of MDA or oxidative stress when healthy individuals’ PBMCs were treated with L-GSH after infection with BCG. Data represent means ± SE from eight healthy individuals.
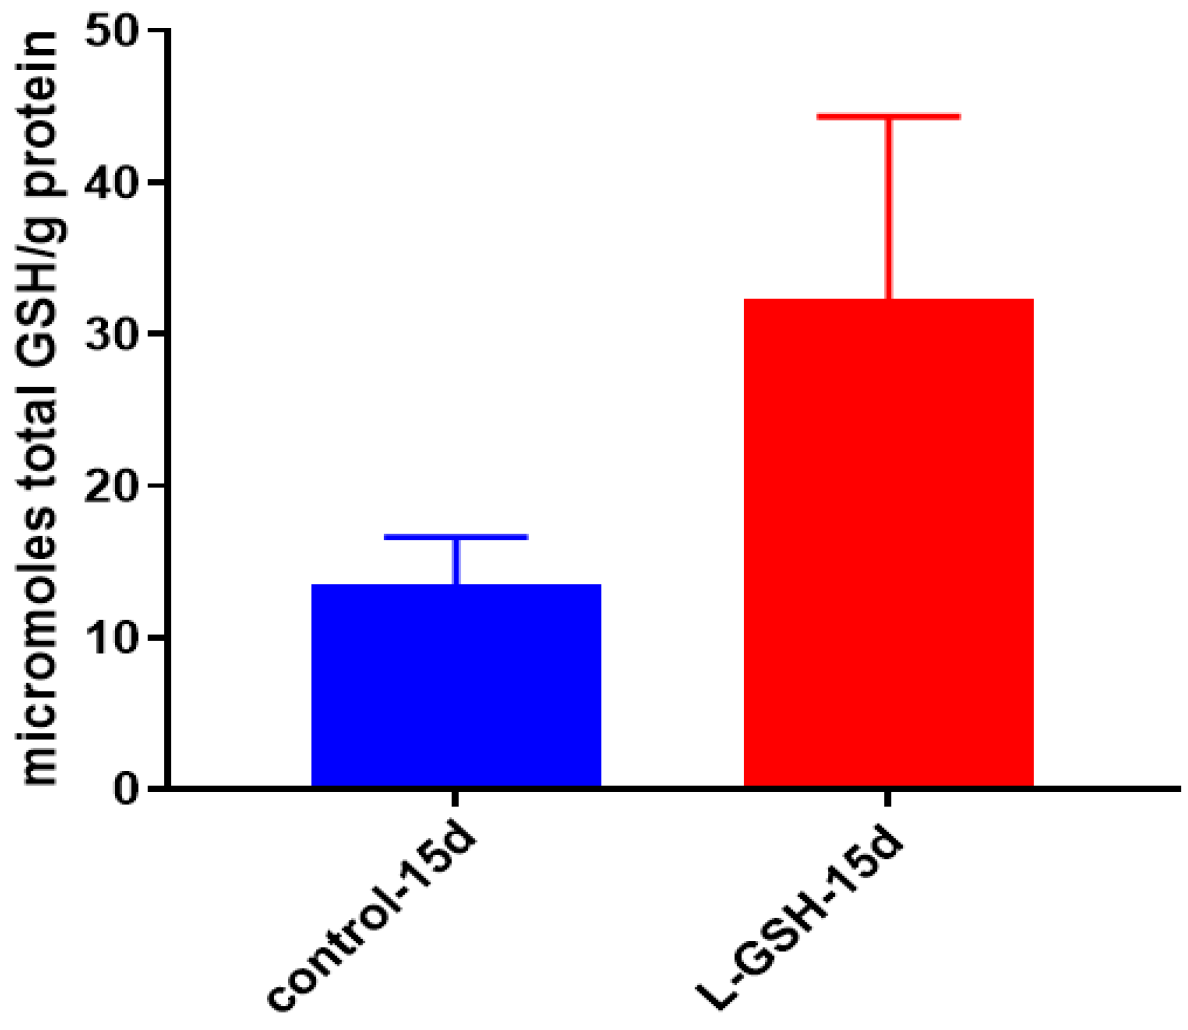
Figure 8.
Total GSH levels in granulomas from healthy individuals infected with BCG. GSH assay was performed using a colorimetric assay kit from Arbor Assays. Corrections were made to total protein measured by BCA Protein Assay Kit from Thermo Scientific. Both the GSH and total protein levels were measured in lysates excluding any supernatants from samples. There was a notable increase in the levels of GSH in L-GSH-treated granulomas. Data represent means ± SE from eight healthy individuals.
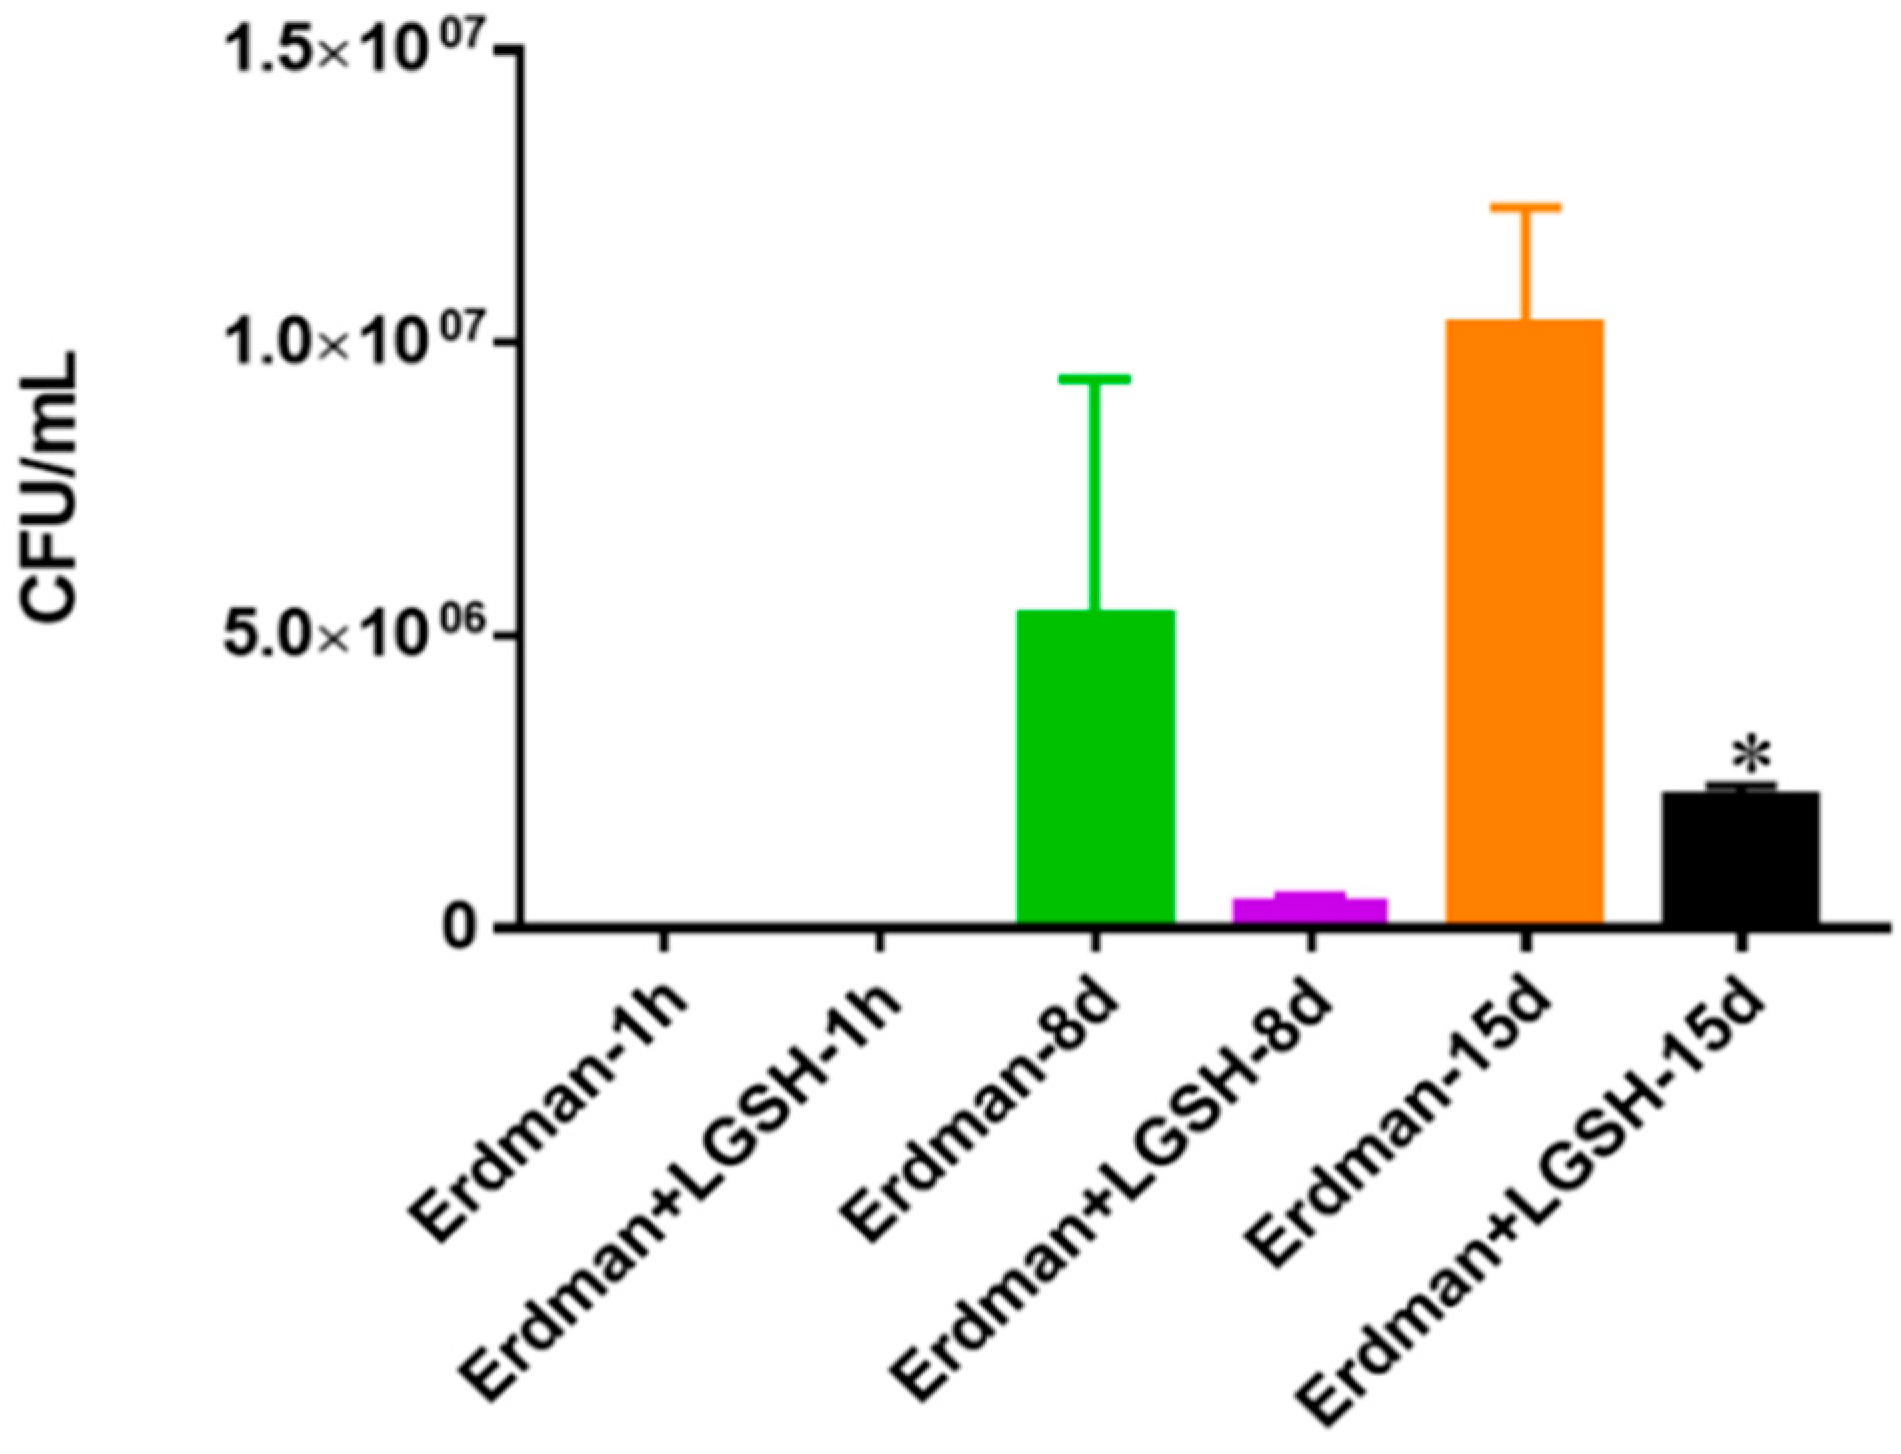
Figure 9.
Survival of Erdman strain of M. tb in 7H9 media. This experiment was done in order to determine direct killing effects of L-GSH on Erdman strain of M. tb without the help of immune cells present. M. tb was grown in 7H9 in the presence and absence of L-GSH (40 μM), the same concentration of L-GSH used in treatment of granulomas from healthy and T2DM individuals. There was a significant reduction in the M. tb numbers when treated with L-GSH at 15 days and a notable decrease at eight days. Data represent means ± SE from two trials and plating each multiple -times. * p < 0.05 when comparing L-GSH treated samples to untreated samples at 15 days.
Figure 10.
Hematoxylin and eosin staining of THP-1 cells infected with Erdman strain of M. tb: Histological staining of granulomas from THP-1 cells infected with M. tb showed a more organized structure when treated with LGSH. Microscopy work was done with a light microscope at 100× magnification.
Figure 10.
Hematoxylin and eosin staining of THP-1 cells infected with Erdman strain of M. tb: Histological staining of granulomas from THP-1 cells infected with M. tb showed a more organized structure when treated with LGSH. Microscopy work was done with a light microscope at 100× magnification.
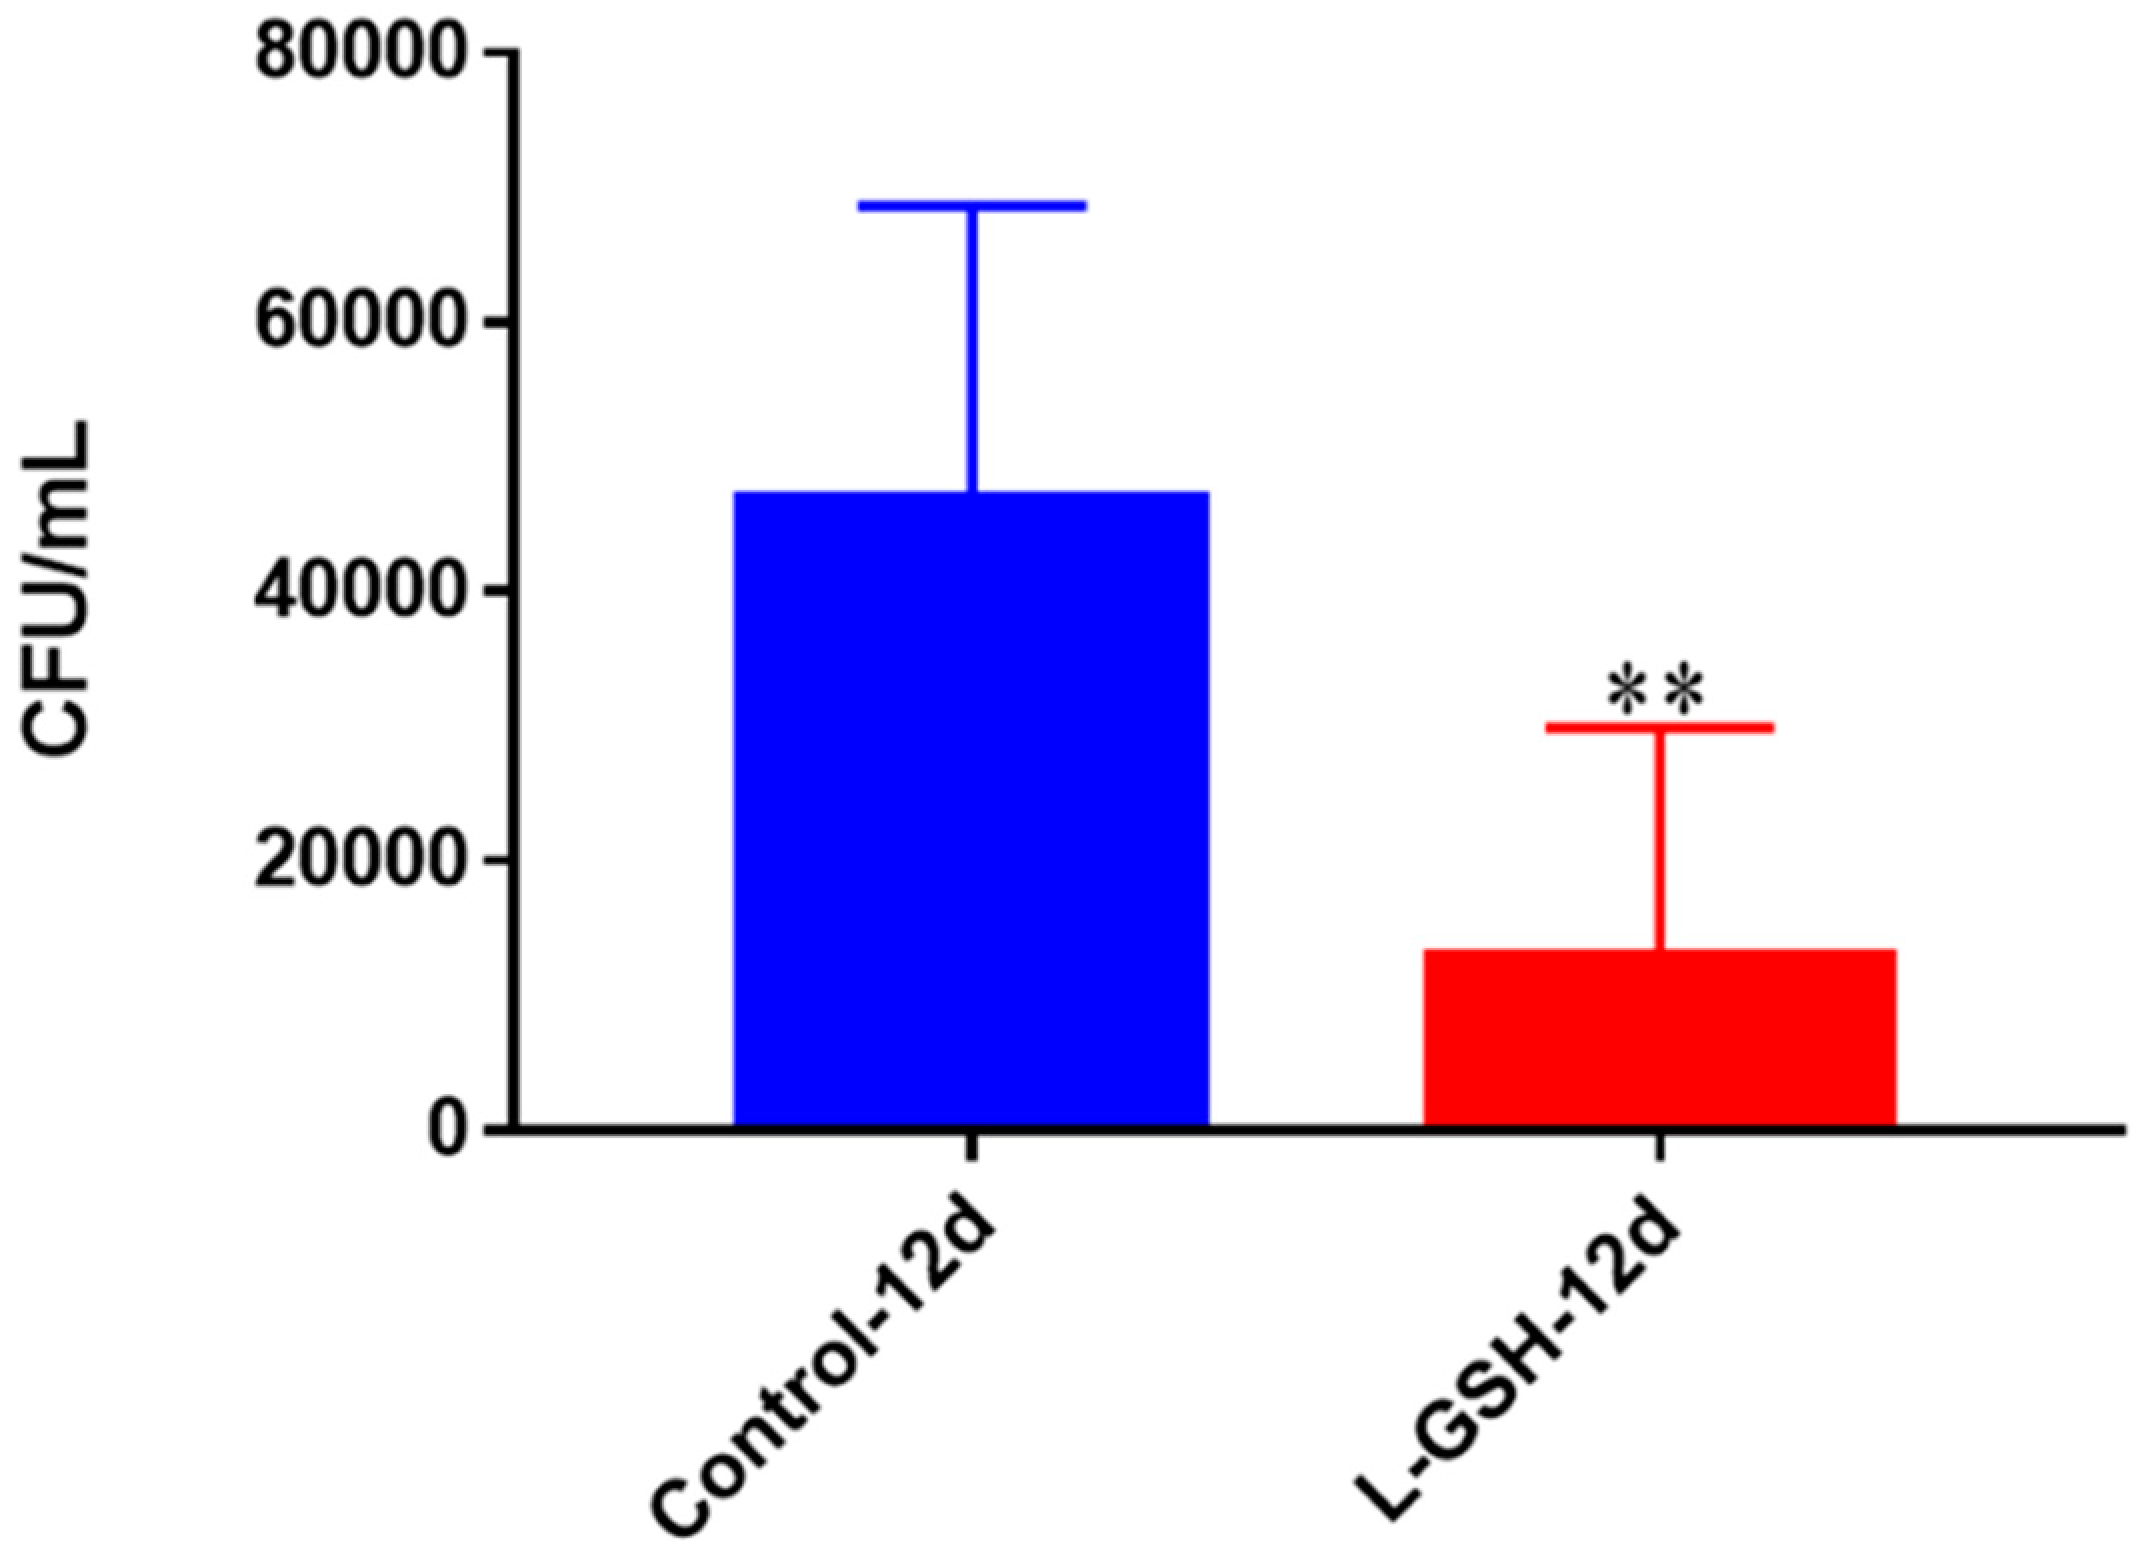
Figure 11.
Survival of M. tb in THP-1 cells. THP-1 cells were cultured in a medium of RPMI and 10% FBS, and allowed to differentiate into macrophages by addition of PMA at a concentration of 10 ng/mL. M. tb-infected macrophages (2 × 10⁵/well) were either untreated or treated with L-GSH (40 μM). There was a significant reduction in M. tb numbers when THP-1 cells were treated with L-GSH. Data represent means ± SE from six trials, plating each multiple times. ** p < 0.005 when comparing L-GSH treated samples to untreated samples at 12 days.
Figure 12.
TNF-α levels in THP-1 cells infected with M. tb. Assay of TNF-α was performed using an ELISA Ready-Set-Go kit from eBioscience. There was an observable reduction in levels of TNF-α when THP cells were treated with LGSH after infection with M. tb after 12 days. Data represent means ± SE from six trials plating each multiple -times.
Figure 13.
IL-10 levels in THP -1 cells infected with M. tb. Assay of IL-10 was performed using an ELISA Ready-Set-Go kit from eBioscience. There was a drastic reduction in levels of IL-10 when THP-1 cells were treated with LGSH after infection with Erdman at 12 days. Data represent means ± SE from six trials, plating each multiple- times.
Figure 14.
IL-6 levels in THP-1 cells infected with Erdman Assay of IL-6 was performed using an ELISA Ready-Set-Go kit from eBioscience. There was a notable reduction in the levels of IL-6 when THP cells were treated with LGSH after infection with Erdman at 12 days. Data represent means ± SE from six trials, plating each multiple- times.
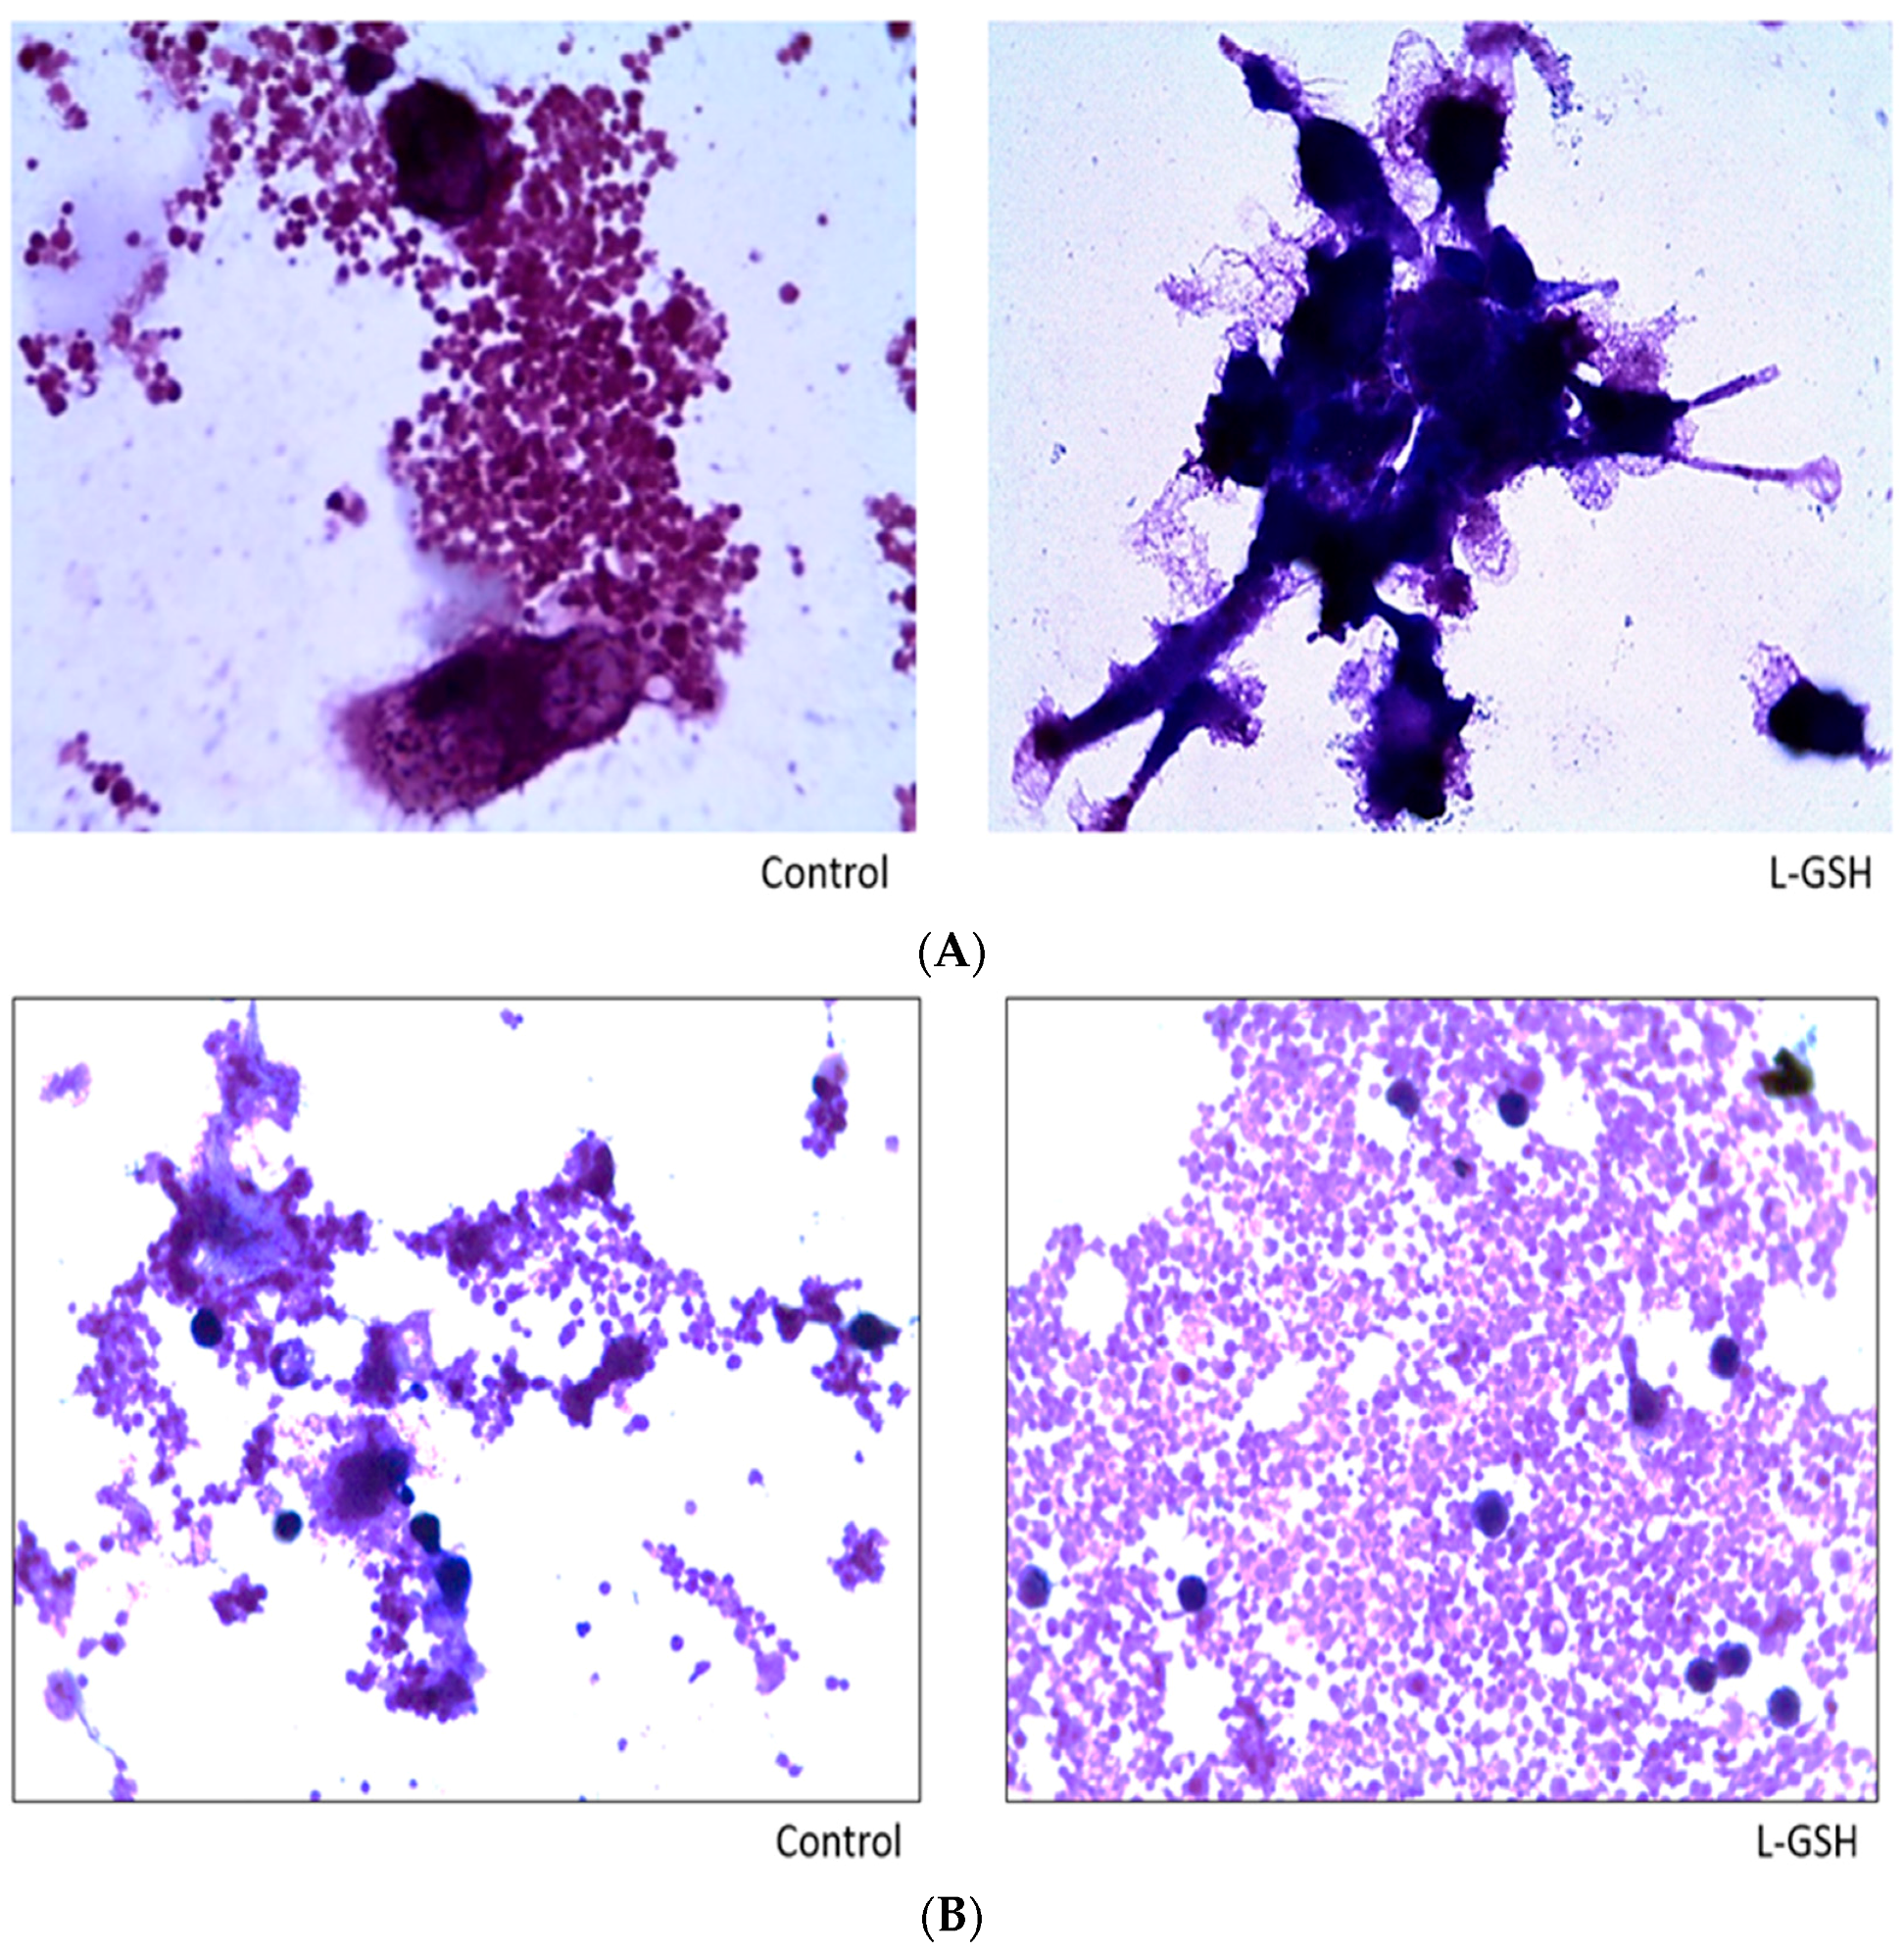
Figure 15.
(A) Hematoxylin and Eosin staining of granulomas from healthy individuals infected with M. tb. There was an aggregation of cells in both treated and untreated groups of granulomas formed by PBMCs of healthy individuals infected with Erdman strain of M. tb. But there was an apparent increase in the size of granulomas when treated with L-GSH; (B) Hematoxylin and Eosin staining of granulomas from T2DM individuals infected with M. tb. Granulomas were formed from PBMCs from T2DM patients. There was a great extent of cell aggregation when treated with L-GSH versus untreated. Microscopy work was done with a light microscope at 1000× magnification under oil immersion.
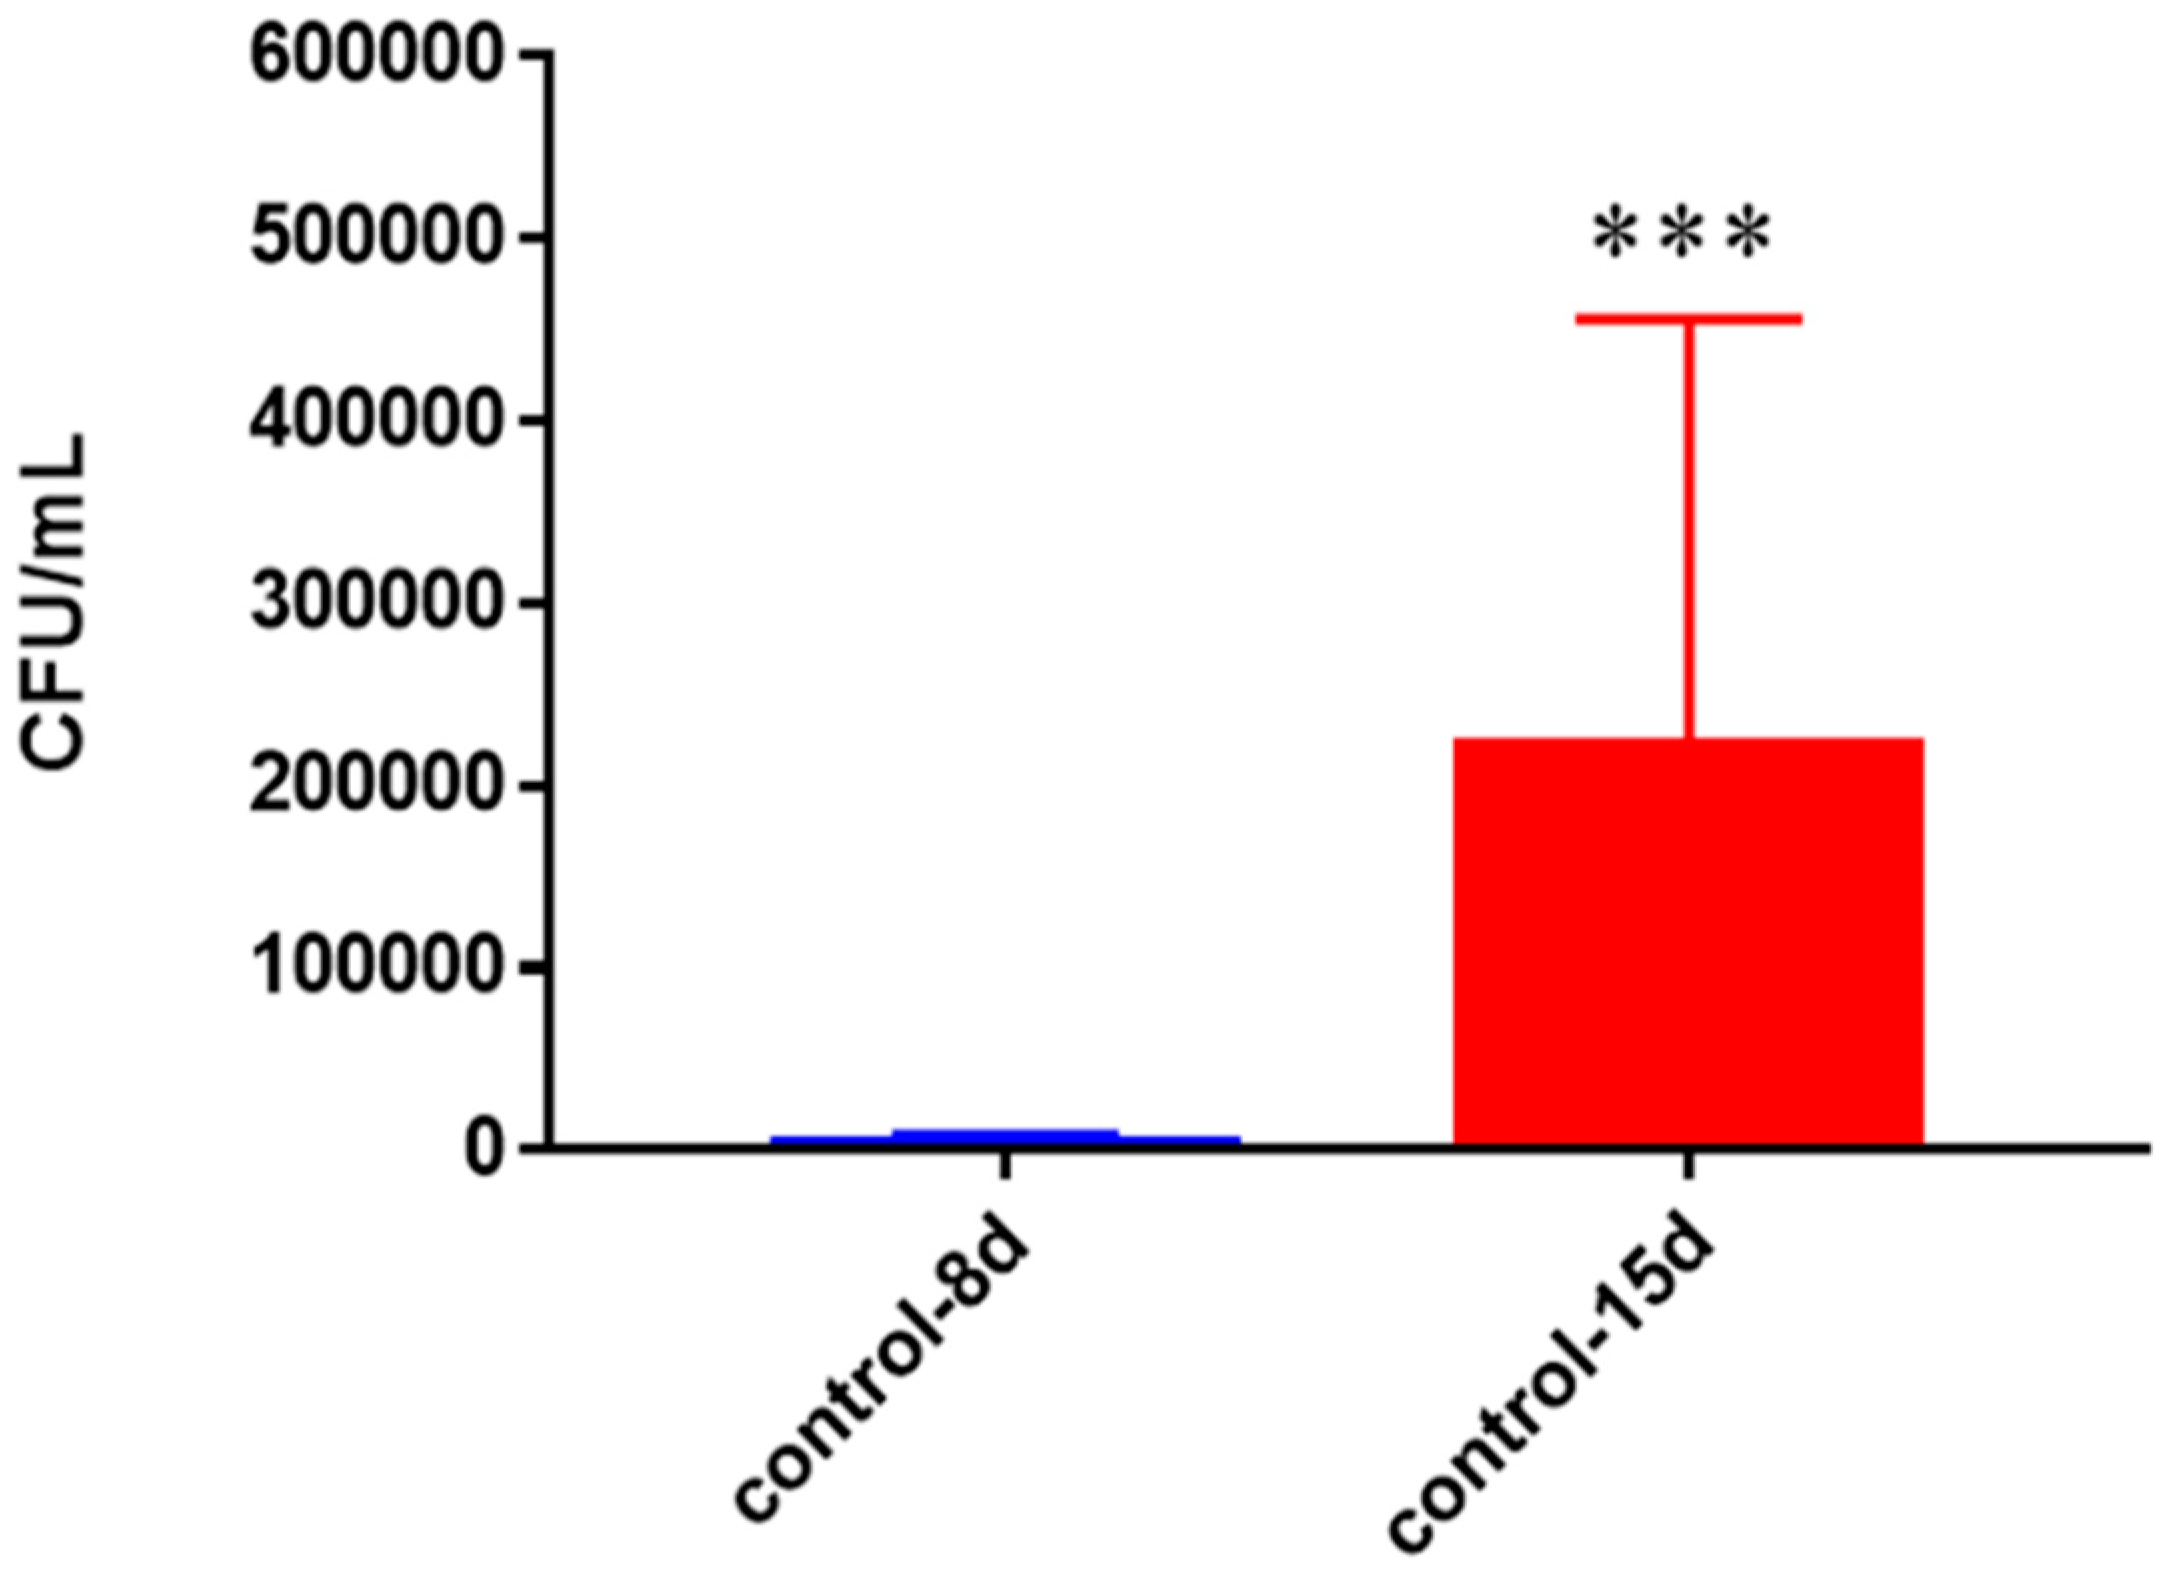
Figure 16.
Survival of M. tb in untreated granulomas of healthy individuals. All samples were separated through density dependent centrifugation from peripheral blood of volunteers and PBMCs were isolated after washes with PBS. In each category 6 × 10⁴ bacteria and 6 × 10⁵ immune cells were used for an MOI of 0.1:1. CFU counts of granulomas formed from healthy individuals’ PBMCs showed a statistically significant increase at 15 days when left untreated. Data represent means ± SE from eight healthy individuals. *** p < 0.0005 when comparing samples at eight days and 15 days.
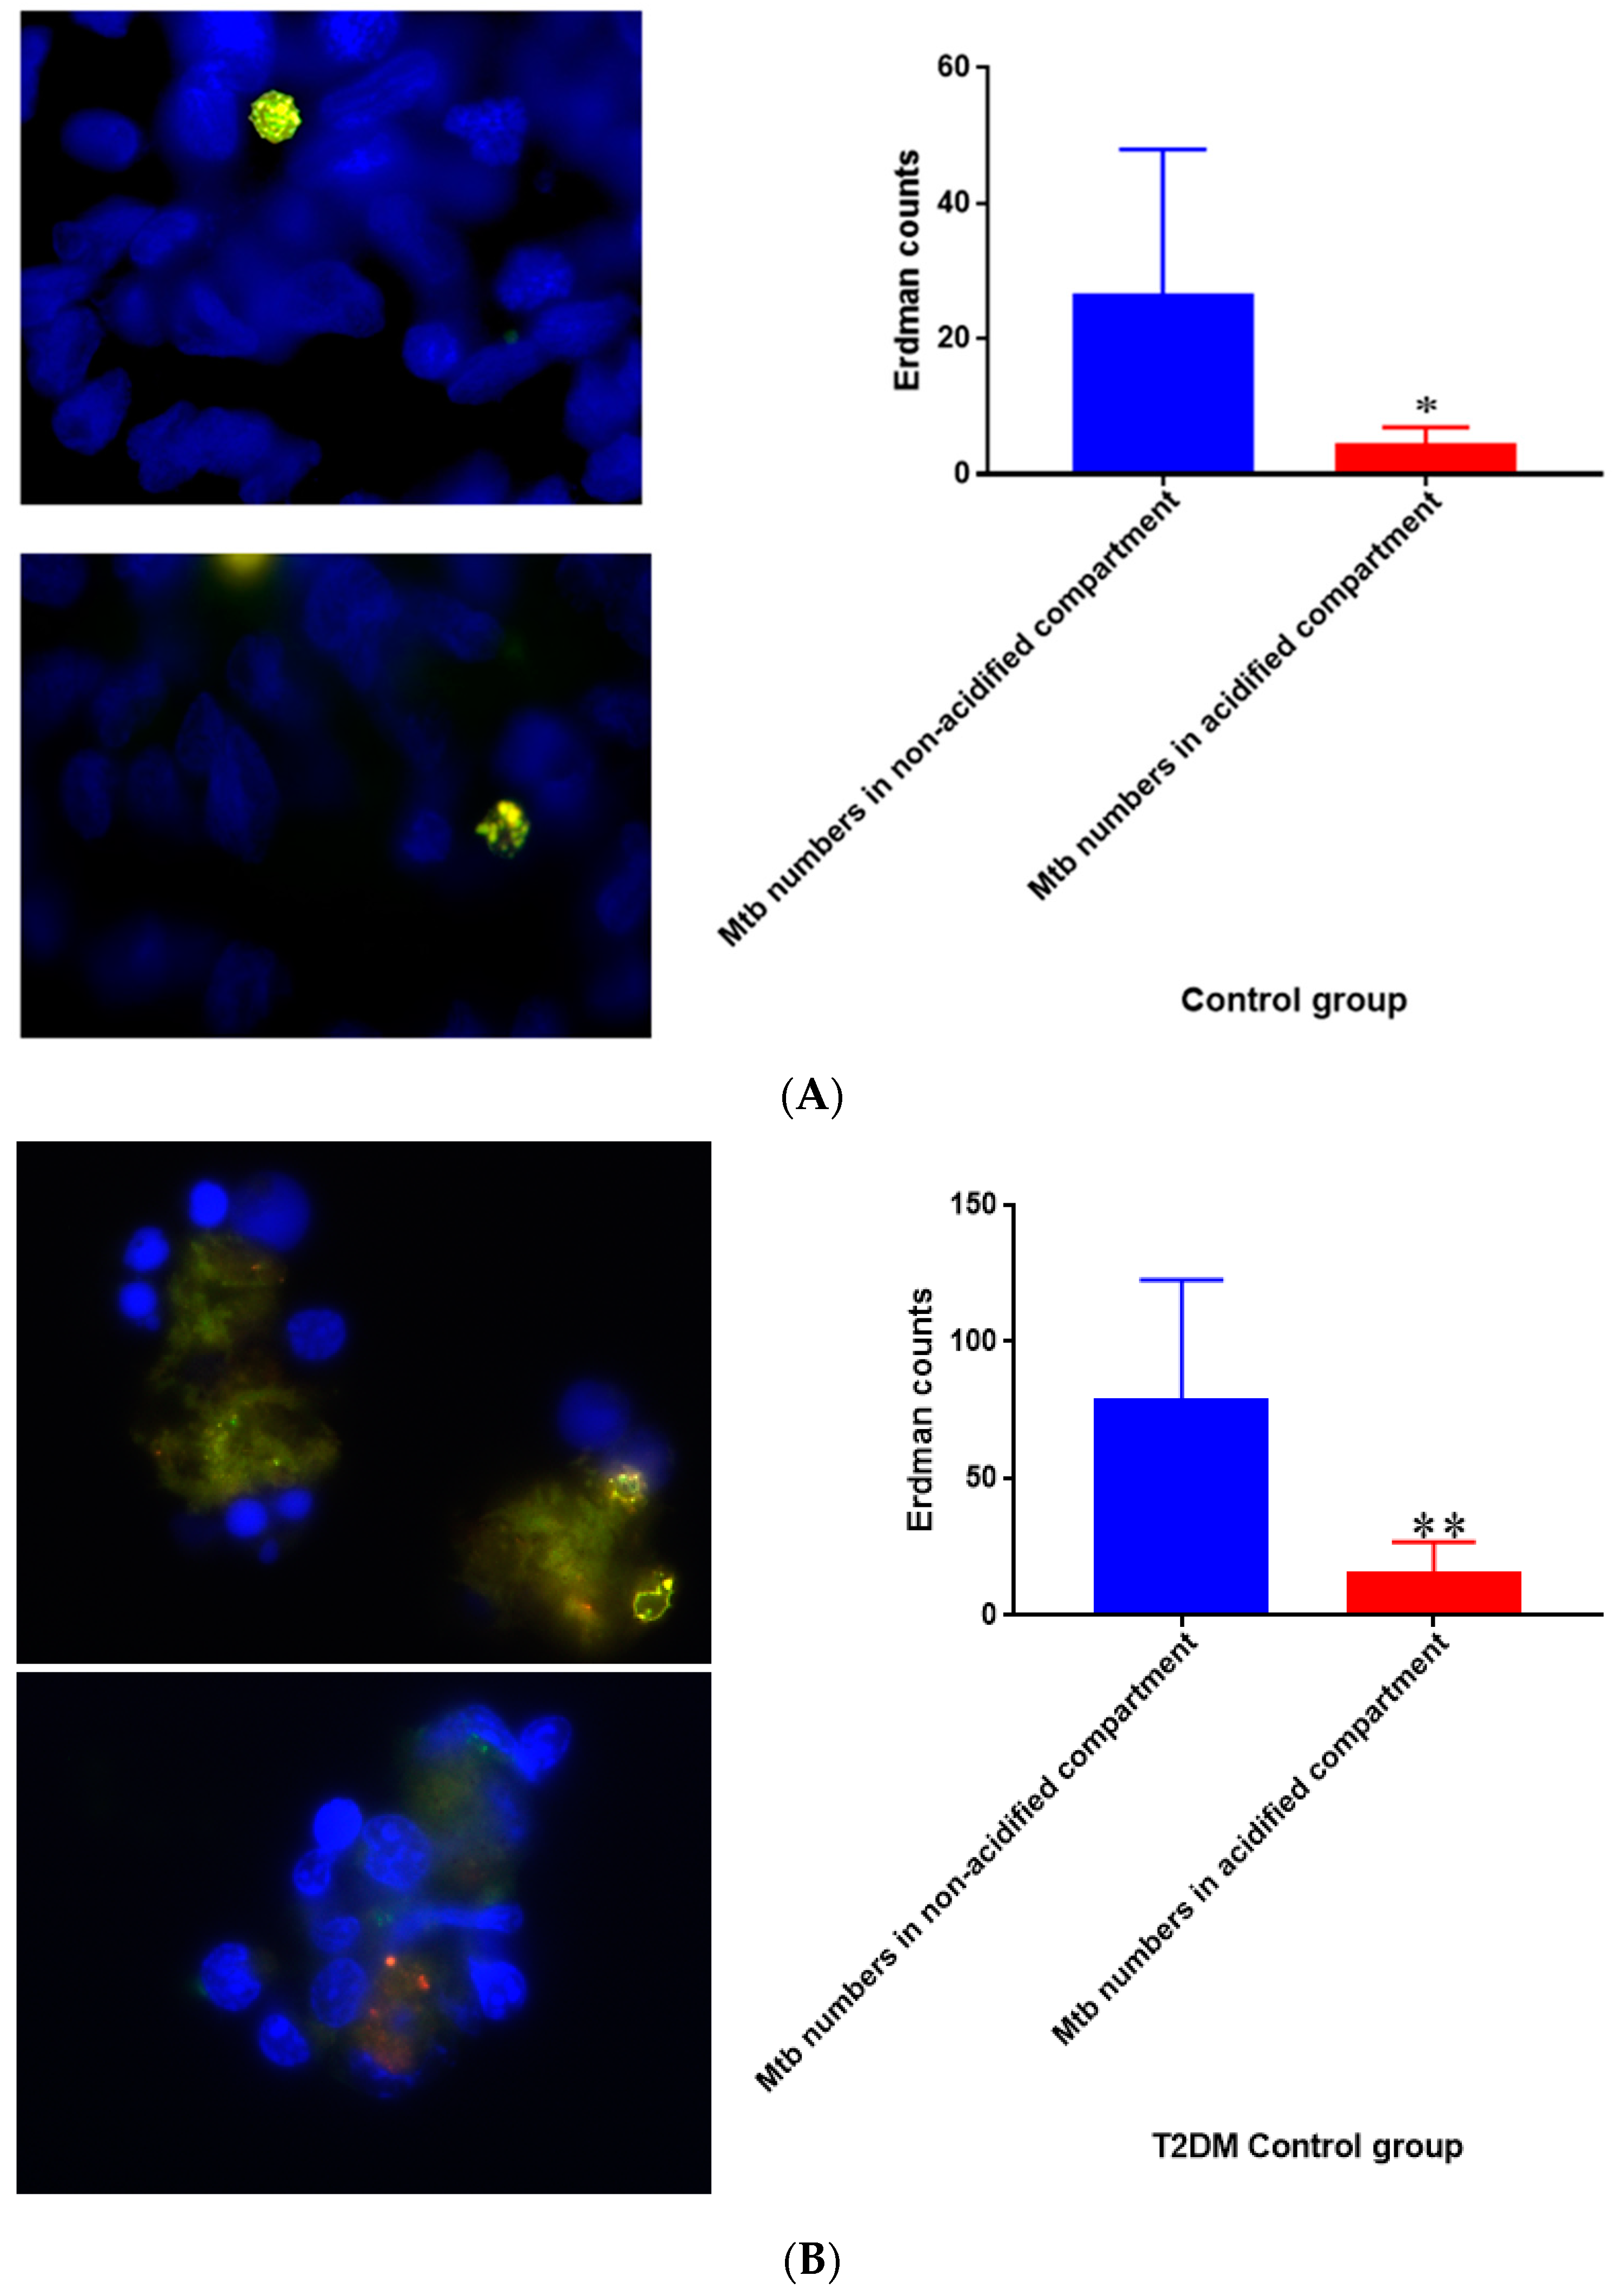
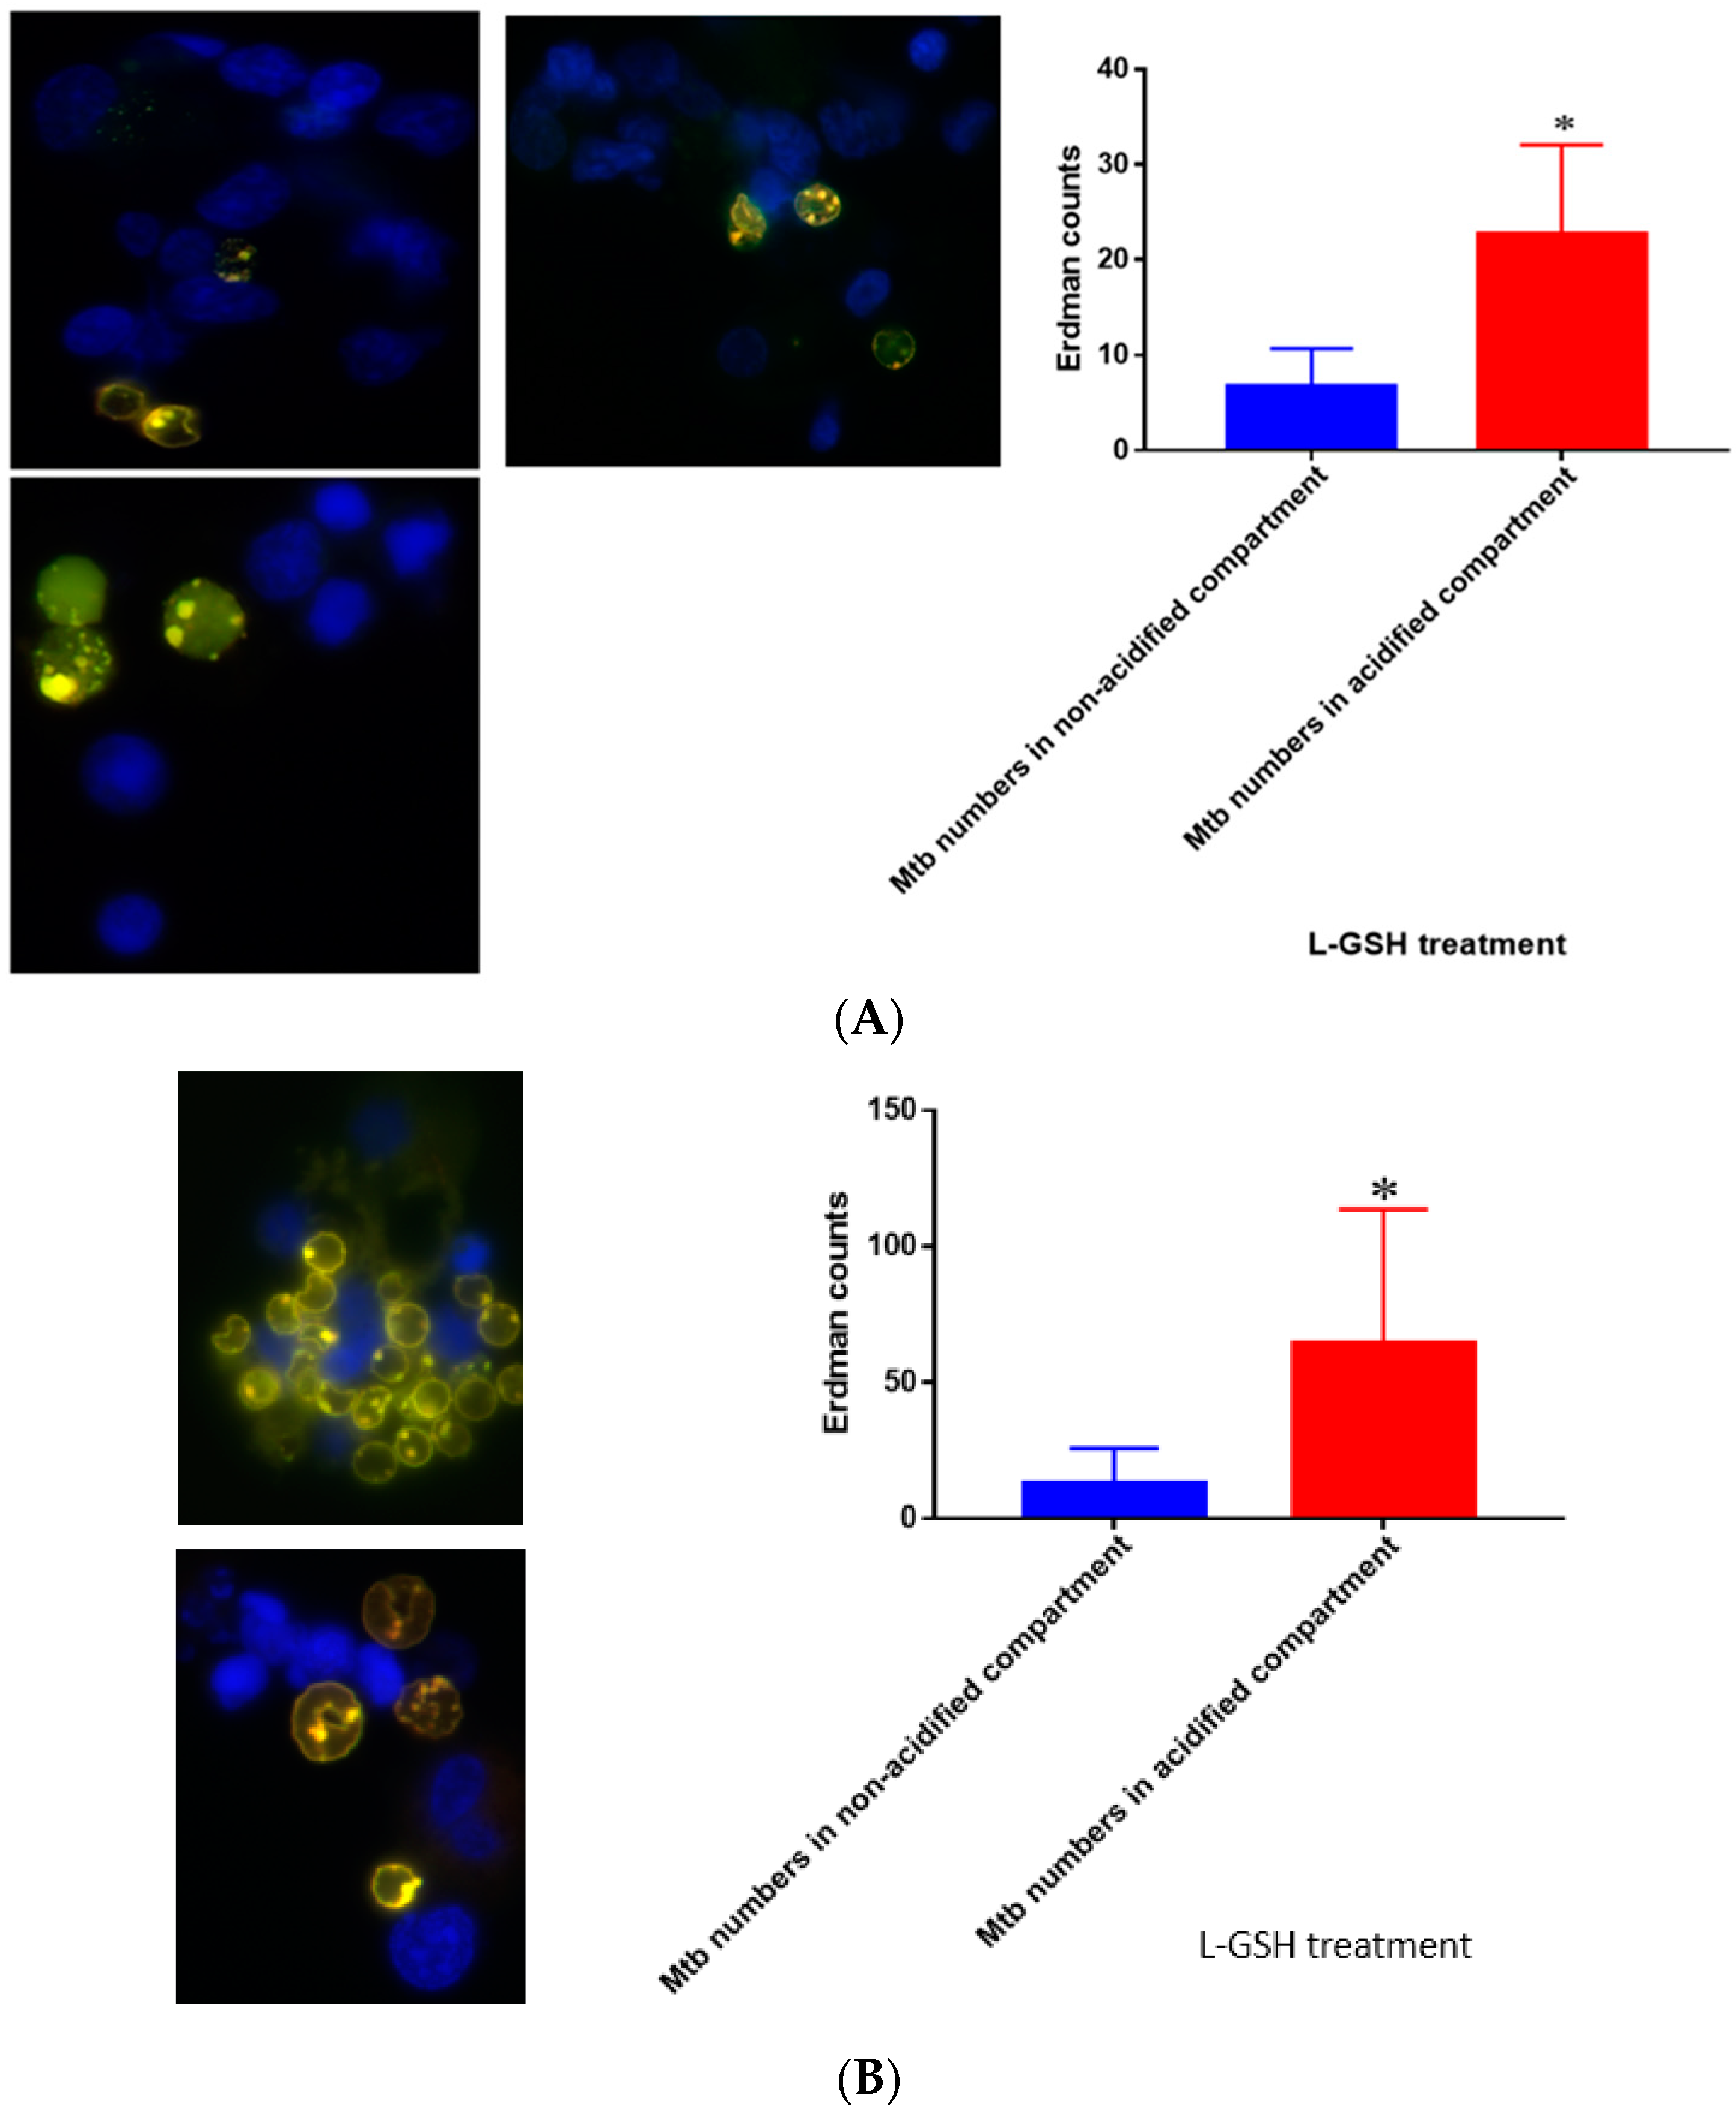
Figure 17.
(A) Quantification of M. tb within acidified compartments in untreated granulomas of healthy individuals. GFP-labeled M. tb was used for infection. Granulomas were labeled with lysotracker red DND99, which gets trapped within the acidified compartments, as well as DAPI for nucleus staining. When untreated, at 15 days granulomas showed significantly less M. tb in acidified compartments compared to the bacteria present in non-acidified compartments; (B) Untreated granulomas of T2DM individuals. Yellow areas correspond to acidified compartments with GFP-labeled bacteria present. Data represent means ± SE from eight healthy individuals. * p < 0.05 when comparing bacterial numbers in acidified versus non-acidified compartments. ** p < 0.005 when comparing bacterial numbers in acidified versus non-acidified compartments.
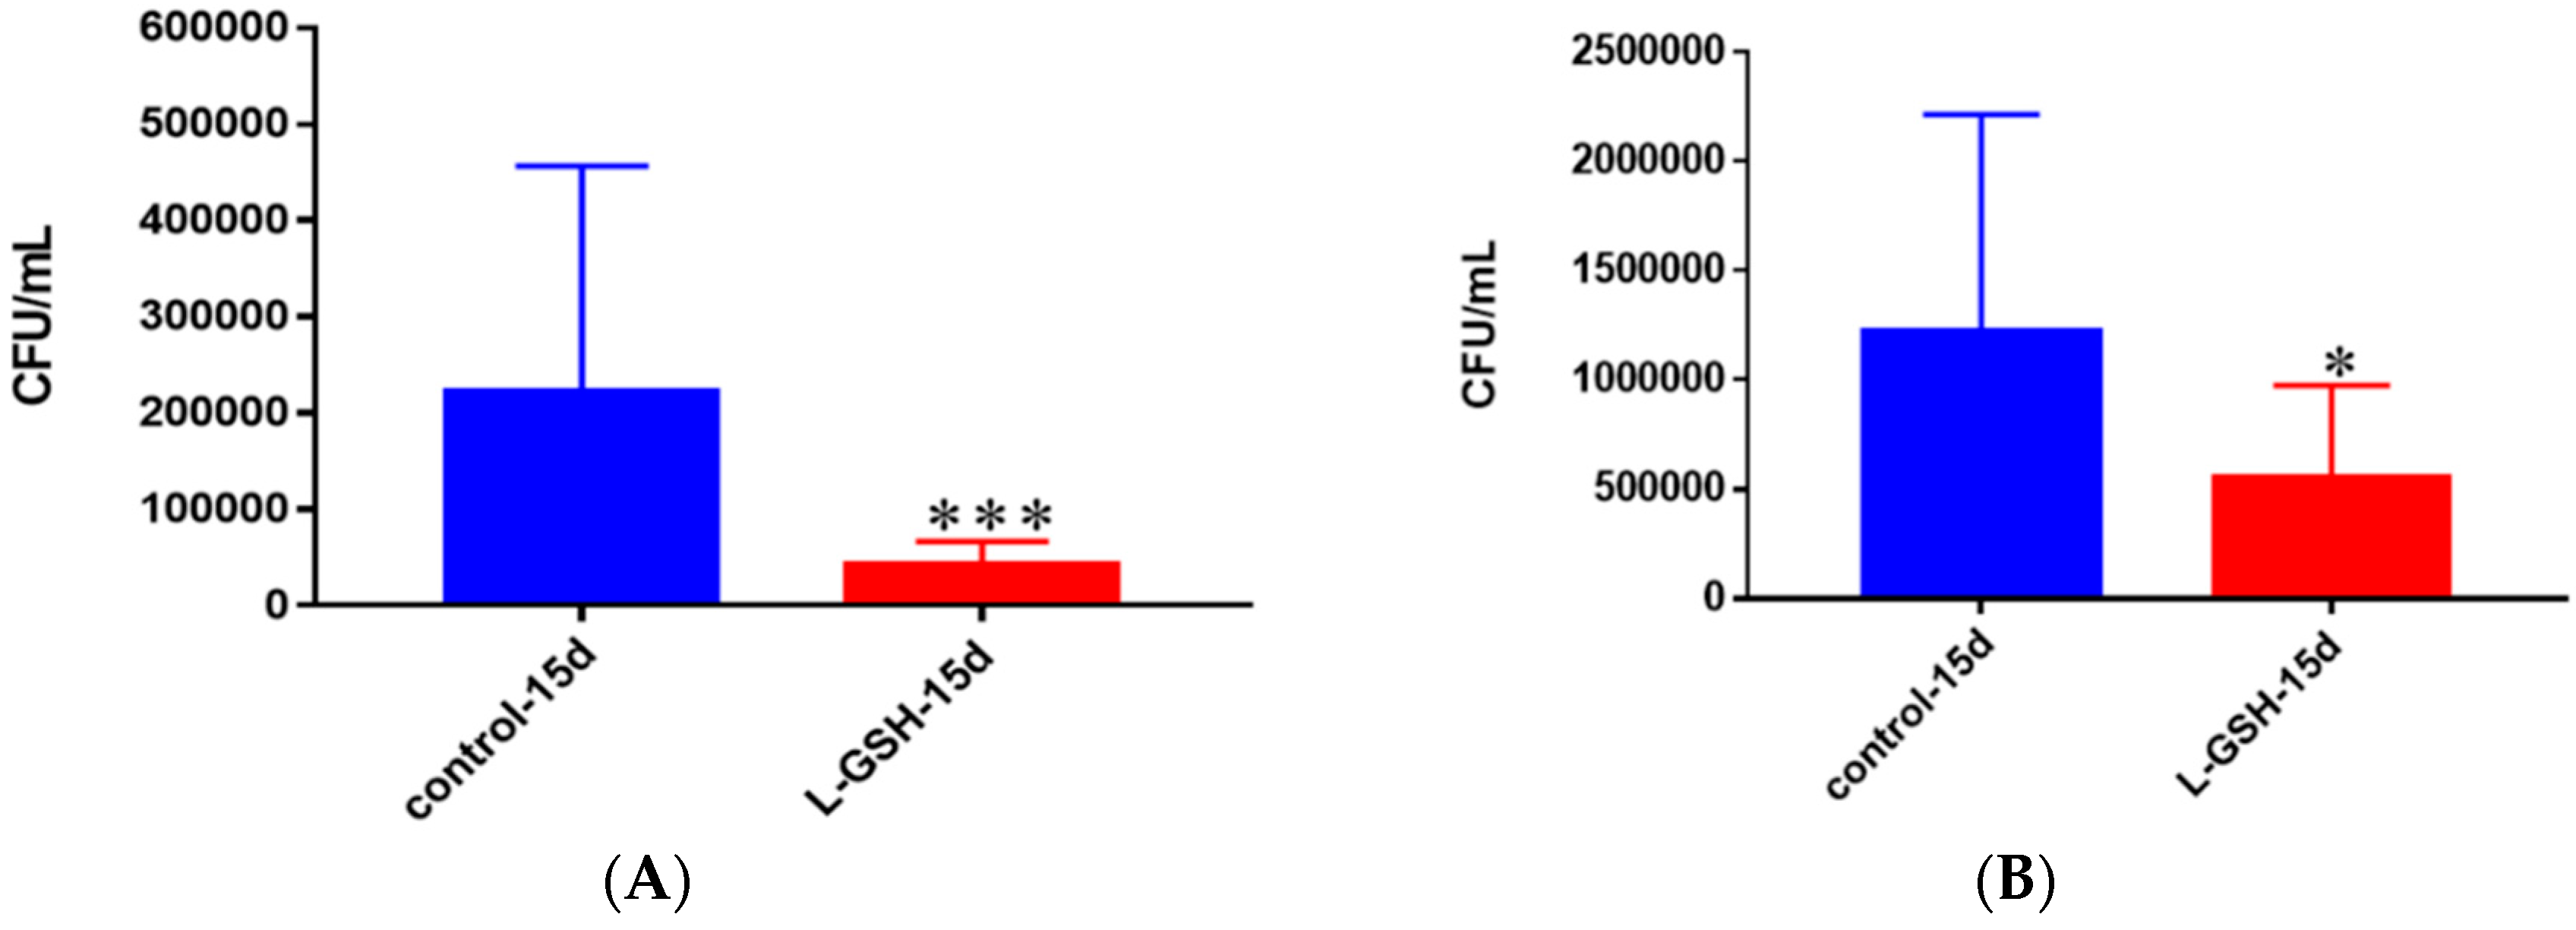
Figure 18.
(A) Survival of M. tb in untreated and L-GSH granulomas of healthy individuals. All samples were separated through density dependent centrifugation from peripheral blood of volunteers and PBMCs were isolated after washes with PBS. In each category 6 × 10⁴ bacteria and 6 × 10⁵ immune cells were used for an MOI of 0.1:1. CFU counts of granulomas formed from healthy individuals showed a statistically significant decrease at 15 days when treated with L-GSH; (B) Survival of M. tb in granulomas of T2DM individuals. All samples were separated through density-dependent centrifugation from peripheral blood of volunteers and PBMCs were isolated after washes with PBS. In each category 6 × 10⁴ bacteria and 6 × 10⁵ immune cells were used for an MOI of 0.1:1. CFU counts of granulomas formed from individuals with T2DM showed a statistically significant decrease at 15 days when treated with L-GSH. Data represent means ± SE from eight healthy individuals and six T2DM individuals. *** p < 0.0005 when comparing samples left untreated and treated with L-GSH for 15 days. * p < 0.05 when comparing untreated samples with samples treated with L-GSH at 15 days.
![Jcm 07 00040 g018]()
Figure 19.
(A) Quantification of Erdman within acidified compartments in PBMCs of healthy individuals treated with L-GSH. Green fluorescent protein (GFP)-labeled M. tb was used with lysotracker red DND99, which labeled acidified compartments, as well as DAPI for nucleus staining. When treated with L-GSH, granulomas showed an increase in bacterial number in acidified compartments compared to the bacteria present in non-acidified compartments. Yellow areas correspond to acidified compartments with GFP-labeled bacteria; (B) fluorescent staining of granulomas from T2DM individuals infected with M. tb. GFP-labeled M. tb was used with lysotracker red DND99, which labeled acidified compartments, as well as DAPI for nucleus staining. When treated with L-GSH, granulomas showed increased numbers of M. tb in acidified compartments compared to the bacteria present in non-acidified compartments. Yellow areas correspond to acidified compartments with GFP labeled bacteria present. Data represent means ± SE from five T2DM individuals and eight healthy individuals. * p < 0.05 when comparing bacterial numbers in acidified versus non-acidified compartments.
![Jcm 07 00040 g019]()
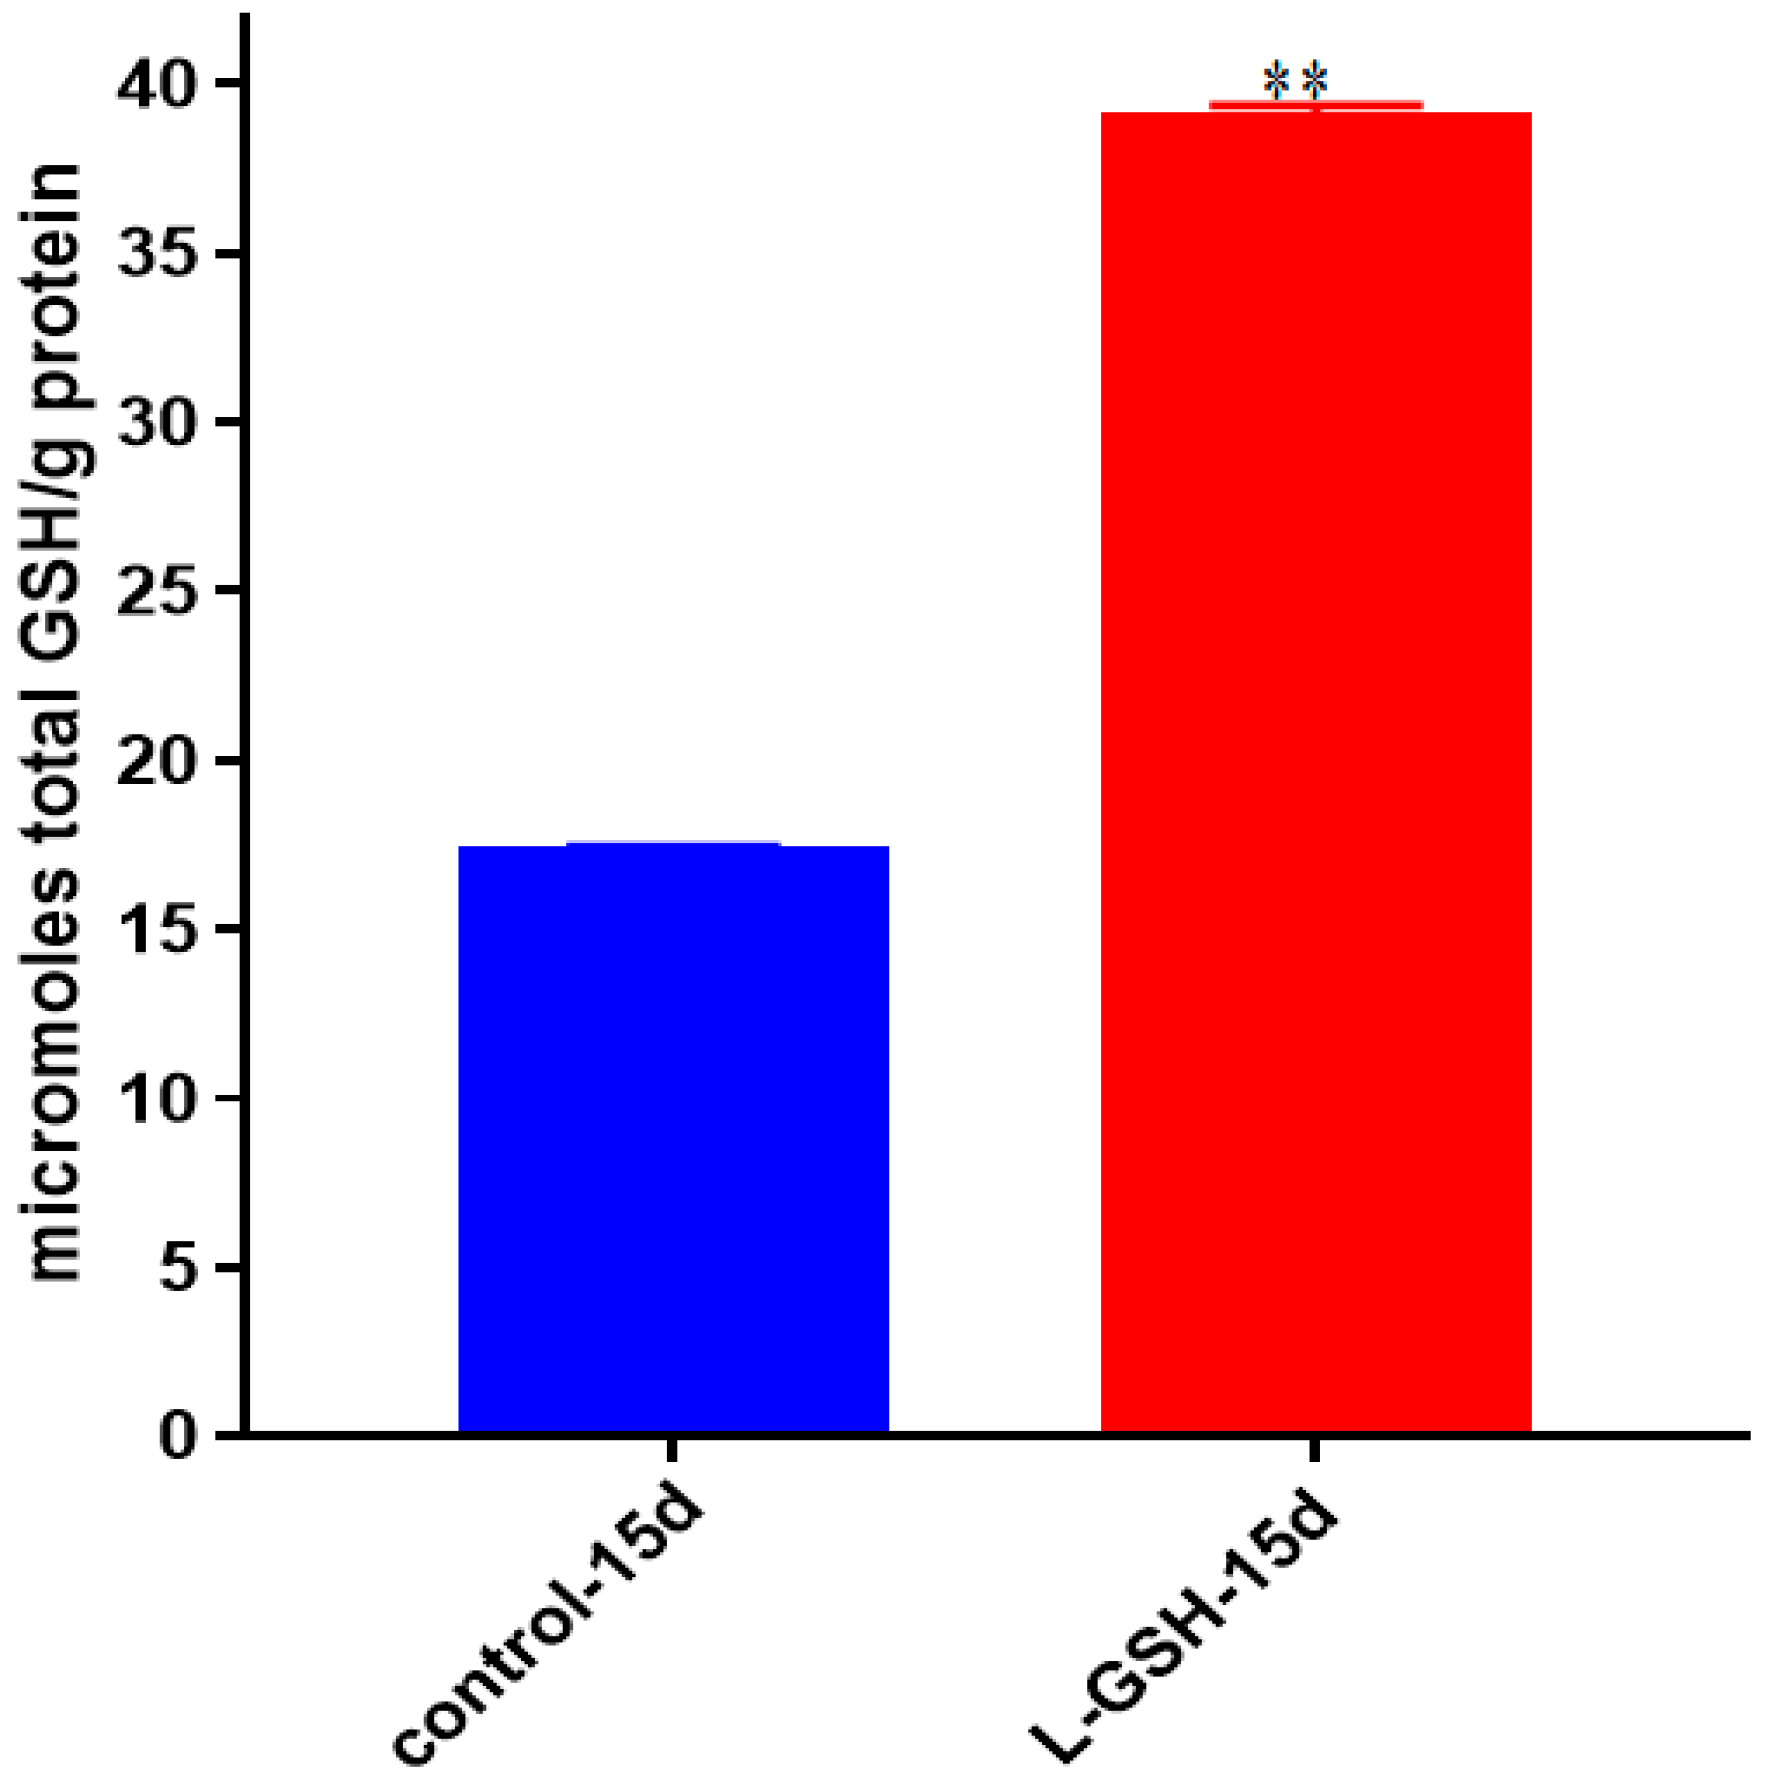
Figure 20.
Total GSH levels in granulomas from healthy individuals infected with M. tb. GSH assay was performed using a colorimetric assay kit from Arbor Assays. Corrections were made to total protein measured by BCA Protein Assay Kit from Thermo Scientific. Both the GSH and total protein levels were measured in lysates excluding any supernatants from samples. Once treated with L-GSH, granulomas from healthy individuals had a statistically significant increase in cellular levels of GSH. Data represent means ± SE from eight healthy individuals. ** p < 0.005 when comparing GSH levels in control and L-GSH treated groups.
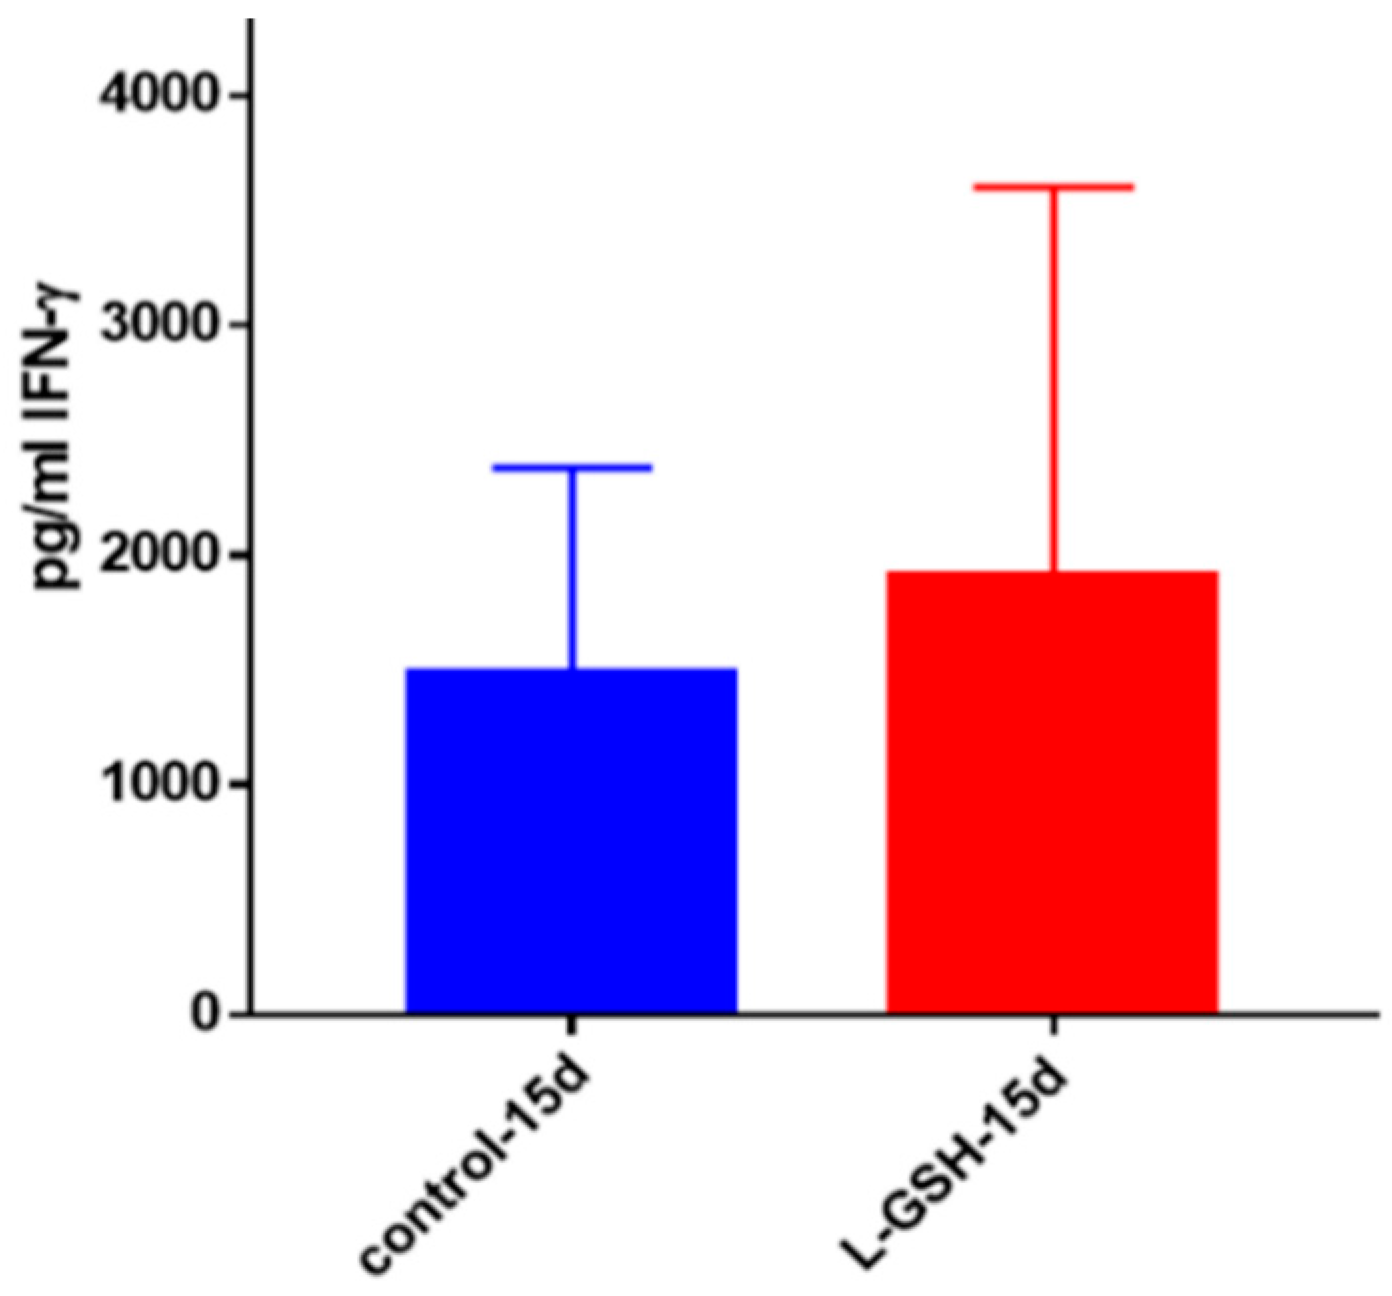
Figure 21.
IFN-γ levels in M. tb-infected granulomas from healthy individuals. Assay of IFN-γ was performed using an ELISA Ready-Set-Go kit from eBioscience. There was a modest increase in levels of IFN-γ measured in supernatants of granulomas from healthy subjects. Data represent means ± SE from eight healthy individuals.
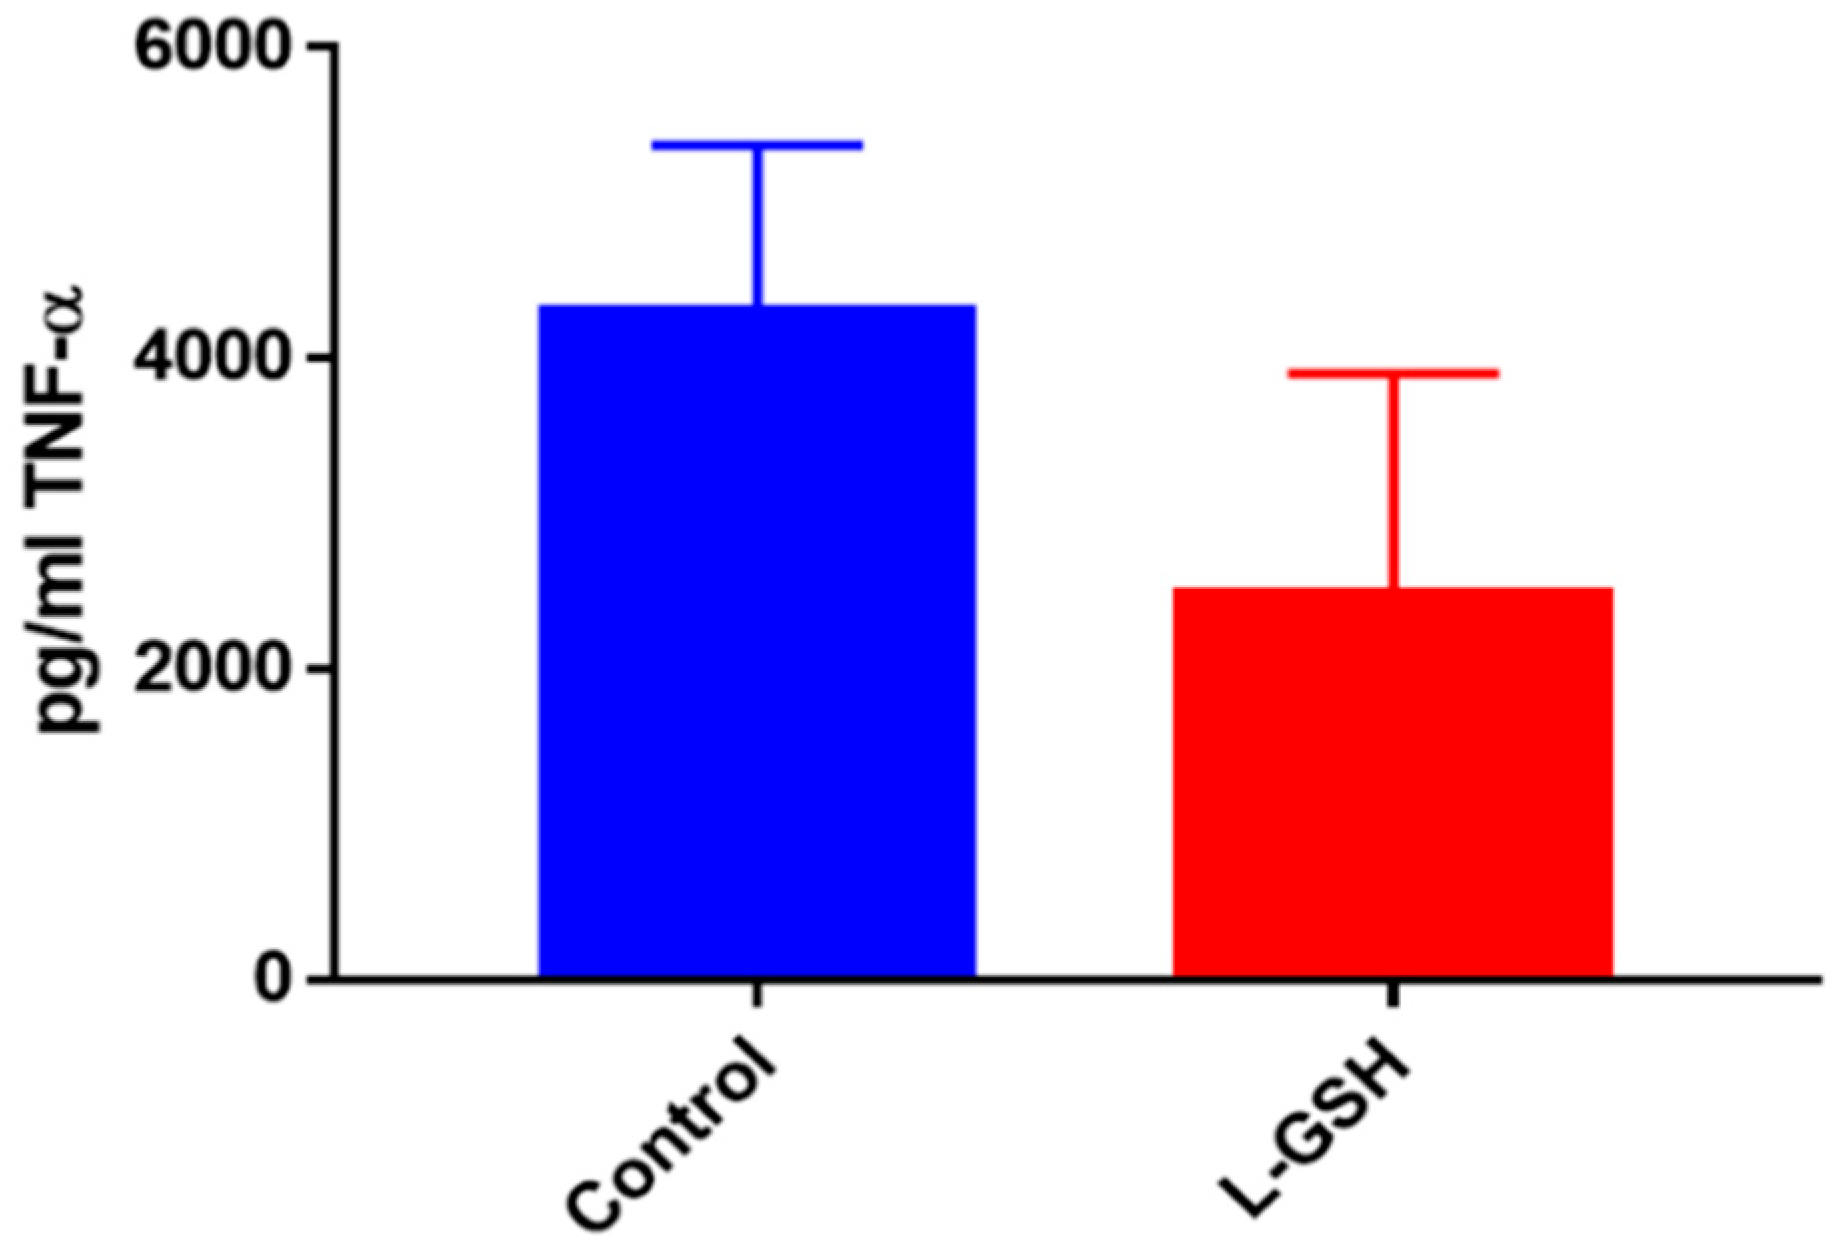
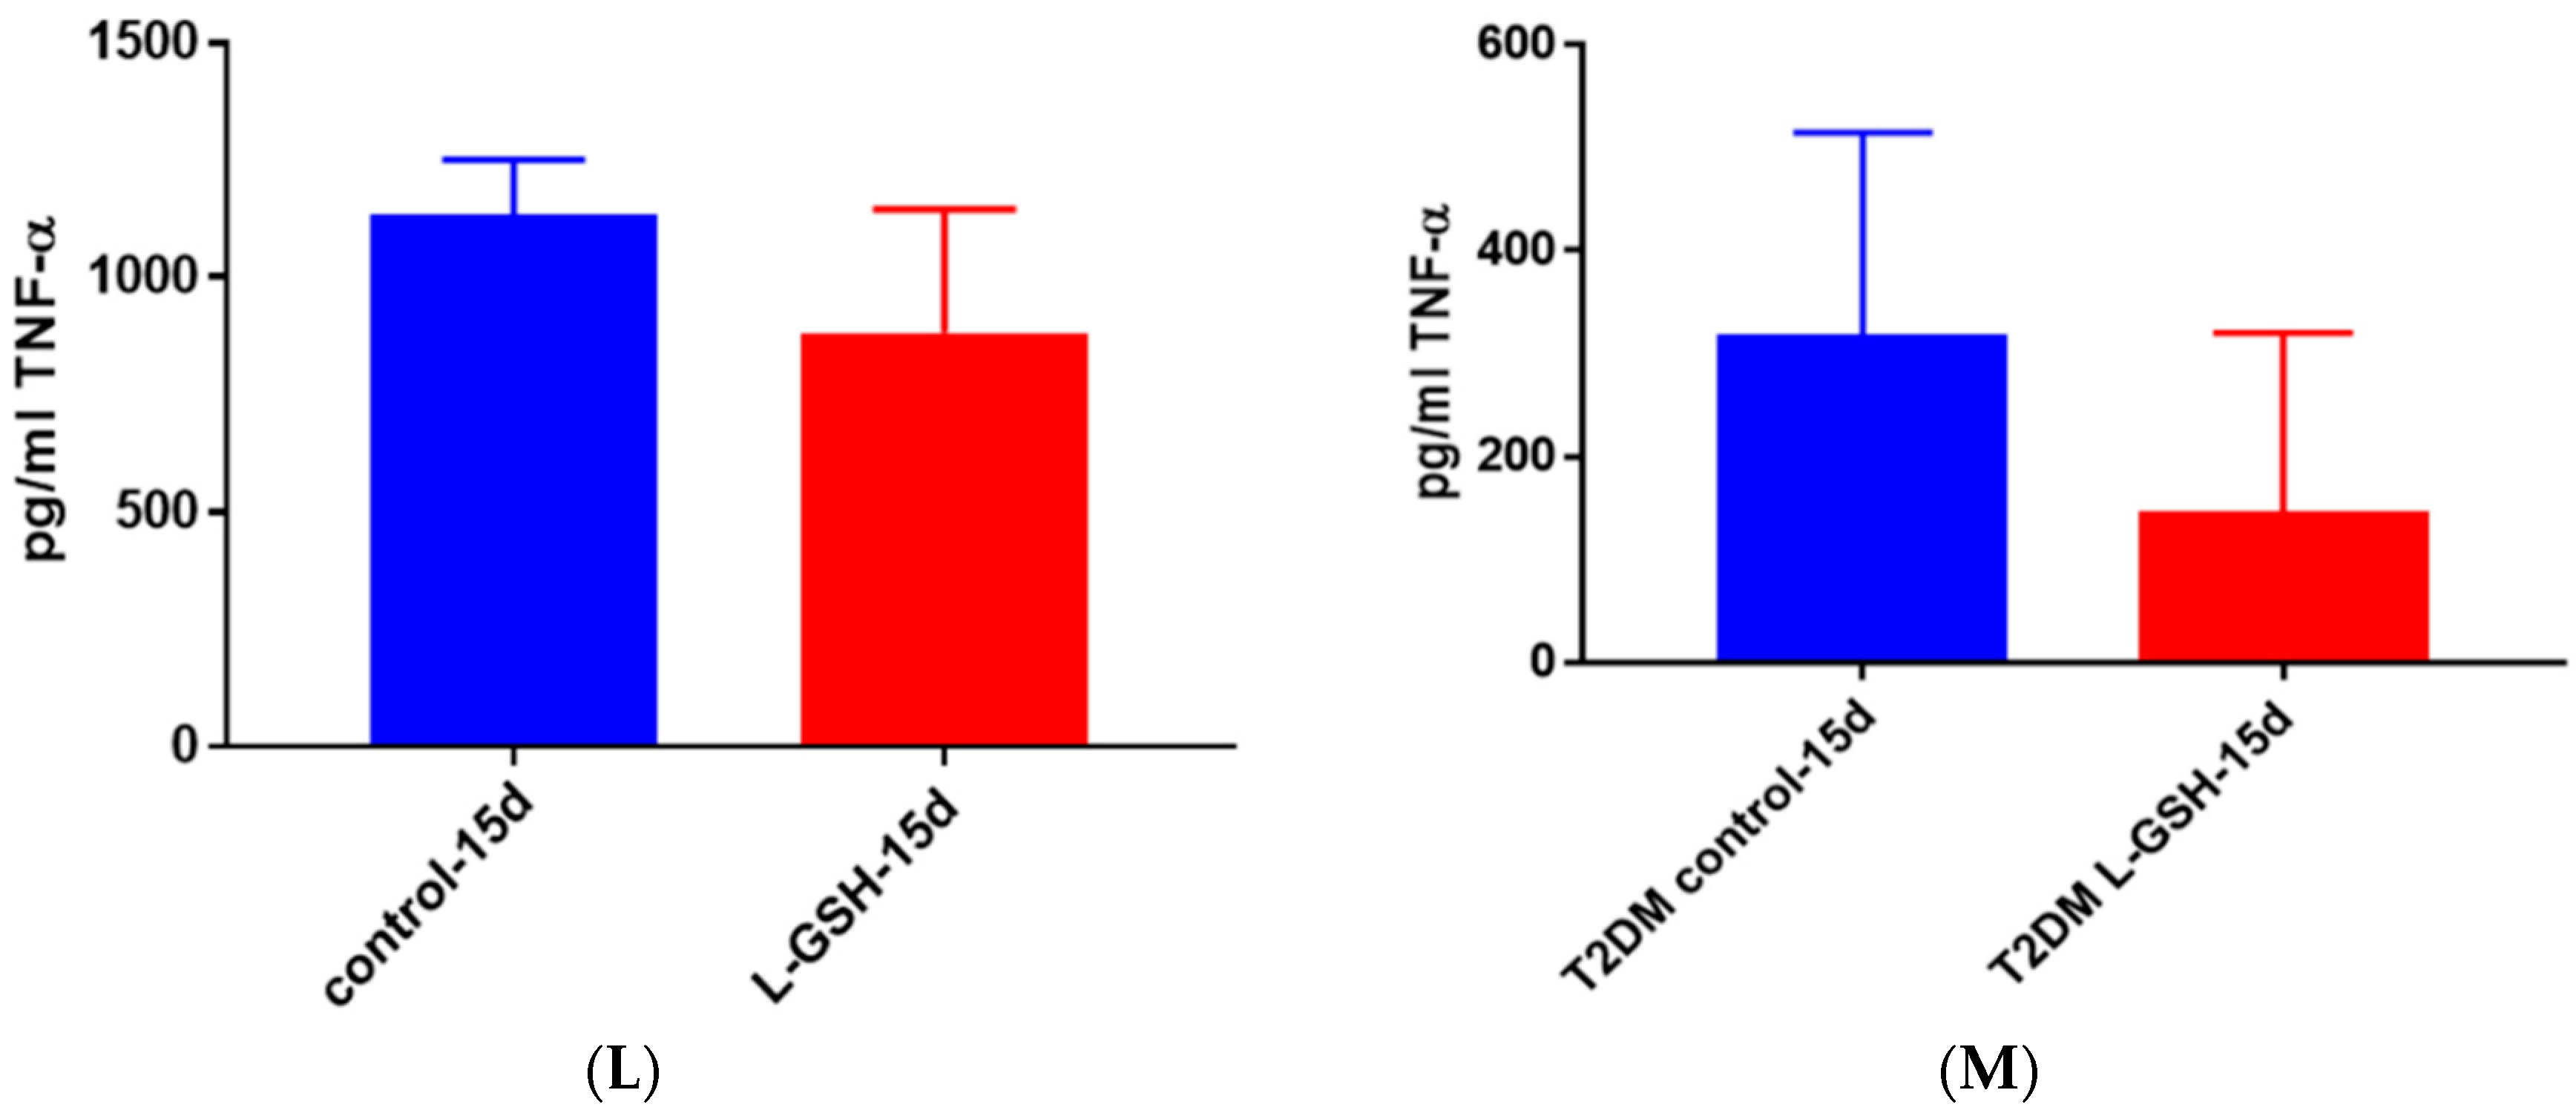
Figure 22.
(A) TNF-α levels in M. tb-infected granulomas from healthy individuals at 15 days. There was a slight reduction in levels of TNF-α when healthy individuals. Granulomas were treated with LGSH after infection with Erdman after 15 days; (B) TNF-α levels in M. tb-infected granulomas from individuals with T2DM individuals. Assay of TNF-α was performed using an ELISA Ready-Set-Go kit from eBioscience. There was a reduction in levels of TNF-α when T2DM individuals. Granulomas were treated with LGSH after infection with Erdman. Data represent means ± SE from six T2DM individuals and eight healthy individuals.
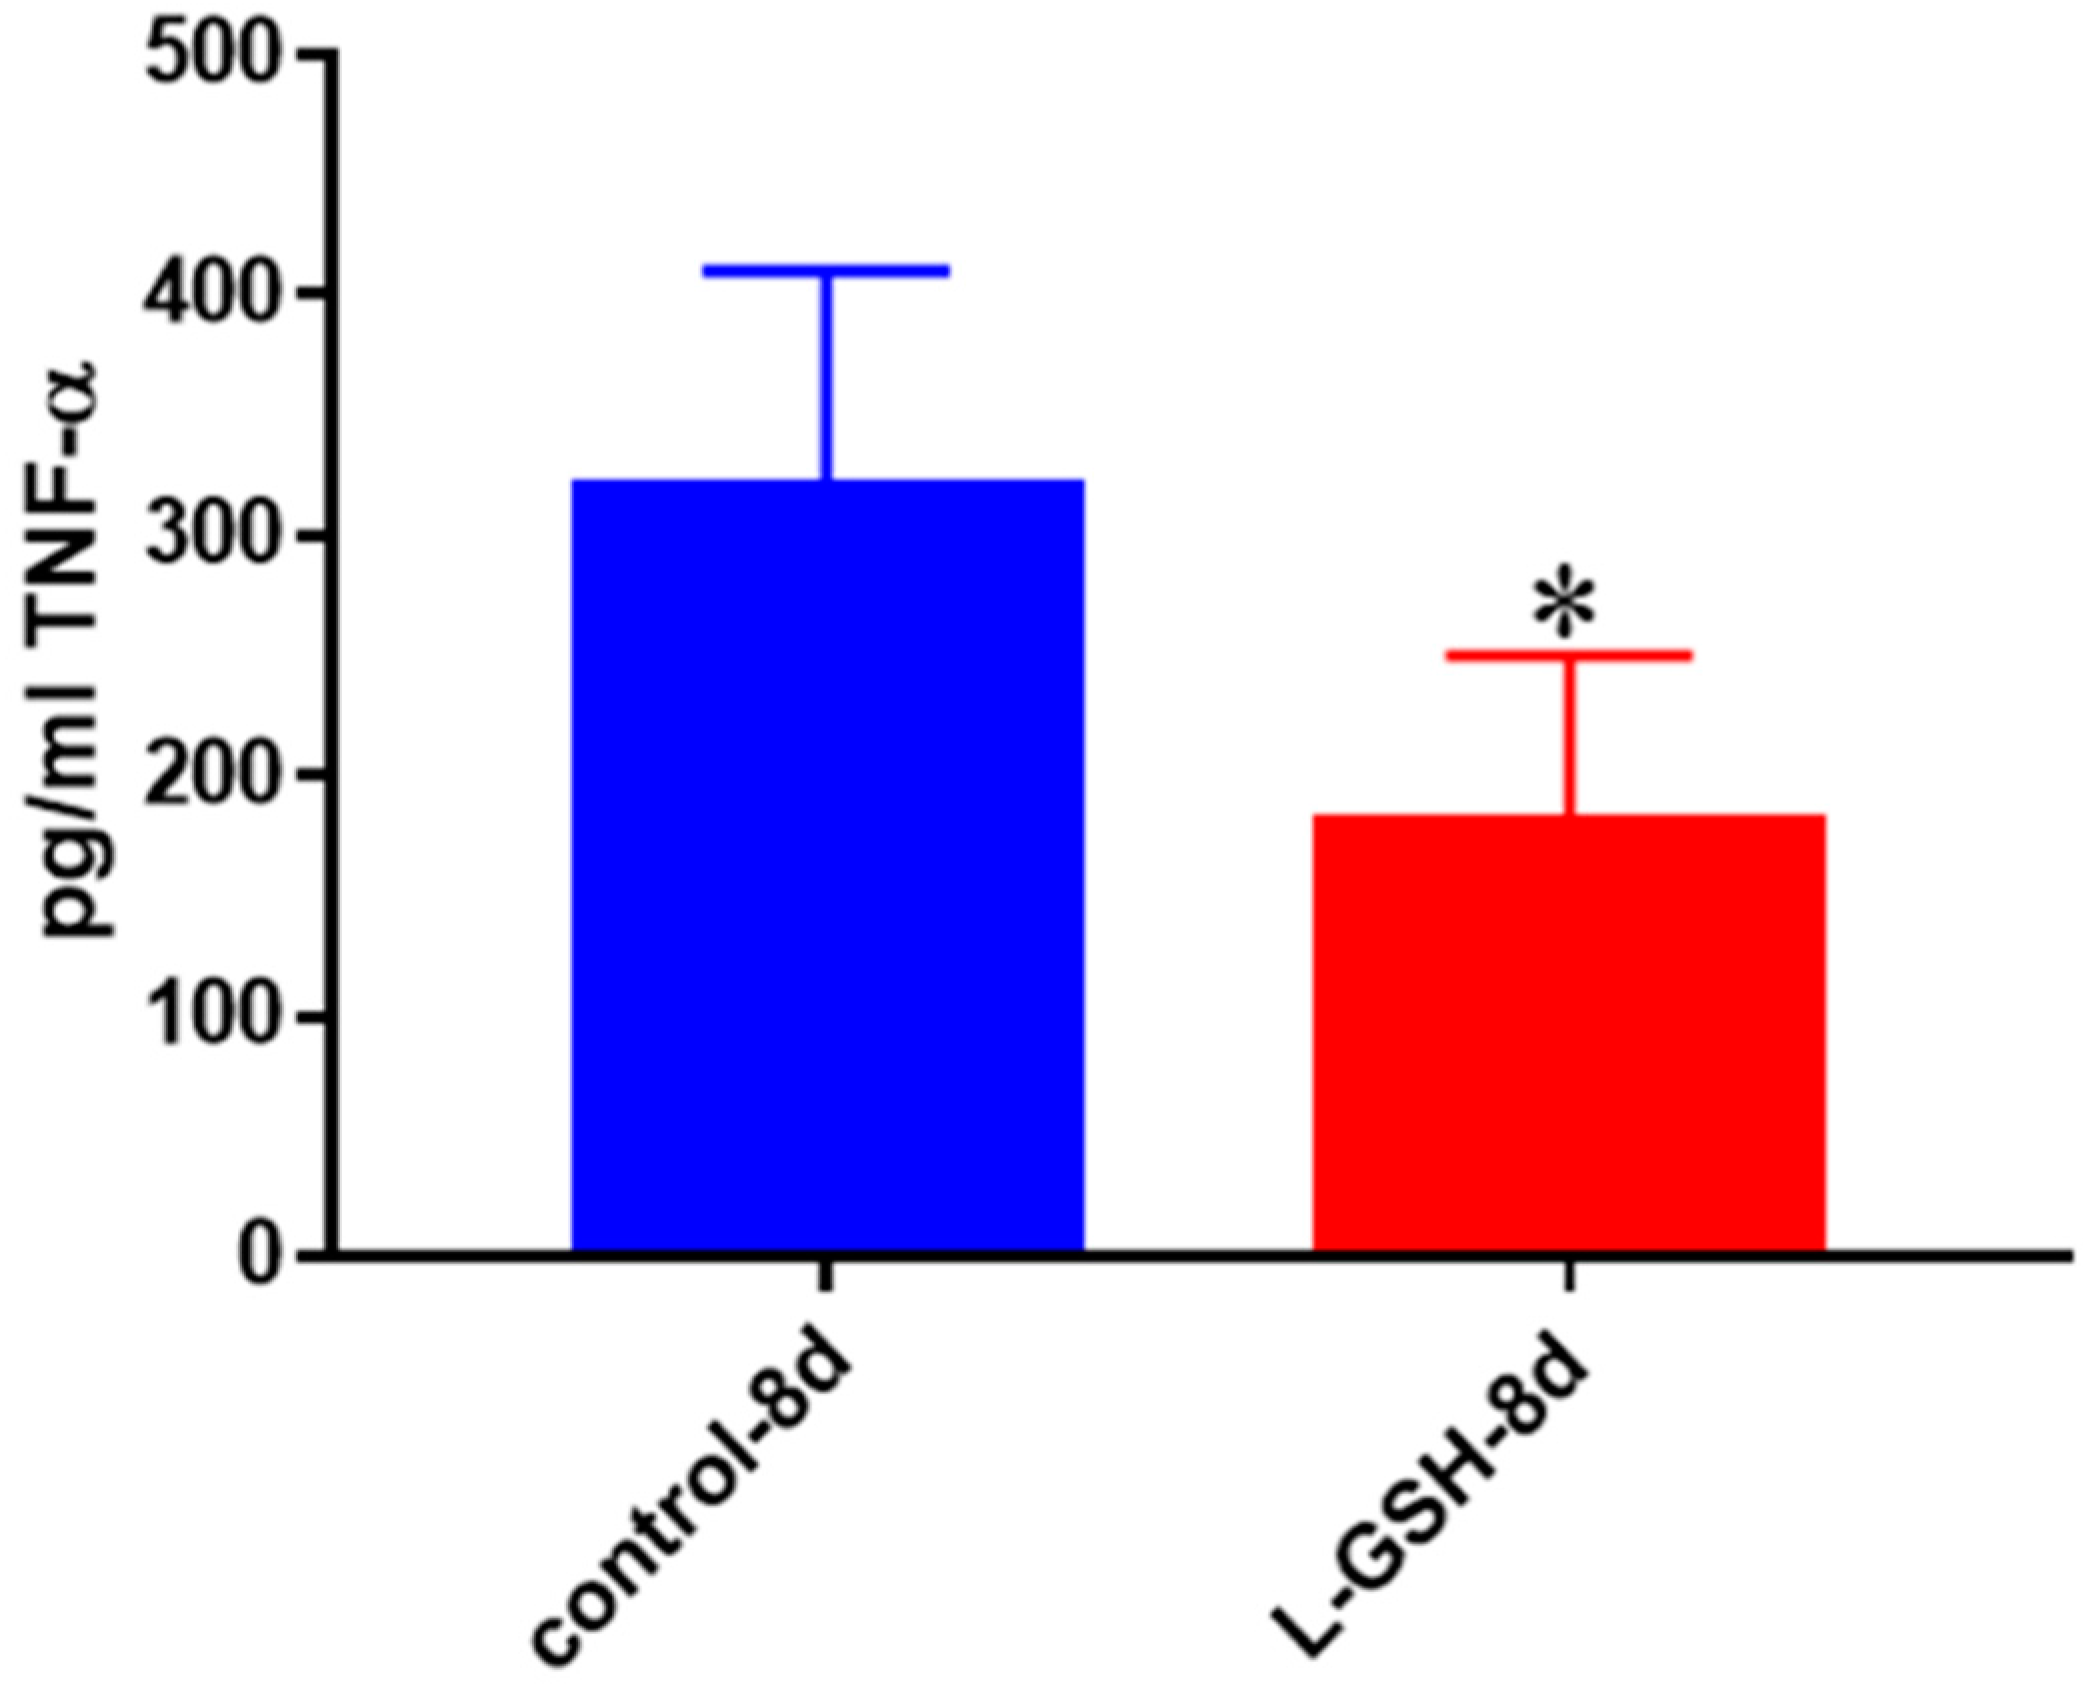
Figure 23.
TNF-α levels in M. tb-infected granulomas from healthy individuals at eight days. Assay of TNF-α was performed using an ELISA Ready-Set-Go kit from eBioscience. There was a statistically significant reduction in levels of TNF-α when healthy individuals’ granulomas were treated with LGSH after infection with Erdman after eight days. Data represent means ± SE from eight healthy individuals. * p < 0.05 when comparing TNF-α levels in control and L-GSH-treated groups.
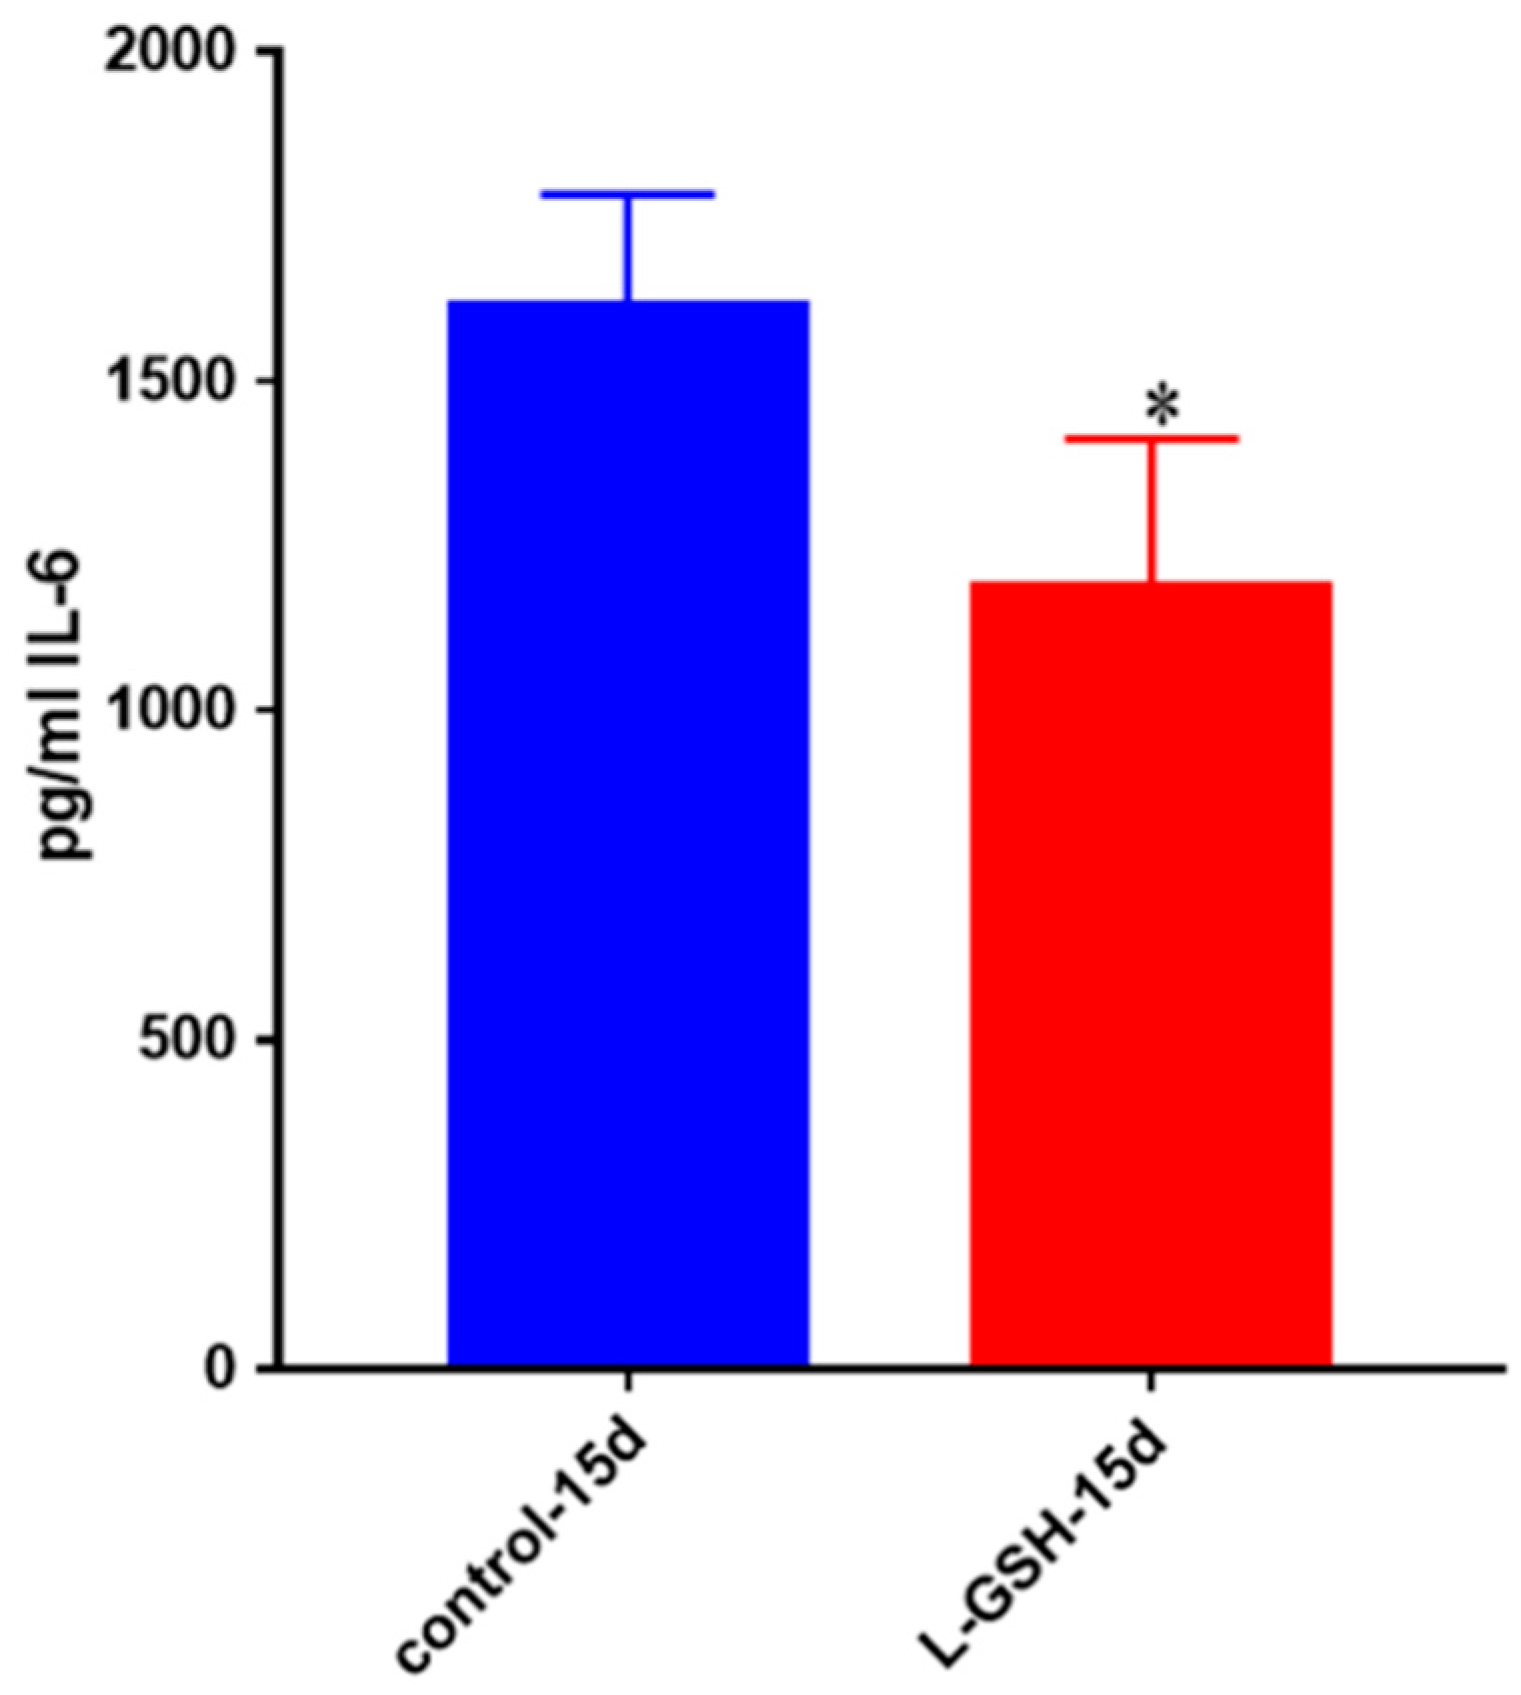
Figure 24.
IL-6 levels in M. tb-infected granulomas from healthy individuals. Assay of IL-6 was performed using an ELISA Ready-Set-Go kit from eBioscience. There was a significant reduction in levels of IL-6 when healthy individuals’ granulomas were treated with LGSH after infection with Erdman. Data represent means ± SE from eight healthy individuals. * p < 0.05 when comparing L-GSH treated samples to untreated samples at 15 days.
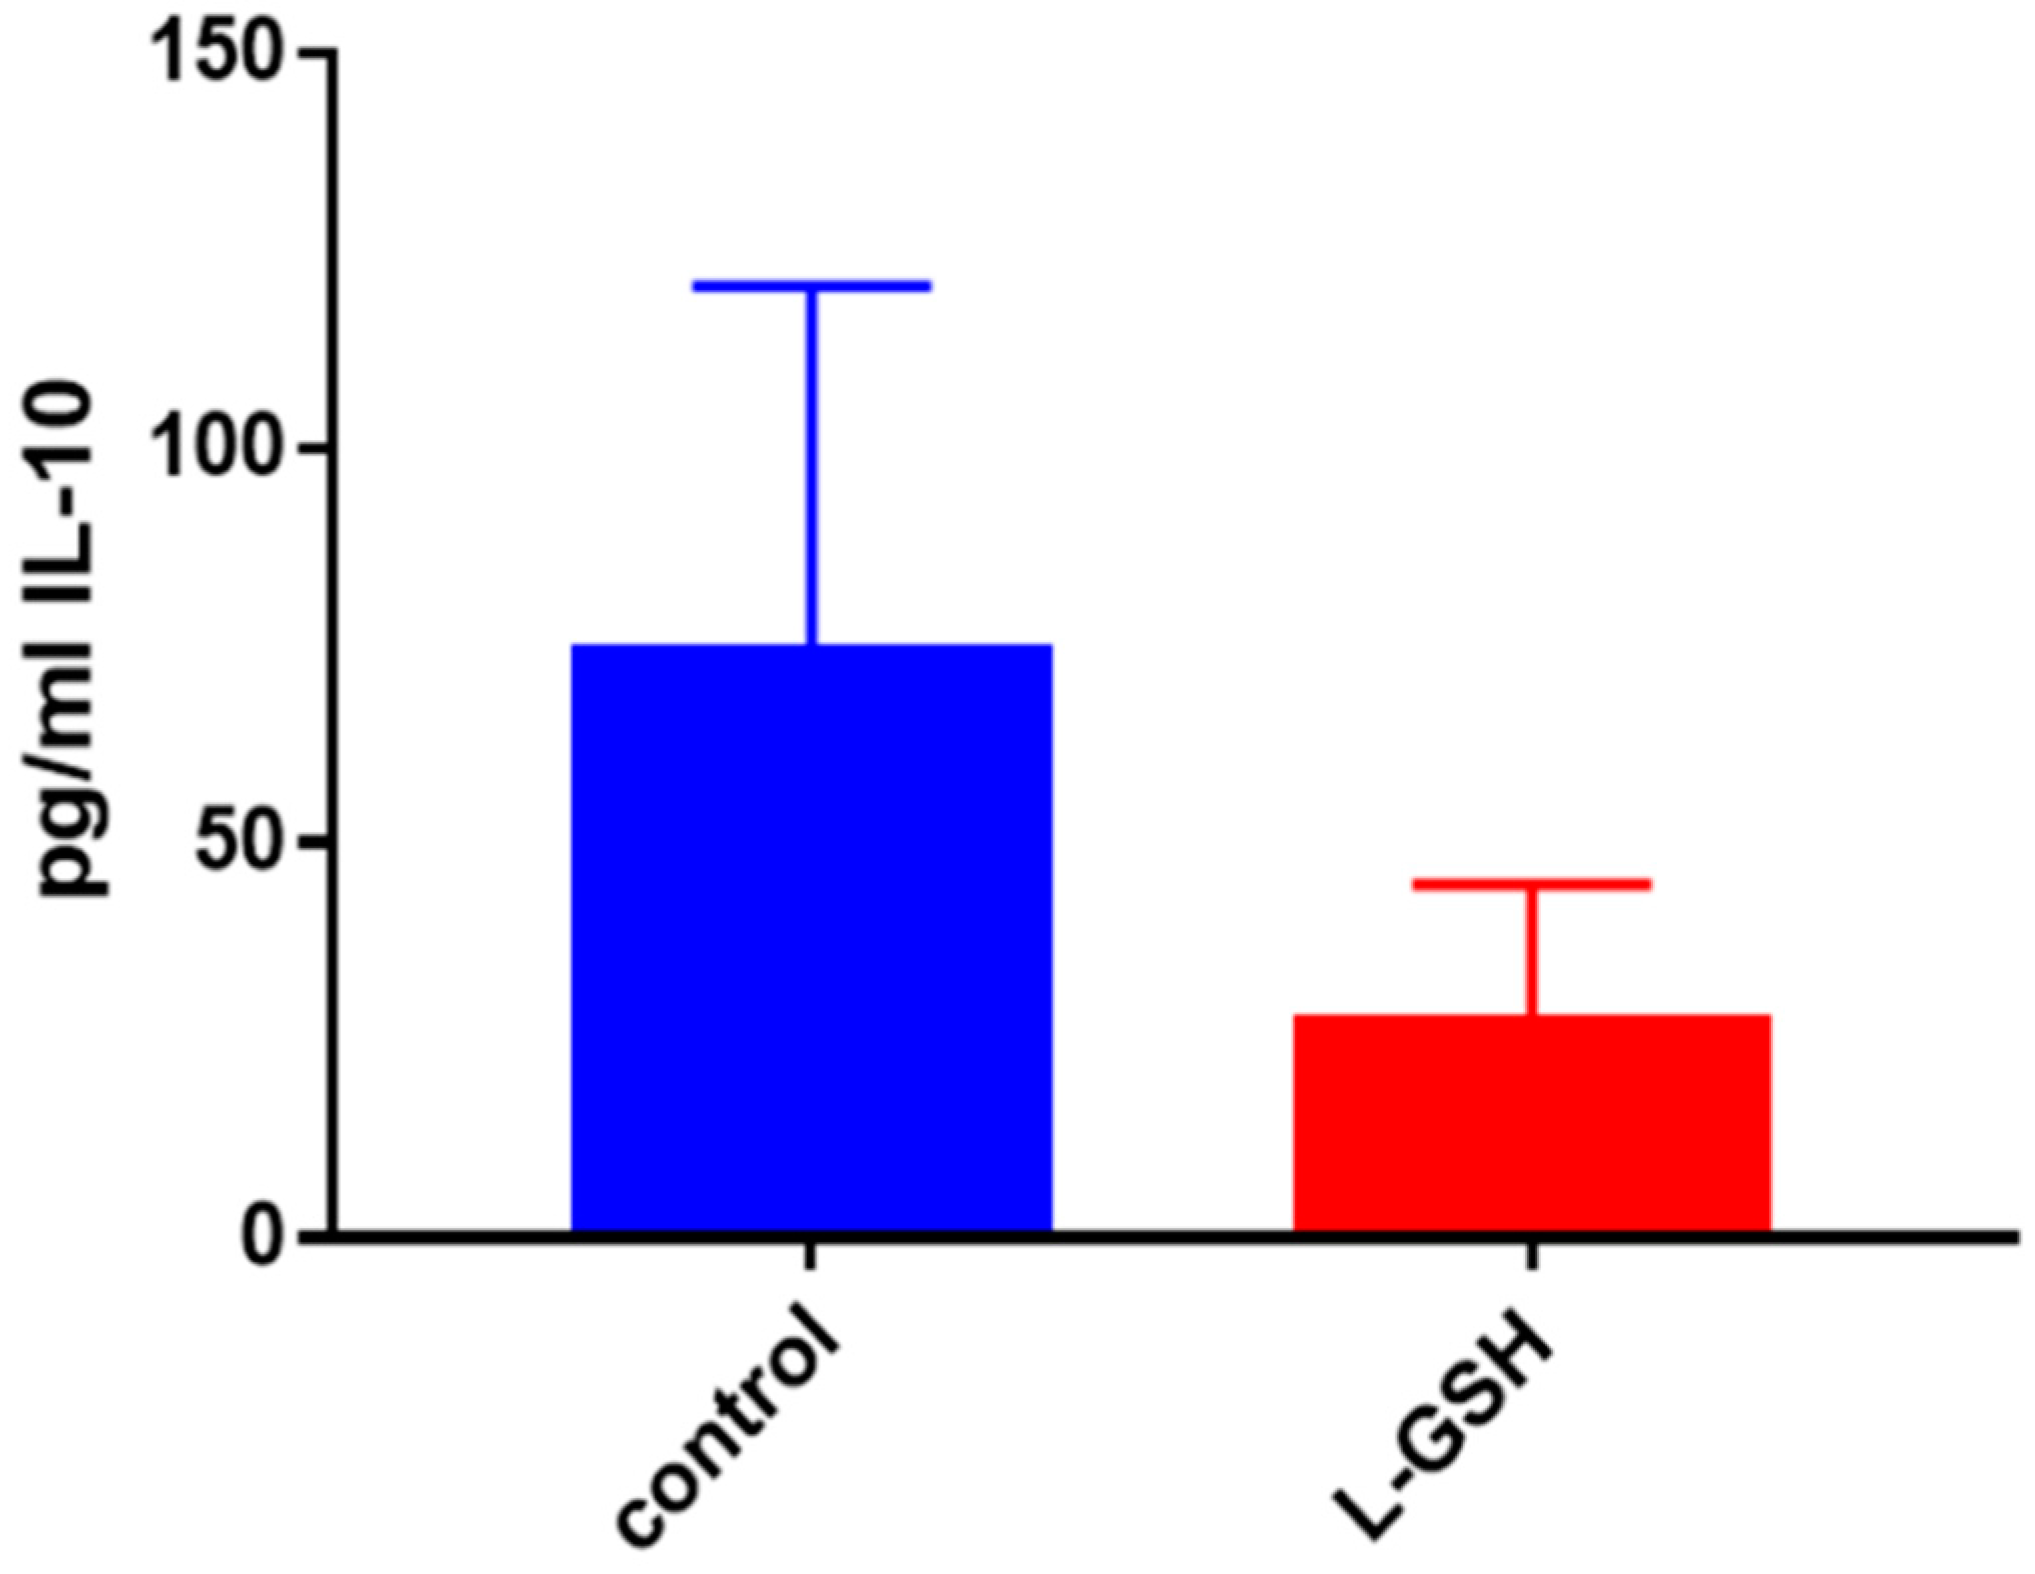
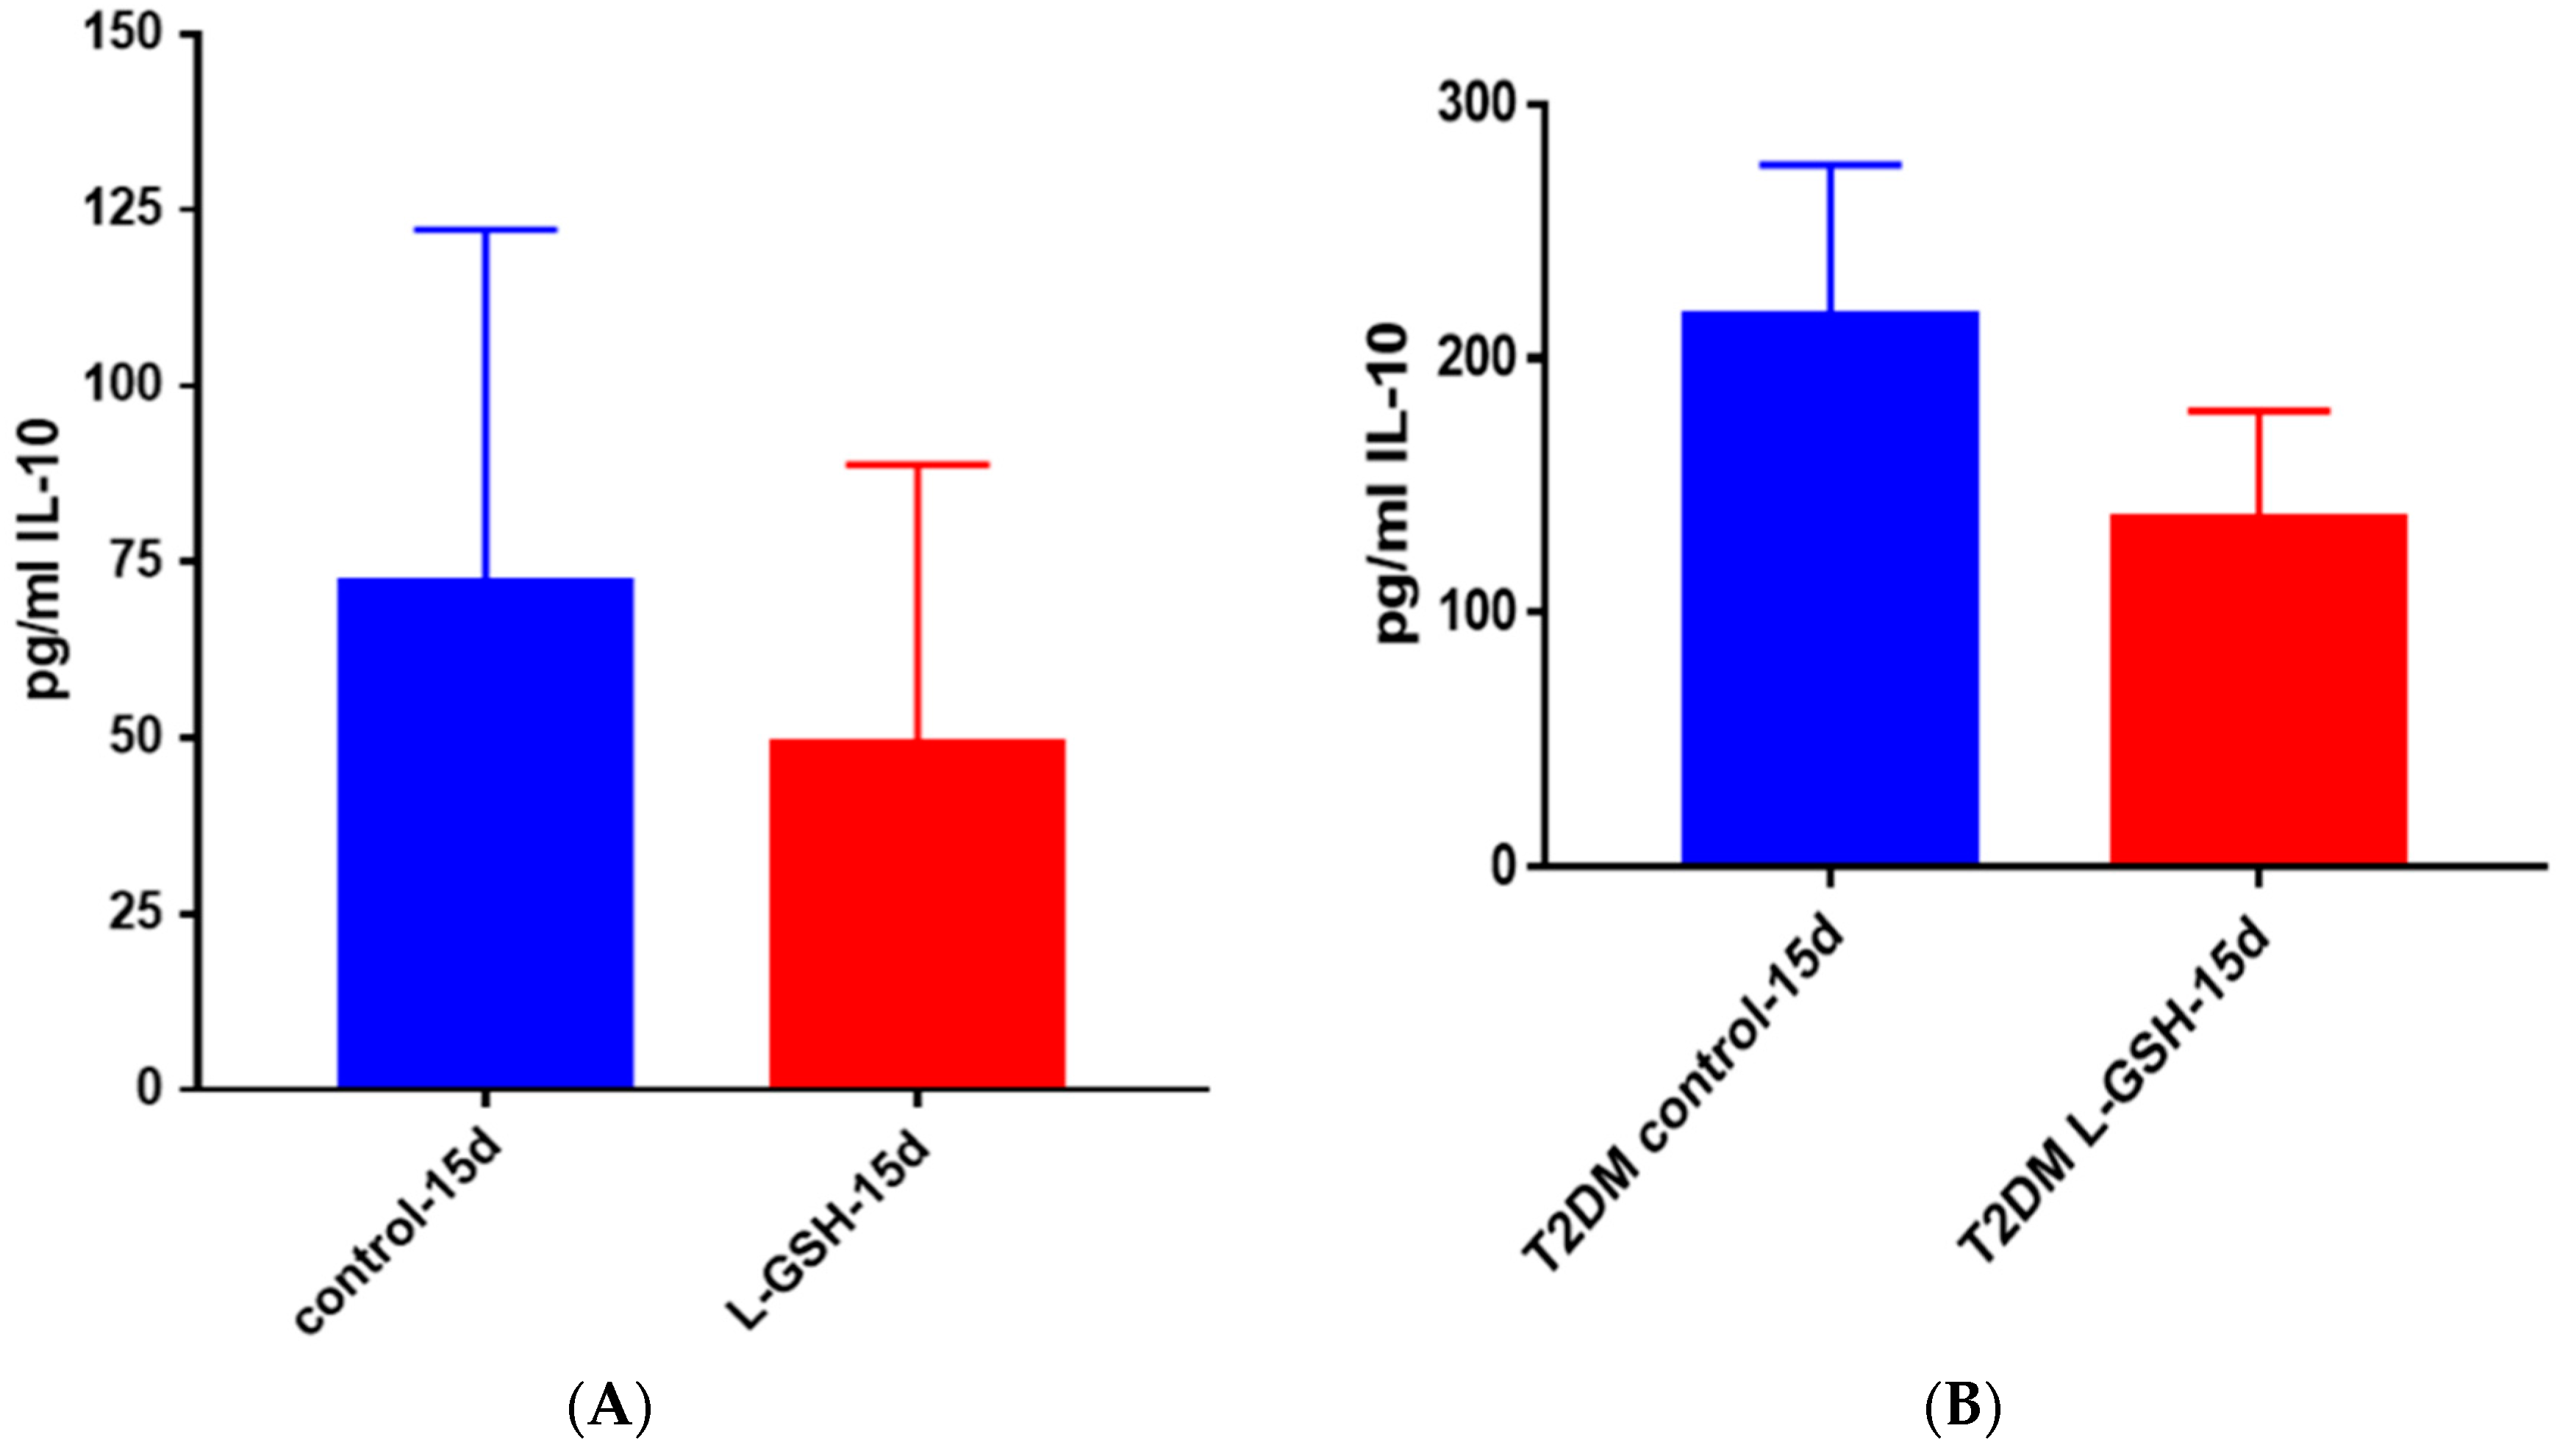
Figure 25.
(A) IL-10 levels in M. tb-infected granulomas from healthy individuals. There was a reduction in levels of IL-10 when healthy individuals; (B) IL-10 levels in M. tb-infected granulomas from individuals with T2DM. Assay of IL-10 was performed using an ELISA Ready-Set-Go kit from eBioscience. Although not significant, there was a reduction in levels of IL-10 when T2DM individuals. Granulomas were treated with LGSH after infection with Erdman. Data represent means ± SE from six T2DM individuals and eight healthy individuals.

 ,
, 