Decreased Bioelectrical Impedance Phase Angle in Hospitalized Children and Adolescents with Newly Diagnosed Type 1 Diabetes: A Case-Control Study

 , , ,
, , ,  ,
, 
Abstract
1. Introduction
2. Experimental Section
2.1. Ethics
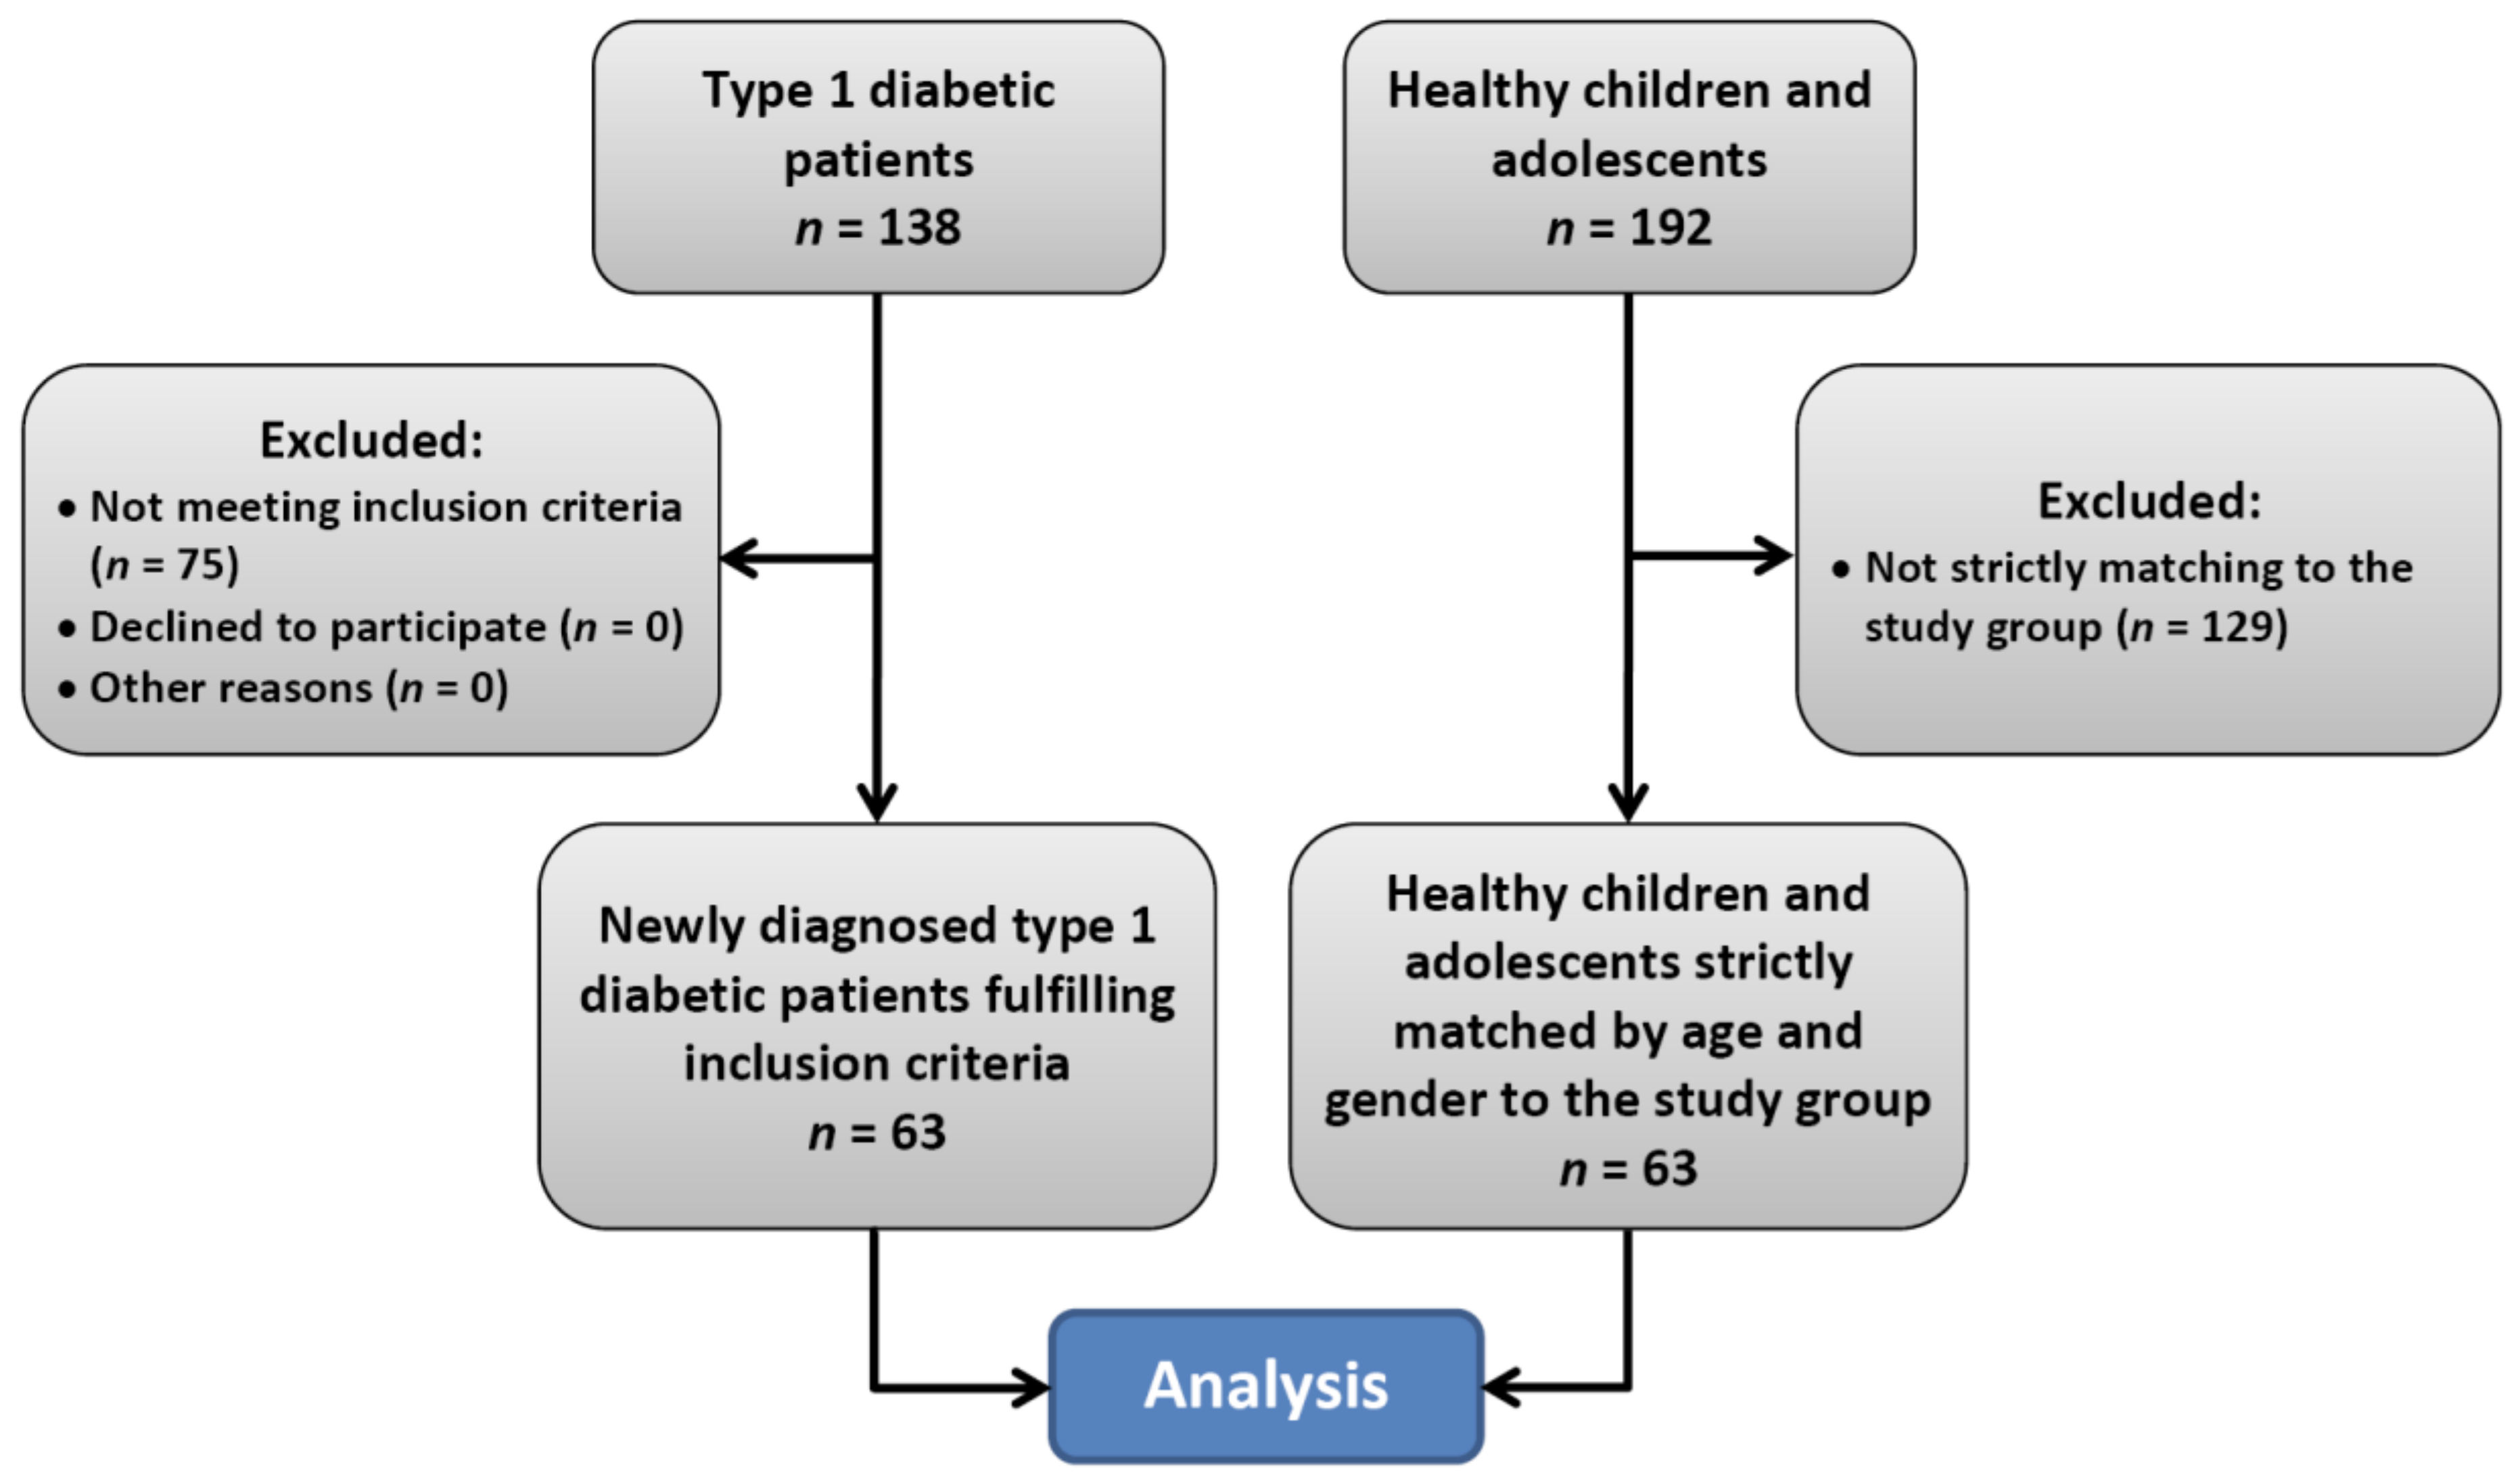
2.2. Subjects
2.3. Assessments
2.4. Statistical Analysis
3. Results
4. Discussion
5. Conclusions
Author Contributions
Funding
Acknowledgments
Conflicts of Interest
References
- Baumgartner, R.N.; Chumlea, W.C.; Roche, A.F. Estimation of body composition from bioelectric impedance of body segments. Am. J. Clin. Nutr. 1989, 50, 221–226. [Google Scholar] [CrossRef] [PubMed]
- Shafer, K.J.; Siders, W.A.; Johnson, L.K.; Lukaski, H.C. Validity of segmental multiple-frequency bioelectrical impedance analysis to estimate body composition of adults across a range of body mass indexes. Nutrition 2009, 25, 25–32. [Google Scholar] [CrossRef]
- Stoklossa, C.A.J.; Forhan, M.; Padwal, R.S.; Gonzalez, M.C.; Prado, C.M. Practical considerations for body composition assessment of adults with class II/III obesity using Bioelectrical Impedance Analysis or Dual-Energy, X.-Ray Absorptiometry. Curr. Obes. Rep. 2016, 5, 389–396. [Google Scholar] [CrossRef] [PubMed]
- Wan, C.S.; Ward, L.C.; Halim, J.; Gow, M.L.; Ho, M.; Briody, J.N.; Leung, K.; Cowell, C.T.; Garnett, S.P. Bioelectrical impedance analysis to estimate body composition, and change in adiposity, in overweight and obese adolescents: Comparison with dual-energy x-ray absorptiometry. BMC Pediatr. 2014, 14, 249. [Google Scholar] [CrossRef] [PubMed]
- Böhm, A.; Heitmann, B.L. The use of bioelectrical impedance analysis for body composition in epidemiological studies. Eur. J. Clin. Nutr. 2013, 67, S79. [Google Scholar] [CrossRef] [PubMed]
- Selberg, O.; Selberg, D. Norms and correlates of bioimpedance phase angle in healthy human subjects, hospitalized patients, and patients with liver cirrhosis. Eur. J. Appl. Physiol. 2002, 86, 509–516. [Google Scholar] [CrossRef] [PubMed]
- Zhang, G.; Huo, X.; Wu, C.; Zhang, C.; Duan, Z. A bioelectrical impedance phase angle measuring system for assessment of nutritional status. Biomed. Mater. Eng. 2014, 24, 3657–3664. [Google Scholar] [CrossRef] [PubMed]
- Khalil, S.F.; Mohktar, M.S.; Ibrahim, F. The theory and fundamentals of bioimpedance analysis in clinical status monitoring and diagnosis of diseases. Sensors 2014, 14, 10895–10928. [Google Scholar] [CrossRef] [PubMed]
- Bosy-Westphal, A.; Danielzik, S.; Dörhöfer, R.P.; Later, W.; Wiese, S.; Müller, M.J. Phase angle from bioelectrical impedance analysis: Population reference values by age, sex, and body mass index. JPEN J. Parenter. Enteral. Nutr. 2006, 30, 309–316. [Google Scholar] [CrossRef]
- Redondo-del-Río, M.P.; Camina-Martín, M.A.; Marugan-de-Miguelsanz, J.M.; de- Mateo-Silleras, B. Bioelectrical impedance vector reference values for assessing body composition in a Spanish child and adolescent population. Am. J. Hum. Biol. 2017, 29, e22978. [Google Scholar] [CrossRef] [PubMed]
- Kuchnia, A.J.; Teigen, L.M.; Cole, A.J.; Mulasi, U.; Gonzalez, M.C.; Heymsfield, S.B.; Vock, D.M.; Earthman, C.P. Phase angle and impedance ratio: Reference cut-points from the United States National Health and Nutrition Examination Survey 1999-2004 from bioimpedance spectroscopy data. JPEN J. Parenter. Enteral. Nutr. 2017, 41, 1310–1315. [Google Scholar] [CrossRef] [PubMed]
- Norman, K.; Stobäus, N.; Pirlich, M.; Bosy-Westphal, A. Bioelectrical phase angle and impedance vector analysis--clinical relevance and applicability of impedance parameters. Clin. Nutr. 2012, 31, 854–861. [Google Scholar] [CrossRef] [PubMed]
- Maddocks, M.; Kon, S.S.; Jones, S.E.; Canavan, J.L.; Nolan, C.M.; Higginson, I.J.; Gao, W.; Polkey, M.I.; Man, W.D. Bioelectrical impedance phase angle relates to function, disease severity and prognosis in stable chronic obstructive pulmonary disease. Clin. Nutr. 2015, 34, 1245–1250. [Google Scholar] [CrossRef] [PubMed]
- Kyle, U.G.; Genton, L.; Pichard, C. Low phase angle determined by bioelectrical impedance analysis is associated with malnutrition and nutritional risk at hospital admission. Clin. Nutr. 2013, 32, 294–299. [Google Scholar] [CrossRef] [PubMed]
- Cederholm, T.; Barazzoni, R.; Austin, P.; Ballmer, P.; Biolo, G.; Bischoff, S.C.; Compher, C.; Correia, I.; Higashiguchi, T.; Holst, M.; et al. ESPEN guidelines on definitions and terminology of clinical nutrition. Clin. Nutr. 2017, 36, 49–64. [Google Scholar] [CrossRef] [PubMed]
- Buscemi, S.; Blunda, G.; Maneri, R.; Verga, S. Bioelectrical characteristics of type 1 and type 2 diabetic subjects with reference to body water compartments. Acta. Diabetol. 1998, 35, 220–223. [Google Scholar] [CrossRef]
- Dittmar, M.; Reber, H.; Kahaly, G.J. Bioimpedance phase angle indicates catabolism in Type 2 diabetes. Diabet. Med. 2015, 32, 1177–1185. [Google Scholar] [CrossRef]
- Kułaga, Z.; Różdżyńska-Świątkowska, A.; Grajda, A.; Gurzkowska, B.; Wojtyło, M.; Góźdź, M.; Świąder-Leśniak, A.; Litwin, M. Percentile charts for growth and nutritional status assessment in Polish children and adolescents from birth to 18 year of age. Standard. Med. Ped. 2015, 12, 119–135. [Google Scholar]
- Sun, S.S.; Chumlea, W.C.; Heymsfield, S.B.; Lukaski, H.C.; Schoeller, D.; Friedl, K.; Kuczmarski, R.J.; Flegal, K.M.; Johnson, C.L.; Hubbard, V.S. Development of bioelectrical impedance analysis prediction equations for body composition with the use of a multicomponent model for use in epidemiologic surveys. Am. J. Clin. Nutr. 2003, 77, 331–340. [Google Scholar] [CrossRef]
- Horlick, M.; Arpadi, S.M.; Bethel, J.; Wang, J.; Moye, J. Jr.; Cuff, P.; Pierson, R.N.Jr.; Kotler, D. Bioelectrical impedance analysis models for prediction of total body water and fat-free mass in healthy and HIV-infected children and adolescents. Am. J. Clin. Nutr. 2002, 76, 991–999. [Google Scholar] [CrossRef]
- Kyle, U.G.; Bosaeus, I.; De Lorenzo, A.D.; Deurenberg, P.; Elia, M.; Gómez, J.M.; Heitmann, B.L.; Kent-Smith, L.; Melchior, J.C.; Pirlich, M.; et al. Bioelectrical impedance analysis—part I: Review of principles and methods. Clin. Nutr. 2004, 23, 1226–1243. [Google Scholar] [CrossRef] [PubMed]
- Davis, N.L.; Bursell, J.D.; Evans, W.D.; Warner, J.T.; Gregory, J.W. Body composition in children with type 1 diabetes in the first year after diagnosis: Relationship to glycaemic control and cardiovascular risk. Arch. Dis. Child. 2012, 97, 312–315. [Google Scholar] [CrossRef] [PubMed]
- Galli-Tsinopoulou, A.; Grammatikopoulou, M.G.; Stylianou, C.; Kokka, P.; Emmanouilidou, E. A preliminary case-control study on nutritional status, body composition, and glycemic control of Greek children and adolescents with type 1 diabetes. J. Diabetes. 2009, 1, 36–42. [Google Scholar] [CrossRef] [PubMed]
- Szadkowska, A.; Madej, A.; Ziółkowska, K.; Szymańska, M.; Jeziorny, K.; Mianowska, B.; Pietrzak, I. Gender and Age—Dependent effect of type 1 diabetes on obesity and altered body composition in young adults. Ann. Agric. Environ. Med. 2015, 22, 124–128. [Google Scholar] [CrossRef] [PubMed]
- DCCT Research Group. Weight gain associated with intensive therapy in the Diabetes Control and Complications Trial. Diabetes Care 1988, 11, 567–573. [Google Scholar] [CrossRef]
- Purnell, J.Q.; Zinman, B.; Brunzell, J.D.; DCCT/EDIC Research Group. The effect of excess weight gain with intensive diabetes mellitus treatment on cardiovascular disease risk factors and atherosclerosis in type 1 diabetes mellitus: Results from the Diabetes Control and Complications Trial/Epidemiology of Diabetes Interventions and Complications Study (DCCT/EDIC) study. Circulation. 2013, 127, 180–187. [Google Scholar] [CrossRef] [PubMed]
- Gubitosi-Klug, R.A.; DCCT/EDIC Research Group. The Diabetes Control and Complications Trial/Epidemiology of Diabetes Interventions and Complications Study at 30 years: Summary and future directions. Diabetes Care. 2014, 37, 44–49. [Google Scholar] [CrossRef]
- Wierzbicka, E.; Swiercz, A.; Pludowski, P.; Jaworski, M.; Szalecki, M. Skeletal Status, Body Composition, and Glycaemic Control in Adolescents with Type 1 Diabetes Mellitus. J. Diabetes Res. 2018, 2018, 8121634. [Google Scholar] [CrossRef]
- Maratova, K.; Soucek, O.; Matyskova, J.; Hlavka, Z.; Petruzelkova, L.; Obermannova, B.; Pruhova, S.; Kolouskova, S.; Sumnik, Z. Muscle functions and bone strength are impaired in adolescents with type 1 diabetes. Bone 2018, 106, 22–27. [Google Scholar] [CrossRef]
- Coleman, S.K.; Rebalka, I.A.; D’Souza, D.M.; Hawke, T.J. Skeletal muscle as a therapeutic target for delaying type 1 diabetic complications. World J. Diabetes 2015, 6, 1323–1336. [Google Scholar] [CrossRef]
- Mameli, C.; Mazzantini, S.; Nasr, M.B.; Fiorina, P.; Scaramuzza, A.E.; Zuccotti, G.V. Explaining the increased mortality in type 1 diabetes. World J. Diabetes 2015, 6, 889–895. [Google Scholar] [CrossRef] [PubMed]


| Parameter | Type 1 Diabetes Group | Control Group | p-Value |
|---|---|---|---|
| Age (years) | 10.78 ± 3.72 | 10.80 ± 3.73 | 0.967 |
| Girls | 10.93 ± 3.55 | 10.96 ± 3.56 | 0.947 |
| Boys | 10.66 ± 3.90 | 10.66 ± 3.90 | 1.000 |
| Body weight (kg) | 42.15 ± 21.08 | 39.93 ± 14.97 | 0.907 |
| Girls | 38.71 ± 16.69 | 38.53 ± 11.92 | 0.962 |
| Percentile * (n): | |||
| <3 | 2 | 1 | 0.613 |
| 3–10 | 4 | 1 | |
| 10–90 | 20 | 23 | |
| 90–97 | 1 | 1 | |
| >97 | 1 | 2 | |
| Boys | 44.89 ± 23.91 | 41.05 ± 17.11 | 0.720 |
| Percentile * (n): | |||
| <3 | 0 | 1 | 0.400 |
| 3–10 | 4 | 2 | |
| 10–90 | 24 | 26 | |
| 90–97 | 3 | 5 | |
| >97 | 4 | 1 | |
| Height (cm) | 145.80 ± 22.16 | 144.12 ± 19.63 | 0.653 |
| Girls | 143.93 ± 19.64 | 143.66 ± 18.60 | 0.958 |
| Low-to-age * | 1 | 1 | 0.354 |
| Normal * | 27 | 25 | |
| High-to-age * | 0 | 2 | |
| Boys | 147.30 ± 24.17 | 144.49 ± 20.68 | 0.602 |
| Low-to-age * | 0 | 0 | 0.673 |
| Normal * | 31 | 33 | |
| High-to-age * | 4 | 2 | |
| BMI (kg/m2) | 18.56 ± 4.57 | 18.52 ± 3.30 | 0.460 |
| Girls | 17.76 ± 3.40 | 18.26 ± 3.08 | 0.244 |
| Underweight * | 10 | 5 | 0.371 |
| Normal weight * | 15 | 19 | |
| Overweight * | 3 | 3 | |
| Obesity * | 0 | 1 | |
| Boys | 19.21 ± 4.94 | 18.72 ± 3.49 | 0.939 |
| Underweight * | 1 | 1 | 0.573 |
| Normal weight * | 27 | 24 | |
| Overweight * | 6 | 10 | |
| Obesity * | 1 | 0 |
| Parameter | Type 1 Diabetes Group (N = 63) | Control group (N = 63) | p-Value |
|---|---|---|---|
| Mean ± SD | Mean ± SD | ||
| Fat mass (kg) | 10.84 ± 8.33 | 9.07 ± 5.20 | 0.481 |
| Fat mass (% of body mass) | 23.96 ± 9.50 | 22.49 ± 9.44 | 0.386 |
| Fat mass index (kg/m2) | 4.66 ± 2.78 | 4.24 ± 2.33 | 0.364 |
| Fat free mass (kg) | 31.31 ± 14.49 | 30.86 ± 12.26 | 0.840 |
| Fat free mass (% of body mass) | 76.04 ± 9.50 | 77.51 ± 9.44 | 0.386 |
| Fat free mass index (kg/m2) | 13.81 ± 2.74 | 14.20 ± 2.26 | 0.218 |
| Muscle mass (kg) | 18.87 ± 10.01 | 20.03 ± 9.17 | 0.341 |
| Muscle mass (% of body mass) | 44.61 ± 6.58 | 49.40 ± 7.59 | <0.001 |
| Total body water (L) | 24.48 ± 10.61 | 24.28 ± 9.10 | 0.903 |
| Total body water (% of body mass) | 59.95 ± 8.62 | 61.36 ± 8.56 | 0.359 |
| Extracellular water (L) | 11.10 ± 4.44 | 10.57 ± 3.85 | 0.707 |
| Extracellular water (% of body mass) | 46.89 ± 7.34 | 44.05 ± 3.67 | 0.064 |
| Intracellular water (L) | 13.70 ± 6.49 | 13.76 ± 5.44 | 0.946 |
| Intracellular water (% of body mass) | 53.11 ± 7.34 | 55.95 ± 3.67 | 0.064 |
| Body cell mass (kg) | 15.14 ± 8.27 | 16.23 ± 7.57 | 0.308 |
| Body cell mass (% of body mass) | 46.89 ± 5.67 | 51.40 ± 4.19 | <0.001 |
| Body cell mass index (kg/m2) | 6.57 ± 1.80 | 7.37 ± 1.72 | 0.004 |
| Resistance (ohm) | 684.92 ± 99.29 | 659.98 ± 94.10 | 0.150 |
| Reactance (ohm) | 57.62 ± 10.41 | 63.83 ± 6.93 | <0.001 |
| Phase angle (−) | 4.85 ± 0.86 | 5.62 ± 0.81 | <0.001 |
| Parameter | Girls | p-Value | Boys | p-Value | ||
|---|---|---|---|---|---|---|
| Diabetes (N = 28) | Control (N = 28) | Diabetes (N = 35) | Control (N = 35) | |||
| Fat mass (kg) | 9.98 ± 6.53 | 9.77 ± 4.53 | 0.891 | 11.53 ± 9.57 | 8.50 ± 5.67 | 0.215 |
| Fat mass (% of body mass) | 23.65 ± 9.72 | 25.12 ± 8.56 | 0.555 | 24.21 ± 9.46 | 20.38 ± 9.47 | 0.072 |
| Fat mass index (kg/m2) | 4.37 ± 2.40 | 4.71 ± 2.39 | 0.611 | 4.90 ± 3.06 | 3.86 ± 2.25 | 0.079 |
| Fat free mass (kg) | 28.74 ± 11.00 | 28.76 ± 9.52 | 0.994 | 33.37 ± 16.63 | 32.55 ± 13.98 | 0.930 |
| Fat free mass (% of body mass) | 76.35 ± 9.72 | 74.88 ± 8.86 | 0.555 | 75.79 ± 9.46 | 79.62 ± 9.47 | 0.072 |
| Fat free mass index (kg/m2) | 13.18 ± 2.52 | 13.46 ± 1.78 | 0.628 | 14.32 ± 2.84 | 14.78 ± 2.45 | 0.247 |
| Muscle mass (kg) | 16.79 ± 7.25 | 18.29 ± 6.59 | 0.421 | 20.53 ± 11.60 | 21.42 ± 10.70 | 0.597 |
| Muscle mass (% of body mass) | 43.62 ± 5.70 | 47.20 ± 6.17 | 0.028 | 45.41 ± 7.19 | 51.15 ± 8.23 | 0.003 |
| Total body water (L) | 22.25 ± 7.82 | 22.35 ± 6.92 | 0.958 | 26.25 ± 12.23 | 25.81 ± 10.37 | 0.893 |
| Total body water (% of body mass) | 59.75 ± 9.02 | 58.55 ± 7.54 | 0.590 | 60.11 ± 8.42 | 63.61 ± 8.77 | 0.093 |
| Extracellular water (L) | 10.48 ± 3.64 | 9.85 ± 3.12 | 0.629 | 11.59 ± 4.98 | 11.15 ± 4.30 | 0.930 |
| Extracellular water (% of body mass) | 48.31 ± 8.70 | 44.25 ± 3.08 | 0.119 | 45.76 ± 5.92 | 43.89 ± 4.12 | 0.131 |
| Intracellular water (L) | 12.13 ± 4.99 | 12.65 ± 4.05 | 0.793 | 14.95 ± 7.31 | 14.65 ± 6.25 | 0.995 |
| Intracellular water (% of body mass) | 51.69 ± 8.70 | 55.75 ± 3.08 | 0.119 | 54.24 ± 5.92 | 56.11 ± 4.12 | 0.131 |
| Body cell mass (kg) | 13.39 ± 5.99 | 14.79 ± 5.38 | 0.362 | 16.55 ± 9.57 | 17.37 ± 8.86 | 0.565 |
| Body cell mass (% of body mass) | 45.60 ± 6.30 | 50.90 ± 3.05 | <0.001 | 47.91 ± 4.96 | 51.79 ± 4.93 | 0.002 |
| Body cell mass index (kg/m2) | 6.11 ± 1.50 | 6.91 ± 1.27 | 0.037 | 6.93 ± 1.95 | 7.73 ± 1.96 | 0.039 |
| Resistance (ohm) | 712.75 ± 102.10 | 700.57 ± 79.01 | 0.620 | 662.66 ± 92.47 | 627.51 ± 93.53 | 0.119 |
| Reactance (ohm) | 58.07 ± 12.66 | 66.71 ± 5.14 | 0.003 | 57.26 ± 8.38 | 61.51 ± 7.36 | 0.027 |
| Phase angle (−) | 4.66 ± 0.84 | 5.49 ± 0.56 | <0.001 | 5.00 ± 0.85 | 5.72 ± 0.97 | 0.001 |
| Age Range (years) | Phase Angle Percentiles | Girls | Boys | ||
|---|---|---|---|---|---|
| Diabetes | Control | Diabetes | Control | ||
| All (n) | 28 | 28 | 35 | 35 | |
| ≥10th percentile | 14 | 27 | 20 | 30 | |
| <10th percentile | 14 | 1 | 15 | 5 | |
| <5th percentile | 13 | 1 | 11 | 1 | |
| 4–9 (n) | 10 | 10 | 13 | 13 | |
| ≥10th percentile | 3 | 10 | 7 | 10 | |
| <10th percentile | 7 | 0 | 6 | 3 | |
| <5th percentile | 7 | 0 | 5 | 0 | |
| 10–13 (n) | 13 | 13 | 16 | 16 | |
| ≥10th percentile | 9 | 13 | 10 | 14 | |
| <10th percentile | 4 | 0 | 6 | 2 | |
| <5th percentile | 3 | 0 | 5 | 1 | |
| 14–18 (n) | 5 | 5 | 6 | 6 | |
| ≥10th percentile | 2 | 4 | 3 | 6 | |
| <10th percentile | 3 | 1 | 3 | 0 | |
| <5th percentile | 3 | 1 | 1 | 0 | |
© 2018 by the authors. Licensee MDPI, Basel, Switzerland. This article is an open access article distributed under the terms and conditions of the Creative Commons Attribution (CC BY) license (http://creativecommons.org/licenses/by/4.0/).
Share and Cite
Więch, P.; Bazaliński, D.; Sałacińska, I.; Binkowska-Bury, M.; Korczowski, B.; Mazur, A.; Kózka, M.; Dąbrowski, M. Decreased Bioelectrical Impedance Phase Angle in Hospitalized Children and Adolescents with Newly Diagnosed Type 1 Diabetes: A Case-Control Study. J. Clin. Med. 2018, 7, 516. https://doi.org/10.3390/jcm7120516
Więch P, Bazaliński D, Sałacińska I, Binkowska-Bury M, Korczowski B, Mazur A, Kózka M, Dąbrowski M. Decreased Bioelectrical Impedance Phase Angle in Hospitalized Children and Adolescents with Newly Diagnosed Type 1 Diabetes: A Case-Control Study. Journal of Clinical Medicine. 2018; 7(12):516. https://doi.org/10.3390/jcm7120516
Chicago/Turabian StyleWięch, Paweł, Dariusz Bazaliński, Izabela Sałacińska, Monika Binkowska-Bury, Bartosz Korczowski, Artur Mazur, Maria Kózka, and Mariusz Dąbrowski. 2018. "Decreased Bioelectrical Impedance Phase Angle in Hospitalized Children and Adolescents with Newly Diagnosed Type 1 Diabetes: A Case-Control Study" Journal of Clinical Medicine 7, no. 12: 516. https://doi.org/10.3390/jcm7120516
APA StyleWięch, P., Bazaliński, D., Sałacińska, I., Binkowska-Bury, M., Korczowski, B., Mazur, A., Kózka, M., & Dąbrowski, M. (2018). Decreased Bioelectrical Impedance Phase Angle in Hospitalized Children and Adolescents with Newly Diagnosed Type 1 Diabetes: A Case-Control Study. Journal of Clinical Medicine, 7(12), 516. https://doi.org/10.3390/jcm7120516