Assessing Postpartum Readmission Rates and Associated Risk Factors Using the Robson Classification: A Single-Center Experience
 ,
, 
Abstract
1. Introduction
2. Materials and Methods
2.1. Study Design
2.2. Study Population
- Hypertension, preeclampsia and thromboembolic events.
- Fever—including endometritis, UTI and surgical wound infection.
- Placental complication—late postpartum hemorrhage with or without retained products of conception.
- Epidural anesthesia complications.
- Other.
2.3. Exclusion Criteria
2.4. Data Collection
2.5. Ethical Consideration
2.6. Statistical Analysis
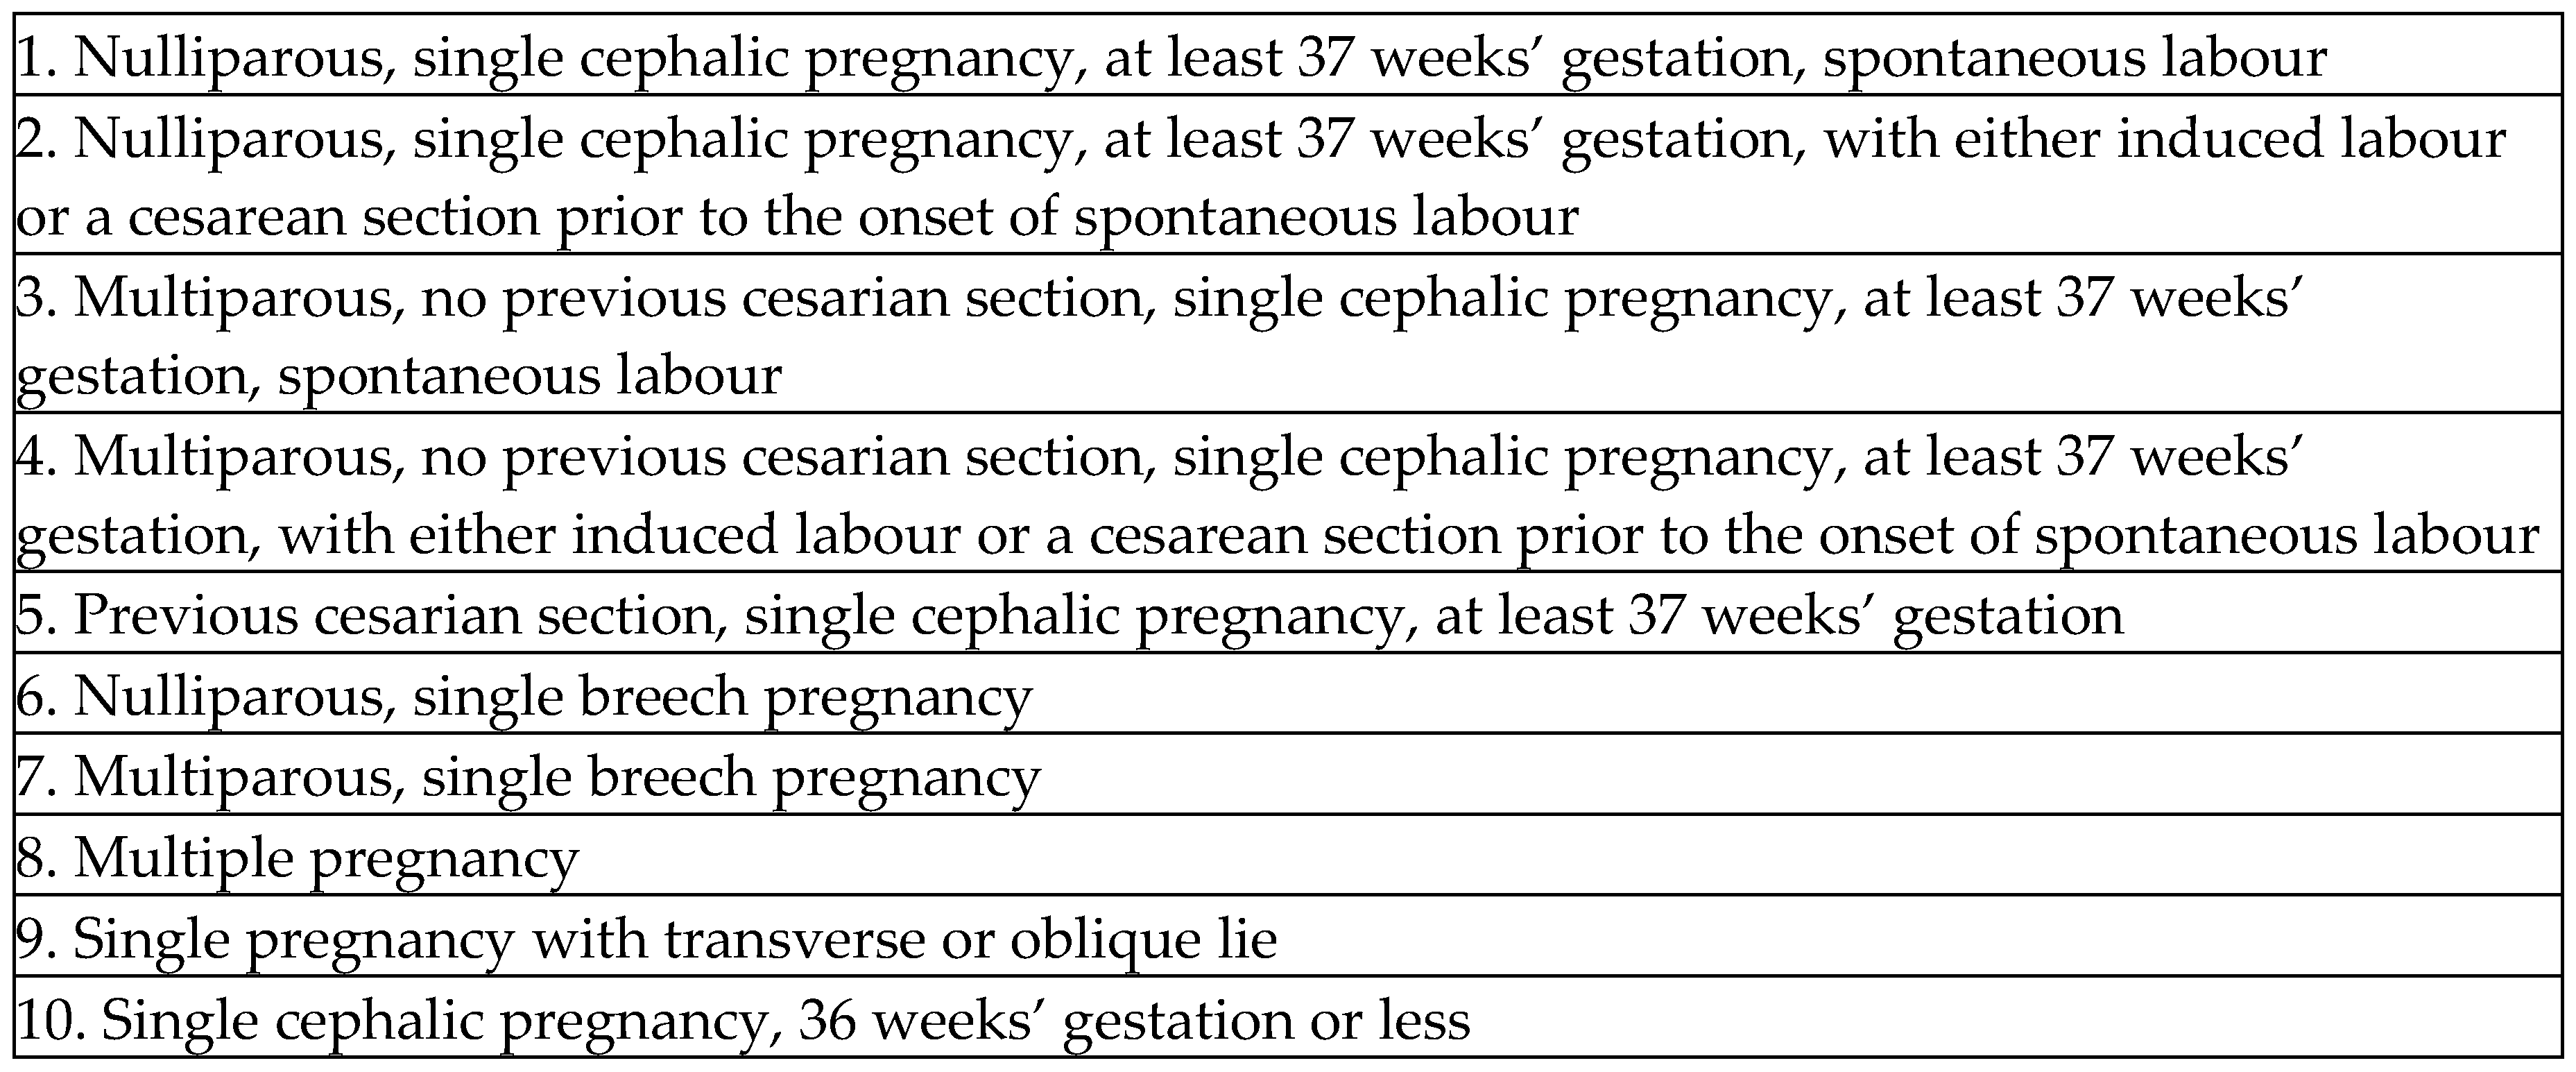
- Model 1: Analysis of entire cohort using RG1 (nulliparous, single cephalic, ≥37 weeks, spontaneous labor) as reference.
- Model 2: Analysis of nulliparous women only (RG1, 2a, 2b, 6, and nulliparous subsets of RG8–10) using RG1 as reference.
- Model 3: Analysis of multiparous women only (RG3, 4a, 4b, 5, 7, and multiparous subsets of RG8–10) using RG3 (multiparous, no previous CS, single cephalic, ≥37 weeks, spontaneous labor) as reference.
3. Results
4. Discussion
5. Conclusions
Supplementary Materials
Author Contributions
Funding
Institutional Review Board Statement
Informed Consent Statement
Data Availability Statement
Conflicts of Interest
Abbreviations
References
- Clapp, M.A.; Little, S.E.; Zheng, J.; Robinson, J.N. A multi-state analysis of postpartum readmissions in the United States. Am. J. Obstet. Gynecol. 2016, 215, 113.e1–113.e10. [Google Scholar] [CrossRef] [PubMed]
- Zuckerman, R.B.; Sheingold, S.H.; Orav, E.J.; Ruhter, J.; Epstein, A.M. Readmissions, Observation, and the Hospital Readmissions Reduction Program. N. Engl. J. Med. 2016, 374, 1543–1551. [Google Scholar] [CrossRef] [PubMed]
- Nasab, S.H.; Moussa, H.N.; Alrais, M.A.; Sibai, B.M.; Blackwell, S.C. Postpartum Readmissions: What We Can Learn From Numbers? [18K]. Obstet. Gynecol. 2018, 131, 123S. [Google Scholar] [CrossRef]
- Combs, C.A.; Goffman, D.; Pettker, C.M. Society for Maternal-Fetal Medicine Special Statement: A critique of postpartum readmission rate as a quality metric. Am. J. Obstet. Gynecol. 2022, 226, B2–B9. [Google Scholar] [CrossRef]
- Betran, A.P.; Torloni, M.R.; Zhang, J.J.; Gülmezoglu, A.M. WHO statement on caesarean section rates. BJOG 2016, 123, 667–670. [Google Scholar] [CrossRef]
- Robson, M.S. Can we reduce the caesarean section rate? Best Pract. Res. Clin. Obstet. Gynaecol. 2001, 15, 179–194. [Google Scholar] [CrossRef]
- Savchenko, J.; Ladfors, L.; Hjertberg, L.; Hildebrand, E. A step towards better audit: The Robson Ten Group classification system for outcomes other than cesarean section. Acta Obstet. Gynecol. Scand. 2022, 101, 827–835. [Google Scholar] [CrossRef]
- O’Leary, B.D.; Kane, D.T.; Kruseman Aretz, N.; Geary, M.P.; Malone, F.D.; Hehir, M.P. Use of the Robson Ten Group Classification System to categorise operative vaginal delivery. Aust. New Zealand J. Obstet. Gynaecol. 2020, 60, 858–864. [Google Scholar] [CrossRef]
- Pyykönen, A.; Gissler, M.; Jakobsson, M.; Lehtonen, L.; Tapper, A.M. The rate of obstetric anal sphincter injuries in Finnish obstetric units as a patient safety indicator. Eur. J. Obstet. Gynecol. Reprod. Biol. 2013, 169, 33–38. [Google Scholar] [CrossRef]
- Ladfors, L.V.; Muraca, G.M.; Zetterqvist, J.; Butwick, A.J.; Stephansson, O. Postpartum haemorrhage trends in Sweden using the Robson ten group classification system: A population-based cohort study. BJOG 2022, 129, 562–571. [Google Scholar] [CrossRef]
- Çarkçı Yıldız, D.; YaparEyi, E.G. Association of Robson Ten Group Classification System with neonatal/postneonatal mortality: An analysis for the effect of the mass migration. AJOG Glob. Rep. 2025, 5, 100464. [Google Scholar] [CrossRef]
- Israel Central Bureau of Statistics. Births and Fertility in Israel 2020; Israel Central Bureau of Statistics: Jerusalem, Israel, 2021; Publication No. 1926.
- Symonds, N.E.; Vidler, M.; Wiens, M.O.; Omar, S.; English, L.L.; Ukah, U.V.; Ansermino, J.M.; Ngonzi, J.; Bebell, L.M.; Hwang, B.; et al. Risk factors for postpartum maternal mortality and hospital readmission in low- and middle-income countries: A systematic review. BMC Pregnancy Childbirth 2023, 23, 303. [Google Scholar] [CrossRef]
- Liu, S.; Heaman, M.; Kramer, M.S.; Demissie, K.; Wen, S.W.; Marcoux, S. Length of hospital stay, obstetric conditions at childbirth, and maternal readmission: A population-based cohort study. Am. J. Obstet. Gynecol. 2002, 187, 681–687. [Google Scholar] [CrossRef]
- Stamilio, D.M.; Beckham, A.J.; Boggess, K.A.; Jelovsek, J.E.; Venkatesh, K.K. Risk factors for postpartum readmission for preeclampsia or hypertension before delivery discharge among low-risk women: A case-control study. Am. J. Obstet. Gynecol. MFM 2021, 3, 100317. [Google Scholar] [CrossRef]
- Clapp, M.A.; Robinson, J.N.; Little, S.E. The relationship between the rising cesarean delivery and postpartum readmission rates. J. Perinatol. 2017, 37, 355–359. [Google Scholar] [CrossRef]
- Gu, J.; Karmakar-Hore, S.; Hogan, M.-E.; Azzam, H.M.; Barrett, J.F.; Brown, A.; Cook, J.L.; Jain, V.; Melamed, N.; Smith, G.N.; et al. Examining Cesarean Section Rates in Canada Using the Modified Robson Classification. J. Obstet. Gynaecol. Can. 2020, 42, 757–765. [Google Scholar] [CrossRef] [PubMed]
- Fein, A.; Wen, T.; Wright, J.D.; Goffman, D.; D’aLton, M.E.; Attenello, F.J.; Mack, W.J.; Friedman, A.M. Postpartum hemorrhage and risk for postpartum readmission. J. Matern. -Fetal Neonatal Med. 2021, 34, 187–194. [Google Scholar] [CrossRef] [PubMed]
- Firouzbakht, M.; Nikbakht, H.A.; Omidvar, S. Risk factors for postpartum readmission: A prediction model in Iranian pregnant women. BMC Pregnancy Childbirth 2024, 24, 1–8. [Google Scholar] [CrossRef] [PubMed]
- Corry-Saavedra, K.; Murphy, A.; Mei, J.Y. Clinical and demographic factors associated with increased risk of postpartum readmission among patients presenting to the emergency department by 6 weeks postpartum. J. Matern.-Fetal Neonatal Med. 2025, 38, 2466210. [Google Scholar] [CrossRef]
- Hamilton, S.; Olson, S.; Voegtline, K.; Lawson, S.M. Postpartum readmission in Maryland by race and ethnicity, 2016–2019. AJOG Glob. Rep. 2023, 3, 100278. [Google Scholar] [CrossRef]
- Girsen, A.I.; Leonard, S.A.; Butwick, A.J.; Joudi, N.; Carmichael, S.L.; Gibbs, R.S. Early postpartum readmissions: Identifying risk factors at birth hospitalization. AJOG Glob. Rep. 2022, 2, 100094. [Google Scholar] [CrossRef]
- Ren, J.; Wang, T.; Yang, B.; Jiang, L.; Xu, L.; Geng, X.; Liu, Q. Risk factors and safety analyses for intrapartum fever in pregnant women receiving epidural analgesia during labor. Med. Sci. Monit. 2021, 27, e929283-1–e929283-7. [Google Scholar] [CrossRef] [PubMed]
- Hogh-Poulsen, S.; Carlsen, S.E.; Bendix, J.M.; Clausen, T.D.; Lokkegaard, E.C.L.; Axelsson, P.V.B. Maternal postpartum infection risk following induction of labor: A Danish national cohort study. Acta Obstet. Gynecol. Scand. 2025, 104, 309–318. [Google Scholar] [CrossRef]
- Tharpe, N. Postpregnancy Genital Tract and Wound Infections. J. Midwifery Womens Health 2008, 53, 236–246. [Google Scholar] [CrossRef]
- Gabbai, D.; Attali, E.; Ram, S.; Amikam, U.; Ashwal, E.; Hiersch, L.; Gamzu, R.; Yogev, Y. Prediction model for prolonged hospitalization following cesarean delivery. Eur. J. Obstet. Gynecol. Reprod. Biol. 2022, 274, 23–27. [Google Scholar] [CrossRef] [PubMed]
- Seijmonsbergen-Schermers, A.E.; van den Akker, T.; Rydahl, E.; Beeckman, K.; Bogaerts, A.; Binfa, L.; Frith, L.; Gross, M.M.; Misselwitz, B.; Hálfdánsdóttir, B.; et al. Variations in use of childbirth interventions in 13 high-income countries: A multinational cross-sectional study. PLoS Med. 2020, 17, e1003103. [Google Scholar] [CrossRef] [PubMed]
- Huang, W.C.; Lin, C.C. Postpartum readmission associated with severe maternal morbidity: A systematic review. Taiwan. J. Obstet. Gynecol. 2025, 64, 629–636. [Google Scholar] [CrossRef]
- Walia, A.; Friedman, A.M.; Sobhani, N.C.; Wen, T. Readmission Rates After Expedited Postpartum Discharge. Obstet. Gynecol. 2024, 144, 421–429. [Google Scholar] [CrossRef]


| Robson Classification | 1 | 2 | 3 | 4 | 5 | 6 | 7 | 8 | 9 | 10 | Total | p-Value |
|---|---|---|---|---|---|---|---|---|---|---|---|---|
| N | 49,491 | 10,876 | 164,042 | 19,437 | 30,151 | 2023 | 3827 | 5044 | 980 | 10,897 | 296,768 | |
| % of Total | 16.68% | 3.66% | 55.28% | 6.55% | 10.16% | 0.68% | 1.29% | 1.70% | 0.33% | 3.67% | 100.00% | |
| Maternal Characteristics | ||||||||||||
| Maternal age (years, mean ± SD) | 23.7 ± 3.8 | 25.8 ± 5.4 | 29.7 ± 5.3 | 31.7 ± 5.6 | 32.1 ± 5.3 | 25.7 ± 5.5 | 31.6 ± 5.9 | 30.5 ± 5.7 | 32.6 ± 6.1 | 29.1 ± 6.4 | 28.99 ± 5.8 | <0.001 |
| Maternal age > 35 yeas (%) | 1.50% | 6.80% | 16.50% | 26.90% | 27.90% | 6.00% | 28.40% | 20.90% | 34.00% | 19.10% | 15.80% | <0.001 |
| 12-year education or more (%) | 99.00% | 98.70% | 99.20% | 98.60% | 98.70% | 99.10% | 97.30% | 97.30% | 97.80% | 98.10% | 98.90% | <0.001 |
| Preterm Delivery | 0.00% | 0.00% | 0.00% | 0.00% | 0.00% | 22.30% | 28.60% | 47.10% | 34.10% | 100.00% | 5.10% | <0.001 |
| Nulliparity | 100.00% | 100.00% | 0.00% | 0.00% | 0.00% | 100.00% | 0.00% | 26.50% | 10.10% | 26.90% | 22.50% | <0.001 |
| Previous CS | 0.00% | 0.00% | 0.20% | 0.00% | 94.00% | 0.00% | 35.90% | 13.10% | 32.90% | 18.40% | 11.20% | <0.001 |
| Pregnancy Complications | ||||||||||||
| GDM | 1.50% | 8.20% | 2.20% | 12.70% | 7.00% | 4.30% | 7.30% | 6.40% | 10.60% | 6.40% | 3.80% | <0.001 |
| Hypertensive disorders | 1.50% | 8.70% | 0.80% | 4.80% | 2.50% | 5.10% | 4.00% | 6.90% | 3.80% | 7.90% | 2.10% | <0.001 |
| ART | 4.80% | 10.70% | 1.30% | 3.10% | 3.90% | 12.20% | 4.30% | 34.60% | 8.30% | 5.90% | 3.50% | <0.001 |
| Onset of labor | ||||||||||||
| Spontaneous | 100.00% | 0.00% | 100.00% | 0.00% | 66.00% | 31.50% | 35.40% | 55.00% | 34.10% | 64.30% | 82.70% | <0.001 |
| Induction of labor | 0.00% | 89.90% | 0.00% | 90.60% | 5.40% | 2.70% | 5.00% | 8.50% | 6.10% | 18.60% | 10.70% | <0.001 |
| CS with no trial of labor | 0.00% | 10.10% | 0.00% | 9.40% | 28.60% | 65.80% | 59.60% | 36.50% | 59.80% | 17.10% | 6.60% | <0.001 |
| Mode of delivery | ||||||||||||
| Spontaneous | 78.80% | 54.20% | 97.20% | 82.40% | 57.70% | 12.40% | 17.10% | 42.90% | 1.80% | 69.60% | 83.70% | <0.001 |
| Instrumental (vacuum delivery) | 15.90% | 16.80% | 1.80% | 2.90% | 5.50% | 0.00% | 0.10% | 4.80% | 0.40% | 2.70% | 5.20% | <0.001 |
| CS | 5.20% | 29.00% | 1.00% | 14.70% | 36.70% | 87.60% | 82.80% | 52.40% | 97.80% | 27.70% | 11.10% | <0.001 |
| Delivery Characteristics | ||||||||||||
| Epidural analgesia | 70.00% | 78.60% | 44.60% | 71.60% | 40.90% | 14.70% | 14.60% | 45.60% | 8.60% | 43.30% | 50.70% | <0.001 |
| Hg drop > 3 gr% | 14.20% | 15.30% | 2.70% | 3.80% | 7.30% | 5.30% | 7.70% | 12.50% | 15.60% | 6.90% | 6.10% | <0.001 |
| Blood transfusion | 1.54% | 2.34% | 0.51% | 1.34% | 1.97% | 1.29% | 4.60% | 5.61% | 7.65% | 4.90% | 1.28% | <0.001 |
| OASIS | 1.04% | 0.80% | 0.15% | 0.88% | 0.90% | 0.15% | 0.34% | 0.30% | 0.10% | 0.15% | 0.45% | <0.001 |
| Manual inspection of the uterine cavity | 2.70% | 2.90% | 2.70% | 3.80% | 2.70% | 1.10% | 1.50% | 4.50% | 0.70% | 4.90% | 2.90% | <0.001 |
| Intrapartum chorioamnionitis | 1.10% | 3.00% | 0.10% | 0.30% | 0.40% | 0.60% | 1.10% | 0.70% | 1.10% | 1.70% | 0.50% | <0.001 |
| Neonatal Characteristics | ||||||||||||
| Birth Weight (g) Mean ± SD | 3238 ± 390 | 3194 ± 485 | 3392 ± 413 | 3333 ± 495 | 3334 ± 456 | 2700 ± 771 | 2778 ± 799 | 2422 ± 552 | 2855 ± 843 | 2360 ± 685 | 3282 ± 509 | <0.001 |
| SGA | 9.70% | 16.30% | 4.50% | 9.10% | 6.20% | 16.60% | 12.50% | 0.00% | 7.10% | 11.20% | 6.60% | <0.001 |
| LGA | 5.40% | 7.60% | 12.30% | 14.60% | 13.70% | 3.70% | 7.70% | 0.00% | 10.50% | 5.10% | 10.70% | <0.001 |
| LBW (<2500 gr) | 2.20% | 7.60% | 1.10% | 4.60% | 2.60% | 25.00% | 26.10% | 51.30% | 25.40% | 51.70% | 5.10% | <0.001 |
| Cephalic presentation | 100.00% | 100.00% | 100.00% | 100.00% | 100.00% | 0.00% | 0.00% | 72.00% | 0.00% | 100.00% | 97.20% | <0.001 |
| 5′ Apgar score < 7 | 0.80% | 1.90% | 0.30% | 1.50% | 0.90% | 8.30% | 9.70% | 4.30% | 9.60% | 11.10% | 1.30% | <0.001 |
| NICU admission | 2.60% | 5.90% | 1.20% | 3.80% | 3.70% | 16.00% | 19.40% | 30.20% | 25.70% | 45.30% | 4.60% | <0.001 |
| IUFD | 0.06% | 0.33% | 0.07% | 0.68% | 0.21% | 2.92% | 4.31% | 1.17% | 1.73% | 4.49% | 0.39% | <0.001 |
| Robson Scale | |||||||||||
|---|---|---|---|---|---|---|---|---|---|---|---|
| 1 | 2 | 3 | 4 | 5 | 6 | 7 | 8 | 9 | 10 | Total | |
| n (all) | 49,491 | 10,876 | 164,042 | 19,437 | 30,151 | 2023 | 3827 | 5044 | 980 | 10,897 | 296,768 |
| n (readmission) | 344 | 132 | 511 | 119 | 186 | 16 | 45 | 68 | 19 | 87 | 1527 |
| Contribution to total readmissions (%) | 23% | 9% | 33% | 8% | 12% | 1% | 3% | 4% | 1% | 6% | 100% |
| Readmission rate within each RG (%) | 0.7% | 1.2% | 0.3% | 0.6% | 0.6% | 0.8% | 1.2% | 1.3% | 1.9% | 0.8% | 0.5% |
| Robson Scale | |||||||||||
|---|---|---|---|---|---|---|---|---|---|---|---|
| 1 | 2 | 3 | 4 | 5 | 6 | 7 | 8 | 9 | 10 | Total | |
| Fever | 63.10% | 80.30% | 51.50% | 54.60% | 68.30% | 87.50% | 82.20% | 58.80% | 100.00% | 56.30% | 61.40% |
| Placenta | 23.30% | 9.80% | 33.30% | 19.30% | 18.80% | 6.30% | 8.90% | 29.40% | 24.10% | 24.00% | |
| Preeclampsia | 0.90% | 2.30% | 4.30% | 14.30% | 5.90% | 2.20% | 4.40% | 6.90% | 4.30% | ||
| Epidural | 2.00% | 1.50% | 4.10% | 0.80% | 1.10% | 2.20% | |||||
| Other | 10.80% | 6.10% | 6.80% | 10.90% | 5.90% | 6.30% | 6.70% | 7.40% | 12.60% | 8.10% | |
| Model 1 (All-RG) | Model 2 (Nulliparous) | Model 3 (Multiparous) | ||||
|---|---|---|---|---|---|---|
| aOR [95%CI] | p-Value | aOR [95%CI] | p-Value | aOR [95%CI] | p-Value | |
| RG1 | - | - | - | - | ||
| RG2 | 1.54 [1.26–1.89] | <0.001 | 1.57 [1.27–1.94] | <0.001 | ||
| RG3 | 0.46 [0.40–0.53] | <0.001 | - | - | ||
| RG4 | 0.83 [0.67–1.03] | 0.088 | 1.79 [1.46–2.20] | <0.001 | ||
| RG5 | 0.88 [0.73–1.06] | 0.165 | 1.90 [1.60–2.25] | <0.001 | ||
| RG6 | 1.14 [0.71–1.84] | 0.595 | 1.16 [0.72–1.87] | 0.544 | ||
| RG7 | 1.68 [1.23–2.29] | 0.001 | 3.60 [2.66–4.88] | <0.001 | ||
| RG8 | 1.63 [1.24–2.14] | <0.001 | 2.29 [1.48–3.54] | <0.001 | 3.00 [2.16–4.18] | <0.001 |
| RG9 | 2.90 [1.85–4.55] | <0.001 | 1.23 [0.17–8.84] | 0.84 | 6.76 [4.29–10.66] | <0.001 |
| RG10 | 1.22 [0.97–1.53] | 0.086 | 1.34 [0.91–1.96] | 0.135 | 2.54 [1.97–3.28] | <0.001 |
Disclaimer/Publisher’s Note: The statements, opinions and data contained in all publications are solely those of the individual author(s) and contributor(s) and not of MDPI and/or the editor(s). MDPI and/or the editor(s) disclaim responsibility for any injury to people or property resulting from any ideas, methods, instructions or products referred to in the content. |
© 2026 by the authors. Licensee MDPI, Basel, Switzerland. This article is an open access article distributed under the terms and conditions of the Creative Commons Attribution (CC BY) license.
Share and Cite
Ehrlich, Z.; Shapiro, S.; Peled, T.; Farkash, R.; Grisaru-Granovsky, S.; Armon, S. Assessing Postpartum Readmission Rates and Associated Risk Factors Using the Robson Classification: A Single-Center Experience. J. Clin. Med. 2026, 15, 1697. https://doi.org/10.3390/jcm15051697
Ehrlich Z, Shapiro S, Peled T, Farkash R, Grisaru-Granovsky S, Armon S. Assessing Postpartum Readmission Rates and Associated Risk Factors Using the Robson Classification: A Single-Center Experience. Journal of Clinical Medicine. 2026; 15(5):1697. https://doi.org/10.3390/jcm15051697
Chicago/Turabian StyleEhrlich, Zvi, Shirley Shapiro, Tzuria Peled, Rivka Farkash, Sorina Grisaru-Granovsky, and Shunit Armon. 2026. "Assessing Postpartum Readmission Rates and Associated Risk Factors Using the Robson Classification: A Single-Center Experience" Journal of Clinical Medicine 15, no. 5: 1697. https://doi.org/10.3390/jcm15051697
APA StyleEhrlich, Z., Shapiro, S., Peled, T., Farkash, R., Grisaru-Granovsky, S., & Armon, S. (2026). Assessing Postpartum Readmission Rates and Associated Risk Factors Using the Robson Classification: A Single-Center Experience. Journal of Clinical Medicine, 15(5), 1697. https://doi.org/10.3390/jcm15051697