Impact of Specific Metabolic Syndrome Combinations on Model-Estimated 10-Year Cardiovascular Risk in a Taiwanese Population
 , and
, and
Abstract
1. Introduction
2. Materials and Methods
2.1. Study Population
2.2. Clinical and Laboratory Assessment
2.3. Definition of the MetS
- Central obesity: Waist circumference ≥ 90 cm for men or ≥80 cm for women.
- Hypertriglyceridemia: Triglyceride levels ≥ 150 mg/dL (1.7 mmol/L), or receiving specific medication to treat this lipid abnormality.
- Low HDL-C: HDL-C < 40 mg/dL (1.03 mmol/L) in men or <50 mg/dL (1.29 mmol/L) in women, or receiving treatment for low HDL-C.
- Elevated blood pressure: Systolic blood pressure ≥ 130 mm Hg and/or diastolic blood pressure ≥ 85 mm Hg, or taking antihypertensive medication.
- Impaired fasting glucose: Fasting plasma glucose ≥ 100 mg/dL (5.6 mmol/L), or using medication for high glucose levels.
Cardiovascular Risk Assessment and Risk Classification
2.4. Outcomes
2.5. Statistical Analysis
3. Results
3.1. Participant Characteristics and Baseline MetS Combinations Across Risk Categories
3.2. Identifying the Predictors of CV Risk Change
4. Discussion
5. Conclusions
Author Contributions
Funding
Institutional Review Board Statement
Informed Consent Statement
Data Availability Statement
Acknowledgments
Conflicts of Interest
Appendix A

References
- Pigeot, I.; Ahrens, W. Epidemiology of metabolic syndrome. Pflug. Arch. 2025, 477, 669–680. [Google Scholar] [CrossRef]
- Ford, E.S. Risks for all-cause mortality, cardiovascular disease, and diabetes associated with the metabolic syndrome: A summary of the evidence. Diabetes Care 2005, 28, 1769–1778. [Google Scholar] [CrossRef] [PubMed]
- Li, J.; Liu, W.; Li, H.; Ye, X.; Qin, J.-J. Changes of metabolic syndrome status alter the risks of cardiovascular diseases, stroke and all-cause mortality. Sci. Rep. 2025, 15, 5448. [Google Scholar] [CrossRef]
- Guembe, M.J.; Fernandez-Lazaro, C.I.; Sayon-Orea, C.; Toledo, E.; Moreno-Iribas, C.; RIVANA Study Investigators. Risk for cardiovascular disease associated with metabolic syndrome and its components: A 13-year prospective study in the RIVANA cohort. Cardiovasc. Diabetol. 2020, 19, 195. [Google Scholar] [CrossRef]
- Dekker, J.M.; Girman, C.; Rhodes, T.; Nijpels, G.; Stehouwer, C.D.A.; Bouter, L.M.; Heine, R.J. Metabolic syndrome and 10-year cardiovascular disease risk in the Hoorn Study. Circulation 2005, 112, 666–673. [Google Scholar] [CrossRef]
- Luptáková, L.; Siváková, D.; Cvíčelová, M.; Wsólová, L.; Danková, Z.; Michnová, A.; Blažíček, P. Power of biomarkers and their relative contributions to metabolic syndrome in Slovak adult women. Ann. Hum. Biol. 2013, 40, 132–138. [Google Scholar] [CrossRef]
- World Health Organization. The Top 10 Causes of Death. Available online: https://www.who.int/news-room/fact-sheets/detail/the-top-10-causes-of-death (accessed on 2 June 2024).
- Yang, X.; Li, J.; Hu, D.; Chen, J.; Li, Y.; Huang, J.; Liu, X.; Liu, F.; Cao, J.; Shen, C.; et al. Predicting the 10-year risks of atherosclerotic cardiovascular disease in Chinese population: The China-PAR project (prediction for ASCVD risk in China). Circulation 2016, 134, 1430–1440. [Google Scholar] [CrossRef] [PubMed]
- He, Y.; Jiang, B.; Wang, J.; Feng, K.; Chang, Q.; Fan, L.; Li, X.; Hu, F.B. Prevalence of the metabolic syndrome and its relation to cardiovascular disease in an elderly Chinese population. J. Am. Coll. Cardiol. 2006, 47, 1588–1594. [Google Scholar] [CrossRef]
- Sperling, L.S.; Mechanick, J.I.; Neeland, I.J.; Herrick, C.J.; Després, J.-P.; Ndumele, C.E.; Vijayaraghavan, K.; Handelsman, Y.; Puckrein, G.A.; Araneta, M.R.G. The cardiometabolic health alliance: Working toward a new care model for the metabolic syndrome. J. Am. Coll. Cardiol. 2015, 66, 1050–1067. [Google Scholar] [CrossRef]
- D’Agostino, R.B., Sr.; Vasan, R.S.; Pencina, M.J.; Wolf, P.A.; Cobain, M.; Massaro, J.M.; Kannel, W.B. General cardiovascular risk profile for use in primary care: The Framingham Heart Study. Circulation 2008, 117, 743–753. [Google Scholar] [CrossRef] [PubMed]
- Goff, D.C.; Lloyd-Jones, D.M.; Bennett, G.; Coady, S.; D’Agostino, R.B.; Gibbons, R.; Greenland, P.; Lackland, D.T.; Levy, D.; O’Donnell, C.J.; et al. 2013 ACC/AHA guideline on the assessment of cardiovascular risk: A report of the American College of Cardiology/American Heart Association Task Force on Practice Guidelines. Circulation 2014, 129, S49–S73. [Google Scholar] [CrossRef] [PubMed]
- Ferket, B.S.; van Kempen, B.J.H.; Hunink, M.G.M.; Agarwal, I.; Kavousi, M.; Franco, O.H.; Steyerberg, E.W.; Max, W.; Fleischmann, K.E. Predictive value of updating Framingham risk scores with novel risk markers in the U.S. general population. PLoS ONE 2014, 9, e88312. [Google Scholar] [CrossRef] [PubMed]
- Grundy, S.M.; Stone, N.J.; Bailey, A.L.; Beam, C.; Birtcher, K.K.; Blumenthal, R.S.; Braun, L.T.; de Ferranti, S.; Faiella-Tommasino, J.; Forman, D.E.; et al. 2018 AHA/ACC/AACVPR/AAPA/ABC/ACPM/ADA/AGS/APhA/ASPC/NLA/PCNA guideline on the management of blood cholesterol: A report of the American College of Cardiology/American Heart Association Task Force on Clinical Practice Guidelines. Circulation 2019, 139, e1082–e1143. [Google Scholar] [CrossRef] [PubMed]
- Damen, J.A.; Pajouheshnia, R.; Heus, P.; Moons, K.G.M.; Reitsma, J.B.; Scholten, R.J.P.M.; Hooft, L.; Debray, T.P.A. Performance of the Framingham risk models and pooled cohort equations for predicting 10-year risk of cardiovascular disease: A systematic review and meta-analysis. BMC Med. 2019, 17, 109. [Google Scholar] [CrossRef]
- Kasim, S.S.; Ibrahim, N.; Malek, S.; Ibrahim, K.S.; Aziz, M.F.; Song, C.; Chia, Y.C.; Ramli, A.S.; Negishi, K.; Nasir, N.M. Validation of the general Framingham Risk Score (FRS), SCORE2, revised PCE and WHO CVD risk scores in an Asian population. Lancet Reg. Health West. Pac. 2023, 35, 100742. [Google Scholar] [CrossRef]
- Wang, H.; Sun, Y.; Wang, S.; Tao, Y.; Zhang, L. Comparisons of the Framingham and ASCVD risk scores for coronary heart disease risk prediction in Chinese men. Int. J. Cardiol. 2018, 266, 269. [Google Scholar] [CrossRef]
- Moebus, S.; Balijepalli, C.; Lösch, C.; Gores, L.; von Stritzky, B.; Bramlage, P.; Wasem, J.; Jockel, K.-H. Age- and sex-specific prevalence and ten-year risk for cardiovascular disease of all 16 risk factor combinations of the metabolic syndrome—A cross-sectional study. Cardiovasc. Diabetol. 2010, 9, 34. [Google Scholar] [CrossRef]
- Lind, L. Different combinations of the metabolic syndrome criteria and cardiovascular disease. medRxiv 2023. [Google Scholar] [CrossRef]
- Stenvinkel, P.; Shiels, P.G. Metabolic syndrome in combination with chronic kidney disease—It’s a gut feeling. J. Intern. Med. 2021, 290, 1108–1111. [Google Scholar] [CrossRef]
- Vera-Ponce, V.J.; Zuzunaga-Montoya, F.E.; Vasquez Romero, L.E.M.; Loayza-Castro, J.A.; Manrique, E.J.O.; Valladares-Garrido, M.J.; Vigil-Ventura, E.; Tapia-Limonchi, R. Evaluation of nine forms of metabolic syndrome diagnosis as risk for cardiovascular disease: An analysis of isolated and combined metabolic factors. J. Endocrinol. Metab. 2024, 14, 194–206. [Google Scholar] [CrossRef]
- Cui, H.; Liu, Q.; Zhao, Z.; Ma, X. Interacting and joint effects of triglyceride-glucose index and blood pressure on cardiovascular diseases risk: A prospective cohort study. Diabetol. Metab. Syndr. 2024, 16, 188. [Google Scholar] [CrossRef]
- Xu, J.P.; Peng, X.Q.; Guo, L.H.; Zhao, X.-J.; Chen, M.-S.; Mai, X.-Y.; Tan, J.-W.; Chen, Q.; Zeng, R.-X.; Zhang, M.-Z. The associations of the triglyceride-glucose index and its combination with blood pressure on cardiovascular and all-cause mortality in hypertension: A national study. Front. Endocrinol. 2024, 15, 1469055. [Google Scholar] [CrossRef]
- Hill, M.A.; Yang, Y.; Zhang, L.; Sun, Z.; Jia, G.; Parrish, A.R.; Sowers, J.R. Insulin resistance, cardiovascular stiffening and cardiovascular disease. Metabolism 2021, 119, 154766. [Google Scholar] [CrossRef]
- Da Silva, A.A.; do Carmo, J.M.; Li, X.; Wang, Z.; Mouton, A.J.; Hall, J.E. Role of hyperinsulinemia and insulin resistance in hypertension: Metabolic syndrome revisited. Can. J. Cardiol. 2020, 36, 671–682. [Google Scholar] [CrossRef]
- Schulz, E.; Gori, T.; Münzel, T. Oxidative stress and endothelial dysfunction in hypertension. Hypertens. Res. 2011, 34, 665–673. [Google Scholar] [CrossRef]

| Framingham Risk Score (2008) | p | ASCVD Risk Estimator (2013) | p | |||
|---|---|---|---|---|---|---|
| Non-Progression | Progression | Non-Progression | Progression | |||
| Cardiovascular risk changes, % | −1.98 ± 4.07 | 2.74 ± 4.75 | <0.001 ***a | −0.75 ± 1.43 | 1.56 ± 2.98 | <0.001 ***a |
| Sex | <0.001 ***b | <0.001 ***b | ||||
| Male | 5913 (23.5) | 19,239 (76.5) | 4801 (19.1) | 20,351 (80.9) | ||
| Female | 6120 (20.2) | 24,125 (79.8) | 3740 (12.4) | 26,505 (87.6) | ||
| Age | <0.001 ***b | <0.001 ***b | ||||
| 30–49 years | 8494 (19.5) | 35,004 (80.5) | 6425 (14.8) | 37,073 (85.2) | ||
| 50–64 years | 2714 (28.1) | 6929 (71.9) | 1693 (17.6) | 7950 (82.4) | ||
| ≥65 years | 825 (36.6) | 1431 (63.4) | 423 (18.8) | 1833 (81.3) | ||
| BMI | <0.001 ***b | <0.001 ***b | ||||
| ≥18.5, <24 | 7445 (20.9) | 28,115 (79.1) | 5043 (14.2) | 30,517 (85.8) | ||
| <18.5 | 843 (18.1) | 3809 (81.9) | 512 (11.0) | 4140 (89.0) | ||
| ≥24, <27 | 2576 (24.2) | 8061 (75.8) | 2054 (19.3) | 8583 (80.7) | ||
| ≥27 | 1169 (25.7) | 3376 (74.3) | 932 (20.5) | 3613 (79.5) | ||
| UA, mg/dL | 5.50 ± 1.46 | 5.35 ± 1.46 | <0.001 ***a | 5.68 ± 1.49 | 5.32 ± 1.45 | <0.001 ***a |
| LDL, mg/dL | 122.47 ± 32.00 | 112.18 ± 26.69 | <0.001 ***a | 127.09 ± 32.71 | 112.10 ± 29.50 | <0.001 ***a |
| n | Adjusted n (Excluding No ≤ 2) | Framingham Risk Categories, n (%) | ASCVD Risk Categories, n (%) | ||||||
|---|---|---|---|---|---|---|---|---|---|
| Low (<10%) | Intermediate (10–20%) | High (>20%) | Low (<5%) | Borderline (5–<7.5%) | Intermediate (7.5–<20%) | High (≥20%) | |||
| MetS pattern | |||||||||
| No(≤2) | 50,962 (92.0%) | - | 43,255 (95.9) | 5199 (79.7) | 2508 (66.7) | 44,038 (95.2) | 2723 (82.2) | 3411 (74.2) | 790 (63.4) |
| TFW | 518 (0.9%) | 518 (11.7) | 310 (0.7) | 149 (2.3) | 59 (1.6) | 350 (0.8) | 79 (2.4) | 77 (1.7) | 12 (1.0) |
| TFH | 471 (0.9%) | 471 (10.6) | 282 (0.6) | 123 (1.9) | 66 (1.8) | 295 (0.6) | 84 (2.5) | 84 (1.8) | 8 (0.6) |
| TFB | 876 (1.6%) | 876 (19.8) | 288 (0.6) | 288 (4.4) | 300 (8.0) | 376 (0.8) | 124 (3.7) | 296 (6.4) | 80 (6.4) |
| TWH | 106 (0.2%) | 106 (2.4) | 75 (0.2) | 23 (0.4) | 8 (0.2) | 75 (0.2) | 17 (0.5) | 13 (0.3) | 1 (0.1) |
| TWB | 208 (0.4%) | 208 (4.7) | 106 (0.2) | 58 (0.9) | 44 (1.2) | 126 (0.3) | 27 (0.8) | 44 (1.0) | 11 (0.9) |
| THB | 106 (0.2%) | 106 (2.4) | 43 (0.1) | 46 (0.7) | 17 (0.5) | 60 (0.1) | 21 (0.6) | 19 (0.4) | 6 (0.5) |
| FWH | 228 (0.4%) | 228 (5.1) | 165 (0.4) | 37 (0.6) | 26 (0.7) | 171 (0.4) | 20 (0.6) | 27 (0.6) | 10 (0.8) |
| FWB | 1516 (2.7%) | 1516 (34.2) | 464 (1.0) | 475 (7.3) | 577 (15.3) | 584 (1.3) | 168 (5.1) | 504 (11.0) | 260 (20.9) |
| FHB | 323 (0.6%) | 323 (7.3) | 87 (0.2) | 103 (1.6) | 133 (3.5) | 116 (0.3) | 45 (1.4) | 102 (2.2) | 60 (4.8) |
| WHB | 83 (0.1%) | 83 (1.9) | 42 (0.1) | 19 (0.3) | 22 (0.6) | 49(0.1) | 5 (0.2) | 21 (0.5) | 8 (0.6) |
| p-value | <0.001 *** | <0.001 *** | |||||||
| Framingham Model | ASCVD Model | |||||||
|---|---|---|---|---|---|---|---|---|
| Adjusted HR | 95% CI | Adjusted HR | 95% CI | |||||
| 5-Year Follow-Up | Lower | Upper | Lower | Upper | ||||
| TFW vs. non-MetS |  | 0.984 | 0.850 | 1.141 |  | 0.990 | 0.857 | 1.143 |
| TFH vs. non-MetS | 1.093 | 0.947 | 1.262 | 1.002 | 0.868 | 1.157 | ||
| TFB vs. non-MetS | 1.189 ** | 1.059 | 1.334 | 1.144 * | 1.022 | 1.280 | ||
| TWH vs. non-MetS | 1.022 | 0.761 | 1.373 | 0.972 | 0.724 | 1.304 | ||
| TWB vs. non-MetS | 1.011 | 0.806 | 1.267 | 1.000 | 0.798 | 1.253 | ||
| THB vs. non-MetS | 1.123 | 0.815 | 1.545 | 1.082 | 0.786 | 1.488 | ||
| FWH vs. non-MetS | 1.033 | 0.842 | 1.269 | 0.914 | 0.743 | 1.124 | ||
| FWB vs. non-MetS | 1.022 | 0.915 | 1.140 | 1.087 | 0.980 | 1.205 | ||
| FHB vs. non-MetS | 1.118 | 0.902 | 1.385 | 1.164 | 0.950 | 1.425 | ||
| WHB vs. non-MetS | 0.907 | 0.601 | 1.370 | 1.001 | 0.680 | 1.475 | ||
| 10-year follow-up | ||||||||
| TFW vs. non-MetS |  | 1.090 | 0.963 | 1.235 |  | 1.088 | 0.963 | 1.230 |
| TFH vs. non-MetS | 1.177 * | 1.040 | 1.333 | 1.078 | 0.952 | 1.221 | ||
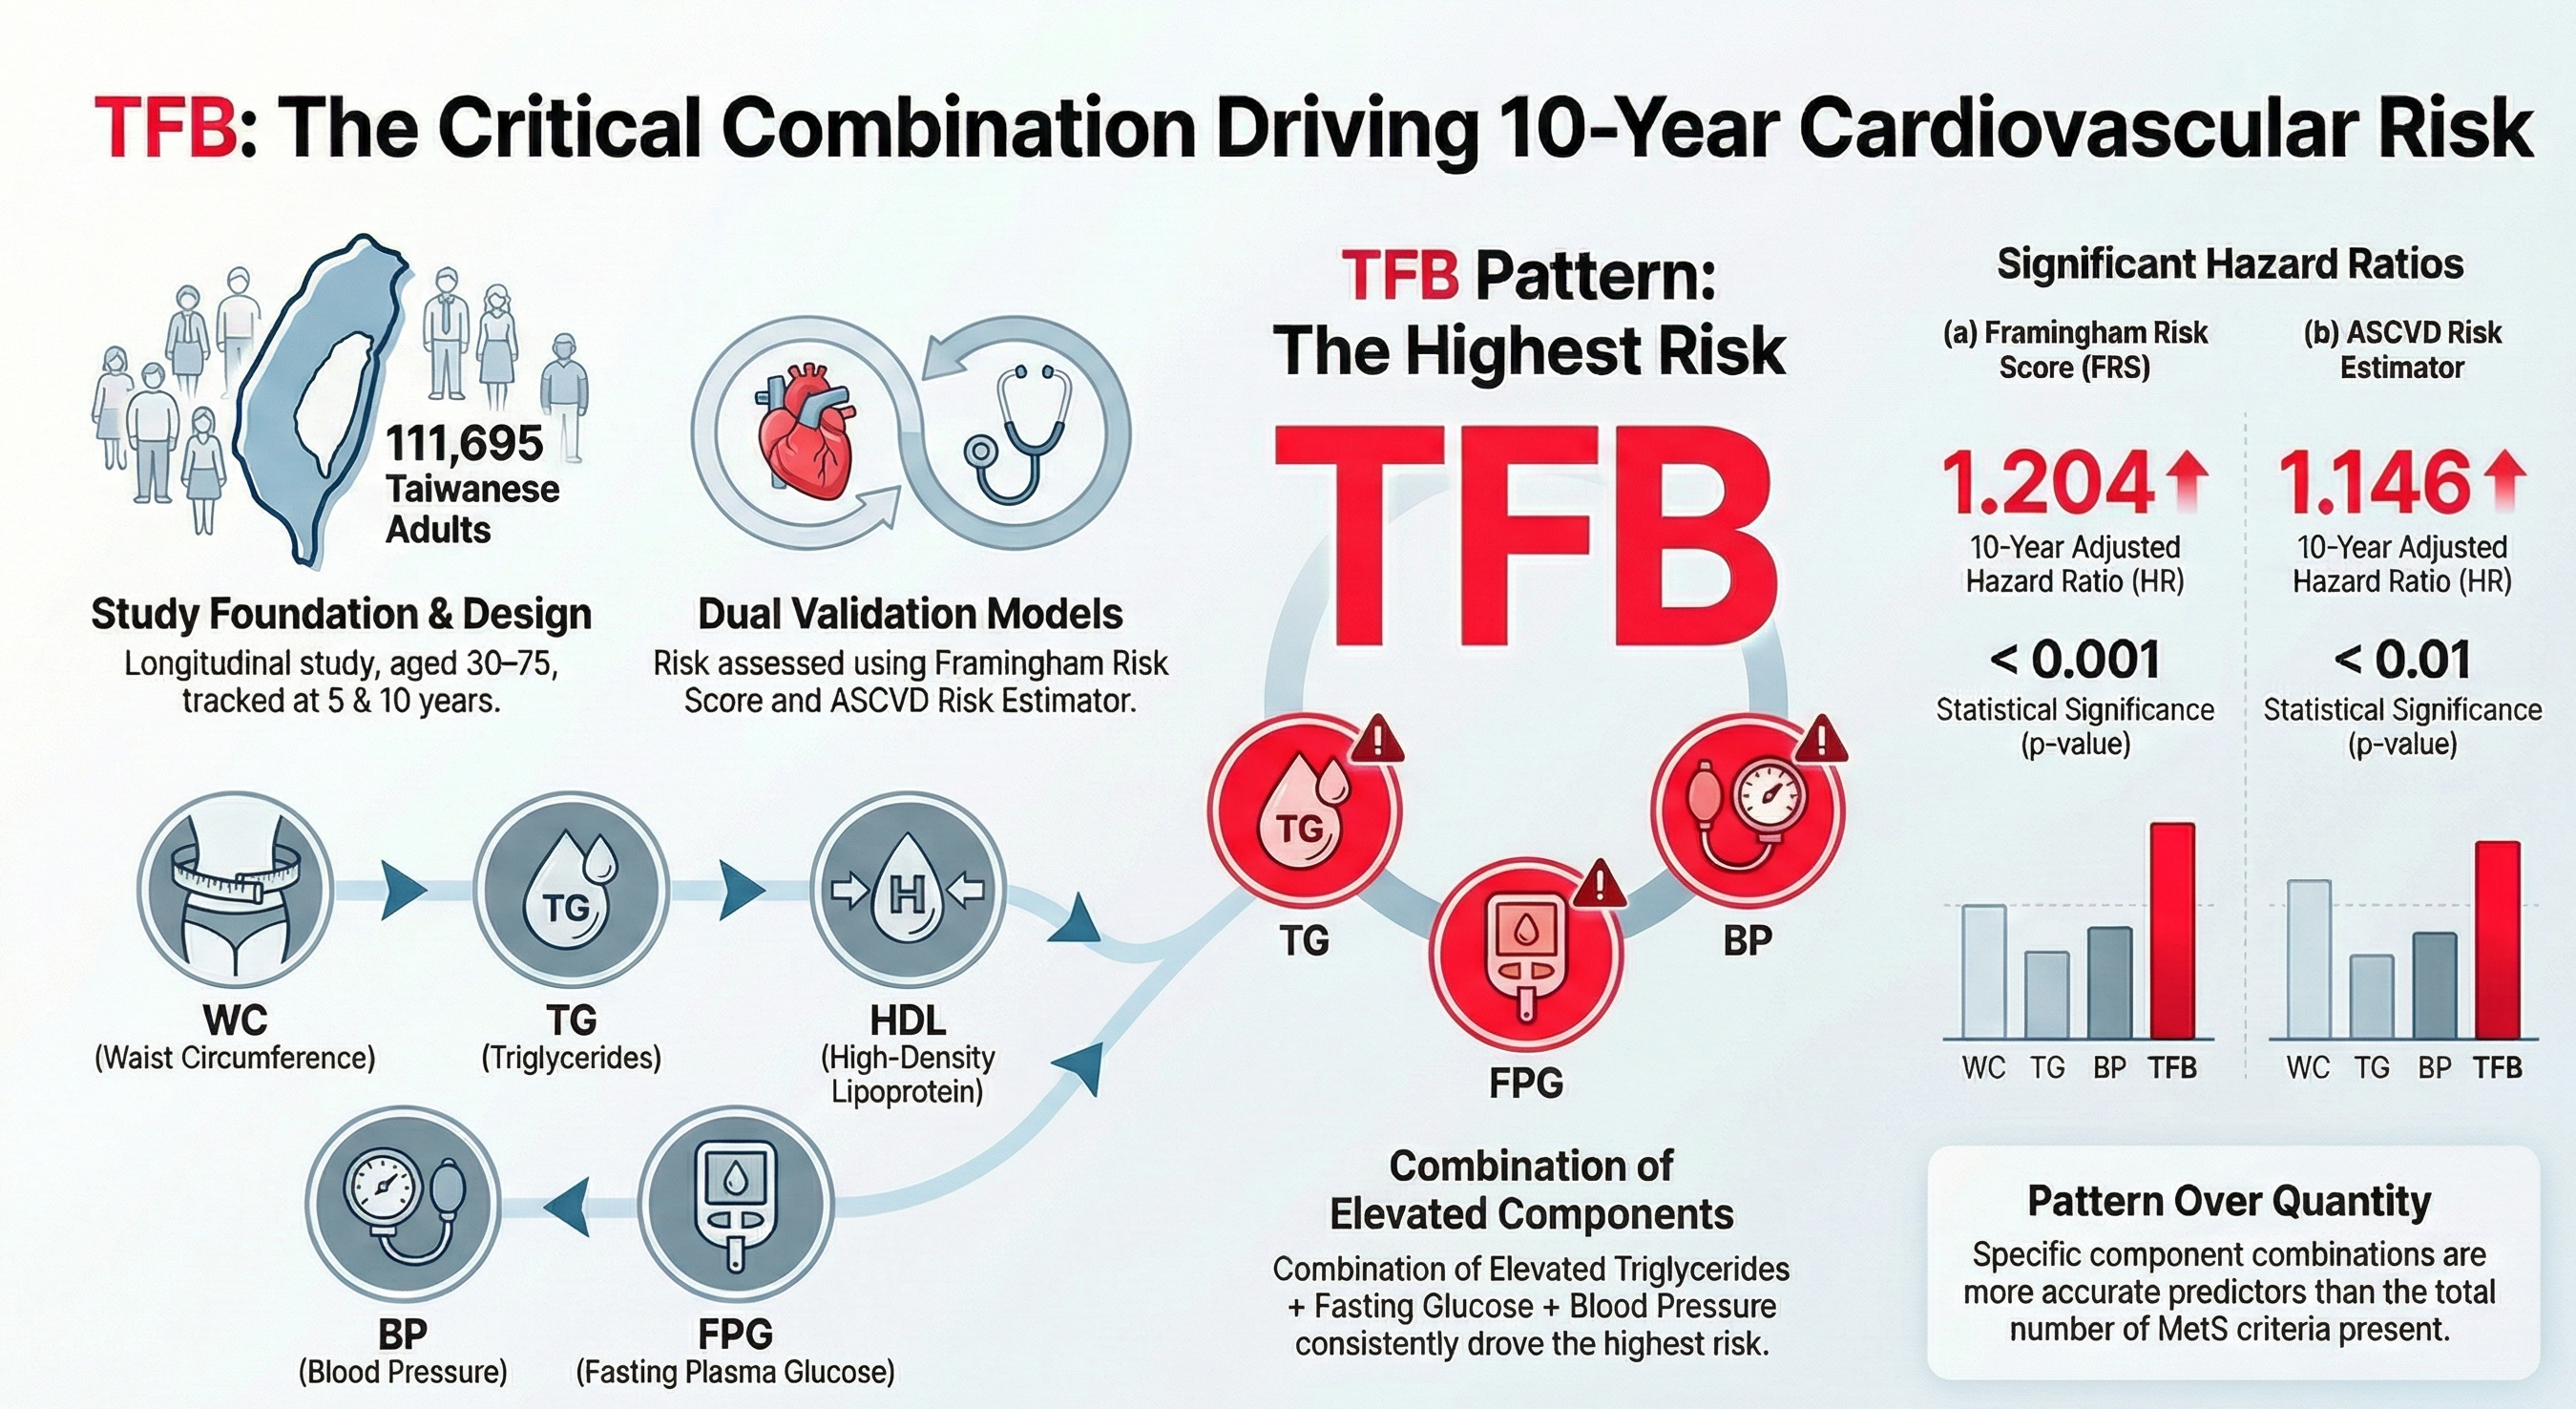
| TFB vs. non-MetS | 1.204 *** | 1.091 | 1.330 | 1.146 ** | 1.040 | 1.264 | ||
| TWH vs. non-MetS | 1.028 | 0.791 | 1.337 | 0.929 | 0.710 | 1.216 | ||
| TWB vs. non-MetS | 1.111 | 0.916 | 1.347 | 1.126 | 0.931 | 1.363 | ||
| THB vs. non-MetS | 1.157 | 0.885 | 1.513 | 1.175 | 0.899 | 1.536 | ||
| FWH vs. non-MetS | 1.021 | 0.852 | 1.223 | 0.915 | 0.763 | 1.098 | ||
| FWB vs. non-MetS | 1.054 | 0.958 | 1.159 | 1.125 * | 1.028 | 1.232 | ||
| FHB vs. non-MetS | 1.037 | 0.858 | 1.255 | 1.129 | 0.943 | 1.351 | ||
| WHB vs. non-MetS | 0.978 | 0.689 | 1.387 | 1.063 | 0.761 | 1.484 | ||
| Framingham Model | ASCVD Model | |||||
|---|---|---|---|---|---|---|
| Adjusted HR | 95% CI | Adjusted HR | 95% CI | |||
| Lower | Upper | Lower | Upper | |||
| TFWH vs. non-MetS | 1.085 | 0.925 | 1.272 | 0.964 | 0.822 | 1.130 |
| TFWB vs. non-MetS | 1.242 *** | 1.127 | 1.369 | 1.137 ** | 1.033 | 1.251 |
| TFHB vs. non-MetS | 1.361 *** | 1.157 | 1.600 | 1.300 ** | 1.112 | 1.519 |
| TWHB vs. non-MetS | 1.382 * | 1.025 | 1.863 | 1.208 | 0.890 | 1.640 |
| FWHB vs. non-MetS | 1.201 * | 1.005 | 1.435 | 1.184 | 0.999 | 1.403 |
Disclaimer/Publisher’s Note: The statements, opinions and data contained in all publications are solely those of the individual author(s) and contributor(s) and not of MDPI and/or the editor(s). MDPI and/or the editor(s) disclaim responsibility for any injury to people or property resulting from any ideas, methods, instructions or products referred to in the content. |
© 2026 by the authors. Licensee MDPI, Basel, Switzerland. This article is an open access article distributed under the terms and conditions of the Creative Commons Attribution (CC BY) license.
Share and Cite
Yeh, T.-M.; Hung, K.-C.; Hung, C.-L.; Lin, C.-L.; Tu, S.-K.; Tsan, Y.-T.; Liao, C.-C. Impact of Specific Metabolic Syndrome Combinations on Model-Estimated 10-Year Cardiovascular Risk in a Taiwanese Population. J. Clin. Med. 2026, 15, 4075. https://doi.org/10.3390/jcm15114075
Yeh T-M, Hung K-C, Hung C-L, Lin C-L, Tu S-K, Tsan Y-T, Liao C-C. Impact of Specific Metabolic Syndrome Combinations on Model-Estimated 10-Year Cardiovascular Risk in a Taiwanese Population. Journal of Clinical Medicine. 2026; 15(11):4075. https://doi.org/10.3390/jcm15114075
Chicago/Turabian StyleYeh, Tsung-Min, Kuang-Chen Hung, Chia-Lien Hung, Chih-Li Lin, Shih-Kai Tu, Yu-Tse Tsan, and Chun-Cheng Liao. 2026. "Impact of Specific Metabolic Syndrome Combinations on Model-Estimated 10-Year Cardiovascular Risk in a Taiwanese Population" Journal of Clinical Medicine 15, no. 11: 4075. https://doi.org/10.3390/jcm15114075
APA StyleYeh, T.-M., Hung, K.-C., Hung, C.-L., Lin, C.-L., Tu, S.-K., Tsan, Y.-T., & Liao, C.-C. (2026). Impact of Specific Metabolic Syndrome Combinations on Model-Estimated 10-Year Cardiovascular Risk in a Taiwanese Population. Journal of Clinical Medicine, 15(11), 4075. https://doi.org/10.3390/jcm15114075