1. Introduction
Renal masses are increasingly detected incidentally with the widespread use of cross-sectional imaging, encompassing a heterogeneous spectrum of neoplasms with distinct histopathological subtypes, molecular profiles, and clinical behaviors [
1]. Despite advances in imaging techniques, accurate non-invasive characterization of these lesions remains a significant clinical challenge, particularly in distinguishing tumor subtypes and predicting histopathological grade prior to treatment.
Tumor grade is a critical determinant of prognosis and therapeutic decision-making in renal cell carcinoma. High-grade tumors (WHO grades 3–4) are associated with substantially worse clinical outcomes compared to low-grade tumors (grades 1–2), with reported survival rates varying markedly between these groups [
2]. Therefore, reliable preoperative estimation of tumor grade may facilitate risk stratification and guide individualized management strategies.
Current treatment approaches for renal tumors range from active surveillance to surgical resection, ablation therapies, and systemic treatments. In this context, magnetic resonance imaging (MRI) has emerged as a valuable non-invasive tool due to its superior soft-tissue contrast and its ability to provide both anatomical and functional information. Beyond conventional imaging, quantitative MRI techniques enable objective assessment of tissue characteristics and tumor microenvironment.
Quantitative parameters such as native and post-contrast T1 relaxation times, T2* relaxation times, apparent diffusion coefficient (ADC), and derived R2* values have shown promise as imaging biomarkers reflecting cellularity, vascularity, and tissue composition [
3]. Among these, ADC has been extensively studied and is widely accepted as a surrogate marker of tumor cellularity. However, the additional value of other quantitative parameters, particularly T2* and R2* metrics, remains incompletely understood [
4,
5,
6]. Recent studies have explored multiparametric MRI and quantitative approaches for renal tumor characterization, including T1 mapping and diffusion-based analyses [
7,
8].
In contrast to previous studies, our approach integrates multiple quantitative MRI parameters together with the use of the contralateral healthy renal cortex as an internal reference, which may enhance clinical interpretability.
Moreover, the majority of previous studies have evaluated these parameters in isolation, limiting their clinical applicability. A comprehensive multiparametric approach may provide a more robust and reproducible characterization of renal tumors. In addition, normalization strategies using internal references, such as the contralateral renal cortex, have been insufficiently explored despite their potential to reduce inter-individual variability and improve measurement reliability.
In this context, the present study aims to investigate the clinical utility of a multiparametric MRI approach for the differentiation of renal tumor subtypes and WHO grades. Unlike prior studies, we integrated multiple quantitative MRI parameters and applied normalization using the contralateral renal cortex as an internal reference to enhance reproducibility and real-world applicability. Furthermore, a Random Forest-based machine learning model was incorporated as a supportive analytical tool to evaluate the combined diagnostic performance of imaging parameters rather than to establish a standalone predictive model.
Specifically, this study sought to: (1) assess interobserver agreement of quantitative MRI measurements; (2) evaluate differences in imaging parameters between tumor grades; (3) investigate variations among renal tumor subtypes; and (4) explore the potential clinical utility of these parameters in tumor classification [
9].
2. Materials and Methods
2.1. Ethical Considerations
This retrospective study was conducted following approval from the Dokuz Eylul University Faculty of Medicine Ethics Committee (Decision No: 2023/28-11) and adhered to the principles outlined in the Declaration of Helsinki. The requirement for informed consent was waived due to the retrospective design of the study.
2.2. Population
This study included adult patients with histopathologically confirmed renal tumors who underwent surgical treatment for solid renal masses at our institution between July 2019 and January 2024. A total of 204 patients were initially identified during this period.
Among these, patients who had undergone preoperative MRI using a standardized renal imaging protocol that included full renal parenchymal coverage were selected for further evaluation (n = 100).
Exclusion criteria were as follows: MRI examinations performed at external institutions, age under 18 years, presence of cystic renal tumors, and inadequate image quality due to significant artifacts (e.g., motion-related degradation) that could compromise quantitative analysis.
After applying these criteria, 82 patients were included in the final study cohort.
2.3. MRI Protocol
All MRI examinations were performed on a 1.5-T system (Philips Healthcare, Best, The Netherlands).
The imaging protocol included conventional anatomical sequences such as axial and coronal T2-weighted turbo spin-echo (TSE), fat-suppressed T2-weighted imaging (SPIR), dual-phase gradient-echo (GRE) T1-weighted imaging, and dynamic contrast-enhanced GRE T1-weighted imaging.
Diffusion-weighted imaging (DWI) was acquired using a b-value of 1000 s/mm2, and corresponding apparent diffusion coefficient (ADC) maps were automatically generated (TR/TE = 2084/101 ms; slice thickness = 5 mm).
T2* mapping and derived R2* values were obtained using an mDixon Quant sequence (TR = 5.32 ms; matrix = 192 × 192; slice thickness = 3 mm).
T1 mapping was performed both before and after contrast administration using identical acquisition parameters (TR = 2.14 ms; TE = 0.956 ms; slice thickness = 10 mm).
2.4. Image Analysis
Preoperative MRI datasets were evaluated using the institutional picture archiving and communication system (PACS) on a dedicated workstation (Sectra Workstation IDS7, Version 24.2.16.6066; Sectra AB, Linköping, Sweden). Demographic, clinical, and histopathological information was retrieved from the hospital database.
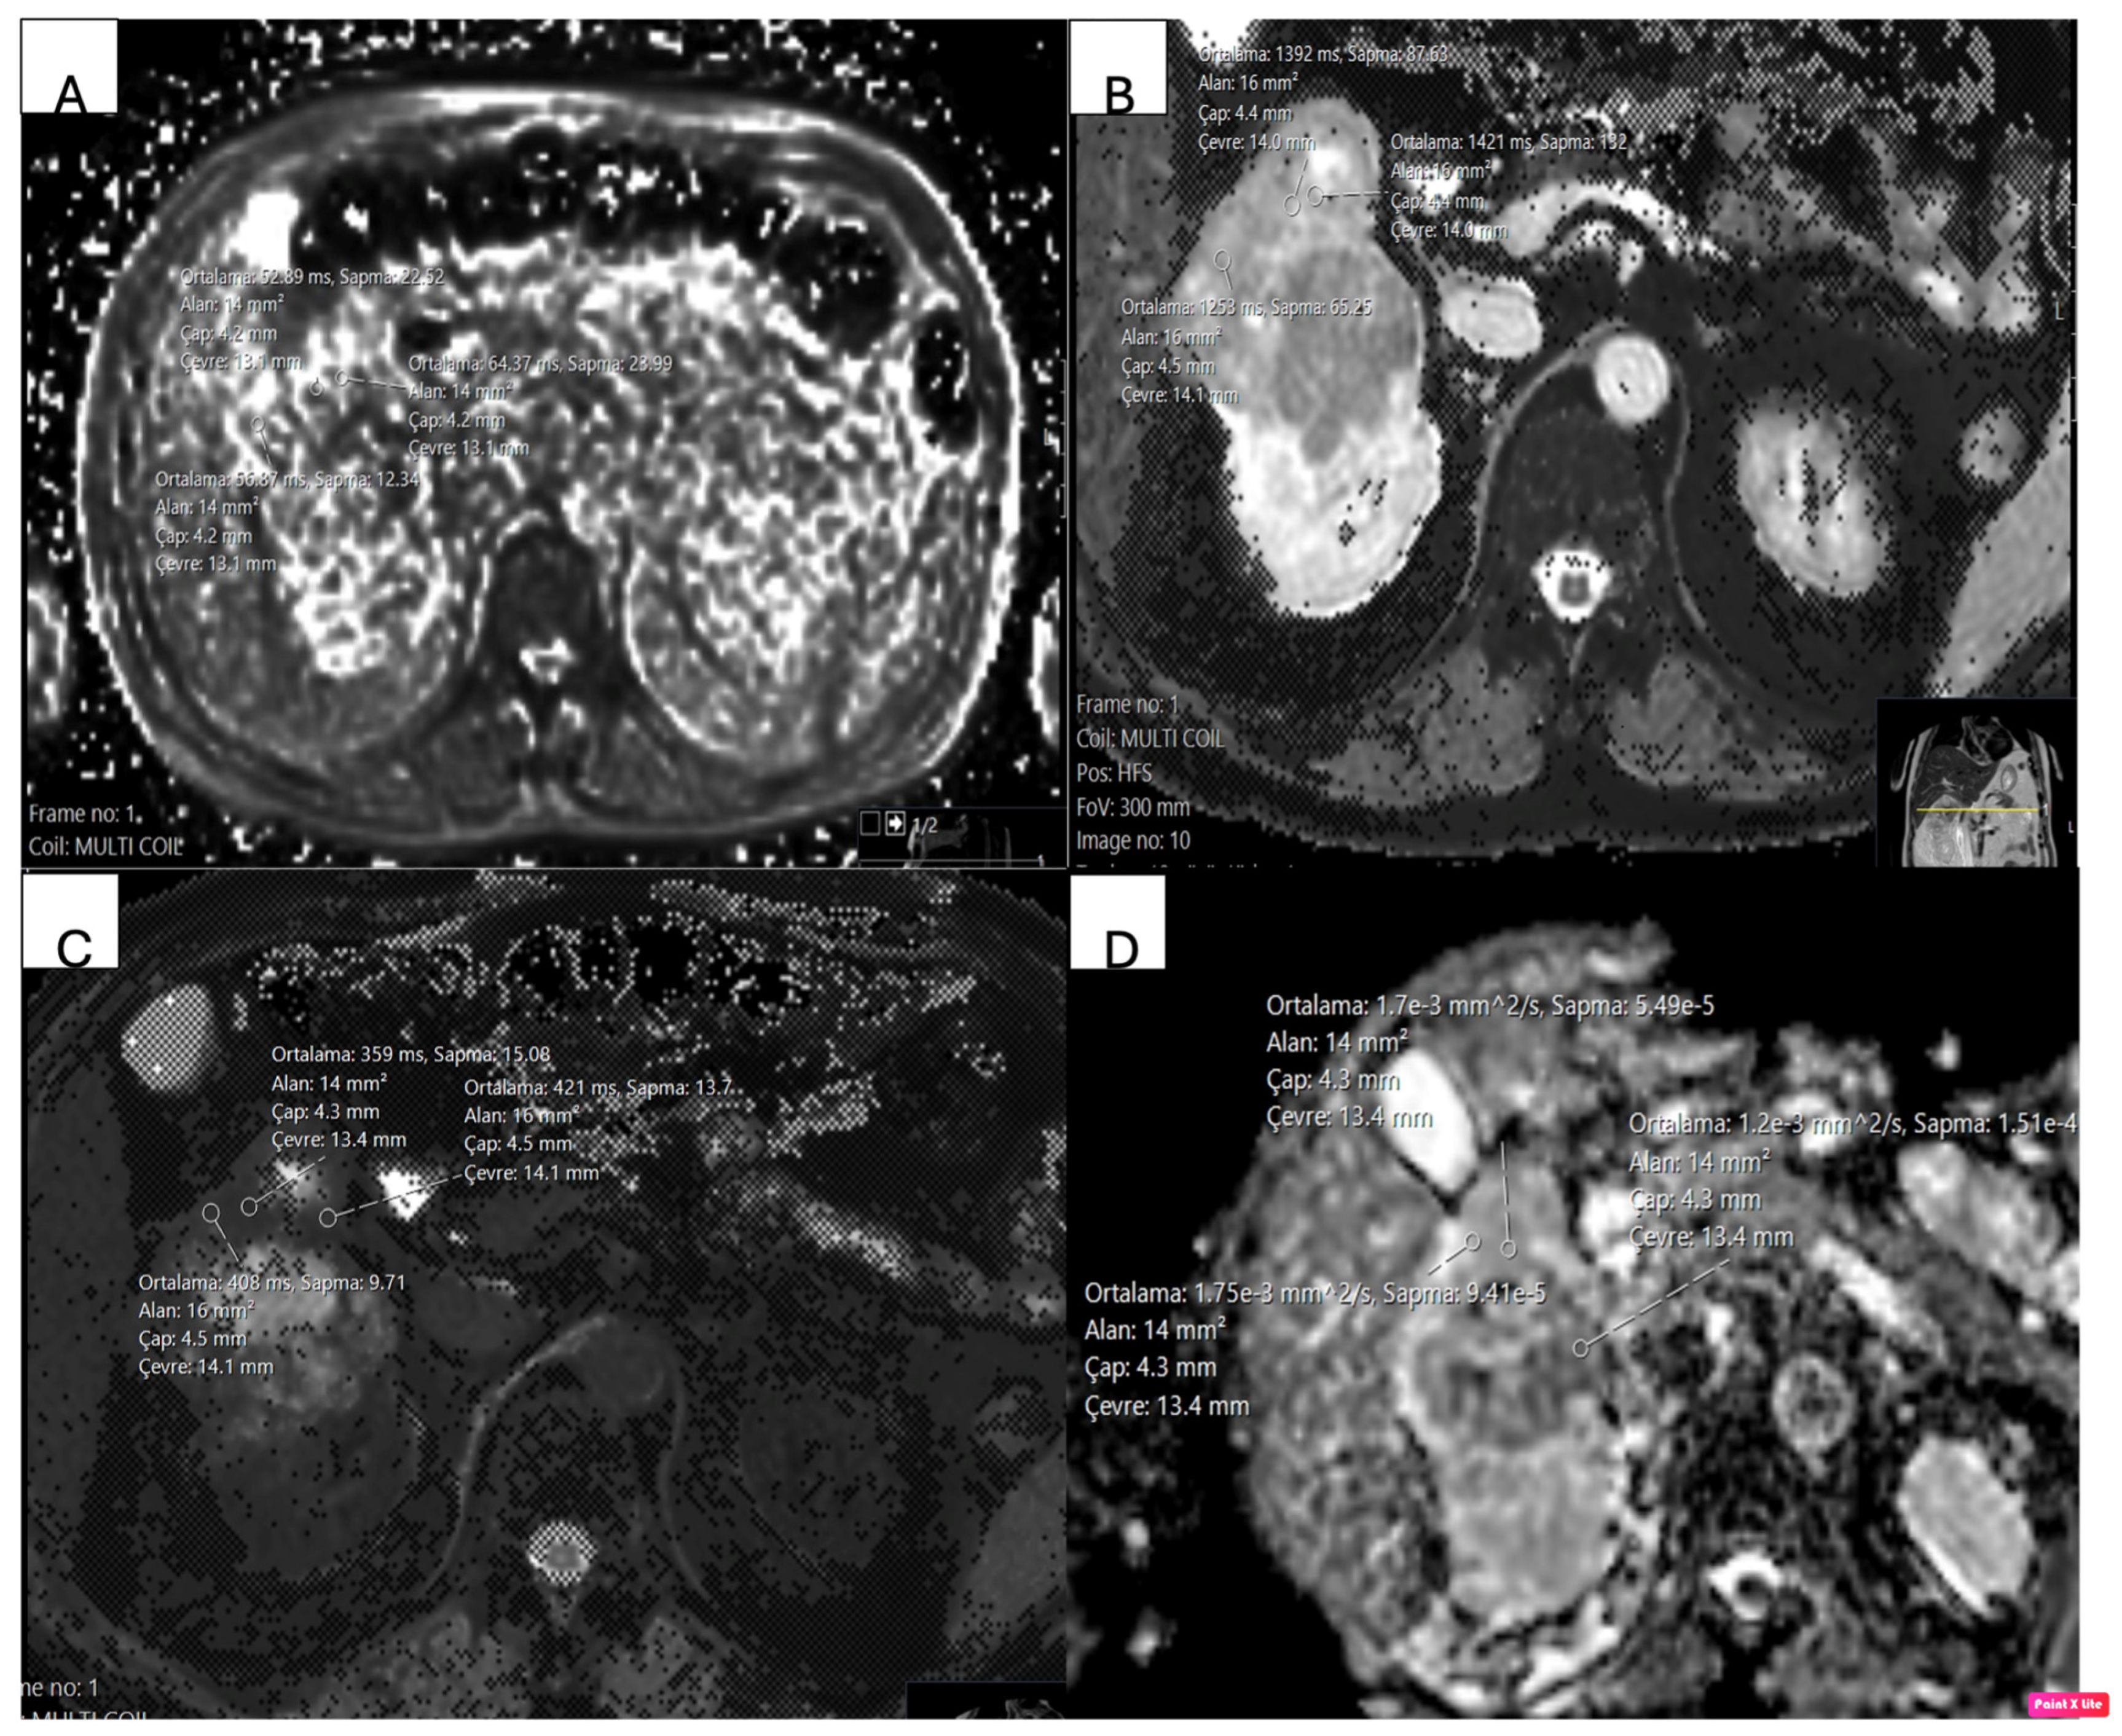
Quantitative analysis was performed on the enhancing solid portions of the renal tumors. For each lesion, three circular regions of interest (ROIs) with an area ranging from 10 to 20 mm
2 (mean approximately 15 mm
2) were placed within representative tumor regions, and the average value was used for statistical analysis. Areas demonstrating hemorrhage, necrosis, cystic degeneration, or macroscopic fat were systematically excluded. In addition, regions exhibiting marked signal heterogeneity or high variability were avoided to ensure measurement consistency [
Figure 1]. ROIs were deliberately kept small to minimize partial volume effects and to avoid inclusion of non-tumoral components such as necrotic, cystic, or hemorrhagic areas. Placement was performed subjectively on the most solid-appearing tumor regions on representative slices.
Tumor T2*, native T1, and post-contrast T1 relaxation times were recorded in milliseconds (ms), and R2* values were derived as the reciprocal of T2* (1/T2*). Apparent diffusion coefficient (ADC) values were obtained from ADC maps and expressed in mm2/s. ADC values were not normalized.
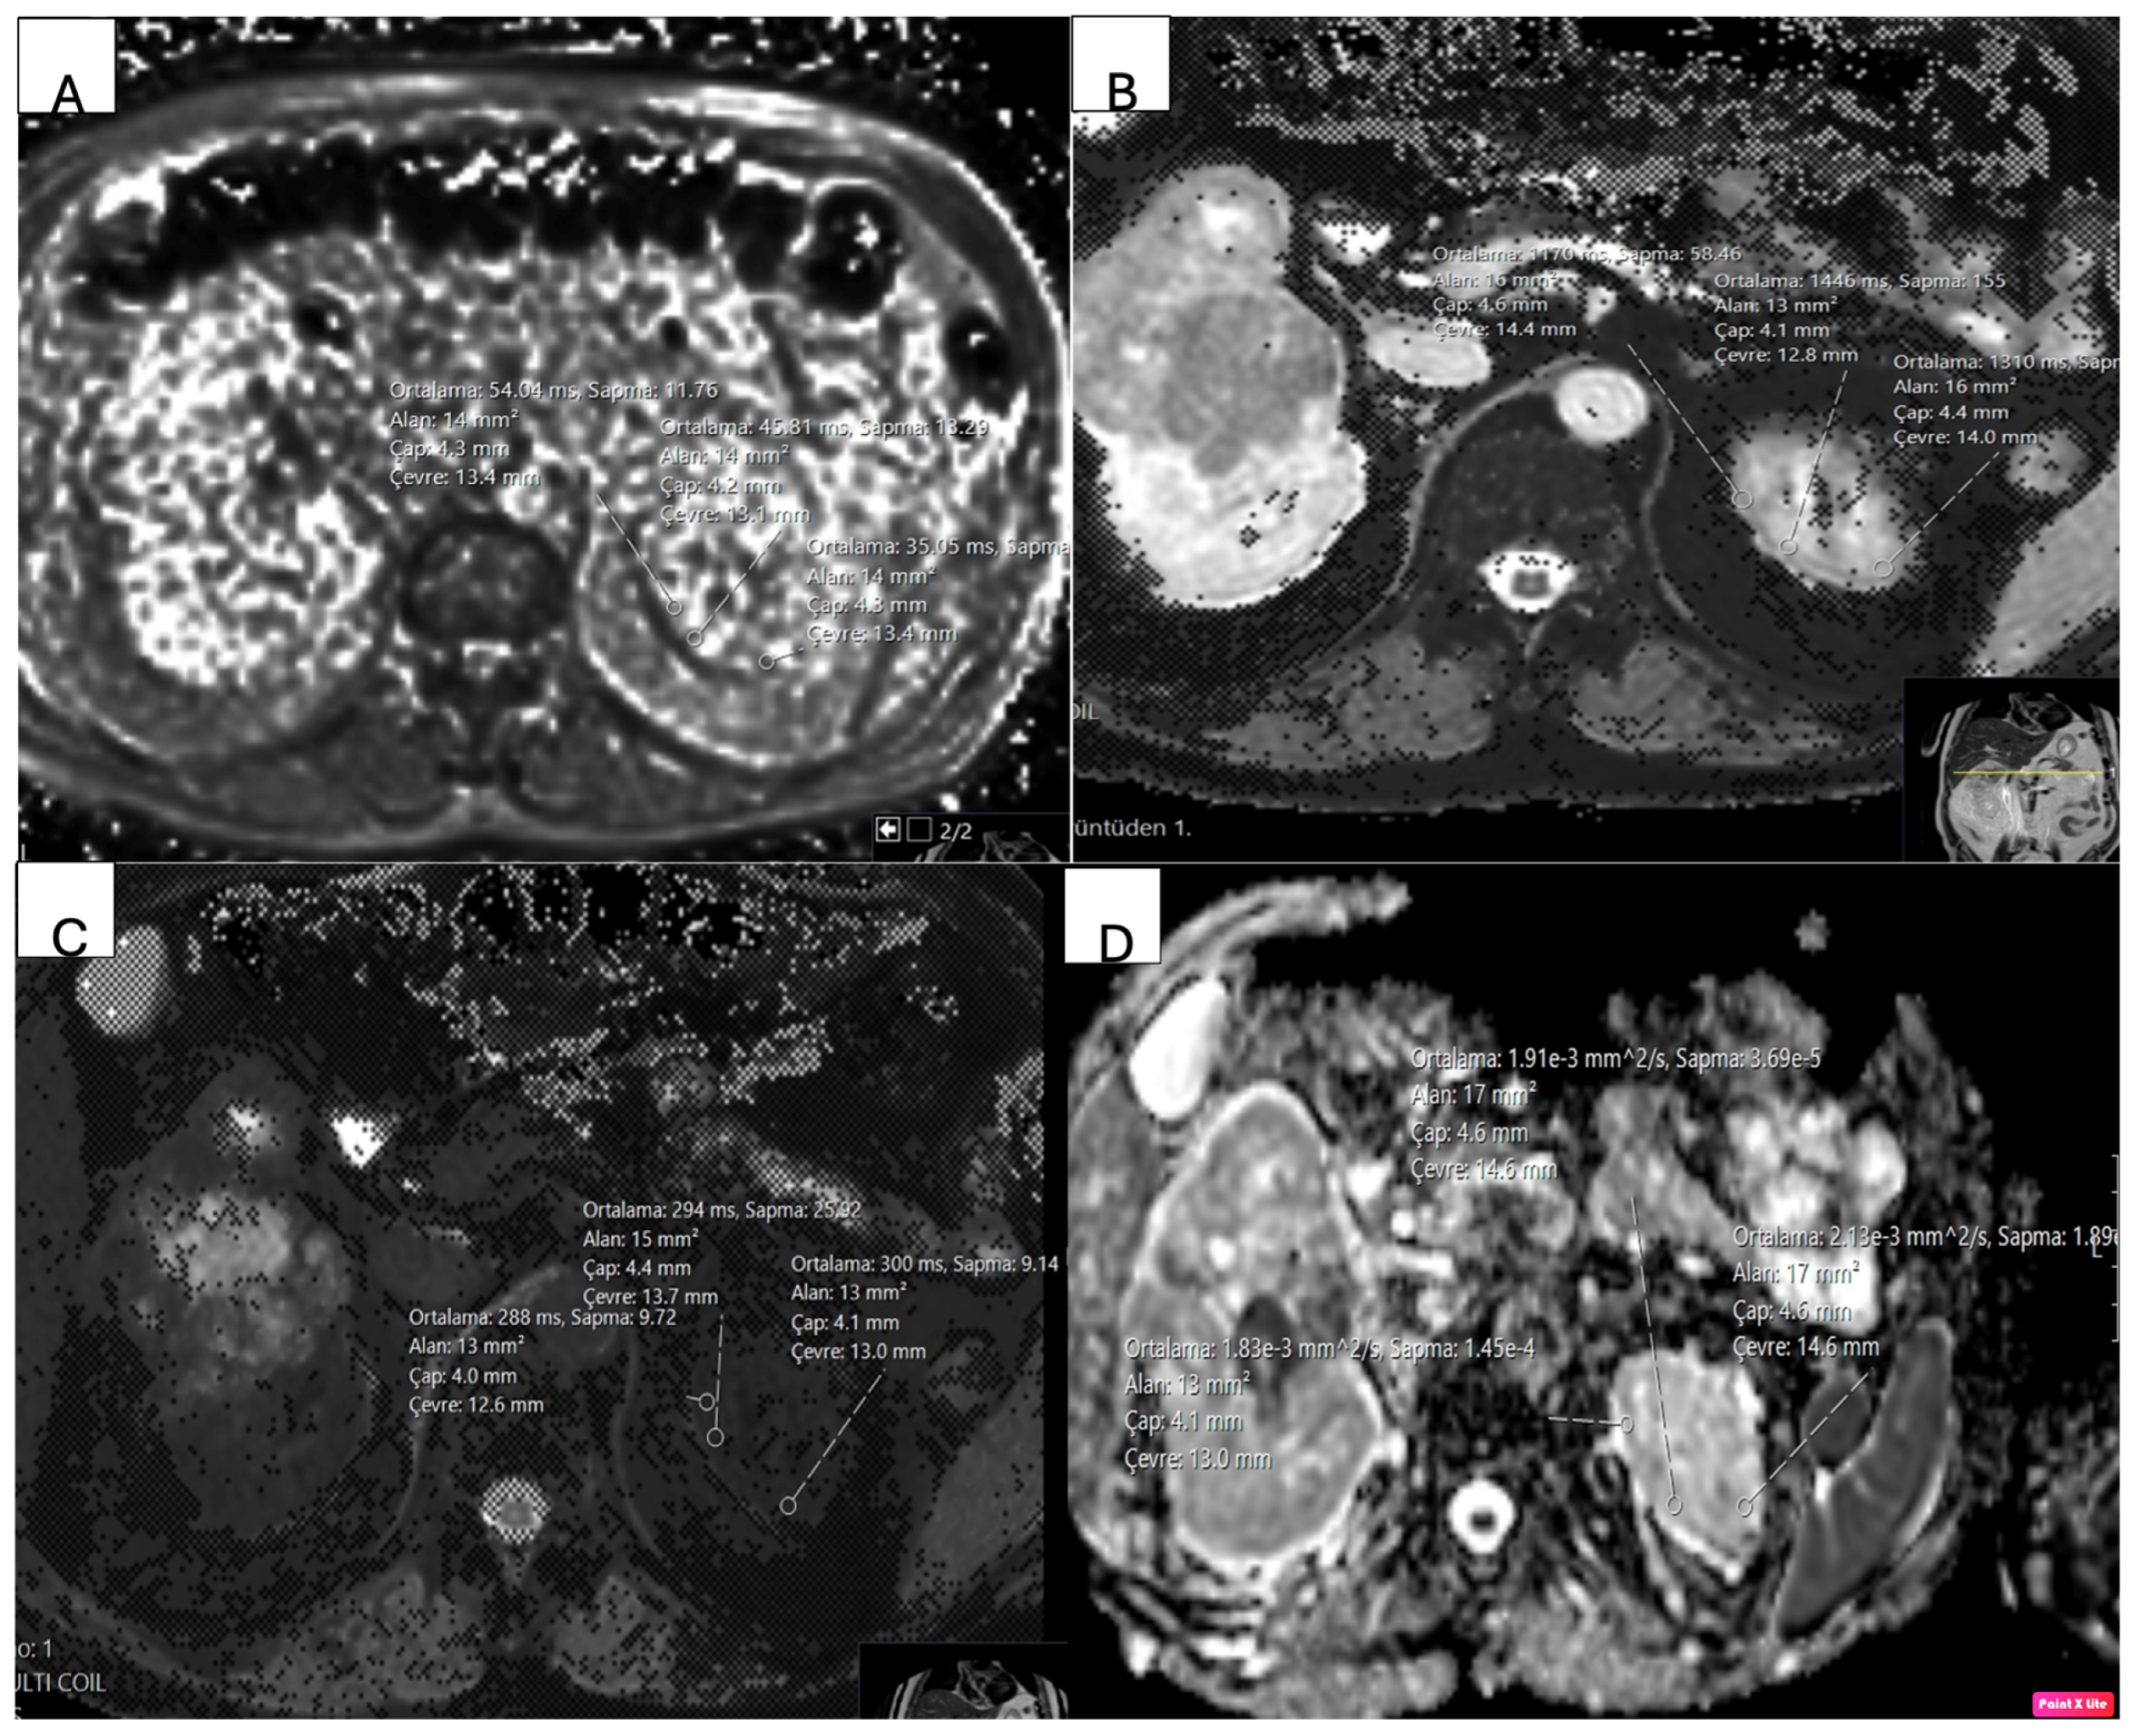
To account for inter-individual variability, corresponding measurements were also obtained from the cortex of the contralateral normal kidney in each patient, carefully avoiding the collecting system and simple cysts [
Figure 2].
All measurements were initially performed by a radiologist with 5 years of experience in abdominal imaging and subsequently repeated by a second independent radiologist with 8 years of experience, who was blinded to the initial measurements, in order to assess interobserver reproducibility. Standardized ROI placement was applied across all cases to minimize observer-dependent variability.
2.5. Statistical Analysis
Descriptive statistics were reported as frequencies for categorical variables and as mean ± standard deviation or median with interquartile range (IQR) for continuous variables, depending on data distribution. Normality was assessed using visual inspection of histograms in combination with the Shapiro–Wilk test. As the MRI-derived variables did not follow a normal distribution, non-parametric statistical methods were applied throughout the analysis.
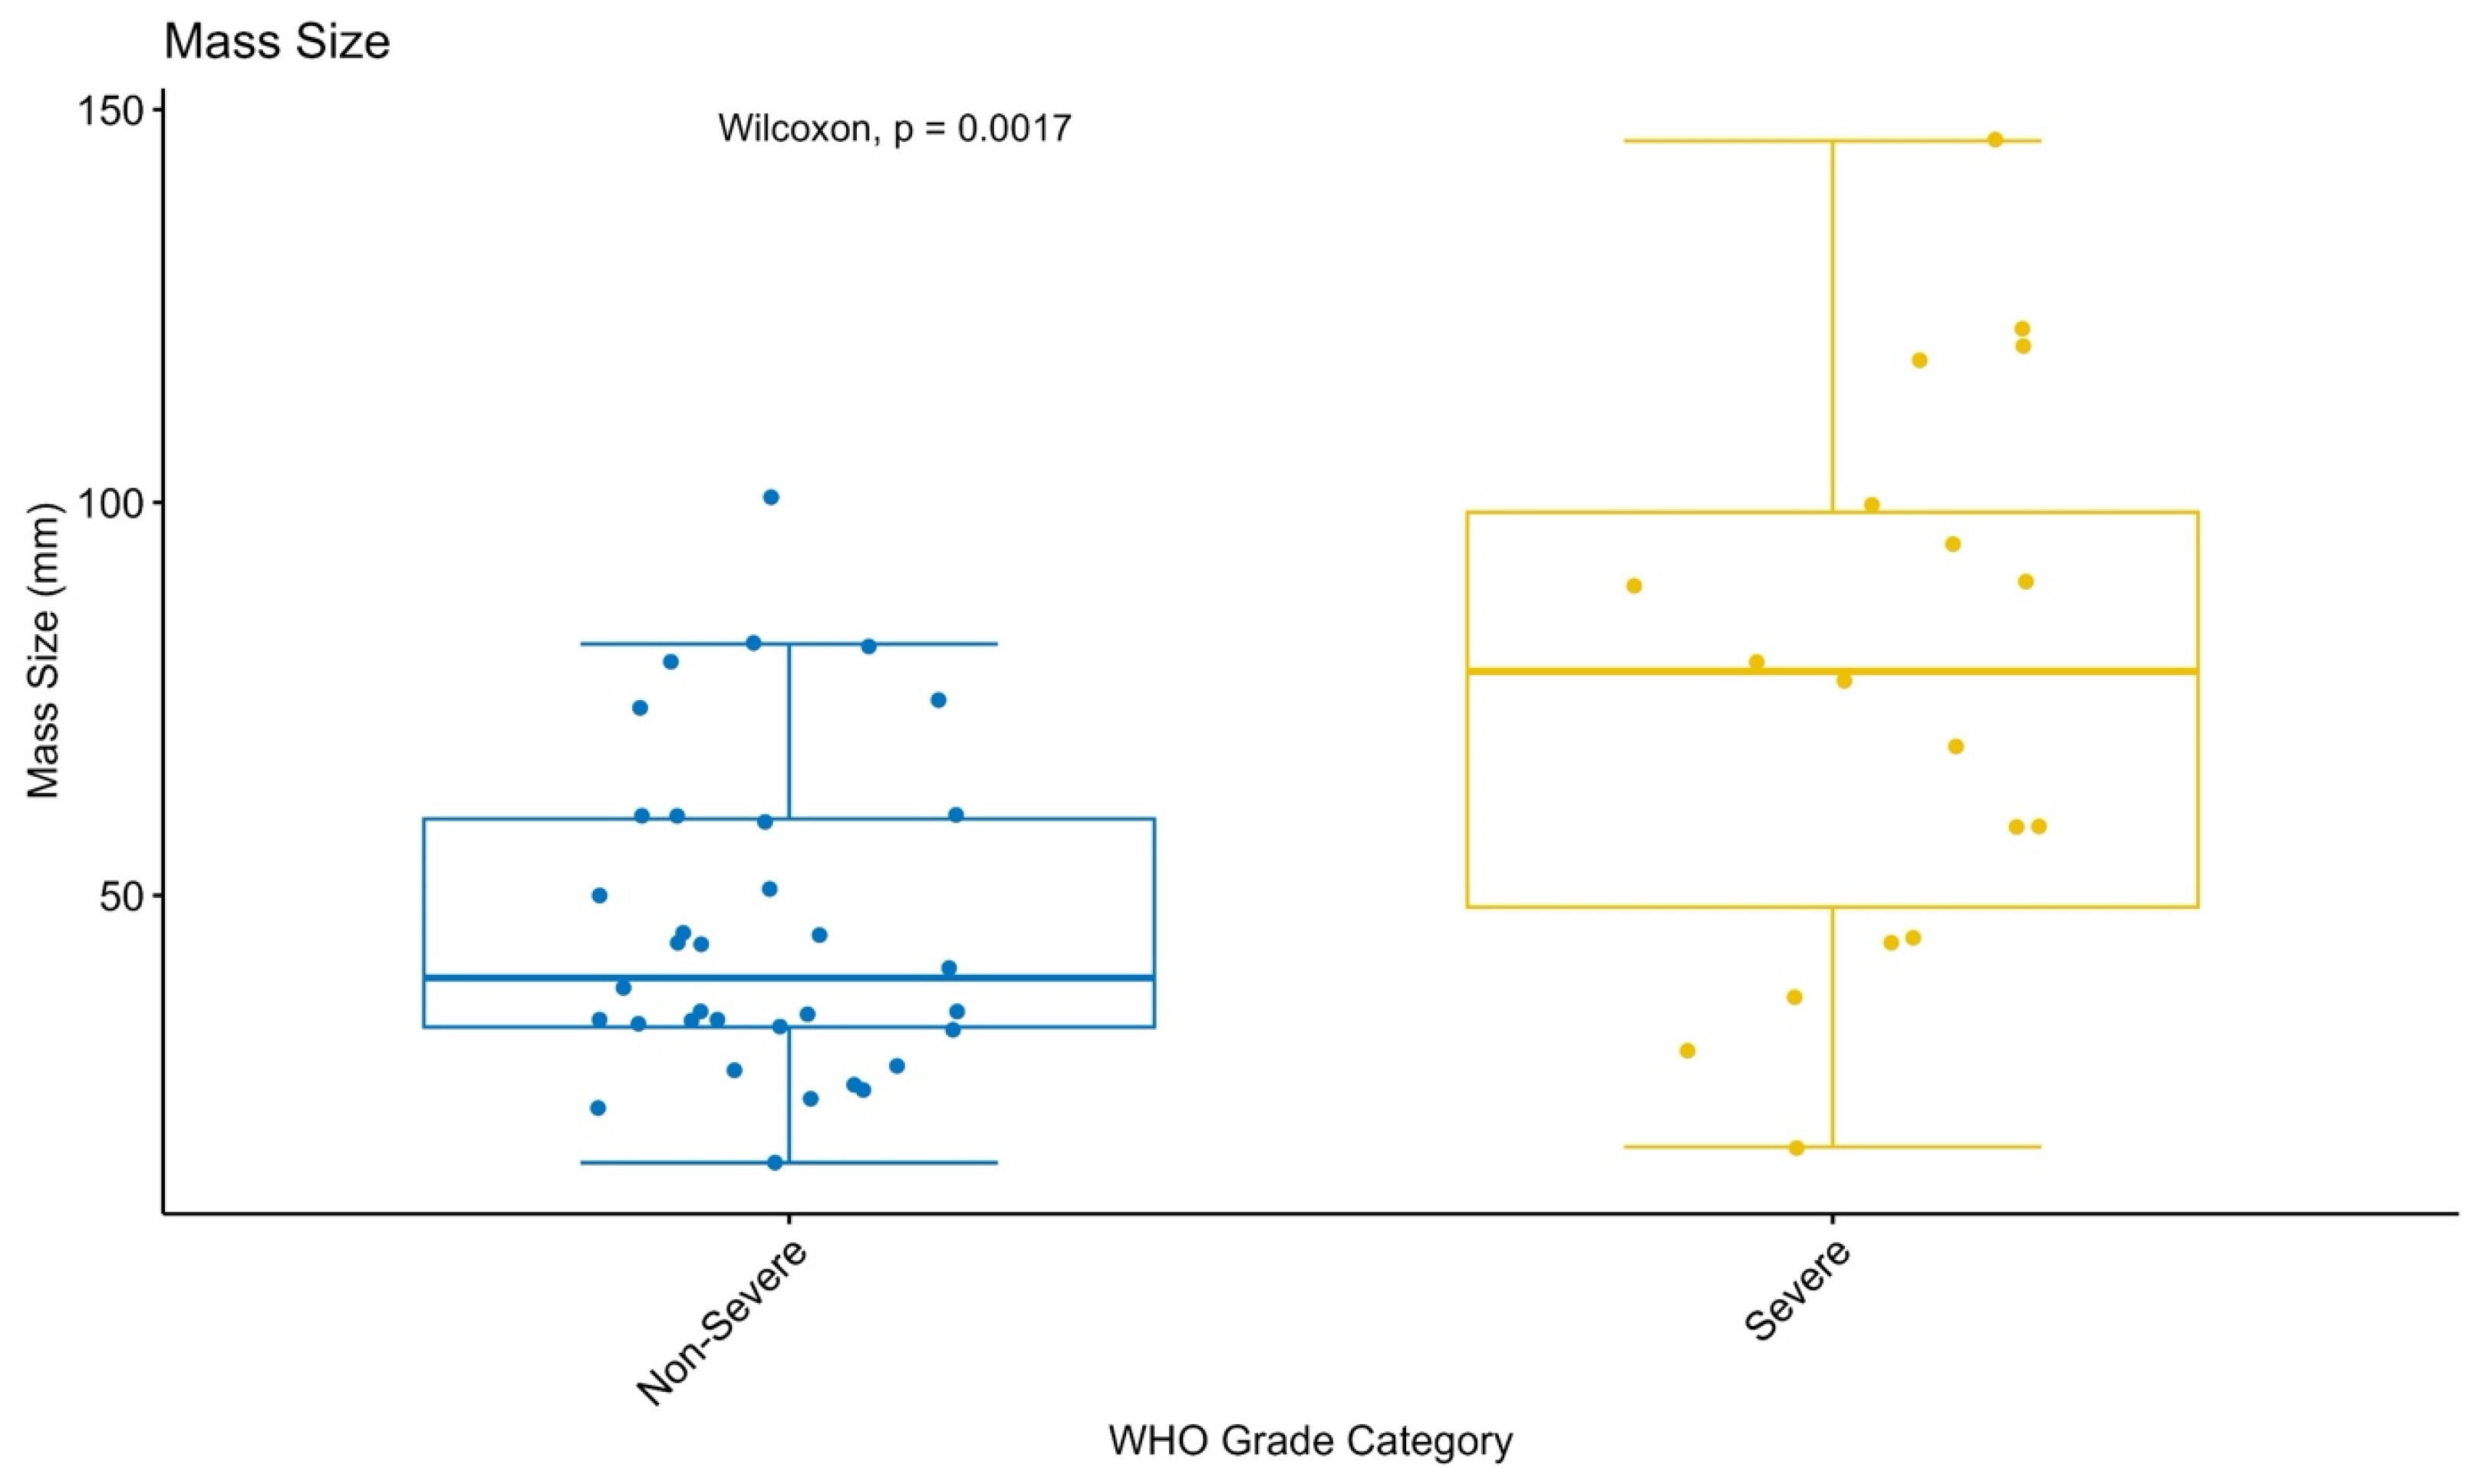
Interobserver agreement was evaluated using Spearman’s rank correlation coefficient. For grading analysis, tumors were grouped into low-grade (WHO grades 1–2) and high-grade (WHO grades 3–4) categories. In addition, the relationship between tumor size (maximum diameter in mm) and WHO grade was investigated.
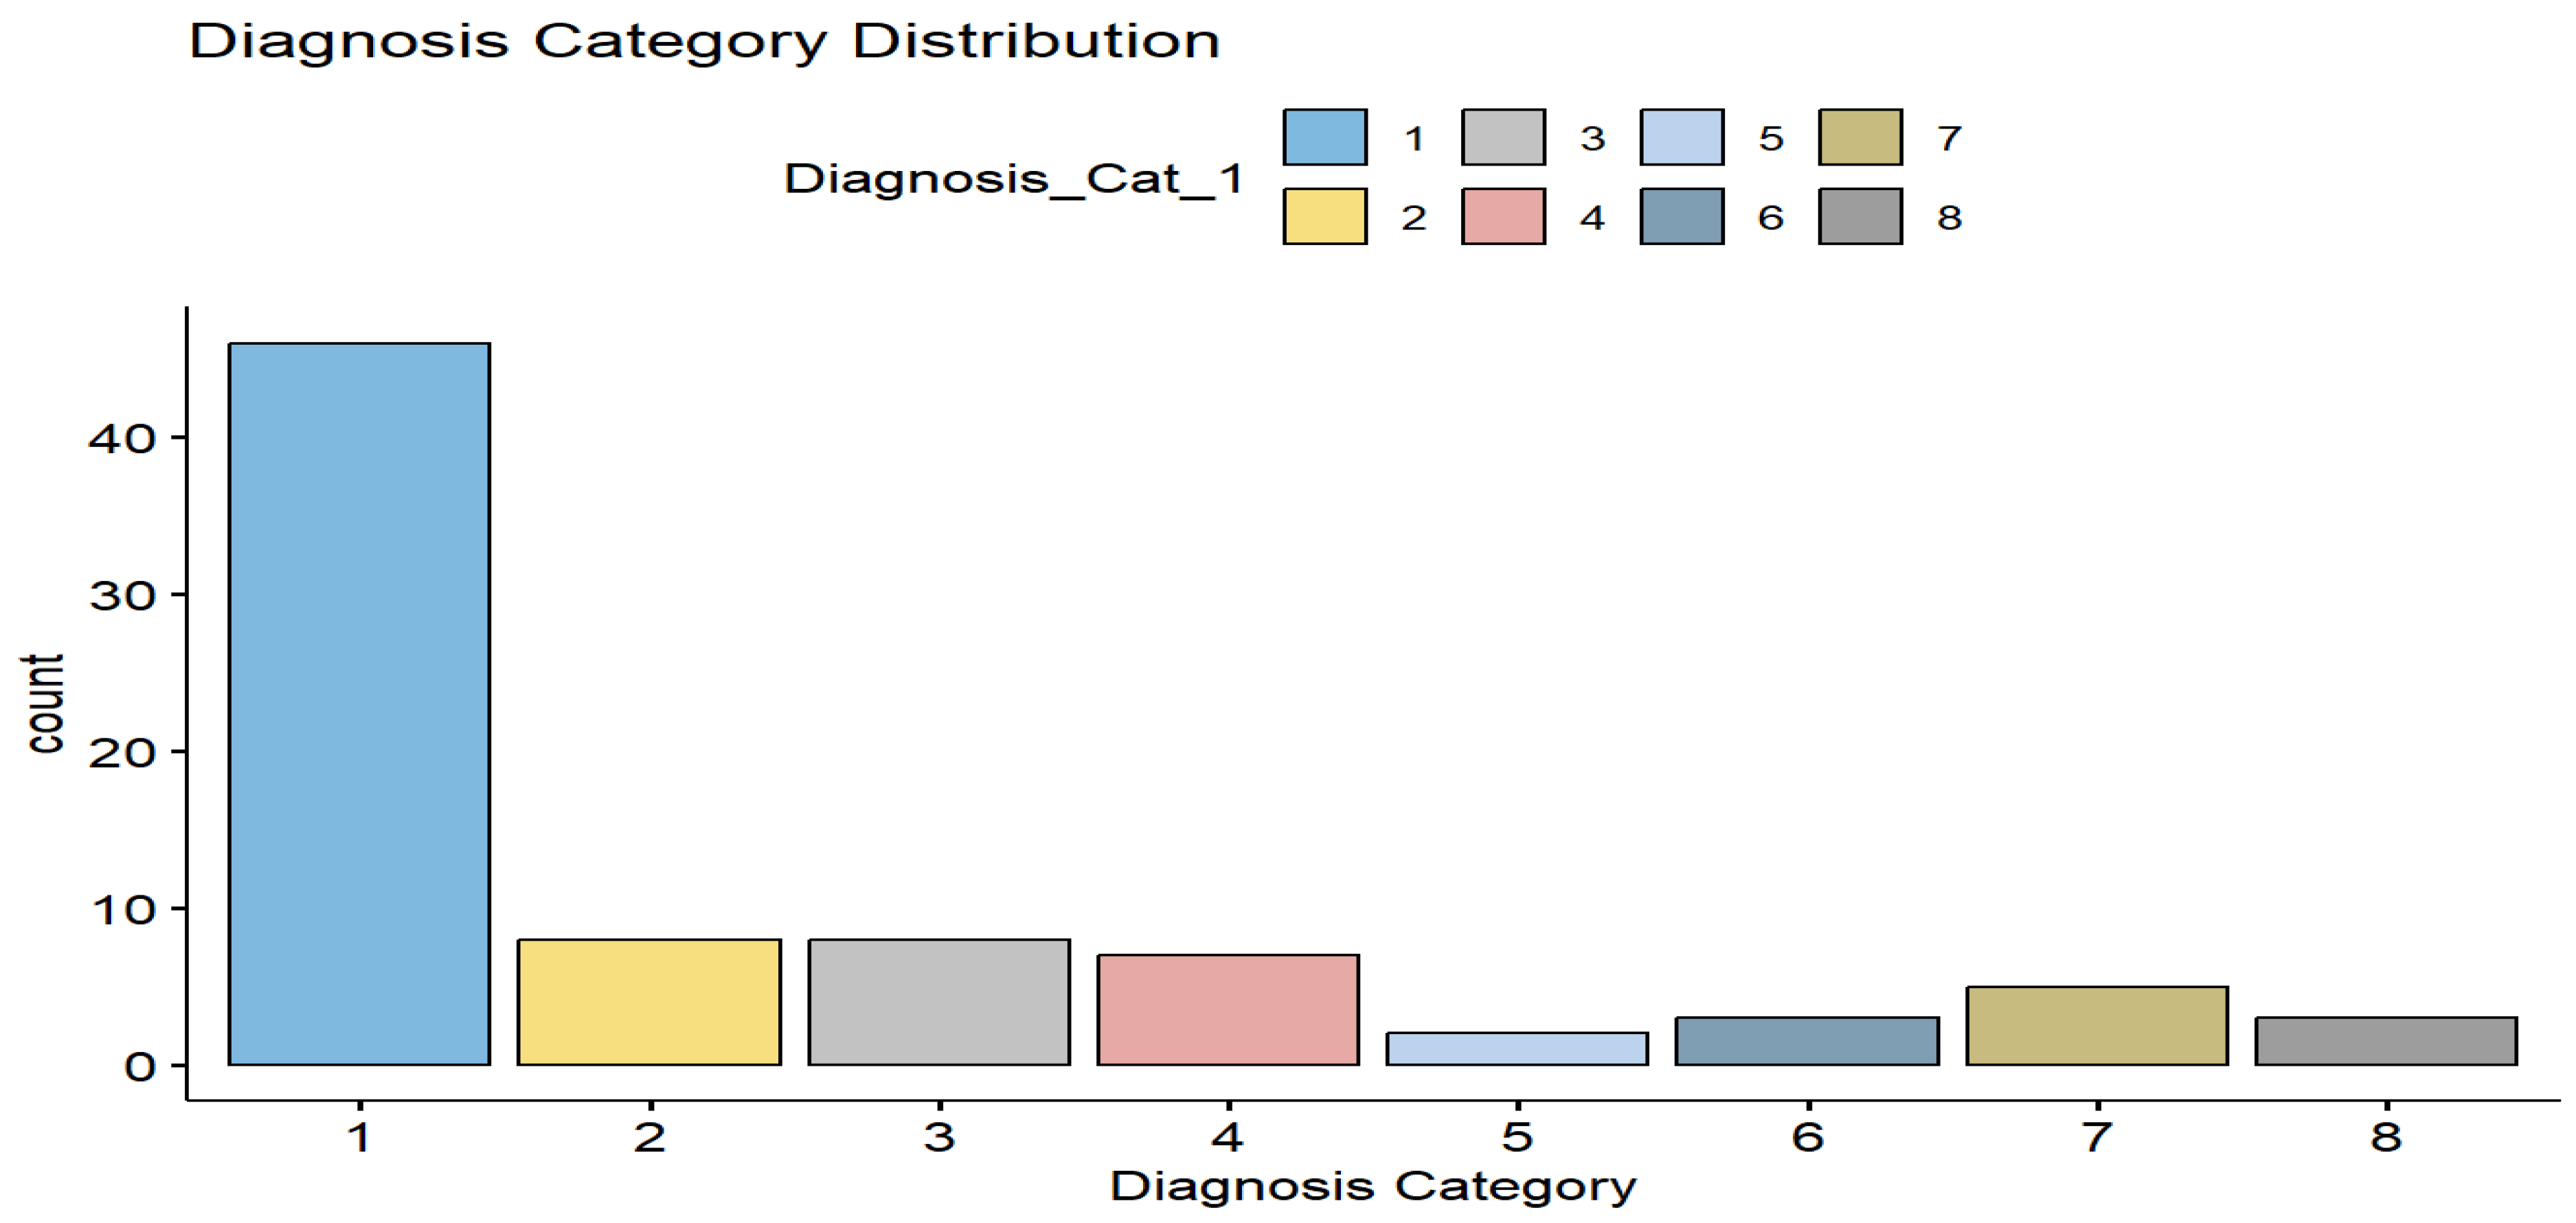
For subtype evaluation, the most frequently encountered tumor types (clear cell, papillary, and chromophobe renal cell carcinoma) were analyzed using a binary classification framework (presence vs. absence).
Comparisons between independent groups were performed using the Mann–Whitney U test, while paired comparisons between tumor tissue and the contralateral normal renal cortex were conducted using the Wilcoxon signed-rank test. A two-tailed p-value of <0.05 was considered statistically significant. Statistical analyses were performed using IBM SPSS Statistics for Windows, Version 29.0 (IBM Corp., Armonk, NY, USA).
2.6. Machine Learning
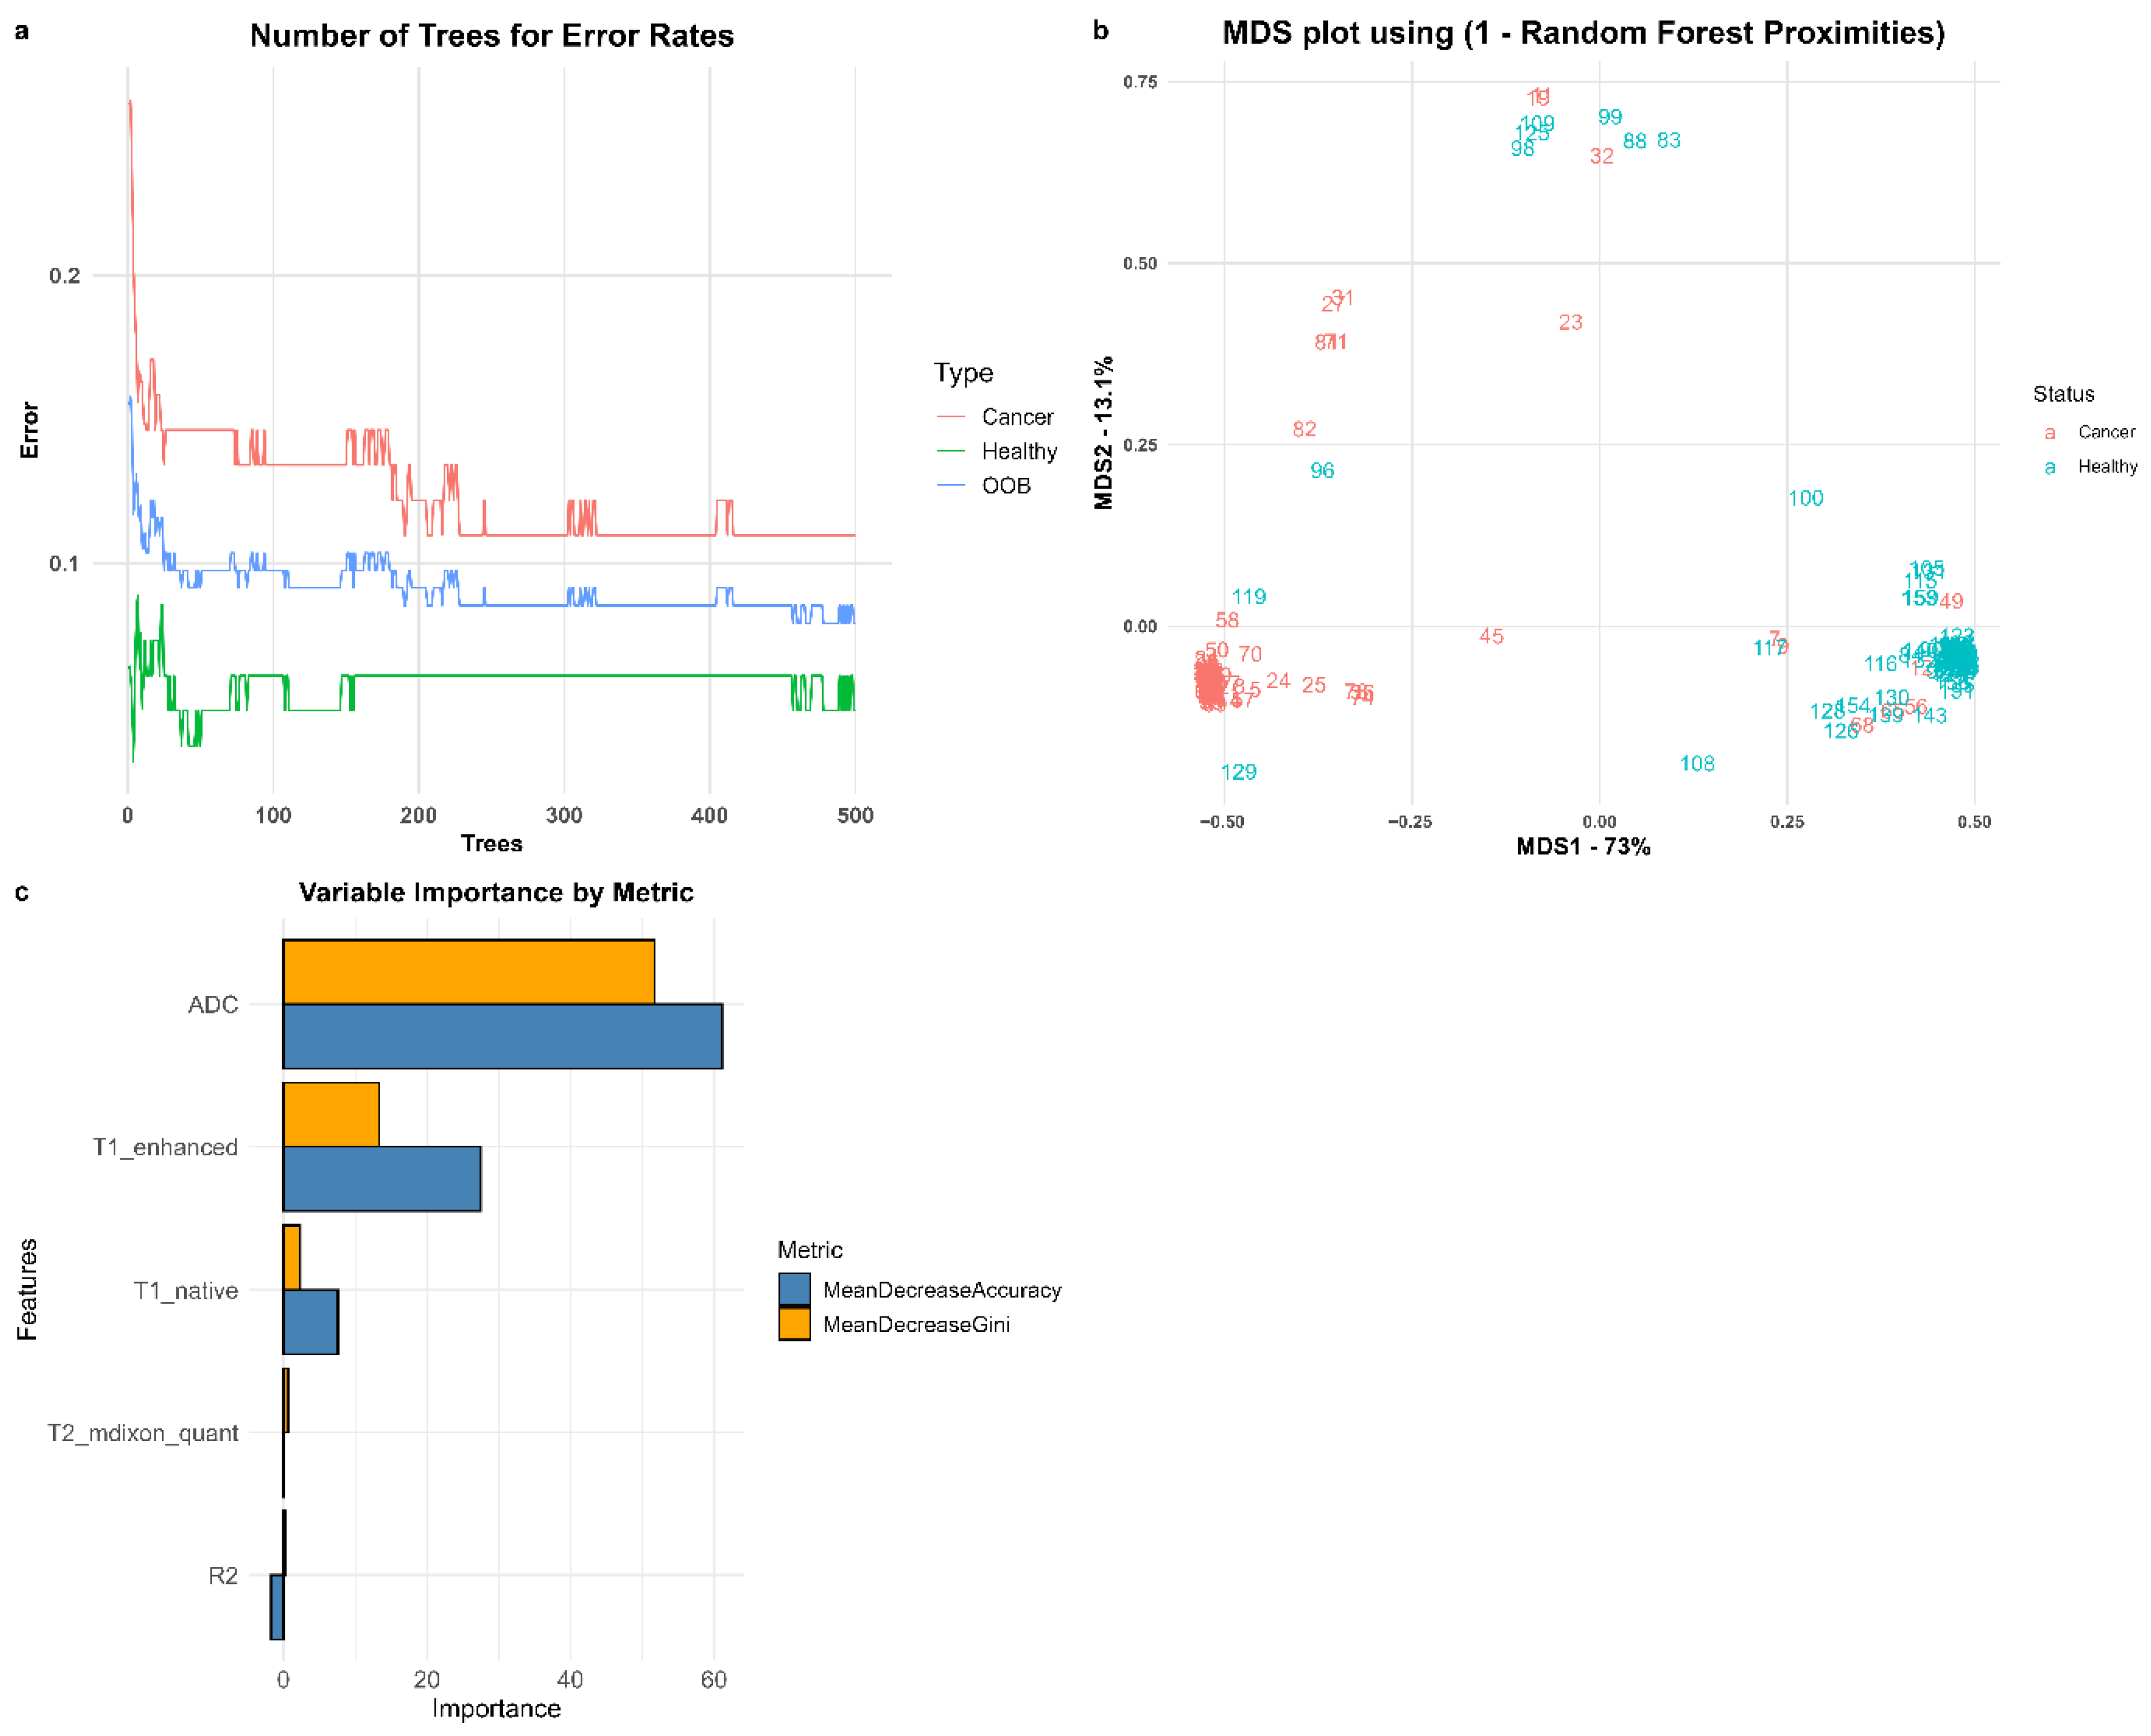
A Random Forest algorithm was used as a supplementary analytical tool to differentiate renal tumor tissue from healthy renal cortex. Model parameters were optimized using out-of-bag (OOB) error estimation and 10-fold cross-validation, with the number of variables randomly sampled at each split (mtry) set to 5. To reduce overfitting, the node size was set to 10 and the maximum number of nodes was limited to 5.
The dataset from the first observer was used for training, while the second observer dataset was used as independent test data. All statistical analyses were performed using R software version 4.3.2 (R Foundation for Statistical Computing, Vienna, Austria), and data visualizations were generated using the ggplot2 package.
A Random Forest algorithm was employed as a supplementary analytical approach to support the differentiation between renal tumor tissue and the contralateral normal renal cortex. Model performance was optimized using out-of-bag (OOB) error estimation in conjunction with 10-fold cross-validation. The number of variables randomly selected at each split (mtry) was set to 5. To mitigate overfitting, the minimum node size was set to 10, and the maximum number of terminal nodes was restricted to 5.
For model development, measurements obtained by the first observer were used as the training dataset, while those obtained by the second observer served as an independent test set. This approach allowed for an additional assessment of model robustness and reproducibility.
All statistical and machine learning analyses were performed using R software, and graphical visualizations were generated using the ggplot2 package.
4. Discussion
MRI is widely used for the diagnosis and staging of renal tumors. In addition to conventional sequences, advanced techniques such as T1, T2, T2* mapping, and diffusion-weighted imaging (DWI) contribute to tumor characterization. Although these techniques are more commonly applied in cardiac imaging, they have also been investigated in brain tumors, lymph nodes, and renal tumors [
10,
11]. However, studies evaluating T1 mapping, post-contrast T1, T2*, R2*, and ADC values in renal tumors remain limited [
10,
11,
12,
13,
14,
15,
16]. The present study integrates multiple quantitative MRI parameters, including native and post-contrast T1, T2* mapping, R2*, and ADC values, within a single analysis. In addition, measurements from the contralateral healthy renal cortex were used as an internal reference, which may enhance the clinical interpretability of quantitative imaging.
Regarding the measurement methodology, quantitative values were obtained from both tumor tissue and the contralateral renal cortex using standardized ROI placement. Interobserver agreement analysis showed strong correlations, particularly for post-contrast T1 values (R = 0.97), indicating good reproducibility. In contrast, ADC measurements in the healthy cortex demonstrated moderate agreement, likely due to the absence of a clearly defined target region and increased variability in ROI placement.
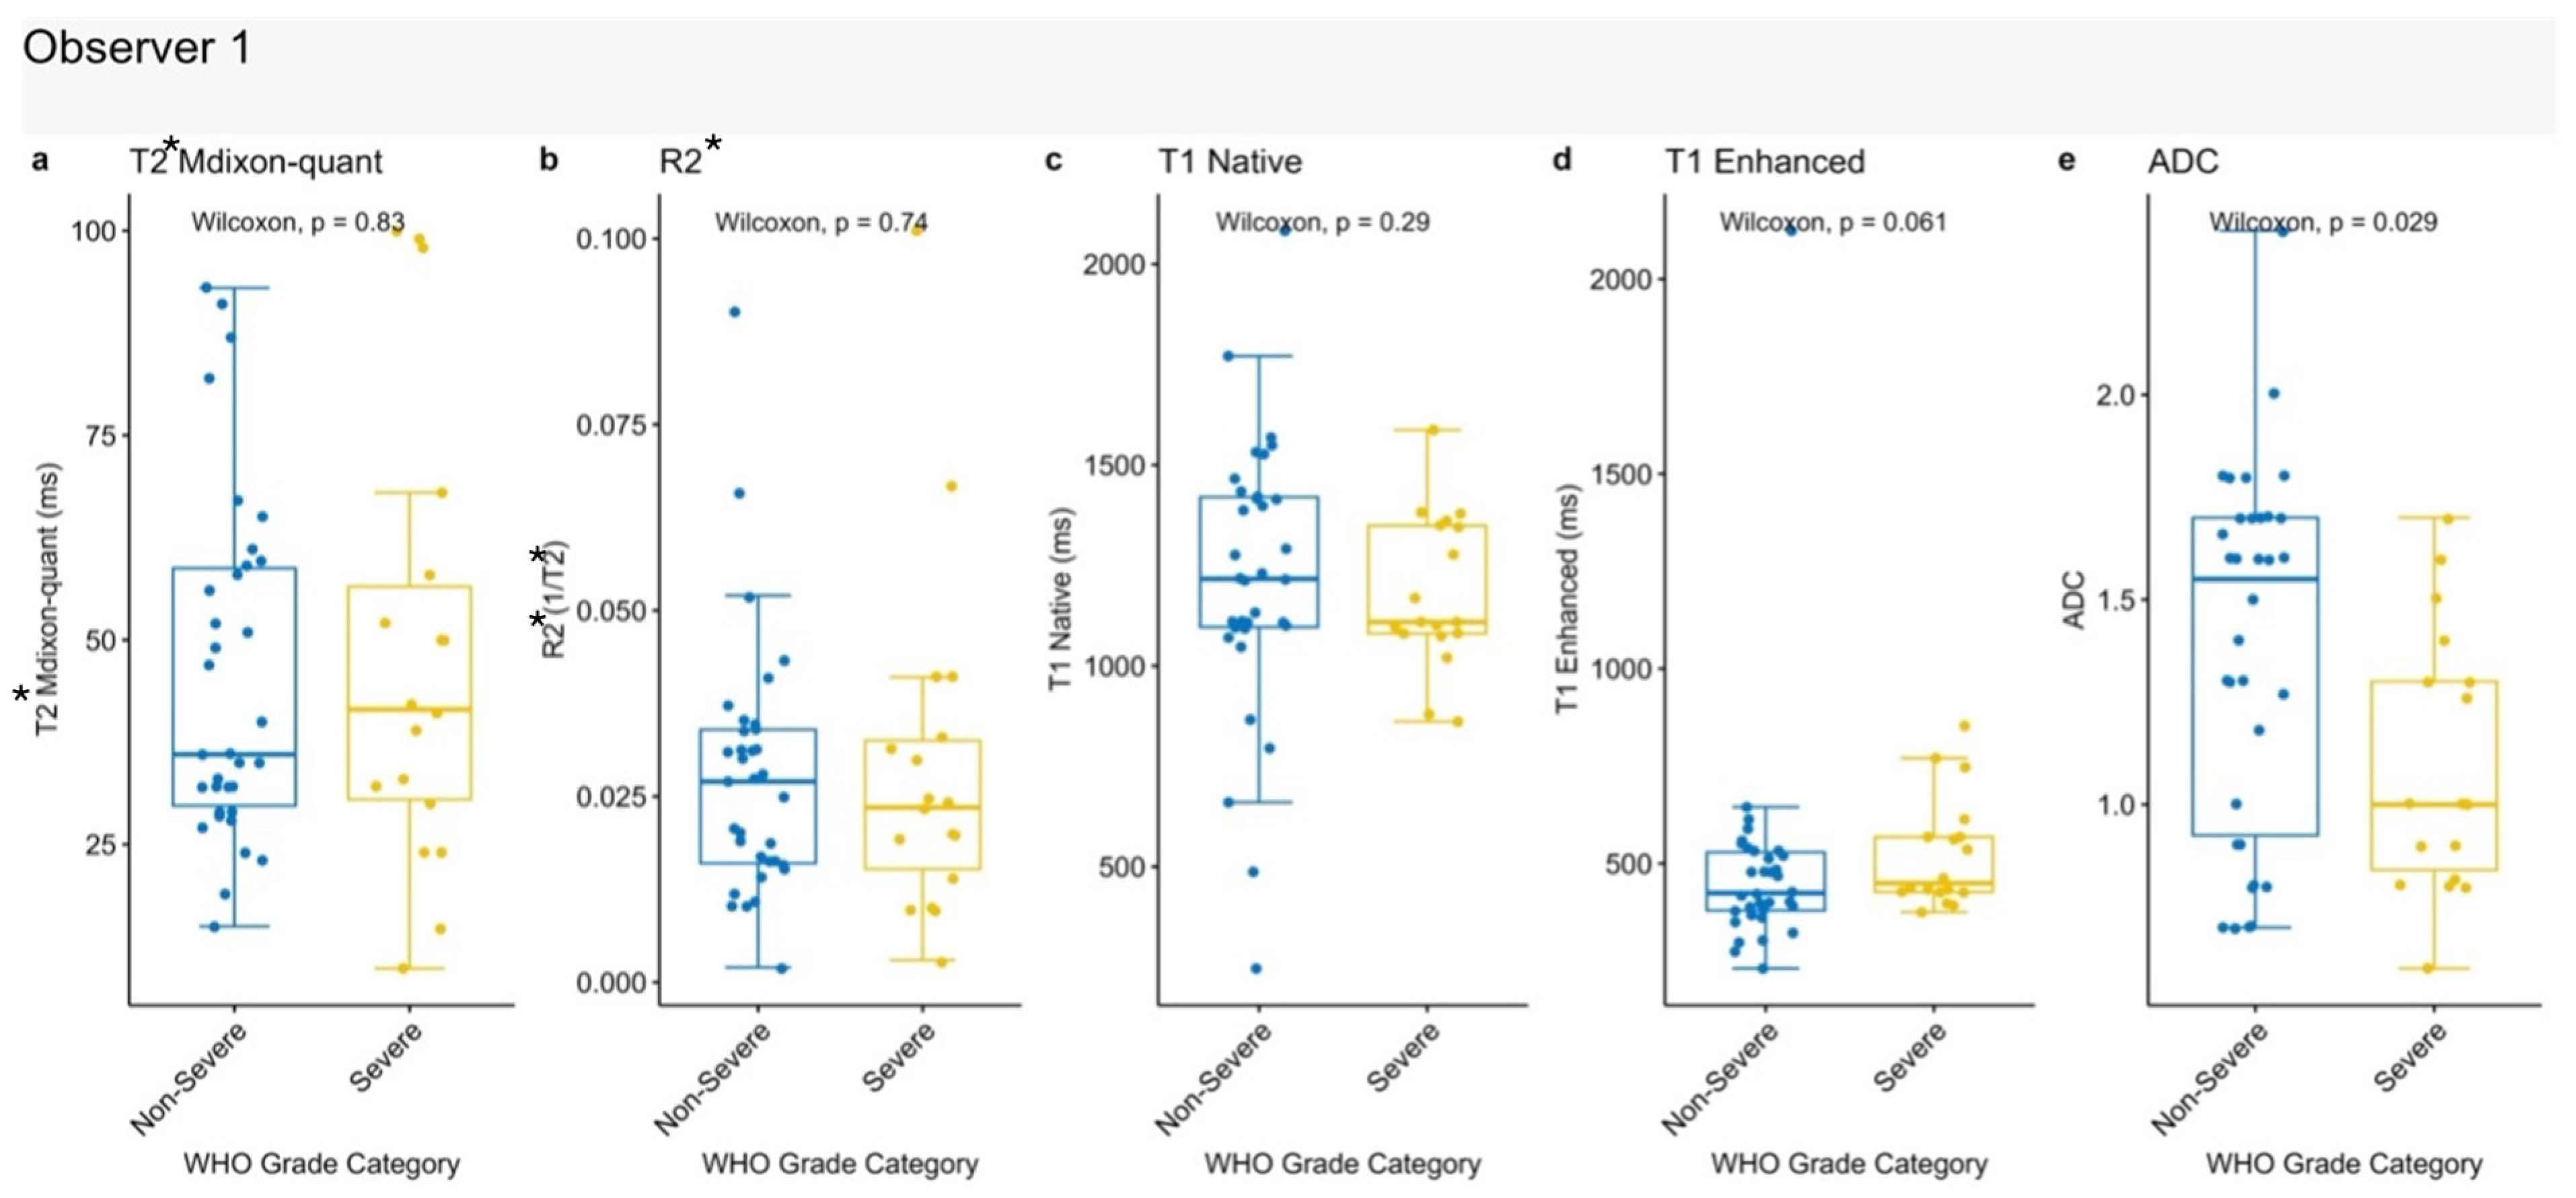
Among all parameters, ADC showed the most consistent association with tumor grade. In line with previous findings by Mytsyk et al., ADC values decreased with increasing tumor grade [
14]. Similarly, ADC values were significantly lower in high-grade tumors compared to low-grade tumors in our cohort. This finding may reflect increased cellularity and reduced extracellular space in higher-grade tumors, resulting in greater diffusion restriction.
Previous studies have also explored the relationship between MRI parameters and tumor grade. Adams et al. reported higher native T1 values in higher-grade tumors, attributed to increased collagen content [
11]. They also observed a trend toward larger tumor size in higher-grade tumors. In another study, T2 mapping values were found to be longer in low-grade tumors [
15]. In contrast, our study did not demonstrate statistically significant differences in native T1 or T2* values between different grade groups. These discrepancies may be related to differences in tumor composition, inclusion of multiple tumor subtypes, and methodological variations between studies.
Consistent with prior literature, tumor size was significantly associated with tumor grade in our cohort [
17]. However, with the increasing detection of incidental renal tumors, tumor size alone may not be a reliable indicator of tumor aggressiveness.
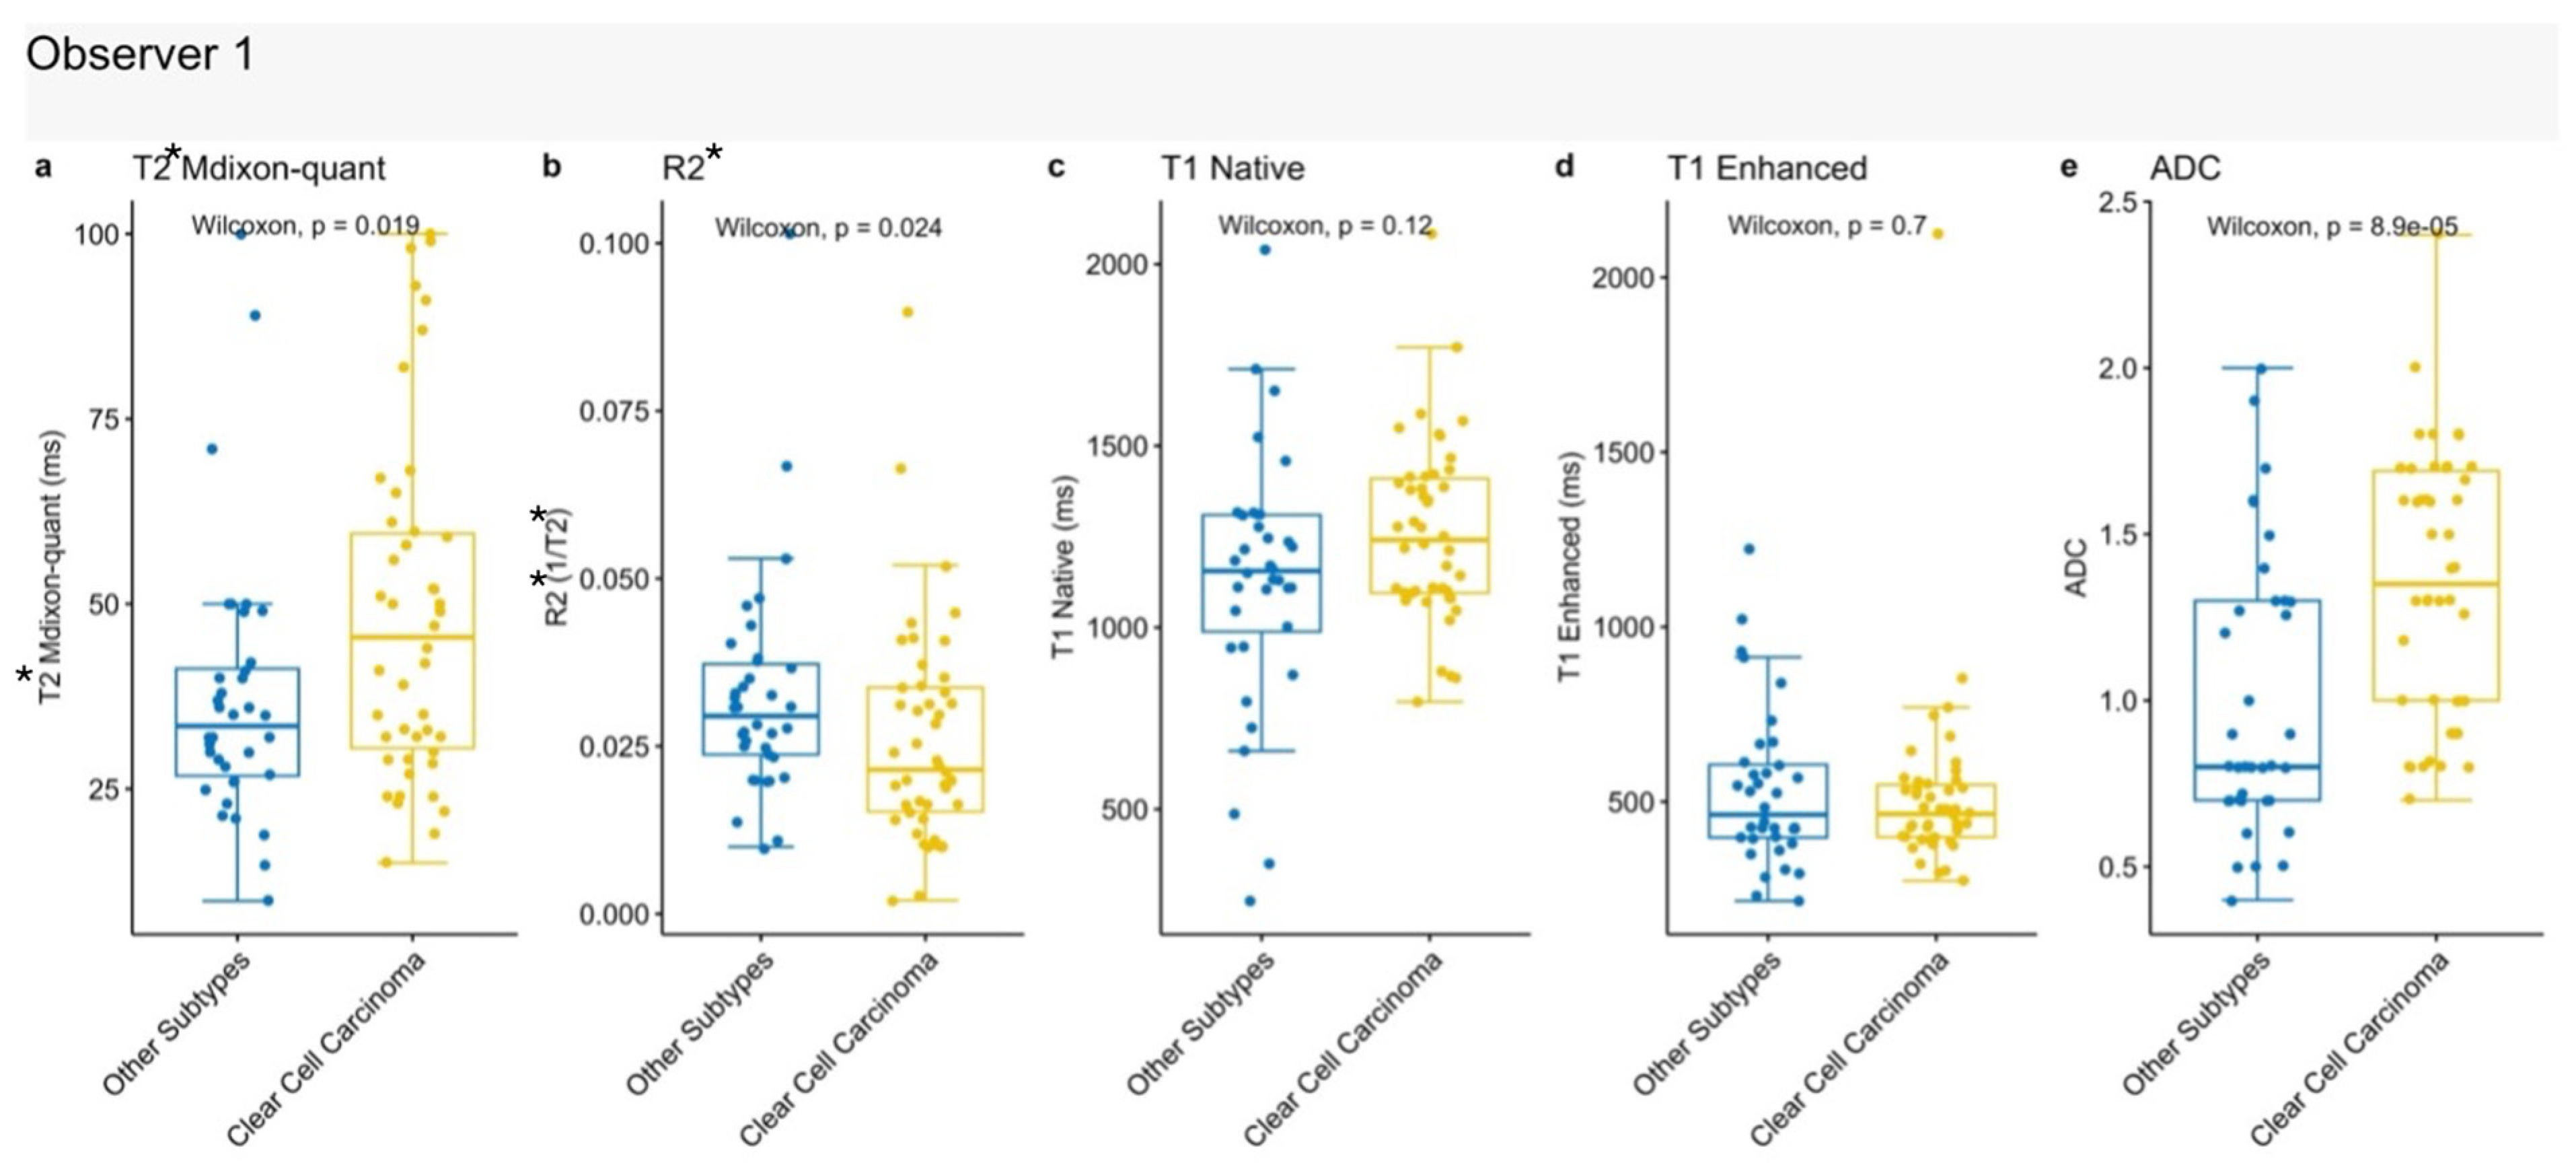
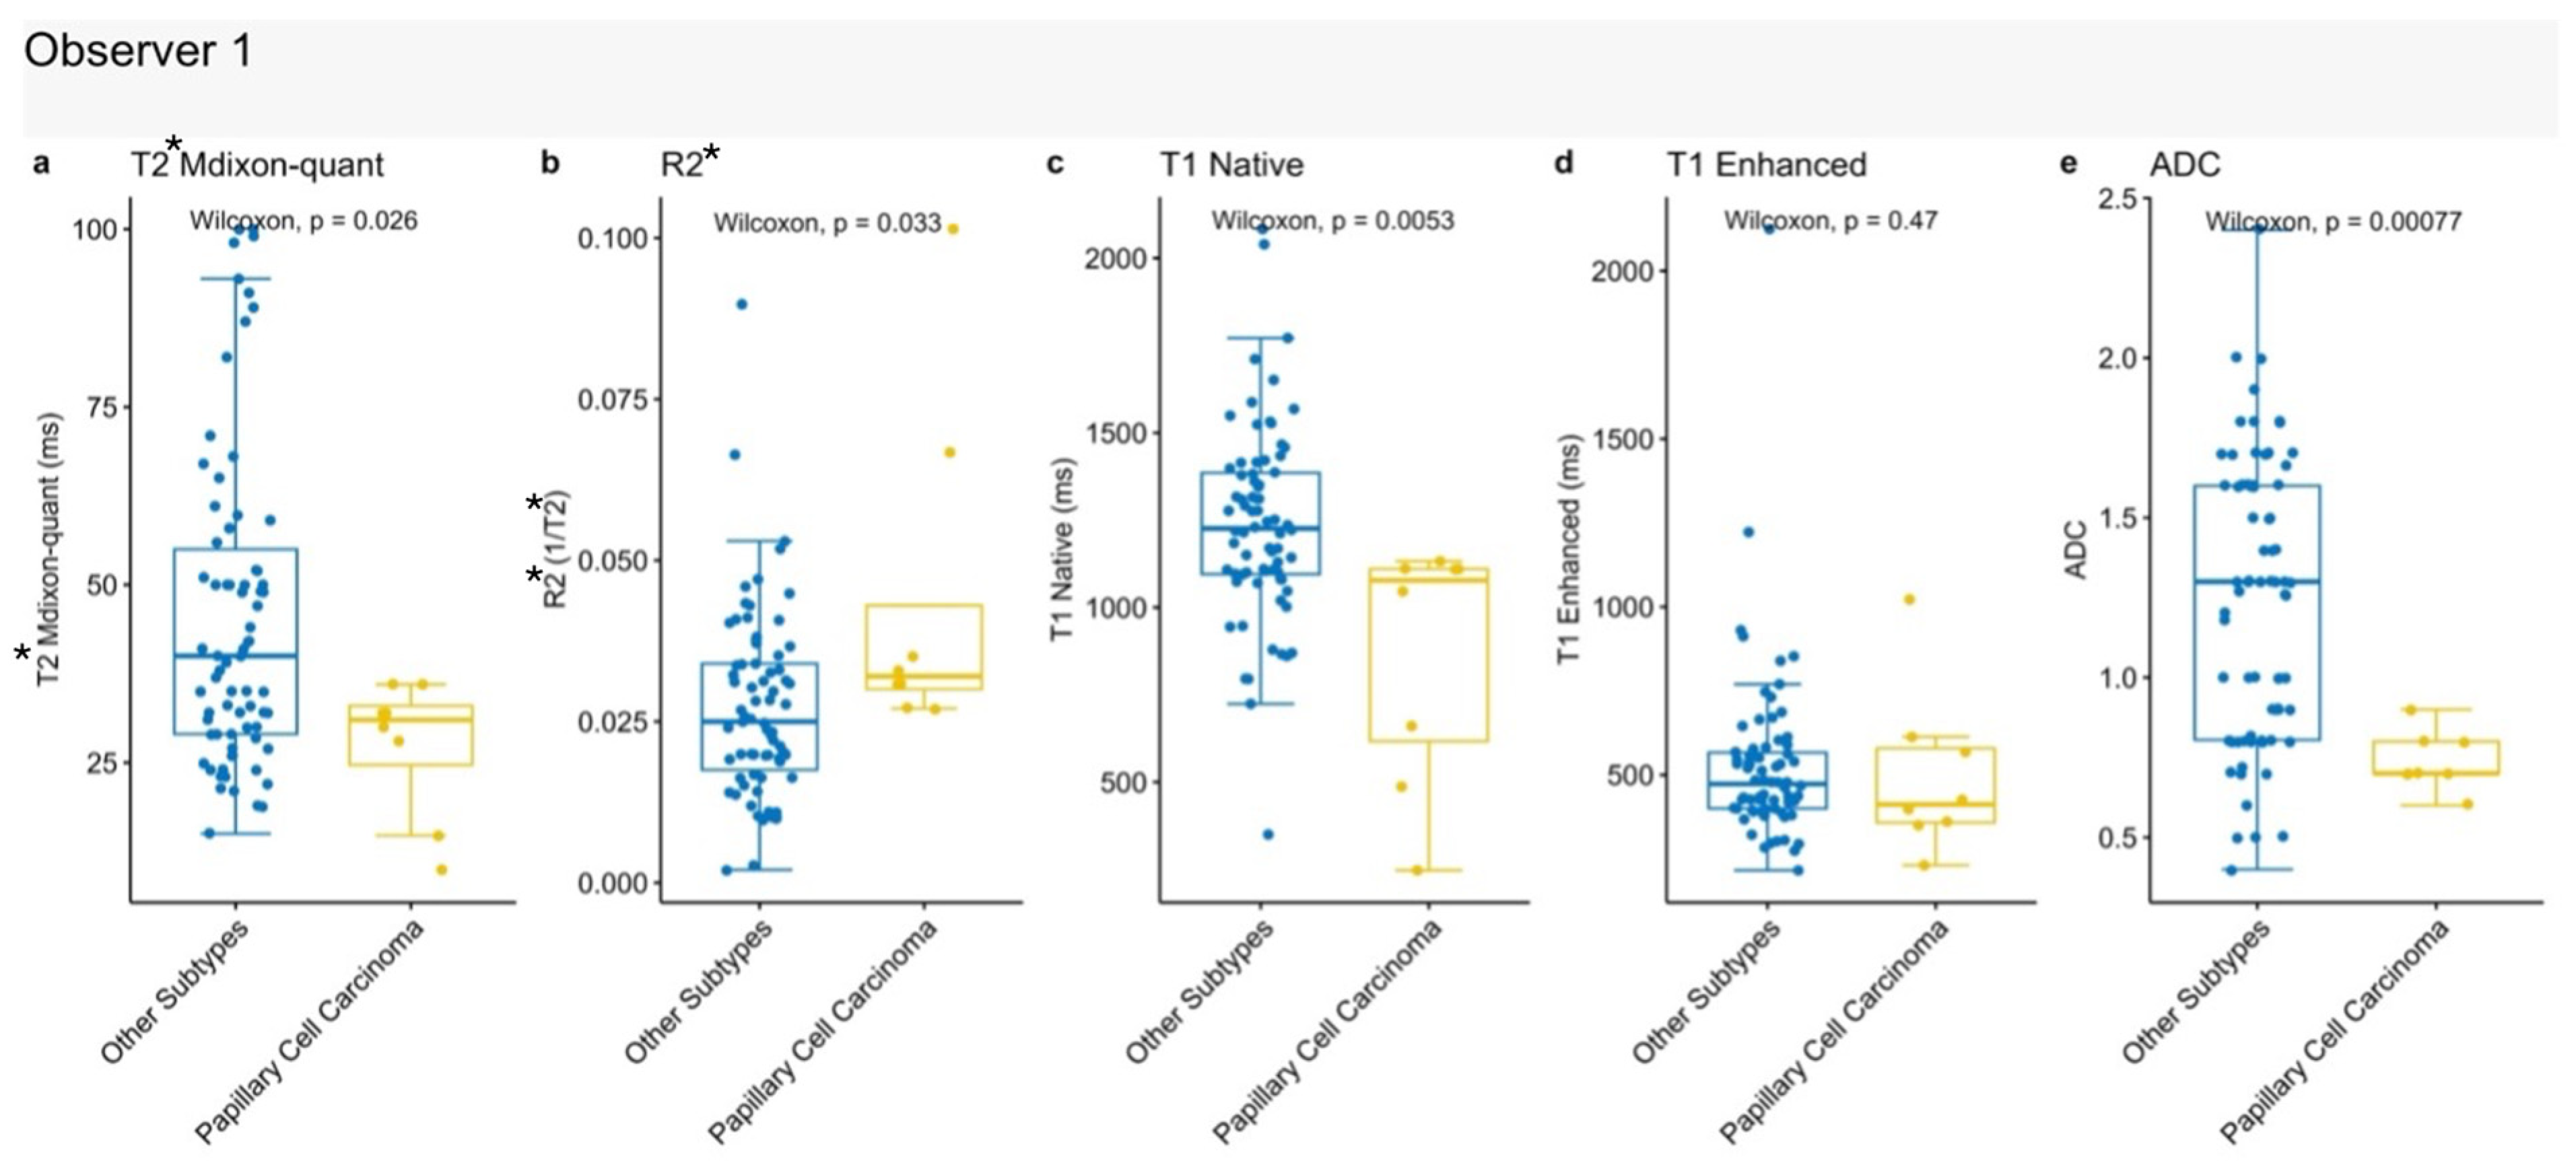
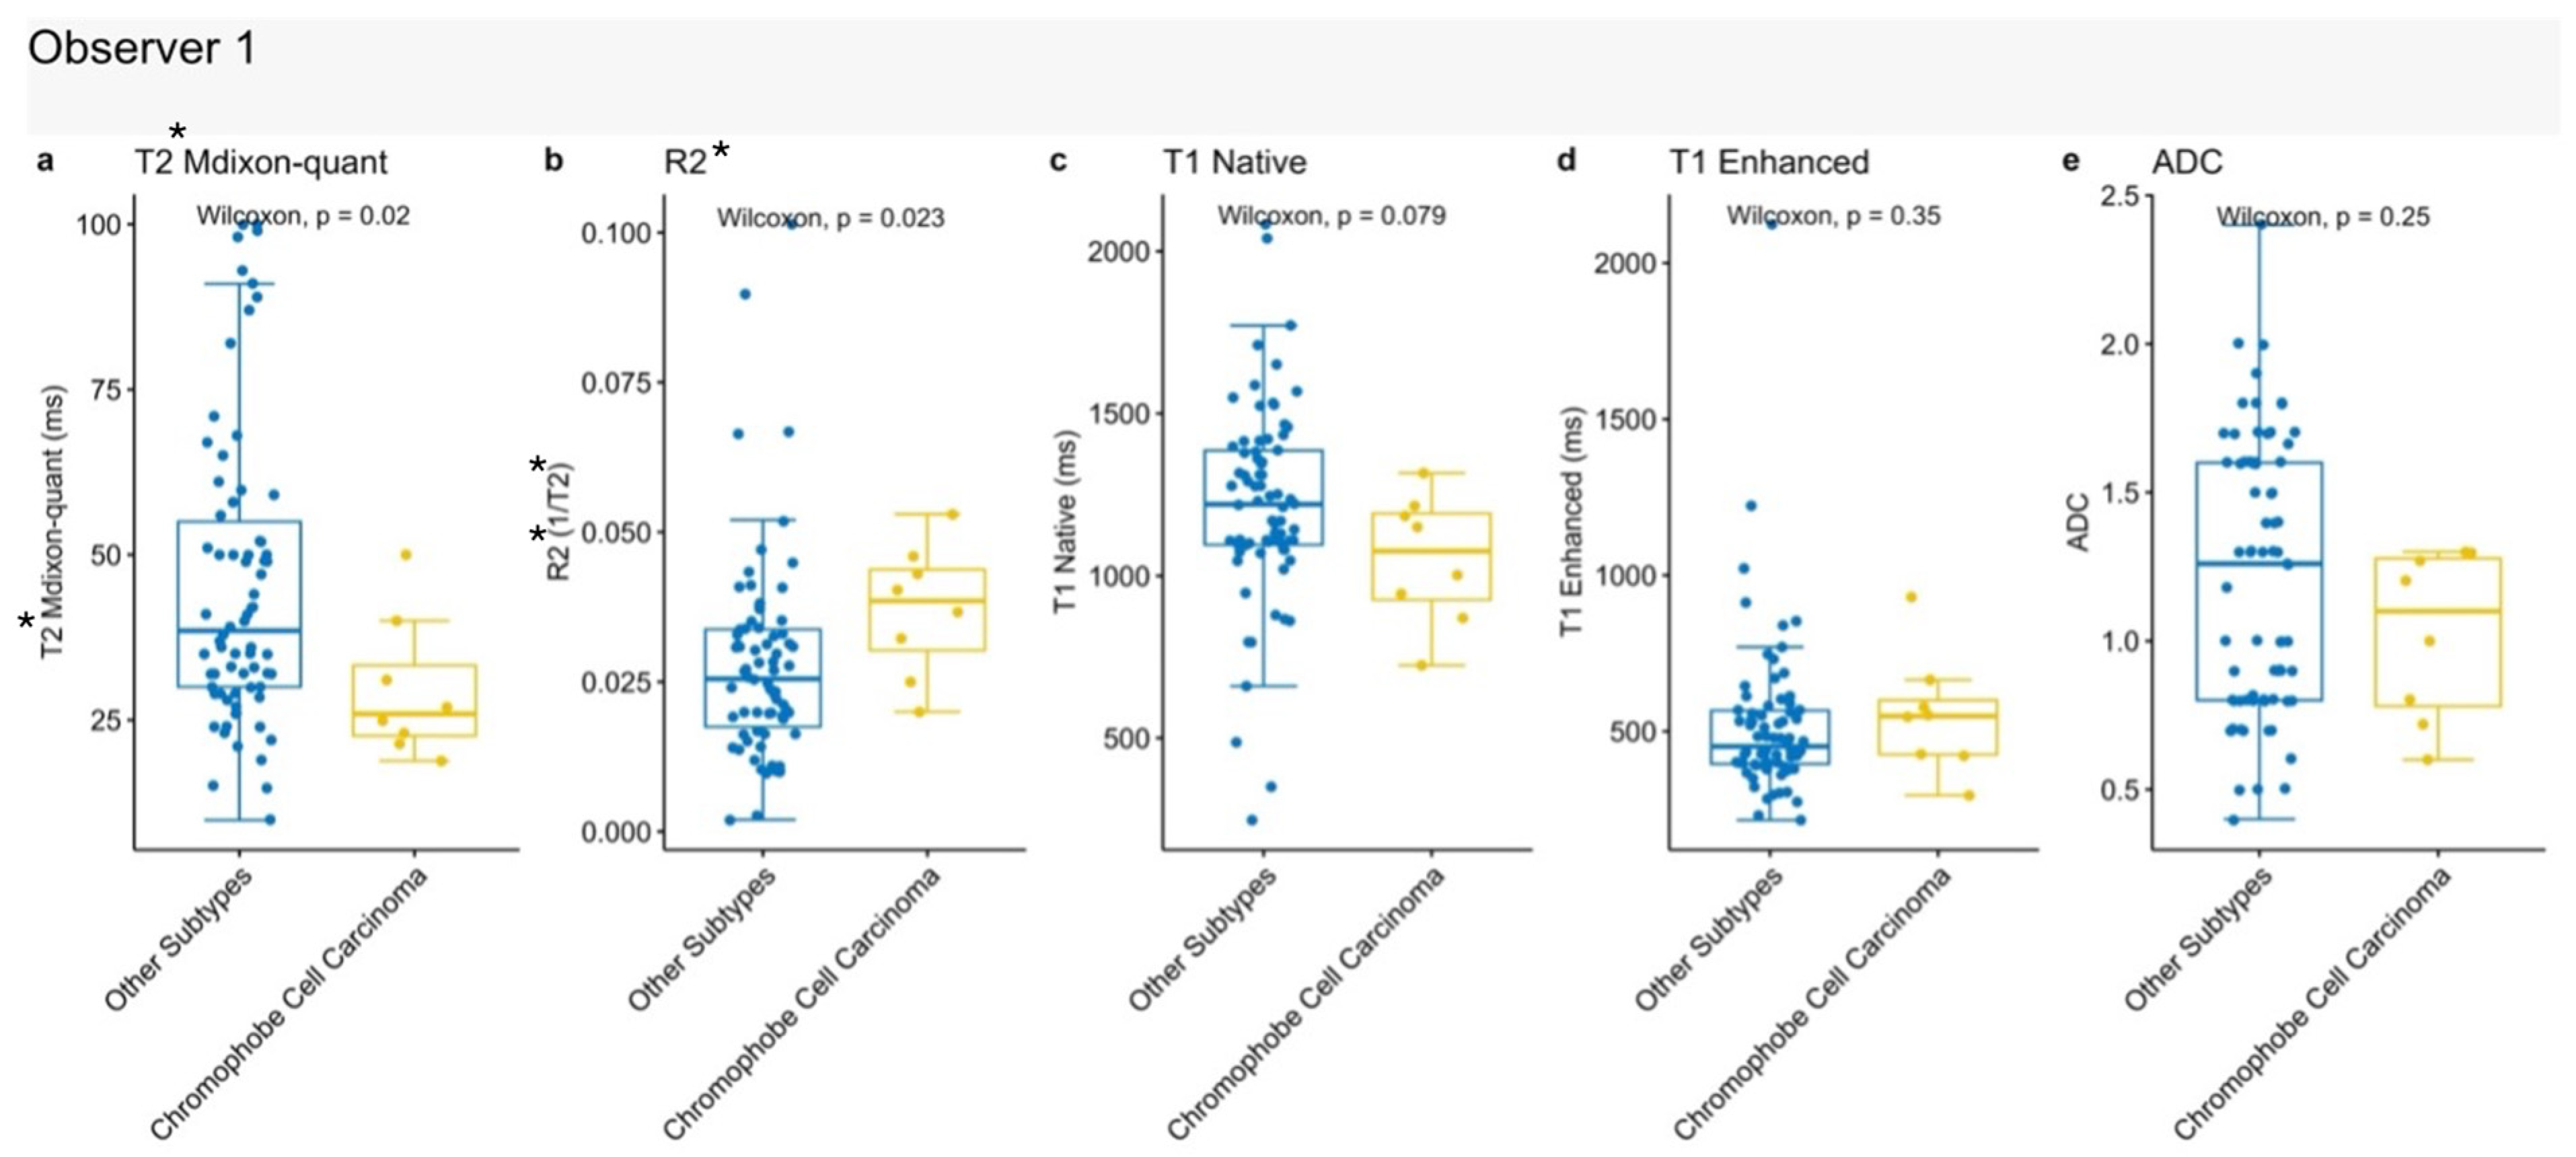
In subtype analysis, clear cell, papillary, and chromophobe renal cell carcinomas were the most common tumor types. Quantitative MRI parameters demonstrated significant differences between subtypes. Clear cell tumors showed higher T2* and ADC values and lower R2* values compared to other subtypes. Papillary tumors demonstrated lower T2* and ADC values and higher R2* values, consistent with previous reports showing lower T2 signal intensity in papillary tumors [
18]. Similarly, ADC values were significantly lower in papillary tumors, in agreement with the findings of Çolakoğlu et al. [
19]. Chromophobe tumors demonstrated distinct differences in T2* and R2* values, although comparable data in the literature remain limited.
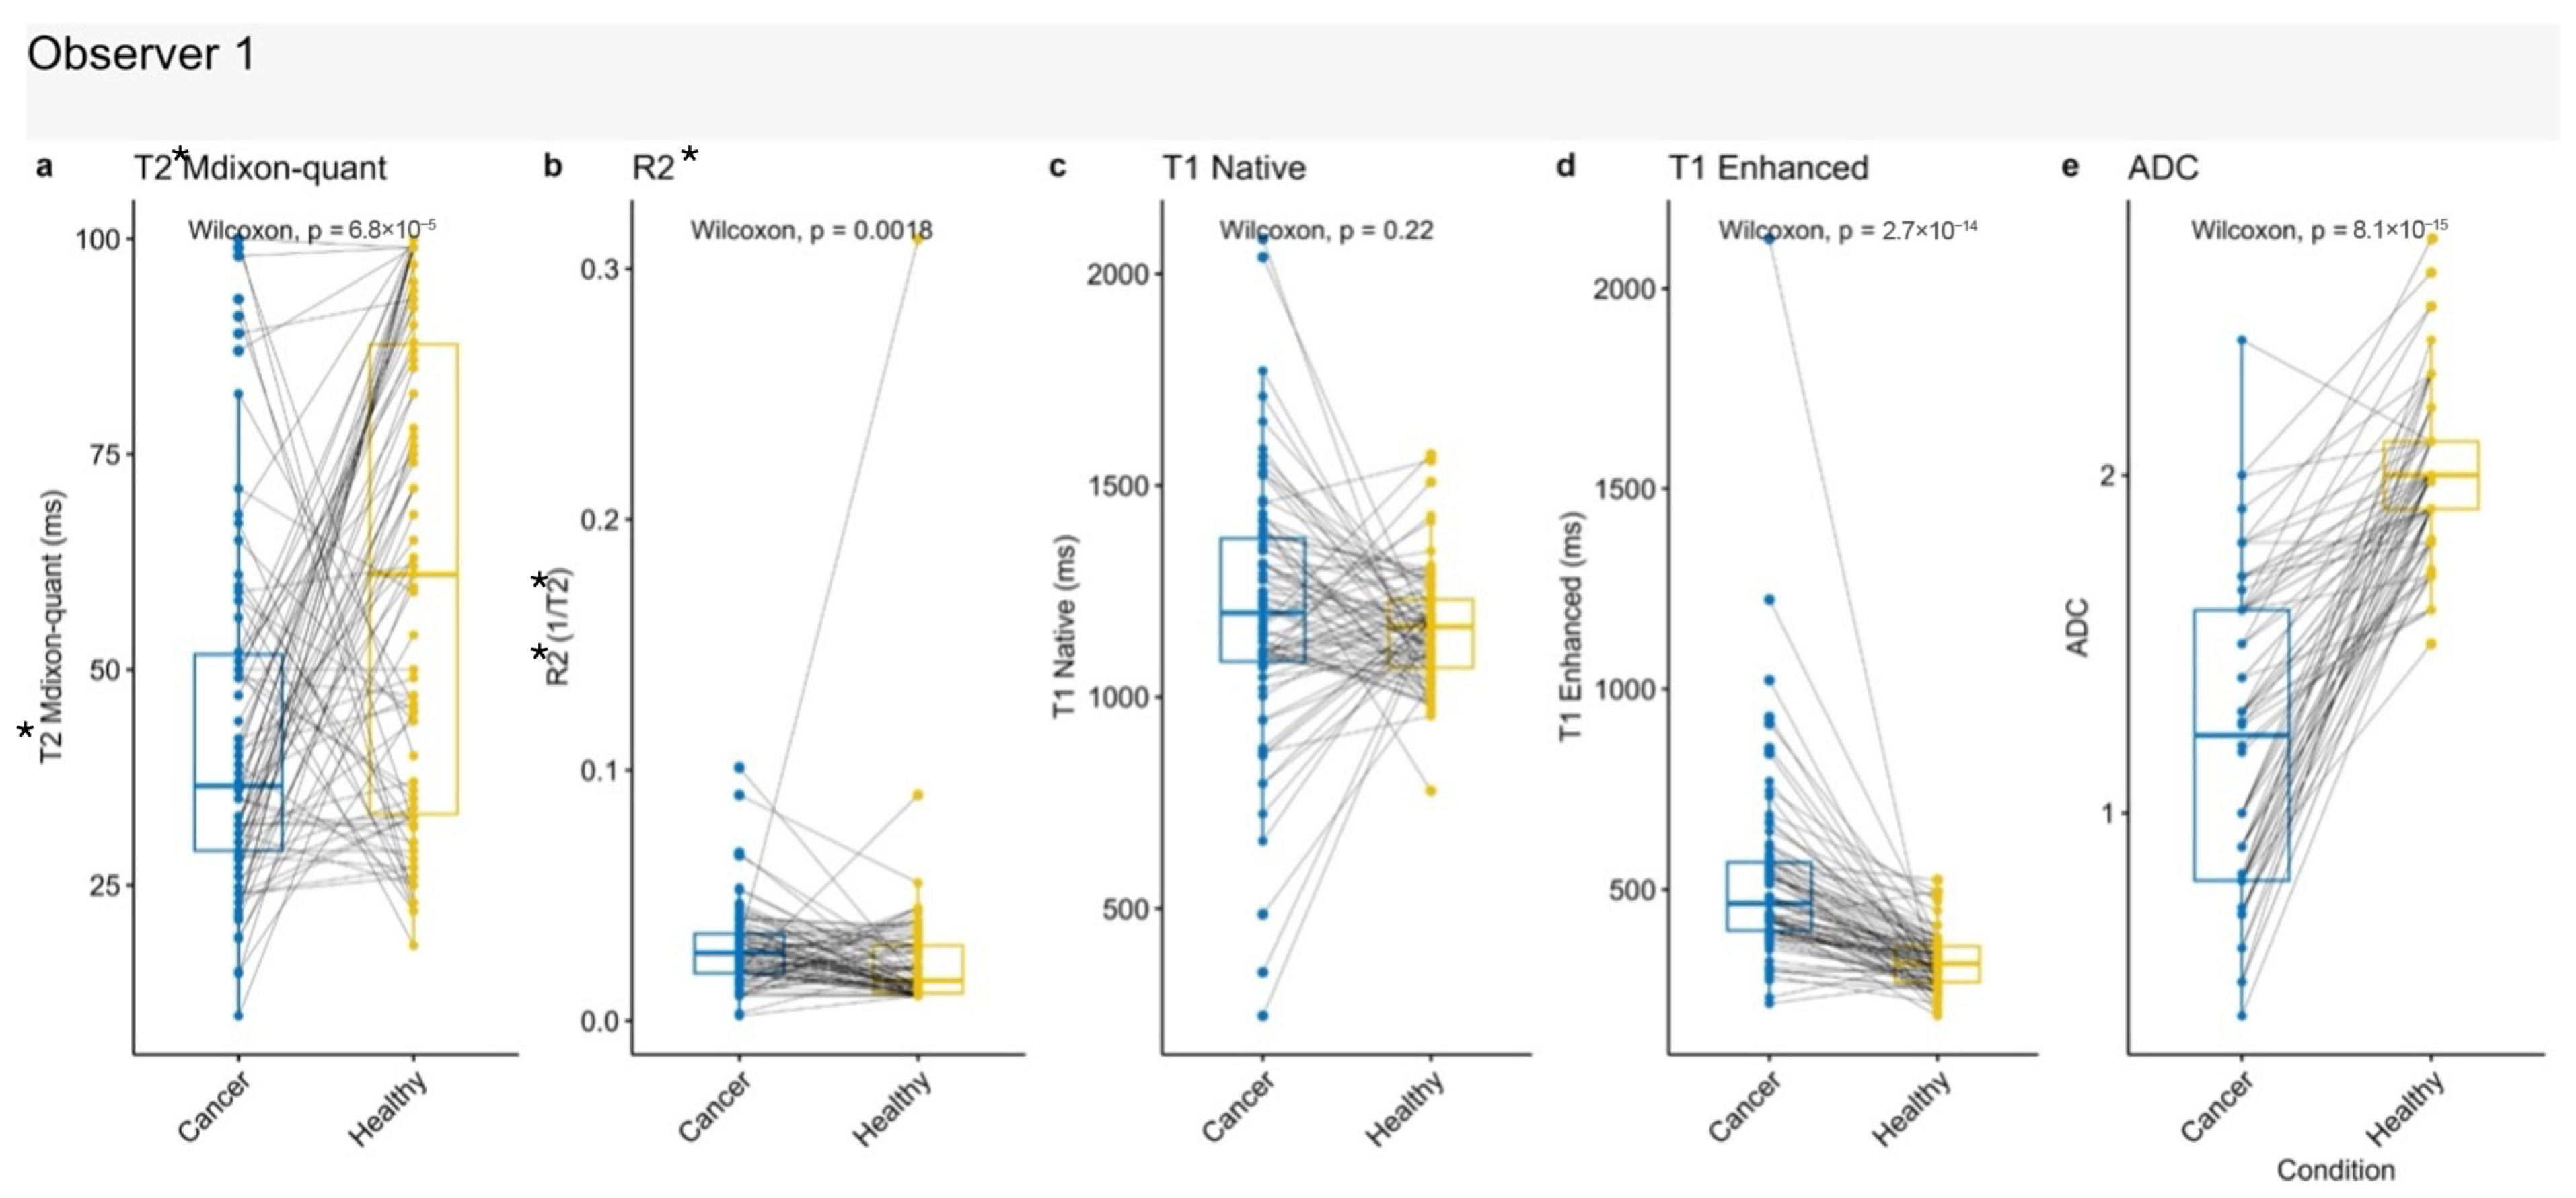
When comparing tumor tissue with the contralateral healthy renal cortex, all parameters except native T1 showed significant differences. These findings suggest that quantitative MRI parameters, particularly ADC, may provide useful non-invasive biomarkers for tumor detection [
6].
A Random Forest model was applied as a supplementary analytical tool, achieving an overall accuracy of 93.2% in differentiating tumor tissue from healthy cortex. However, potential overfitting cannot be excluded, as the training and test datasets were derived from the same patient cohort. In line with previous reviews, the application of artificial intelligence in radiology requires standardized datasets and robust validation for clinical implementation [
20].
This study has several limitations. First, the relatively small sample size and uneven distribution of tumor subtypes may limit generalizability. Second, the lack of prior studies using a similar multiparametric approach restricts direct comparison with existing literature. Third, the post-contrast T1 sequence was acquired in a single phase, which may have limited the evaluation of dynamic contrast behavior. Fourth, the uneven distribution of tumor subtypes, with relatively small numbers of papillary and chromophobe tumors, which may limit statistical power and generalizability. In addition, although statistically significant differences were identified, clinically applicable decision thresholds were not established. Threshold-based analyses (e.g., sensitivity and specificity using optimal cutoffs such as the Youden index) were not performed due to the limited sample size and class imbalance. Future studies with larger and more balanced cohorts are needed to enable reliable threshold determination and clinical implementation. Finally, ROI placement was performed manually, introducing potential observer variability compared to automated methods.
Despite these limitations, the findings suggest that multiparametric quantitative MRI, particularly ADC, may provide clinically meaningful information for renal tumor characterization. Further studies with larger cohorts and external validation are warranted.
5. Conclusions
Quantitative MRI plays an important role in the non-invasive evaluation of renal tumors, providing valuable information on tumor subtype and grade through parameters such as T1, T2*, R2*, and ADC.
In this study, ADC values showed a significant association with tumor grade and tumor size. Multiparametric analysis further demonstrated that T2*, R2*, and ADC values in clear cell tumors; T2*, R2*, native T1, and ADC values in papillary tumors; and T2* and R2* values in chromophobe tumors may contribute to subtype differentiation.
When tumor measurements were compared with the contralateral normal renal cortex, all parameters except native T1 demonstrated significant differences. These findings suggest that quantitative MRI parameters, particularly ADC, may serve as clinically meaningful non-invasive biomarkers for renal tumor characterization.
A Random Forest model demonstrated high accuracy in differentiating tumor tissue from healthy cortex; however, these results should be interpreted with caution, and further validation in larger and independent cohorts is required.
Overall, quantitative MRI shows promise as a non-invasive tool for renal tumor characterization. Its integration into clinical practice may support more individualized decision-making, although standardization of imaging protocols and validation in larger, more homogeneous populations remain necessary.



 ,
,