
Polygenic Risk Score Is Associated with Developing and Dying from Lung Cancer in the National Lung Screening Trial


Abstract
Highlights:
- In this proof-of-concept study, a lung cancer PRS helped predict who develops and dies of lung cancer (clinical validity).
- This was independent of the patient’s clinical risk variables (smoking, age and comorbidity), lung function, lung cancer characteristics (histology, stage and surgery), screening arm and family history.
- In a lung cancer screening trial, a PRS predicted lung cancer lethality/mortality and may represent a novel biomarker of lung cancer outcomes following screening.
Abstract
1. Introduction
2. Methods
2.1. Subjects
2.2. Lung Cancer Outcomes
2.3. Genotyping and Algorithms
2.4. Statistical Analysis
3. Results
4. Discussion
Supplementary Materials
Author Contributions
Funding
Institutional Review Board Statement
Informed Consent Statement
Data Availability Statement
Conflicts of Interest
References
- Brennan, P.; Hainaut, P.; Bofetta, P. Genetics of lung-cancer susceptibility. Lancet Oncol. 2011, 12, 399–408. [Google Scholar] [CrossRef]
- Tammemägi, M.C.; Katki, H.A.; Hocking, W.G.; Church, T.R.; Caporaso, N.; Kvale, P.A.; Chaturvedi, A.K.; Silvestri, G.A.; Riley, T.L.; Commins, J.; et al. Selection Criteria for Lung-Cancer Screening. N. Engl. J. Med. 2013, 368, 728–736. [Google Scholar] [CrossRef]
- ten Haaf, K.; Jeon, J.; Tammemagi, M.C.; Han, S.S.; Kong, C.Y.; Plevritis, S.K.; Feurer, E.J.; de Koning, H.J.; Steyerberg, E.W.; Meza, R. Risk prediction models for selection of lung cancer screening candidates: A retrospective validation study. PLoS Med. 2017, 14, e1002277. [Google Scholar] [CrossRef]
- El-Zein, R.A.; Young, R.P.; Hopkins, R.J.; Etzel, C.J. Genetic Predisposition to Chronic Obstructive Pulmonary Disease and/or Lung Cancer: Important Considerations When Evaluating Risk. Cancer Prev. Res. 2012, 5, 522–527. [Google Scholar] [CrossRef] [PubMed]
- Bosse, Y.; Amos, C.I. A decade of GWAS results in lung cancer. Cancer Epidemiol. Biomark. Prev. 2018, 27, 363–379. [Google Scholar] [CrossRef] [PubMed]
- Schulz, K.F.; Grimes, A.D. Case-control studies: Research in reverse. Lancet 2002, 359, 431–434. [Google Scholar] [CrossRef]
- Hu, Z.-H.; Connett, J.E.; Yuan, J.-M.; Anderson, K.E. Role of survivor bias in pancreatic cancer case-control studies. Ann. Epidemiol. 2016, 26, 50–56. [Google Scholar] [CrossRef] [PubMed]
- Hopkins, R.J.; Duan, F.; Gamble, G.D.; Chiles, C.; Cavadino, A.; Billings, P.; Aberle, D.; Young, R.P. Chr15q25 genetic variants (rs 16969968) independently confers risk of lung cancer, COPD and smoking intensity in a prospective study of high-risk smokers. Thorax 2021, 76, 272–280. [Google Scholar] [CrossRef]
- Young, R.P.; Hopkins, R.J.; Hay, B.A.; Epton, M.J.; Black, P.N.; Gamble, G.D. Lung cancer gene associated with COPD: Triple whammy or possible confounding effect? Eur. Respir. J. 2008, 32, 1158–1164. [Google Scholar] [CrossRef]
- Lambrechts, D.; Buysschaert, I.; Zanen, P.; Coolen, J.; Lays, N.; Cuppens, H.; Groen, H.J.M.; van Klaveren, R.J.; Vershakelen, J.; Dewever, W.; et al. The 15q24/25 susceptibility variant for lung cancer and chronic obstructive pulmonary disease is associated with emphysema. Am. J. Respir. Crit. Care Med. 2010, 181, 486–493. [Google Scholar] [CrossRef]
- Wauters, E.; Smeets, D.; Coolen, J.; Vershakelen, J.; Leyn, P.; Decramer, M.; Vansteenkiste, J.; Janssens, W.; Lambrechts, D. The TERT-CLPTM1L locus for lung cancer predisposes to bronchial obstruction and emphysema. Eur. Respir. J. 2011, 38, 924–931. [Google Scholar] [CrossRef]
- Gabrielsen, M.E.; Romundstad, P.; Langhammer, A.; Krokan, H.E.; Skorpen, F. Association between a 15q25 gene variant, nicotine-related habits, lung cancer and COPD among 56 307 individuals from the HUNT study in Norway. Eur. J. Hum. Genet. 2013, 21, 1293–1299. [Google Scholar] [CrossRef] [PubMed]
- Ziółkowska-Suchanek, I.; Mosor, M.; Gabryel, P.; Grabicki, M.; Żurawek, M.; Fichna, M.; Strauss, E.; Batura-Gabryel, H.; Dyszkiewicz, W.; Nowak, J. Susceptibility loci in lung cancer and COPD: Association of IREB2 and FAM13A with pulmonary diseases. Sci. Rep. 2015, 5, 13502. [Google Scholar] [CrossRef]
- Torkamani, A.; Wineinger, N.E.; Topol, E.J. The personal and clinical utility of polygenic risk scores. Nat. Rev. Genet. 2018, 19, 581–590. [Google Scholar] [CrossRef] [PubMed]
- Mavaddat, N.; Michailidou, K.; Dennis, J.; Fachal, L.; Lee, A.; Tyrer, J.P.; Chen, T.-H.; Wang, Q.; Bolla, M.K.; Yang, X.; et al. Polygenic Risk Scores for Prediction of Breast Cancer and Breast Cancer Subtypes. Am. J. Hum. Genet. 2019, 104, 21–34. [Google Scholar] [CrossRef] [PubMed]
- Seibert, T.M.; Fan, C.C.; Wang, Y.; Zuber, V.; Karunamuni, R.; Parsons, J.K.; Eeles, R.A.; Easton, D.F.; Kote-Jarai, Z.; Al Olama, A.A.; et al. Polygenic hazard score to guide screening for aggressive prostate cancer: Development and validation in large scale cohorts. BMJ 2018, 360, j5757. [Google Scholar] [CrossRef]
- Young, R.P.; Hopkins, R.J.; Whittington, C.F.; Hay, B.A.; Epton, M.J.; Gamble, G.D. Individual and Cumulative Effects of GWAS Susceptibility Loci in Lung Cancer: Associations after Sub-Phenotyping for COPD. PLoS ONE 2011, 6, e16476. [Google Scholar] [CrossRef]
- Weissfeld, J.L.; Lin, Y.; Lin, H.-M.; Kurland, B.F.; Wilson, D.O.; Fuhrman, C.R.; Pennathur, A.; Romkes, M.; Nukui, T.; Yuan, J.-M.; et al. Lung Cancer Risk Prediction Using Common SNPs Located in GWAS-Identified Susceptibility Regions. J. Thorac. Oncol. 2015, 10, 1538–1545. [Google Scholar] [CrossRef]
- Young, R.P.; Hopkins, R.J.; Hay, B.A.; Epton, M.J.; Mills, G.D.; Black, P.N.; Gardner, H.D.; Sullivan, R.; Gamble, G.D. Lung Cancer Susceptibility Model Based on Age, Family History and Genetic Variants. PLoS ONE 2009, 4, e5302. [Google Scholar] [CrossRef]
- Young, R.P.; Hopkins, R.J. Chronic obstructive pulmonary disease (COPD) and lung cancer screening. Transl. Lung Cancer Res. 2018, 7, 347–360. [Google Scholar] [CrossRef]
- Young, R.P.; Hopkins, R.J.; Duan, F.; Chiles, C.; Aberle, D.; Gamble, G.D. Genetic risk score from 12 SNP panel predicts lung cancer lethality in the National Lung Screening Trial (NLST)–A validation study in the NLST_ACRIN (N = 10,054). Am. J. Respir. Crit. Care Med. 2018, 197, A2475. [Google Scholar]
- National Lung Screening Trial Research Team; Aberle, D.R.; Adams, A.M.; Berg, C.D.; Black, W.C.; Clapp, J.D.; Fagerstrom, R.M.; Gareen, I.F.; Gatsonis, C.; Marcus, P.M.; et al. Reduced Lung-Cancer Mortality with Low-Dose Computed Tomographic Screening. N. Engl. J. Med. 2011, 365, 395–409. [Google Scholar] [CrossRef]
- Vickers, A.J.; Sud, A.; Bernstein, J.; Houlston, R. Polygenic risk scores to stratify cancer screening should predict mortality not incidence. npj Precis. Oncol. 2022, 6, 32. [Google Scholar] [CrossRef]
- Tammemägi, M.C. Selecting lung cancer screenees using risk prediction models—Where do we go from here. Transl. Lung Cancer Res. 2018, 7, 243–253. [Google Scholar] [CrossRef]
- Young, R.P.; Hopkins, R.J.; Duan, F.; Chiles, C.; Aberle, D.; Gamble, G.D. The relationship between lung cancer risk according to the PLCO2012 model and prevalence or presence of COPD in the NLST-ACRIN sub-study (N = 10,054). Am. J. Respir. Crit. Care Med. 2018, 197, A4411. [Google Scholar]
- Rivera, M.P.; Tanner, N.T.; Silvestri, G.A.; Detterbeck, F.C.; Tammemägi, M.C.; Young, R.P.; Slatore, C.G.; Caverly, T.J.; Boyd, C.M.; Braithwaite, D.; et al. Incorporating Coexisting Chronic Illness into Decisions about Patient Selection for Lung Cancer Screening. An Official American Thoracic Society Research Statement. Am. J. Respir. Crit. Care Med. 2018, 198, e3–e13. [Google Scholar] [CrossRef] [PubMed]
- Mazzone, P.J.; Sears, C.R.; Arenberg, D.A.; Gaga, M.; Gould, M.K.; Massion, P.P.; Nair, V.S.; Powell, C.A.; Silvestri, G.A.; Vachani, A.; et al. Evaluating molecular biomarkers for the early detection of lung cancer: When is a biomarker ready for clinical use? Am. J. Respir. Crit. Care Med. 2017, 196, e15–e29. [Google Scholar] [CrossRef]
- Chirieac, L.R.; Flieder, D.B. High-Resolution Computed Tomography Screening for Lung Cancer: Unexpected Findings and New Controversies Regarding Adenocarcinogenesis. Arch. Pathol. Lab. Med. 2010, 134, 41–48. [Google Scholar] [CrossRef]
- Lebrett, M.B.; Crosbie, E.J.; Smith, M.J.; Woodward, E.R.; Evans, D.G.; Crosbie, P.A.J. Targeting lung cancer screening to individuals at greatest risk: The role of genetic factors. J. Med. Genet. 2021, 58, 217–226. [Google Scholar] [CrossRef]
- Thorgeirsson, T.E.; Geller, F.; Sulem, P.; Rafnar, T.; Wiste, A.; Magnusson, K.P.; Manolescu, A.; Thorleifsson, G.; Stefansson, H.; Ingason, A.; et al. A variant associated with nicotine dependence, lung cancer and peripheral arterial disease. Nature 2008, 452, 638–642. [Google Scholar] [CrossRef]
- Hung, R.J.; McKay, J.D.; Gaborieau, V.; Boffetta, P.; Hashibe, M.; Zaridze, D.; Mukeria, A.; Szeszenia-Dabrowska, N.; Lissowska, J.; Rudnai, P.; et al. A susceptibility locus for lung cancer maps to nicotinic acetylcholine receptor subunit genes on 15q25. Nature 2008, 452, 633–637. [Google Scholar] [CrossRef] [PubMed]
- Amos, C.I.; Wu, X.; Broderick, P.; Gorlov, I.P.; Gu, J.; Eisen, T.; Dong, Q.; Zhang, Q.; Gu, X.; Vijayakrishnan, J.; et al. Genome-wide association scan of tag SNPs identifies a susceptibility locus for lung cancer at 15q25. 1. Nat. Genet. 2008, 40, 616–622. [Google Scholar] [CrossRef] [PubMed]
- Broderick, P.; Wang, Y.; Vijayakrishnan Matakidou, A.; Spitz, M.R.; Eisen, T.; Amos, C.I.; Houlston, R.S. Deciphering the impact of common genetic variation on lung cancer risk: A genome-wide association study. Cancer Res. 2009, 69, 6633–6641. [Google Scholar] [CrossRef] [PubMed]
- Wang, J.; Liu, Q.; Yuan, S.; Xie, W.; Liu, Y.; Xiang, Y.; Wu, N.; Wu, L.; Ma, X.; Cai, T.; et al. Genetic predisposition to lung cancer: Comprehensive literature integration, meta-analysis, and multiple evidence assessment of candidate-gene association studies. Sci. Rep. 2017, 7, 8371. [Google Scholar] [CrossRef]
- Timofeeva, M.N.; McKay, J.D.; Smith, G.D.; Johansson, M.; Byrnes, G.B.; Chabrier, A.; Relton, C.; Ueland, P.M.; Vollset, S.E.; Midttun, O.; et al. Genetic polymorphisms in 15q and 19q13 loci, cotinine levels and risk of lung cancer in EPIC. Cancer Epidemiol. Biomark. Prev. 2011, 20, 2250–2261. [Google Scholar] [CrossRef]
- Pillai, S.G.; Ge, D.; Zhu, G.; Kong, X.; Shianna, K.V.; Need, A.C.; Feng, S.; Hersh, C.P.; Bakke, P.; Gulsvik, A.; et al. A Genome-Wide Association Study in Chronic Obstructive Pulmonary Disease (COPD): Identification of Two Major Susceptibility Loci. PLOS Genet. 2009, 5, e1000421. [Google Scholar] [CrossRef]
- Hancock, D.B.; Eijgelsheim, M.; Wilk, J.B.; Gharib, S.A.; Loehr, L.R.; Marciante, K.D.; Franceschini, N.; van Durme, Y.M.T.A.; Chen, T.-H.; Barr, R.G.; et al. Meta-analyses of genome-wide association studies identify multiple loci associated with pulmonary function. Nat. Genet. 2010, 42, 45–52. [Google Scholar] [CrossRef]
- Ragland, M.F.; Benway, C.J.; Lutz, S.M.; Bowler, R.P.; Hecker, J.; Hokanson, J.E.; Crapo, J.D.; Castaldi, P.J.; DeMeo, D.L.; Hersh, C.P.; et al. Genetic advances in chronic obstructive pulmonary disease: Insights from COPD Gene. Am. J. Respir. Crit. Care Med. 2019, 6, 677–690. [Google Scholar] [CrossRef]
- Bierut, L.J. Nicotine dependence and genetic variation in the nicotinic receptors. Drug Alcohol. Depend. 2009, 104, S64–S69. [Google Scholar] [CrossRef]
- Janes, A.C.; Smoller, J.W.; David, S.P.; Frederick, B.D.; Haddad, S.; Basu, A.; Fava, M.; Evins, A.E.; Kaufman, M.J. Association between CHRNA5 genetic variation at rs16969968 and brain reactivity to smoking images in nicotine dependent women. Drug Alcohol. Depend. 2012, 120, 7–13. [Google Scholar] [CrossRef]
- Wang, J.; Spitz, M.R.; Amos, C.I.; Wu, X.; Wetter, D.W.; Cinciripini, P.M.; Shete, S. Mediating effects of smoking and COPD on the relationship between CHRNA5-A3 genetic locus and lung cancer risk. Cancer 2010, 116, 3458–3462. [Google Scholar] [PubMed]
- Kaur-Knudsen, D.; Nordestgaard, B.G.; Bojesen, S.E. CHRNA3genotype, nicotine dependence, lung function and disease in the general population. Eur. Respir. J. 2012, 40, 1538–1544. [Google Scholar] [CrossRef] [PubMed]
- Chong, I.-W.; Chang, M.-Y.; Chang, H.-C.; Yu, Y.-P.; Sheu, C.-C.; Tsai, J.-R.; Hung, J.-Y.; Chou, S.-H.; Tsai, M.-S.; Hwang, J.-J.; et al. Great potential of a panel of multiple hMTH1, SPD, ITGA11, and COL11A1 markers for the diagnosis of patients with non-small cell lung cancer. Oncol. Rep. 2006, 16, 981–988. [Google Scholar] [CrossRef]
- Zhu, C.Q.; Popova, S.N.; Brown, E.R.S.; Barsyte-Lovejoy, D.; Navab, R.; Shih, W.; Li, M.; Lu, M.; Jurisica, I.; Penn, L.Z.; et al. Integrin alpha11 regulates IGF2 expression in fibroblasts to enhance tumorigenicity of human non-small-cell lung cancer cells. Proc. Natl. Acad. Sci. USA 2007, 104, 11754–11759. [Google Scholar] [CrossRef]
- Sakiyama, T.; Kohna, T.; Mimaki, S.; Ohta, T.; Yanagitani, N.; Sobue, T.; Kunitoh, H.; Saito, R.; Shimizu, K.; Hirama, C.; et al. Association of amino acid substitution polymorphisms in DNA repair genes TP53, POLI, REV1, and LIG4 with lung cancer. Int. J. Cancer 2005, 114, 730–737. [Google Scholar] [CrossRef] [PubMed]
- Zhang, X.; Miao, X.; Sun, T.; Tan, W.; Qu, S.; Xiong, P.; Zhou, Y.; Lin, D. Functional polymorphisms in cell death pathway genes FAS and FASL contribute to risk of lung cancer. J. Med. Genet. 2005, 42, 479–484. [Google Scholar] [CrossRef]
- Zhang, Z.; Qiu, L.; Wang, M.; Tong, N.; Li, J.; Zhang, Z. The Fas ligand promoter polymorphisms, rs763110 (-844C<T) contributes to cancer susceptibility: Evidence from 19 case-control studies. Eur. J. Hum. Genet. 2009, 17, 1294–1303. [Google Scholar] [PubMed]
- Rudd, M.F.; Webb El Matakidou, A.; Sellick, G.S.; Williams, R.D.; Bridle, H.; Eisen, T.; Houlston, R.S. Variants in the GH-IGF axis confer susceptibility to the lung cancer. Genome Res. 2007, 16, 693–701. [Google Scholar] [CrossRef]
- Landi, M.T.; Chatterjee, N.; Yu, K.; Goldin, L.R.; Goldstein, A.M.; Rotunno, M.; Mirabello, L.; Jacobs, K.; Wheeler, W.; Yeager, M.; et al. A Genome-wide Association Study of Lung Cancer Identifies a Region of Chromosome 5p15 Associated with Risk for Adenocarcinoma. Am. J. Hum. Genet. 2009, 85, 679–691. [Google Scholar] [CrossRef]
- Tu, H.; Heymach, J.V.; Wen, C.-P.; Ye, Y.; Pierzynski, J.A.; Roth, J.A.; Wu, X. Different dietary patterns and reduction of lung cancer risk: A large case-control study in the U.S. Sci. Rep. 2016, 6, 26760. [Google Scholar] [CrossRef]
- Wain, L.V.; Shrine, N.; Artigas, M.S.; Erzurumluoglu, A.M.; Noyvert, B.; Bossini-Castillo, L.; Obeidat, M.E.; Henry, A.P.; Portelli, M.A.; Hall, R.J.; et al. Genome-wide association analyses for lung function and chronic obstructive pulmonary disease identify new loci and potential druggable targets. Nat. Genet. 2017, 49, 416–425. [Google Scholar] [CrossRef] [PubMed]
- DeMeo, D.L.; Mariani, T.; Bhattacharya, S.; Srisuma, S.; Lange, C.; Litonjua, A.; Bueno, R.; Pillai, S.G.; Lomas, D.A.; Sparrow, D.; et al. Integration of Genomic and Genetic Approaches Implicates IREB2 as a COPD Susceptibility Gene. Am. J. Human. Genet. 2009, 85, 493–502. [Google Scholar] [CrossRef] [PubMed]
- Serveaux-Dancer, M.; Jabaudon, M.; Creveaux, I.; Belville, C.; Blondonnet, R.; Gross, C.; Constantin, J.-M.; Blanchon, L.; Sapin, V. Pathological Implications of Receptor for Advanced Glycation End-Product (AGER) Gene Polymorphism. Dis. Markers 2019, 2019, 2067353. [Google Scholar] [CrossRef] [PubMed]
- Yin, N.; Lang, X.; Wang, X.; Liu, W. AGER genetic polymorphisms increase risks of breast and lung cancers. Genet. Mol. Res. 2015, 14, 17776–17787. [Google Scholar] [CrossRef]
- Zhao, D.-C.; Lu, H.-W.; Huang, Z.-H. Association between the receptor for advanced glycation end products gene polymorphisms and cancer risk: A systematic review and meta-analysis. JBUON 2015, 20, 614–624. [Google Scholar]
- Yamaguchi, K.; Iwamoto, H.; Sakamoto, S.; Horimasu, Y.; Masuda, T.; Miyamoto, S.; Nakashima, T.; Ohshimo, S.; Fujitaka, K.; Hamada, H.; et al. AGER rs2070600 polymorphism elevates neutrophil lymphocyte ratio and mortality in metastatic lung adenocarcinoma. Oncotarget 2017, 8, 94382–94392. [Google Scholar] [CrossRef]
- Oczypok, E.A.; Perkins, T.N.; Oury, T.D. All the “RAGE” in lung disease: The receptor for advanced glycation end products (RAGE) is a major mediator of pulmonary inflammatory responses. Paediatr. Respir. Rev. 2017, 23, 40–49. [Google Scholar] [CrossRef]
- Huang, Q.; Mi, J.; Wang, X.; Liu, F.; Wang, D.; Yan, D.; Wang, B.; Zhang, S.; Tian, G. Genetically lowered concentrations of circulating sRAGE might cause an increased risk of cancer: Meta-analysis using Mendelian randomization. J. Int. Med. Res. 2016, 44, 179–191. [Google Scholar] [CrossRef] [PubMed]
- Cheng, D.T.; Kim, D.K.; Cockayne, D.A.; Belousov, A.; Bitter, H.; Cho, M.H.; Duvoix, A.; Edwards, L.D.; Lomas, D.A.; Miller, B.E.; et al. Systemic Soluble Receptor for Advanced Glycation Endproducts Is a Biomarker of Emphysema and Associated with AGER Genetic Variants in Patients with Chronic Obstructive Pulmonary Disease. Am. J. Respir. Crit. Care Med. 2013, 188, 948–957. [Google Scholar] [CrossRef]
- Trendowski, M.R.; Lusk, C.M.; Wenzlaff, A.S.; Neslund-Dudas, C.; Gadgeel, S.M.; Soubani, A.O.; Schwartz, A.G. Assessing a Polygenic Risk Score for Lung Cancer Susceptibility in Non-Hispanic White and Black Populations. Cancer Epidemiol. Biomark. Prev. 2023, 32, 1558–1563. [Google Scholar] [CrossRef]
- Gorman, B.R.; Ji, S.-G.; Francis, M.; Sendamarai, A.K.; Shi, Y.; Devineni, P.; Saxena, U.; Partan, E.; DeVito, A.K.; Byun, J.; et al. Multi-ancestry GWAS meta-analyses of lung cancer reveal susceptibility loci and elucidate smoking-independent genetic risk. Nat. Commun. 2024, 15, 8629. [Google Scholar] [CrossRef] [PubMed]
- Boumtje, V.; Manikpurage, H.D.; Li, Z.; Gaudreault, N.; Armero, V.S.; Boudreau, D.K.; Renaut, S.; Henry, C.; Racine, C.; Eslami, A.; et al. Polygenic inheritance and its interplay with smoking history in predicting lung cancer diagnosis: A French-Canadian case-control cohort. EBioMedicine 2024, 106, 105234. [Google Scholar] [CrossRef] [PubMed]

| Polygenic Risk Score Groups (Absolute Score Range) | Low Score (−4 to −1) | Neutral Score 0 | High Score (1 to 6) | p Value |
|---|---|---|---|---|
| N = 9191 (% total) NHW | 2813 (30.6%) | 2504 (27.2%) | 3874 (42.1%) | |
| Demographics | ||||
| Age—mean (SD) | 61.7 (5.2) | 61.9 (5.1) | 61.8 (5.1) | 0.40 |
| Sex—% male | 1608 (57.2%) | 1428 (57.0%) | 2190 (56.5%) | 0.86 |
| Smoking status—current smoker | 1374 (48.8%) | 1161 (46.4%) | 1882 (48.6%) | 0.14 |
| Pack-years—mean (SD) | 55.2 (22.7) | 55.7 (23.2) | 57.1 (23.7) | 0.0021 |
| Cigarettes/day—mean (SD) | 27.7 (10.8) | 28.0 (10.9) | 28.7 (11.3) | 0.0002 |
| Years quit mean (SD) | 3.6 (5.0) | 3.8 (5.1) | 3.8 (5.1) | 0.40 |
| Smoking duration years mean (SD) | 40.3 (7.1) | 40.4 (7.5) | 40.3 (7.6) | 0.93 |
| Family history of lung cancer—yes (%) | 671 (23.9%) | 607 (24.2%) | 912 (23.5%) | 0.81 |
| Self-reported Hx of COPD (%) ‡ | 561 (19.9%) | 508 (20.3%) | 819 (21.1%) | 0.46 |
| BMI mean (SD) | 27.8 (5.0) | 27.9 (5.2) | 27.9 (5.1) | 0.87 |
| Education Level—N (%) | ||||
| -High school or less | 809 (28.8%) | 677 (27.0%) | 1138 (29.4%) | |
| -Post high School/some college | 995 (35.4%) | 912 (36.4%) | 1359 (35.1%) | |
| -College graduate | 508 (18.1%) | 403 (16.1%) | 661 (17.1%) | 0.05 |
| -Postgraduate/professional | 423 (15.0%) | 453 (18.1%) | 617 (15.9%) | |
| -Other/unknown | 78 (2.8%) | 59 (2.4%) | 99 (2.6%) | |
| Lung Function | ||||
| FEV1/FVC—mean (SD) | 71.4 (10.7) | 70.93 (10.9) | 70.8 (10.6) | 0.057 |
| FEV1% predicted—mean (SD) | 81.9 (19.4) | 81.4 (20.5) | 80.9 (20.2) | 0.15 |
| Total COPD GOLD 1–4 | 925 (32.9%) | 895 (35.7%) | 1394 (36.0%) | 0.02 |
| Pre-morbid conditions (self-report) | ||||
| COPD | 182 (6.5%) | 195 (7.8%) | 285 (7.4%) | 0.16 |
| Chronic bronchitis | 327 (11.6%) | 254 (10.1%) | 442 (11.5%) | 0.18 |
| Emphysema | 232 (8.2%) | 237 (9.5%) | 378 (9.8%) | 0.10 |
| Asthma—adult | 181 (6.4%) | 171 (6.8%) | 272 (7.0%) | 0.60 |
| Pneumonia | 772 (27.4%) | 709 (28.3%) | 1099 (28.4%) | 0.67 |
| Heart disease | 392 (13.9%) | 312 (12.5%) | 521 (13.4%) | 0.28 |
| Hypertension | 1002 (35.6%) | 890 (35.5%) | 1374 (35.5%) | 0.99 |
| Stroke | 91 (3.2%) | 66 (2.6%) | 109 (2.8%) | 0.40 |
| Diabetes | 243 (8.6%) | 251 (10.0%) | 342 (8.8%) | 0.16 |
| Any cancer history | 121 (4.3%) | 97 (3.9%) | 163 (4.2%) | 0.71 |
| Polygenic Risk Score Groups (Absolute Score Range) | Low Score (−4 to −1) | Neutral Score 0 | High Score (1 to 6) |
|---|---|---|---|
| N = 9191 NHW (% of total cohort) | 2813 (30.6%) | 2504 (27.2%) | 3874 (42.1%) |
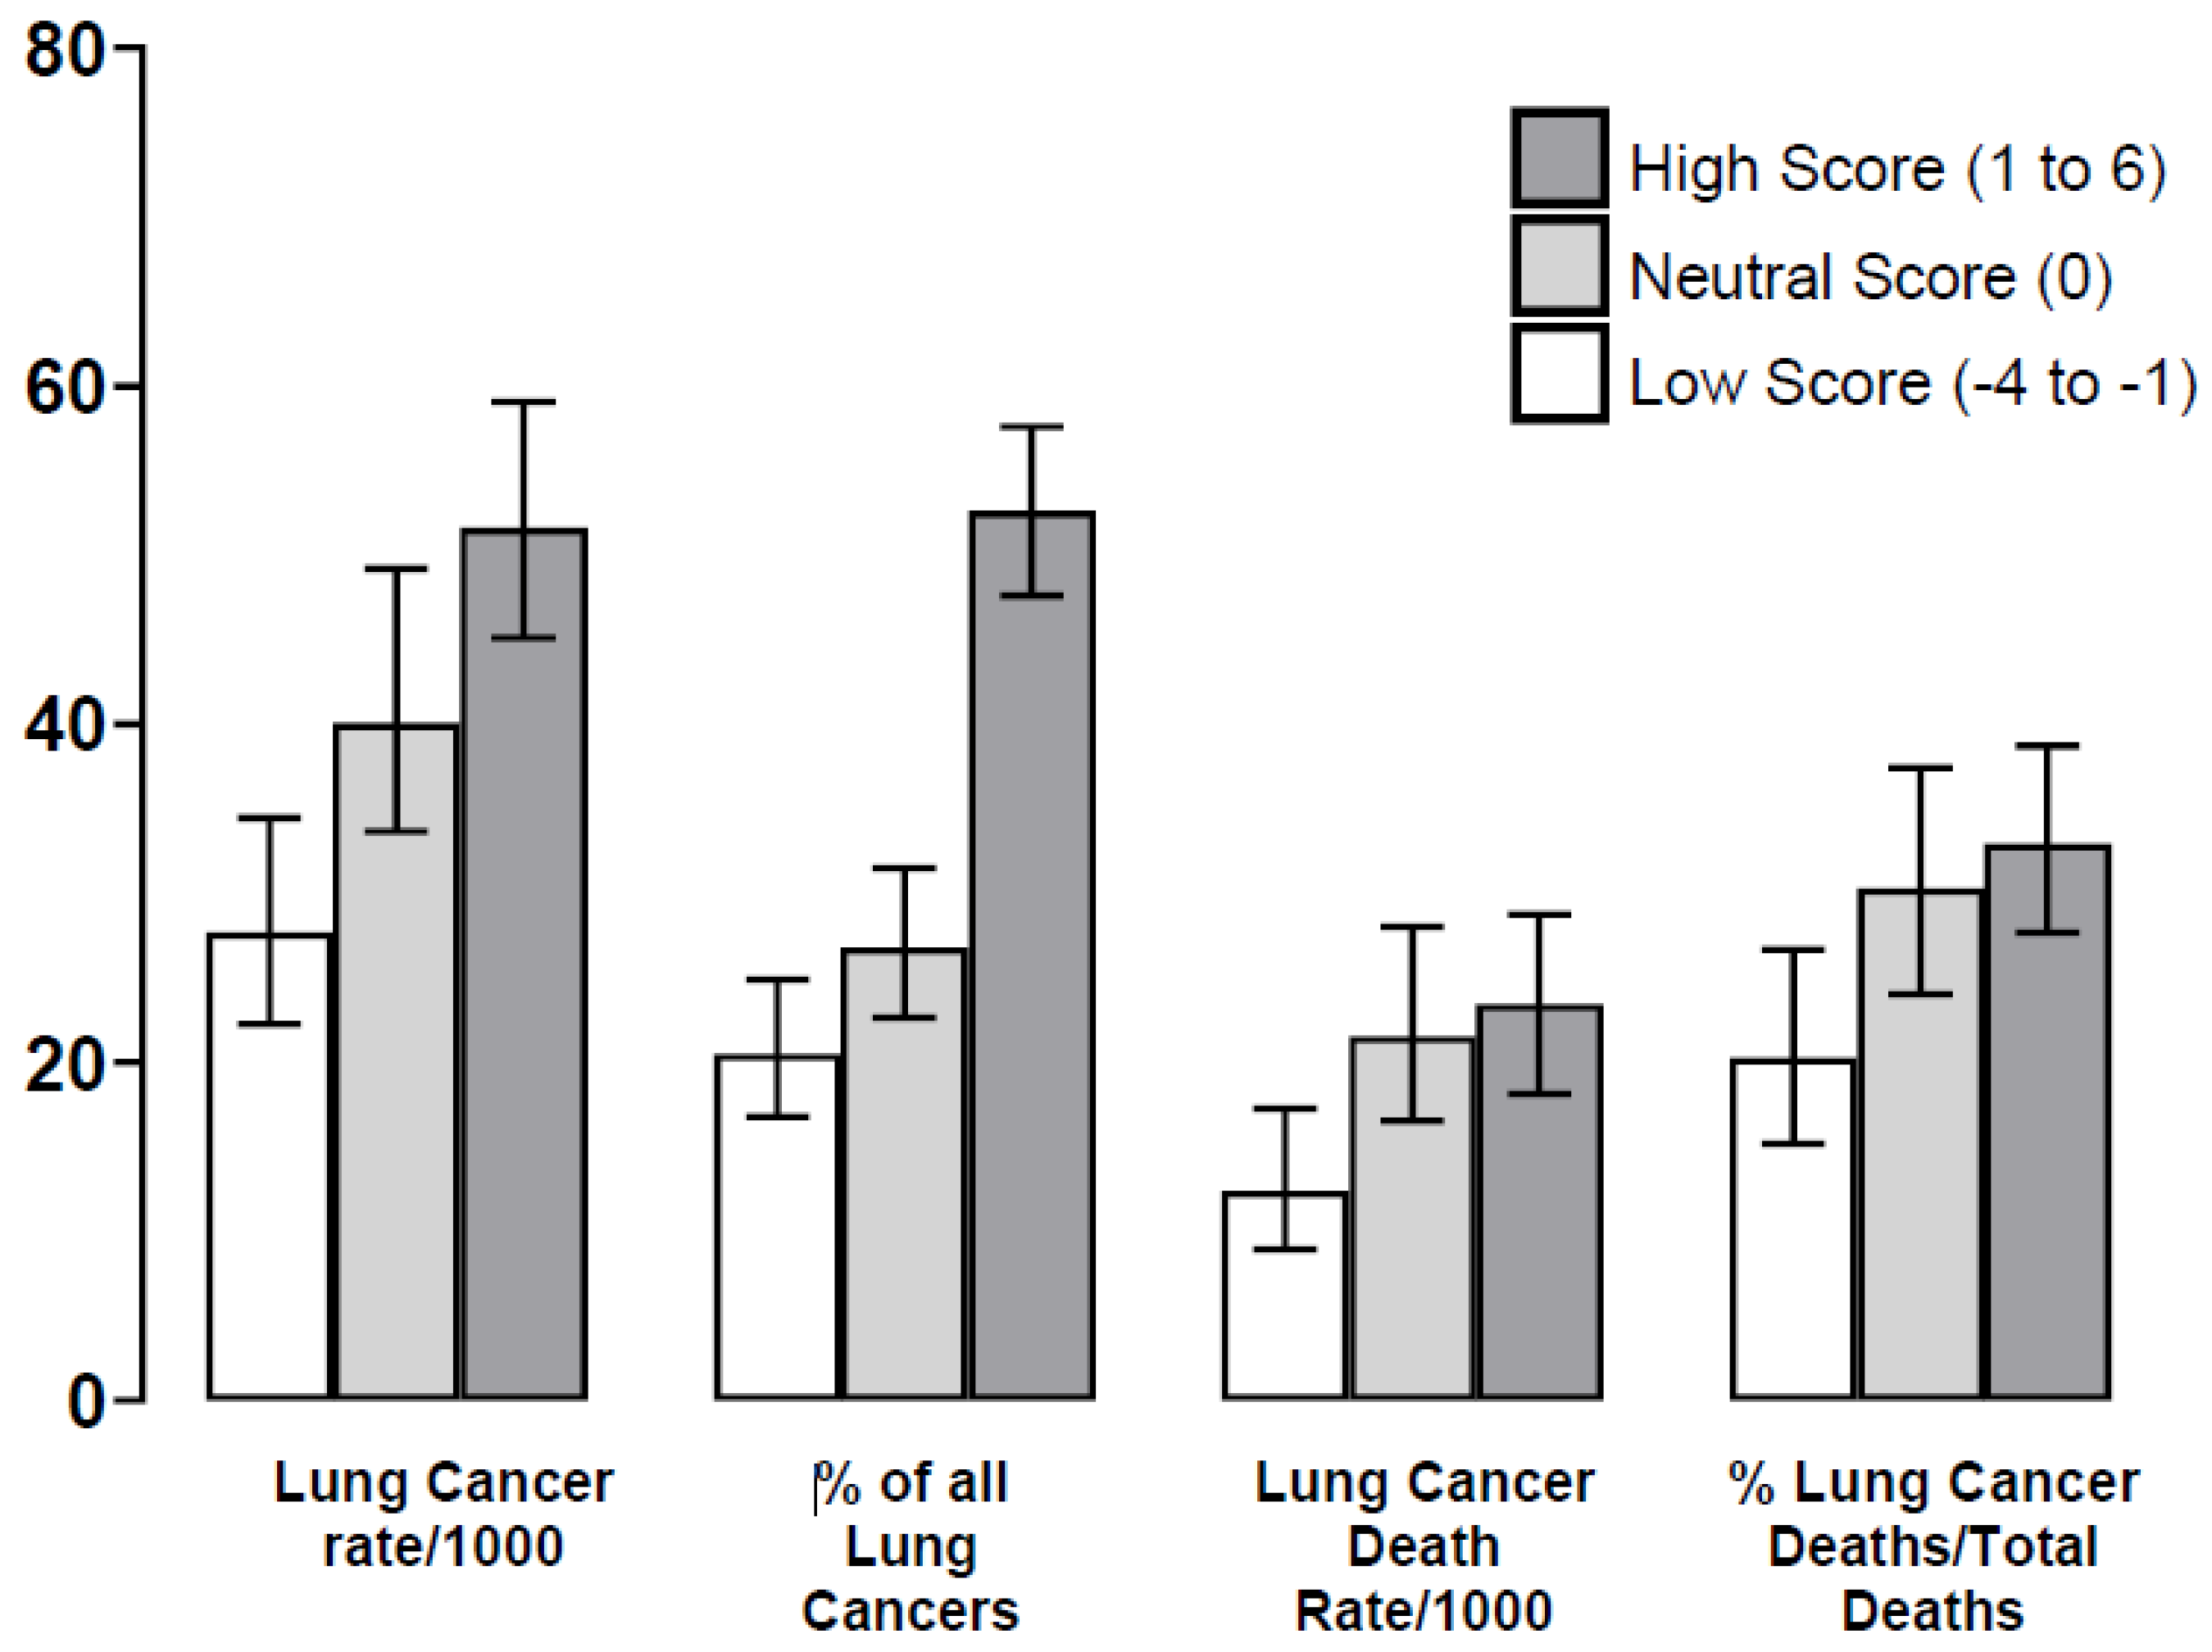
| Lung Cancer (LC) (% total, N = 380) ‡ | 78 (20.5%) | 102 (26.8%) | 200 (52.6%) |
| Incidence/per 1000 (95% CI) | 27.7 (22.3,34.5) | 40.7 (33.7,49.2) | 51.6 (45.1,59.1) 1 |
| Overall Mortality (prevalence) | |||
| Total Deaths (%, per 100) | 187 (6.6%) | 178 (7.1%) | 276 (7.1%) |
| % and 95% CI all deaths (N = 641) | 29.2%, (25.8, 32.9) | 27.8% (24.4, 31.4) | 43.1% (39.3, 46.9) |
| -LC Deaths (% total deaths by group) | 35/187 (18.7%) | 54/178 (30.3%) | 91/276 (33.0%) 2 |
| -% all deaths (N = 641) | 5.5% (4.0, 7.5) | 8.4% (6.5, 10.8) | 14.2% (11.7, 17.1) |
| -% all deaths by tertile | 1.2% (0.90, 1.73) | 2.2% (1.7, 2.8) | 2.3% (1.9, 2.9) 3 |
| -Cardiovascular (CVD) Deaths | 41 (21.9%) | 40 (22.5%) | 63 (22.8%) |
| -% all deaths (N = 641) | 6.4% (4.8, 8.6) | 6.2% (0.2,1.6) | 9.8% (7.8, 12.4) |
| -% all deaths by tertile | 1.5% (1.1, 2.0) | 1.6% (1.2, 2.2) | 1.6% (1.3, 2.1) |
| -Respiratory Deaths | 22 (11.8%) | 16 (9.0%) | 19 (6.9%) |
| -% all deaths (N = 641) | 3.4% (2.3, 5.1) | 2.5% (1.5, 4.0) | 3.0% (1.9, 4.6) |
| -% all deaths by tertile | 0.78% (0.52, 1.18) | 0.64% (0.39, 1.04) | 0.49% (0.31, 0.76) |
| -Other Cancer Deaths | 42 (22.5%) | 41 (23.0%) | 56 (20.3%) |
| -% all deaths (N = 641) | 6.6% (4.9, 8.7) | 6.4% (4.8, 8.6) | 8.7% (6.8, 11.2) |
| -% all deaths by tertile | 1.5% (1.1, 2.0) | 1.6% (1.2, 2.2) | 1.4% (1.1, 1.9) |
| -Other Deaths or Cause Unknown | 47 (25.1%) | 27 (15.2%) | 47 (17.0%) |
| -% all deaths (N = 641) | 7.3% (5.6, 9.6) | 4.2% (2.9, 6.1) | 7.3% (5.6, 9.6) |
| -% all deaths by tertile | 1.7% (1.3, 2.2) | 1.1% (0.7, 1.6) | 1.2%(0.9, 1.6) |
| Lung Cancer Mortality—rate ratios ‡ | |||
| Low vs. Neutral | ref | 1.73 | 1.89 |
| (95% CI), p value | (1.14–2.64), p = 0.010 | (1.28–2.78), p = 0.0009 | |
| Neutral vs. High | - | ref | 1.09 |
| (95% CI), p value | (0.78–1.52), p = 0.62 | ||
| Lung Cancer Screening Outcomes | |||
| Outcomes Low vs. Neutral + High | Low—CXR vs. CT | Neutral + High—CXR vs. CT | |
| Surgery rates % (95% CI) favouring CT over CXR for PRS subgroup | 17/39 vs. 20/34 | 61/133 vs. 96/161 | |
| 44% (29, 59) vs. 59% (42, 74) | 46% (38, 54) vs. 60% (52, 67) | ||
| Risk difference—% (95% CI) | −15% (−38, 7.5) | −14% (−25, −2.41) | |
| p value | p = 0.21 | p = 0.019 | |
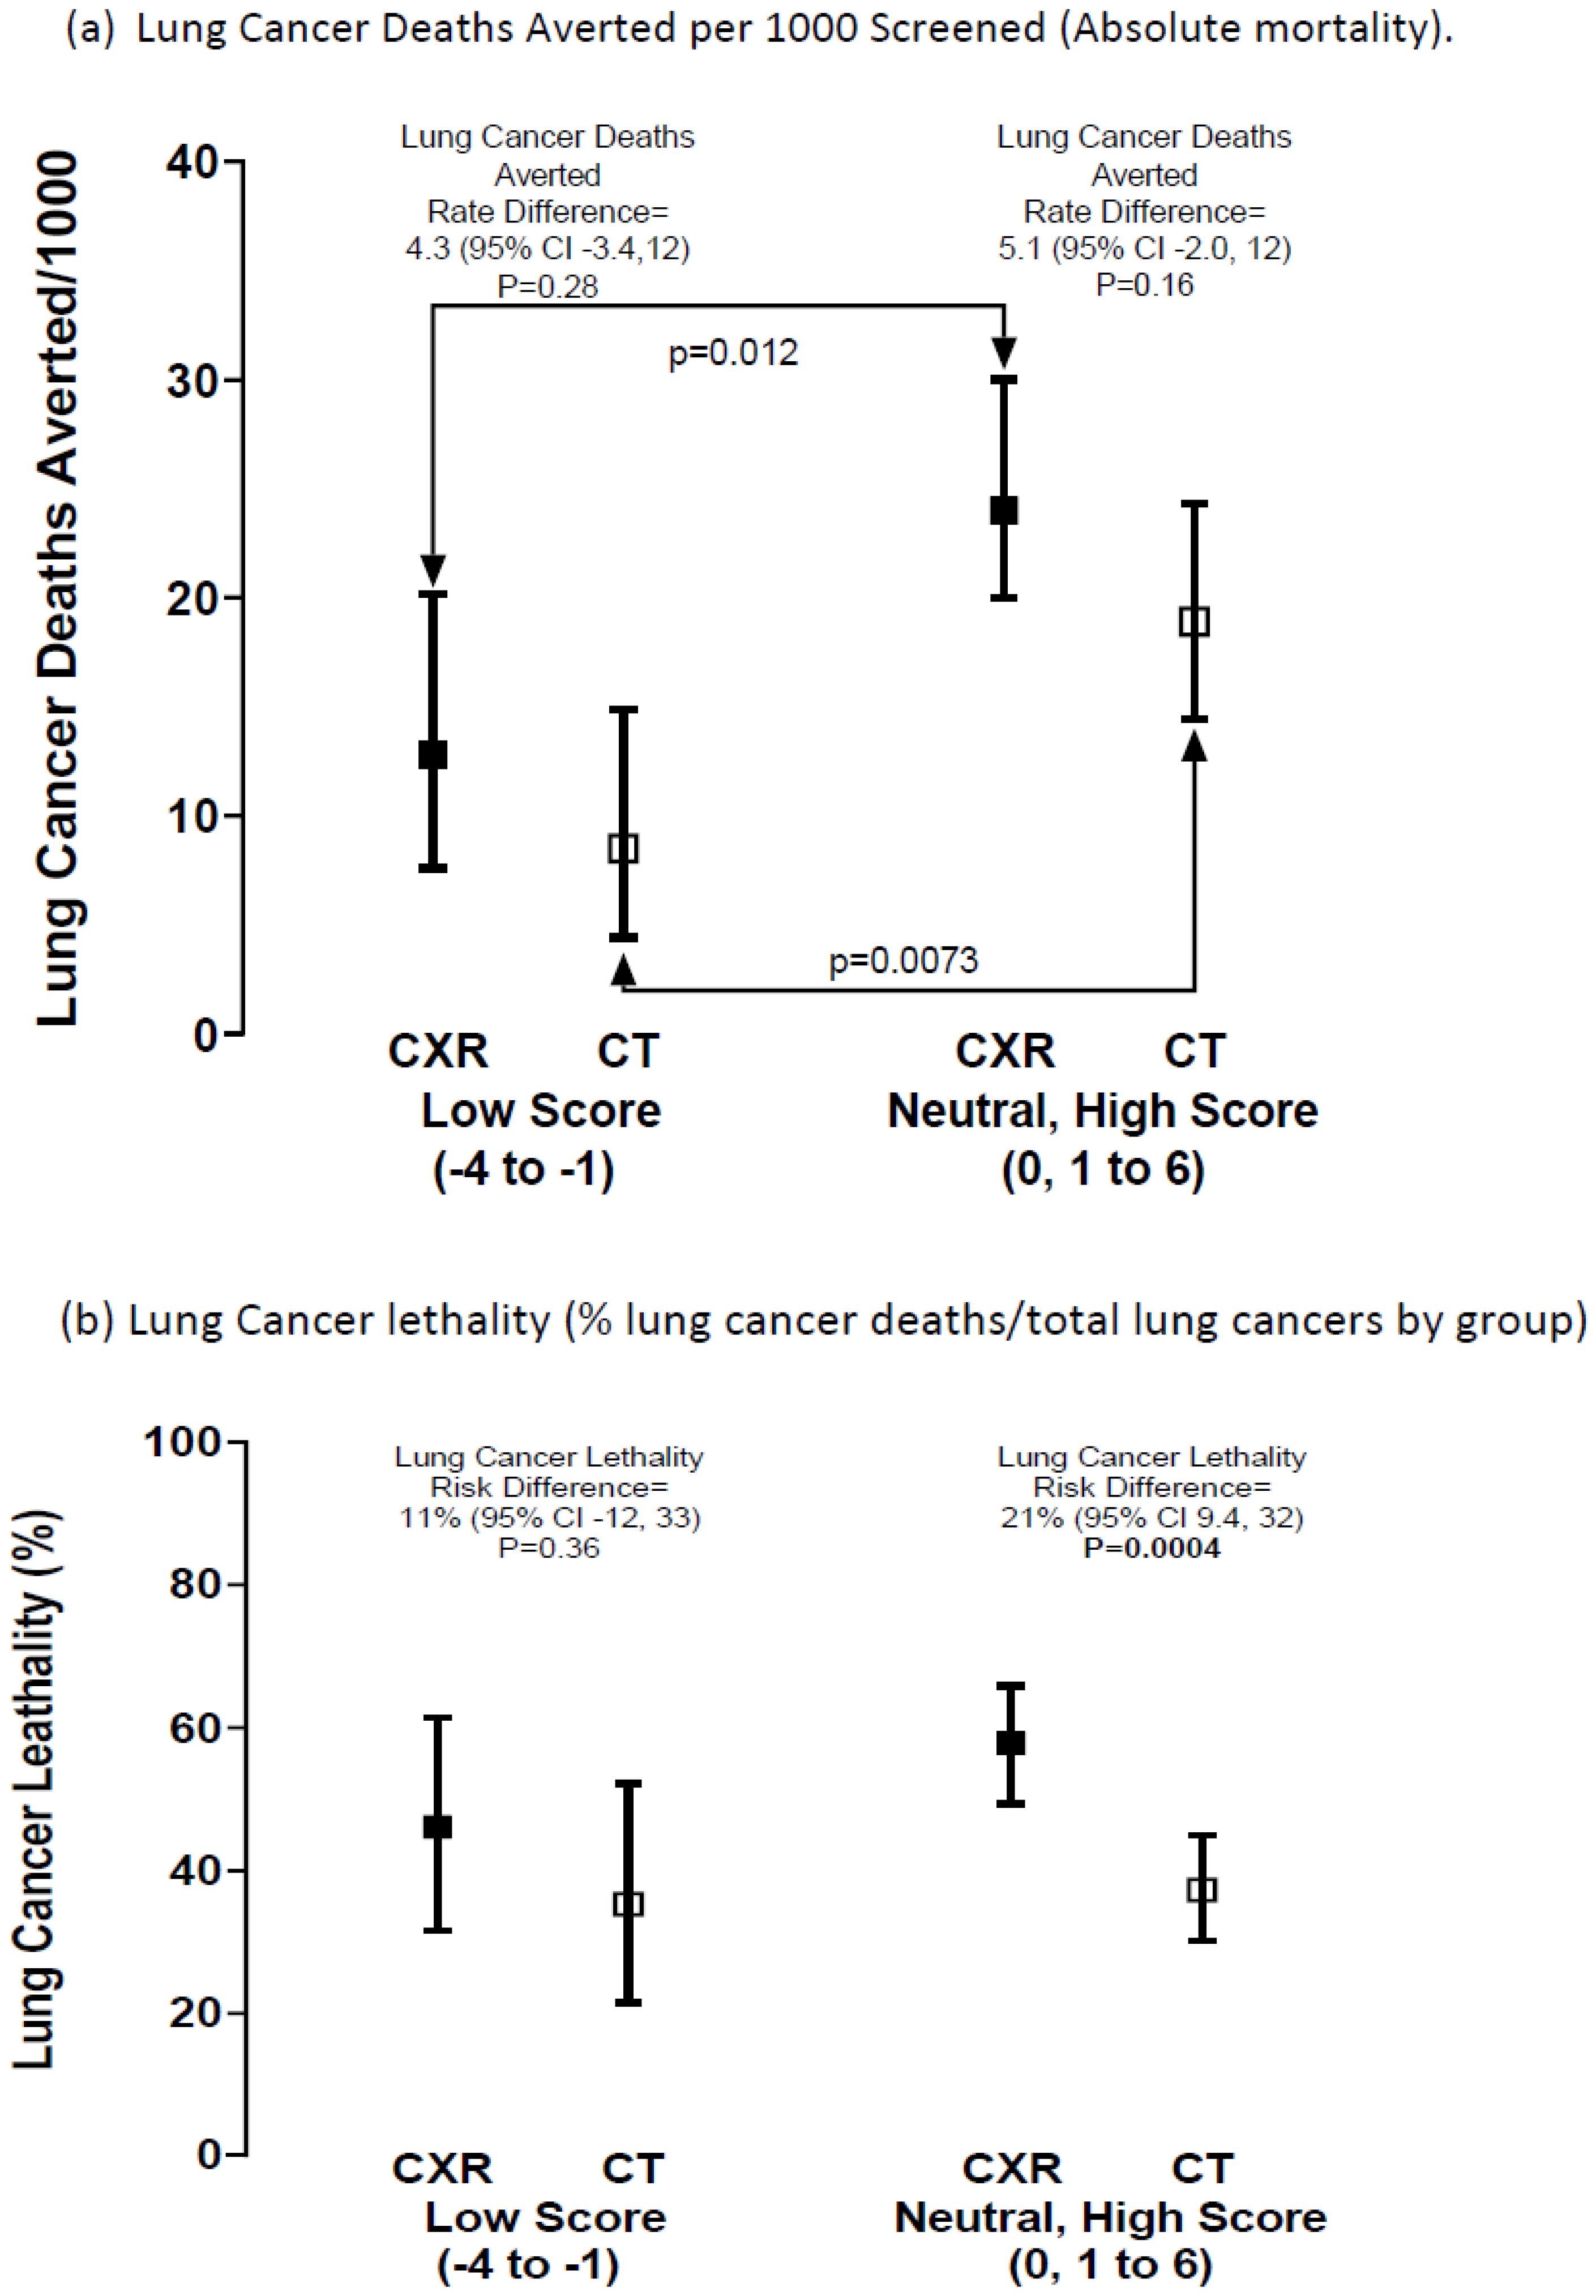
| Lung Cancer (LC) Lethality | Low—CXR vs. CT | Neutral + High—CXR vs. CT | |
| LC lethality in CXR vs. CT ‡‡ | 18/39 vs. 12/34 | 77/133 vs. 60/161 | |
| % (95% CI) | 46% (32, 61) vs. 35% (21, 52) | 58% (49, 66) vs. 37% (30, 45) | |
| Risk difference—% difference (95% CI) | +11.0 (−12, 33) | +21% (9.4,32) | |
| p value | p = 0.36 | p = 0.0004 | |
| Odds ratio (OR) of LC lethality in CXR vs. CT (95% CI) | |||
| OR = 1.57 (0.61, 4.04) | OR = 2.32 (1.15, 3.70) | ||
| p value | p = 0.35 | p = 0.0005 | |
| Lung Cancer Deaths Averted by Screening (CXR-CT) | |||
| Deaths averted CT versus CXR | 18/1406 vs. 12/1405 | 77/3204 vs. 60/3174 | |
| Absolute difference/1000 screened (% relative reduction) | −4.3 (−3.4, 12) | −5.1 (−2.0, 12) | |
| 34% relative reduction | 21% relative reduction | ||
| Odds ratio (OR) of LC deaths averted in CXR vs. CT (95% CI) | |||
| OR = 0.66 (−0.31, 1.38) | OR = 0.79 (0.56, 1.10) | ||
| p value | p = 0.28 | p = 0.16 | |
| Variable | Full Model | Reduced Model * | ||||
|---|---|---|---|---|---|---|
| Point Estimate | 95% CI | p Value | Point Estimate | 95% CI | p Value | |
| Age | 1.07 | 1.04–1.10 | <0.0001 | 1.07 | 1.03–1.10 | <0.0001 |
| Sex (male vs. female) | 0.98 | 0.67–1.38 | 0.89 | |||
| Current smoker | 1.69 | 1.19–2.40 | 0.0031 | 1.69 | 1.19–2.39 | 0.0033 |
| Pack-years | 1.01 | 1.01–1.02 | 0.0004 | 1.01 | 1.01–1.02 | 0.0002 |
| Family history of LC | 1.28 | 0.89–1.85 | 0.18 | |||
| Self-reported COPD | 1.40 | 0.97–2.03 | 0.070 | 1.41 | 0.98–2.02 | 0.07 |
| BMI | 0.95 | 0.91–0.99 | 0.0076 | 0.95 | 0.92–0.99 | 0.0073 |
| High school/some college | 1.49 | 1.03–2.16 | 0.035 | 1.52 | 1.05–2.19 | 0.027 |
| 12-SNP lung cancer PRS | 1.18 | 1.06–1.32 | 0.0026 | 1.18 | 1.06–1.32 | 0.0027 |
| COPD (GOLD 1–4) # | 1.45 | 1.03–2.06 | 0.036 | 1.47 | 1.04–2.09 | 0.029 |
| Screening arm (CXR vs. CT) | 1.23 | 0.88–1.71 | 0.22 | |||
Disclaimer/Publisher’s Note: The statements, opinions and data contained in all publications are solely those of the individual author(s) and contributor(s) and not of MDPI and/or the editor(s). MDPI and/or the editor(s) disclaim responsibility for any injury to people or property resulting from any ideas, methods, instructions or products referred to in the content. |
© 2025 by the authors. Licensee MDPI, Basel, Switzerland. This article is an open access article distributed under the terms and conditions of the Creative Commons Attribution (CC BY) license (https://creativecommons.org/licenses/by/4.0/).
Share and Cite
Young, R.P.; Scott, R.J.; Callender, T.; Duan, F.; Billings, P.; Aberle, D.R.; Gamble, G.D. Polygenic Risk Score Is Associated with Developing and Dying from Lung Cancer in the National Lung Screening Trial. J. Clin. Med. 2025, 14, 3110. https://doi.org/10.3390/jcm14093110
Young RP, Scott RJ, Callender T, Duan F, Billings P, Aberle DR, Gamble GD. Polygenic Risk Score Is Associated with Developing and Dying from Lung Cancer in the National Lung Screening Trial. Journal of Clinical Medicine. 2025; 14(9):3110. https://doi.org/10.3390/jcm14093110
Chicago/Turabian StyleYoung, Robert P., Raewyn J Scott, Tom Callender, Fenghai Duan, Paul Billings, Denise R. Aberle, and Greg D. Gamble. 2025. "Polygenic Risk Score Is Associated with Developing and Dying from Lung Cancer in the National Lung Screening Trial" Journal of Clinical Medicine 14, no. 9: 3110. https://doi.org/10.3390/jcm14093110
APA StyleYoung, R. P., Scott, R. J., Callender, T., Duan, F., Billings, P., Aberle, D. R., & Gamble, G. D. (2025). Polygenic Risk Score Is Associated with Developing and Dying from Lung Cancer in the National Lung Screening Trial. Journal of Clinical Medicine, 14(9), 3110. https://doi.org/10.3390/jcm14093110