
Association of Visceral Adiposity and Sarcopenia with Geospatial Analysis and Outcomes in Acute Pancreatitis


 , , ,
, , , 
Abstract
1. Introduction
2. Materials and Methods
2.1. Study Design and Setting
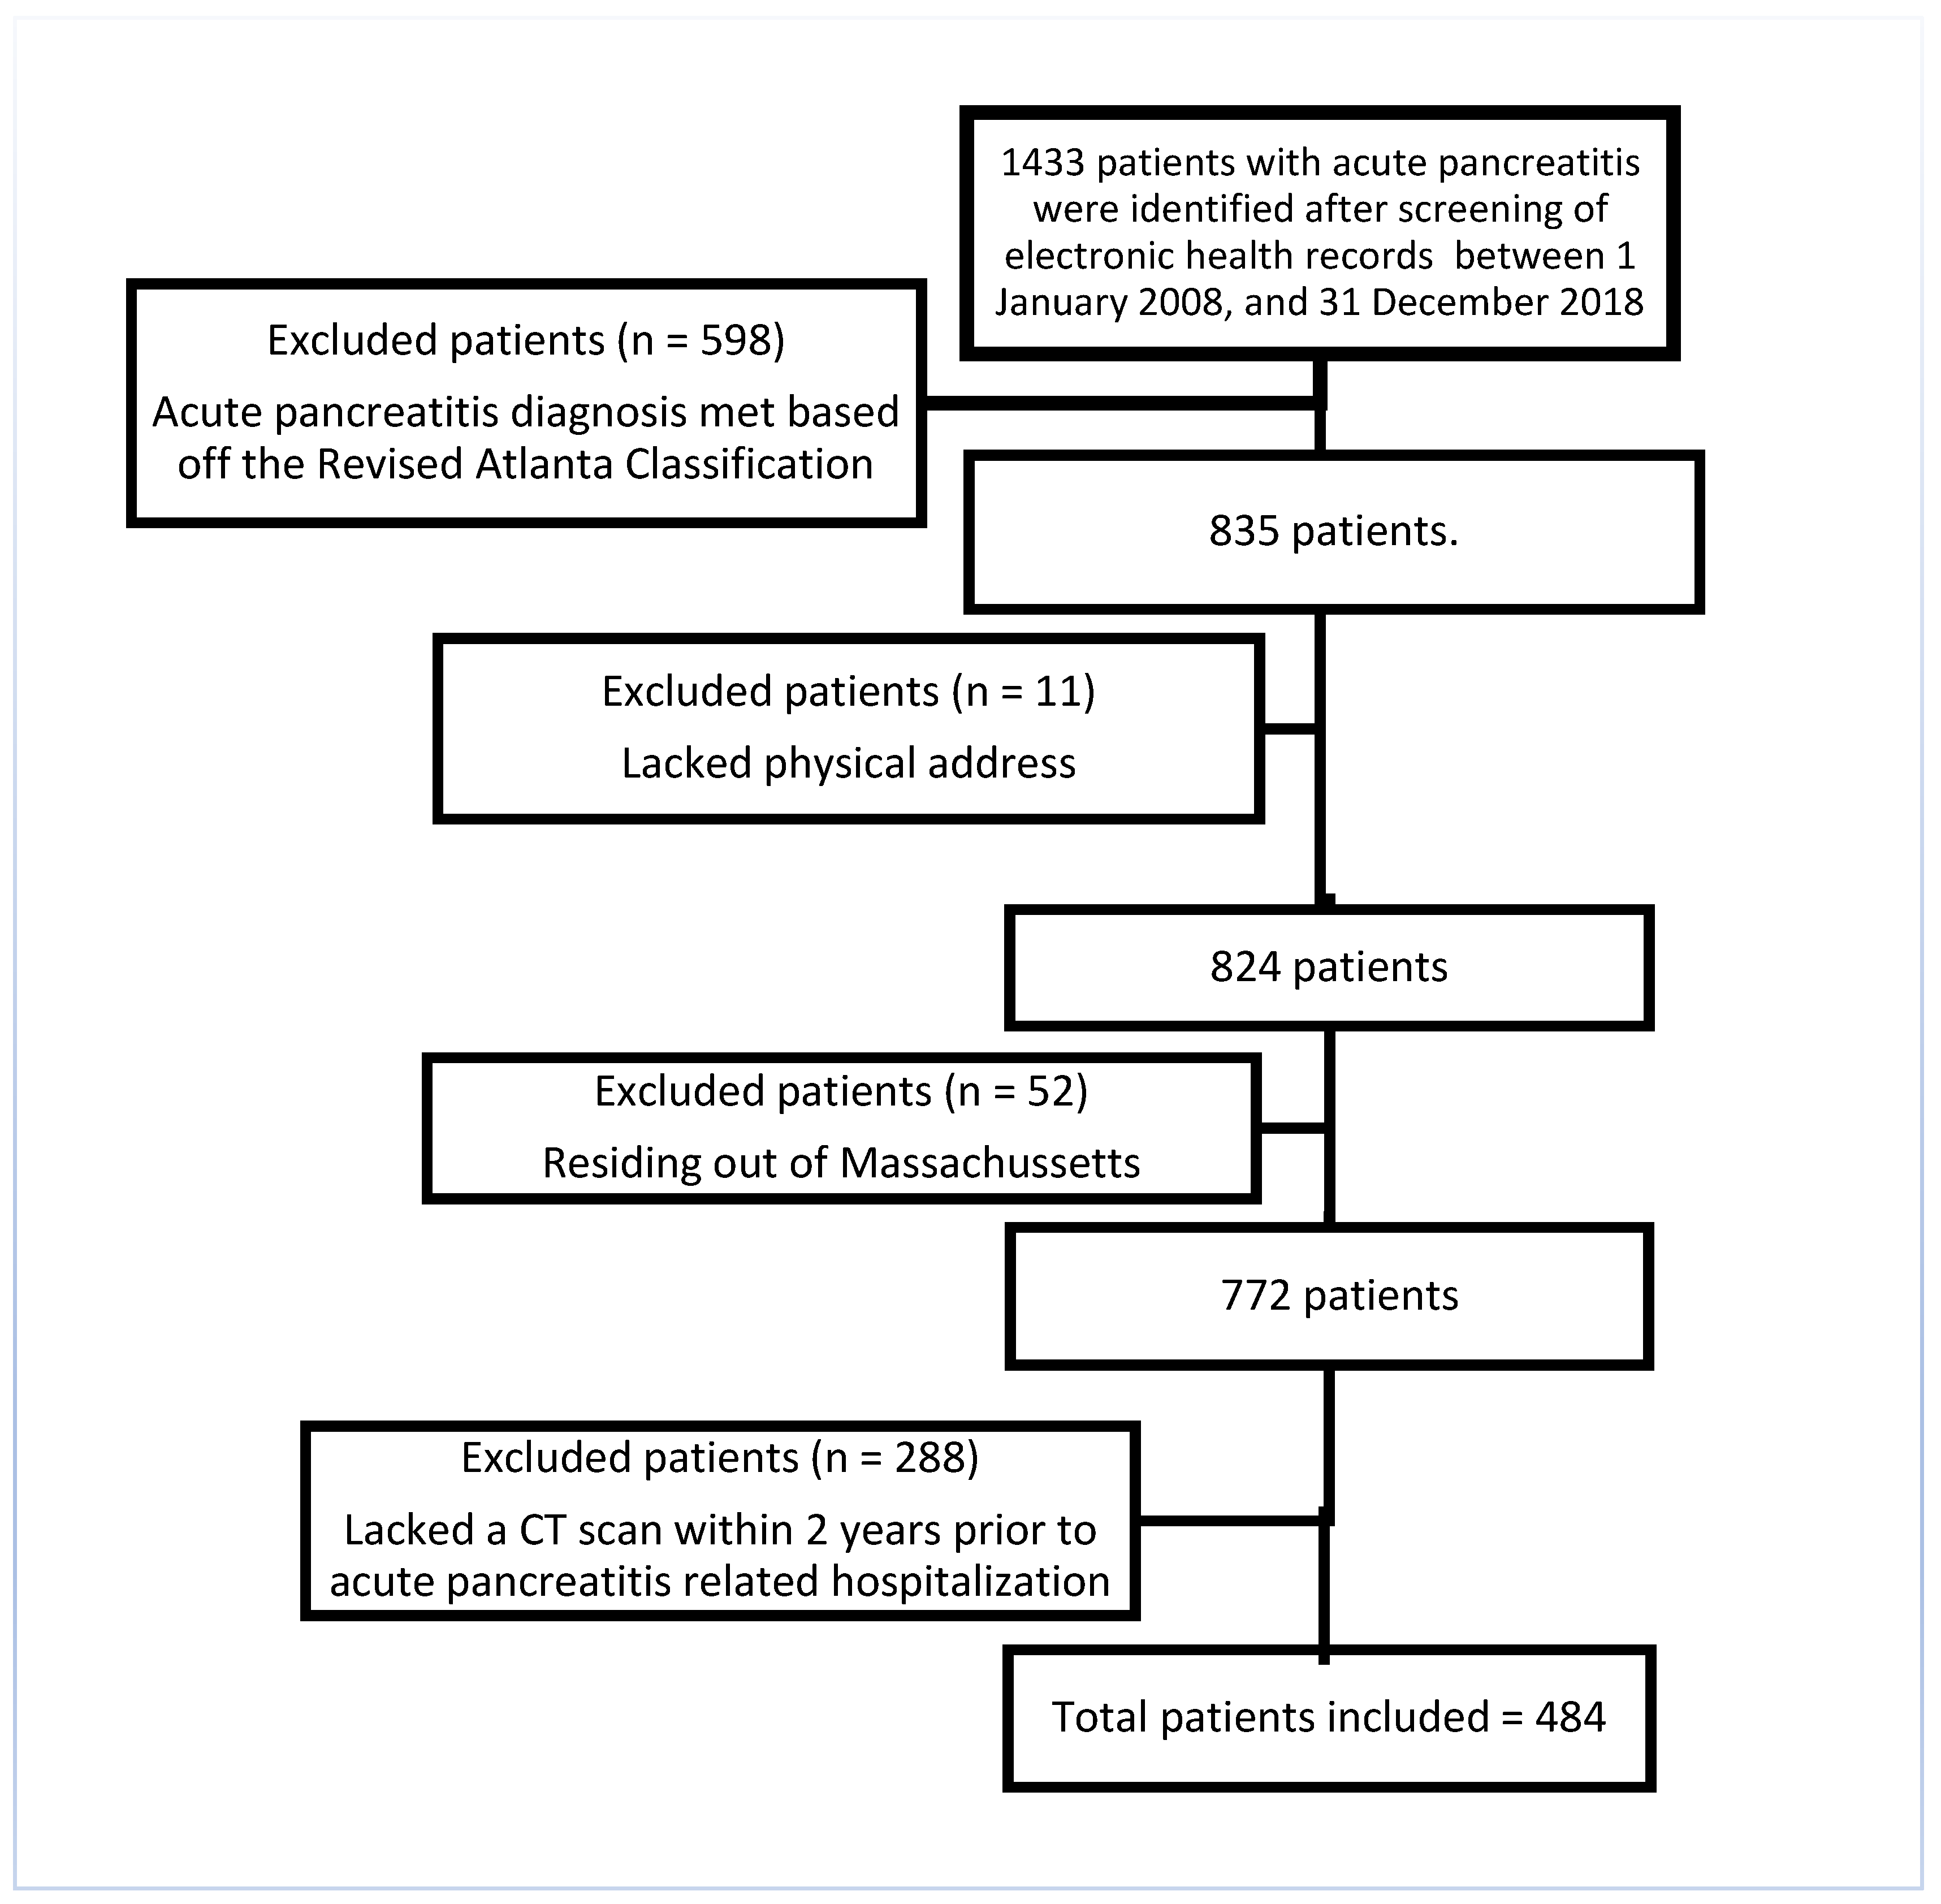
2.2. Study Population
2.3. Baseline Demographic Assessment
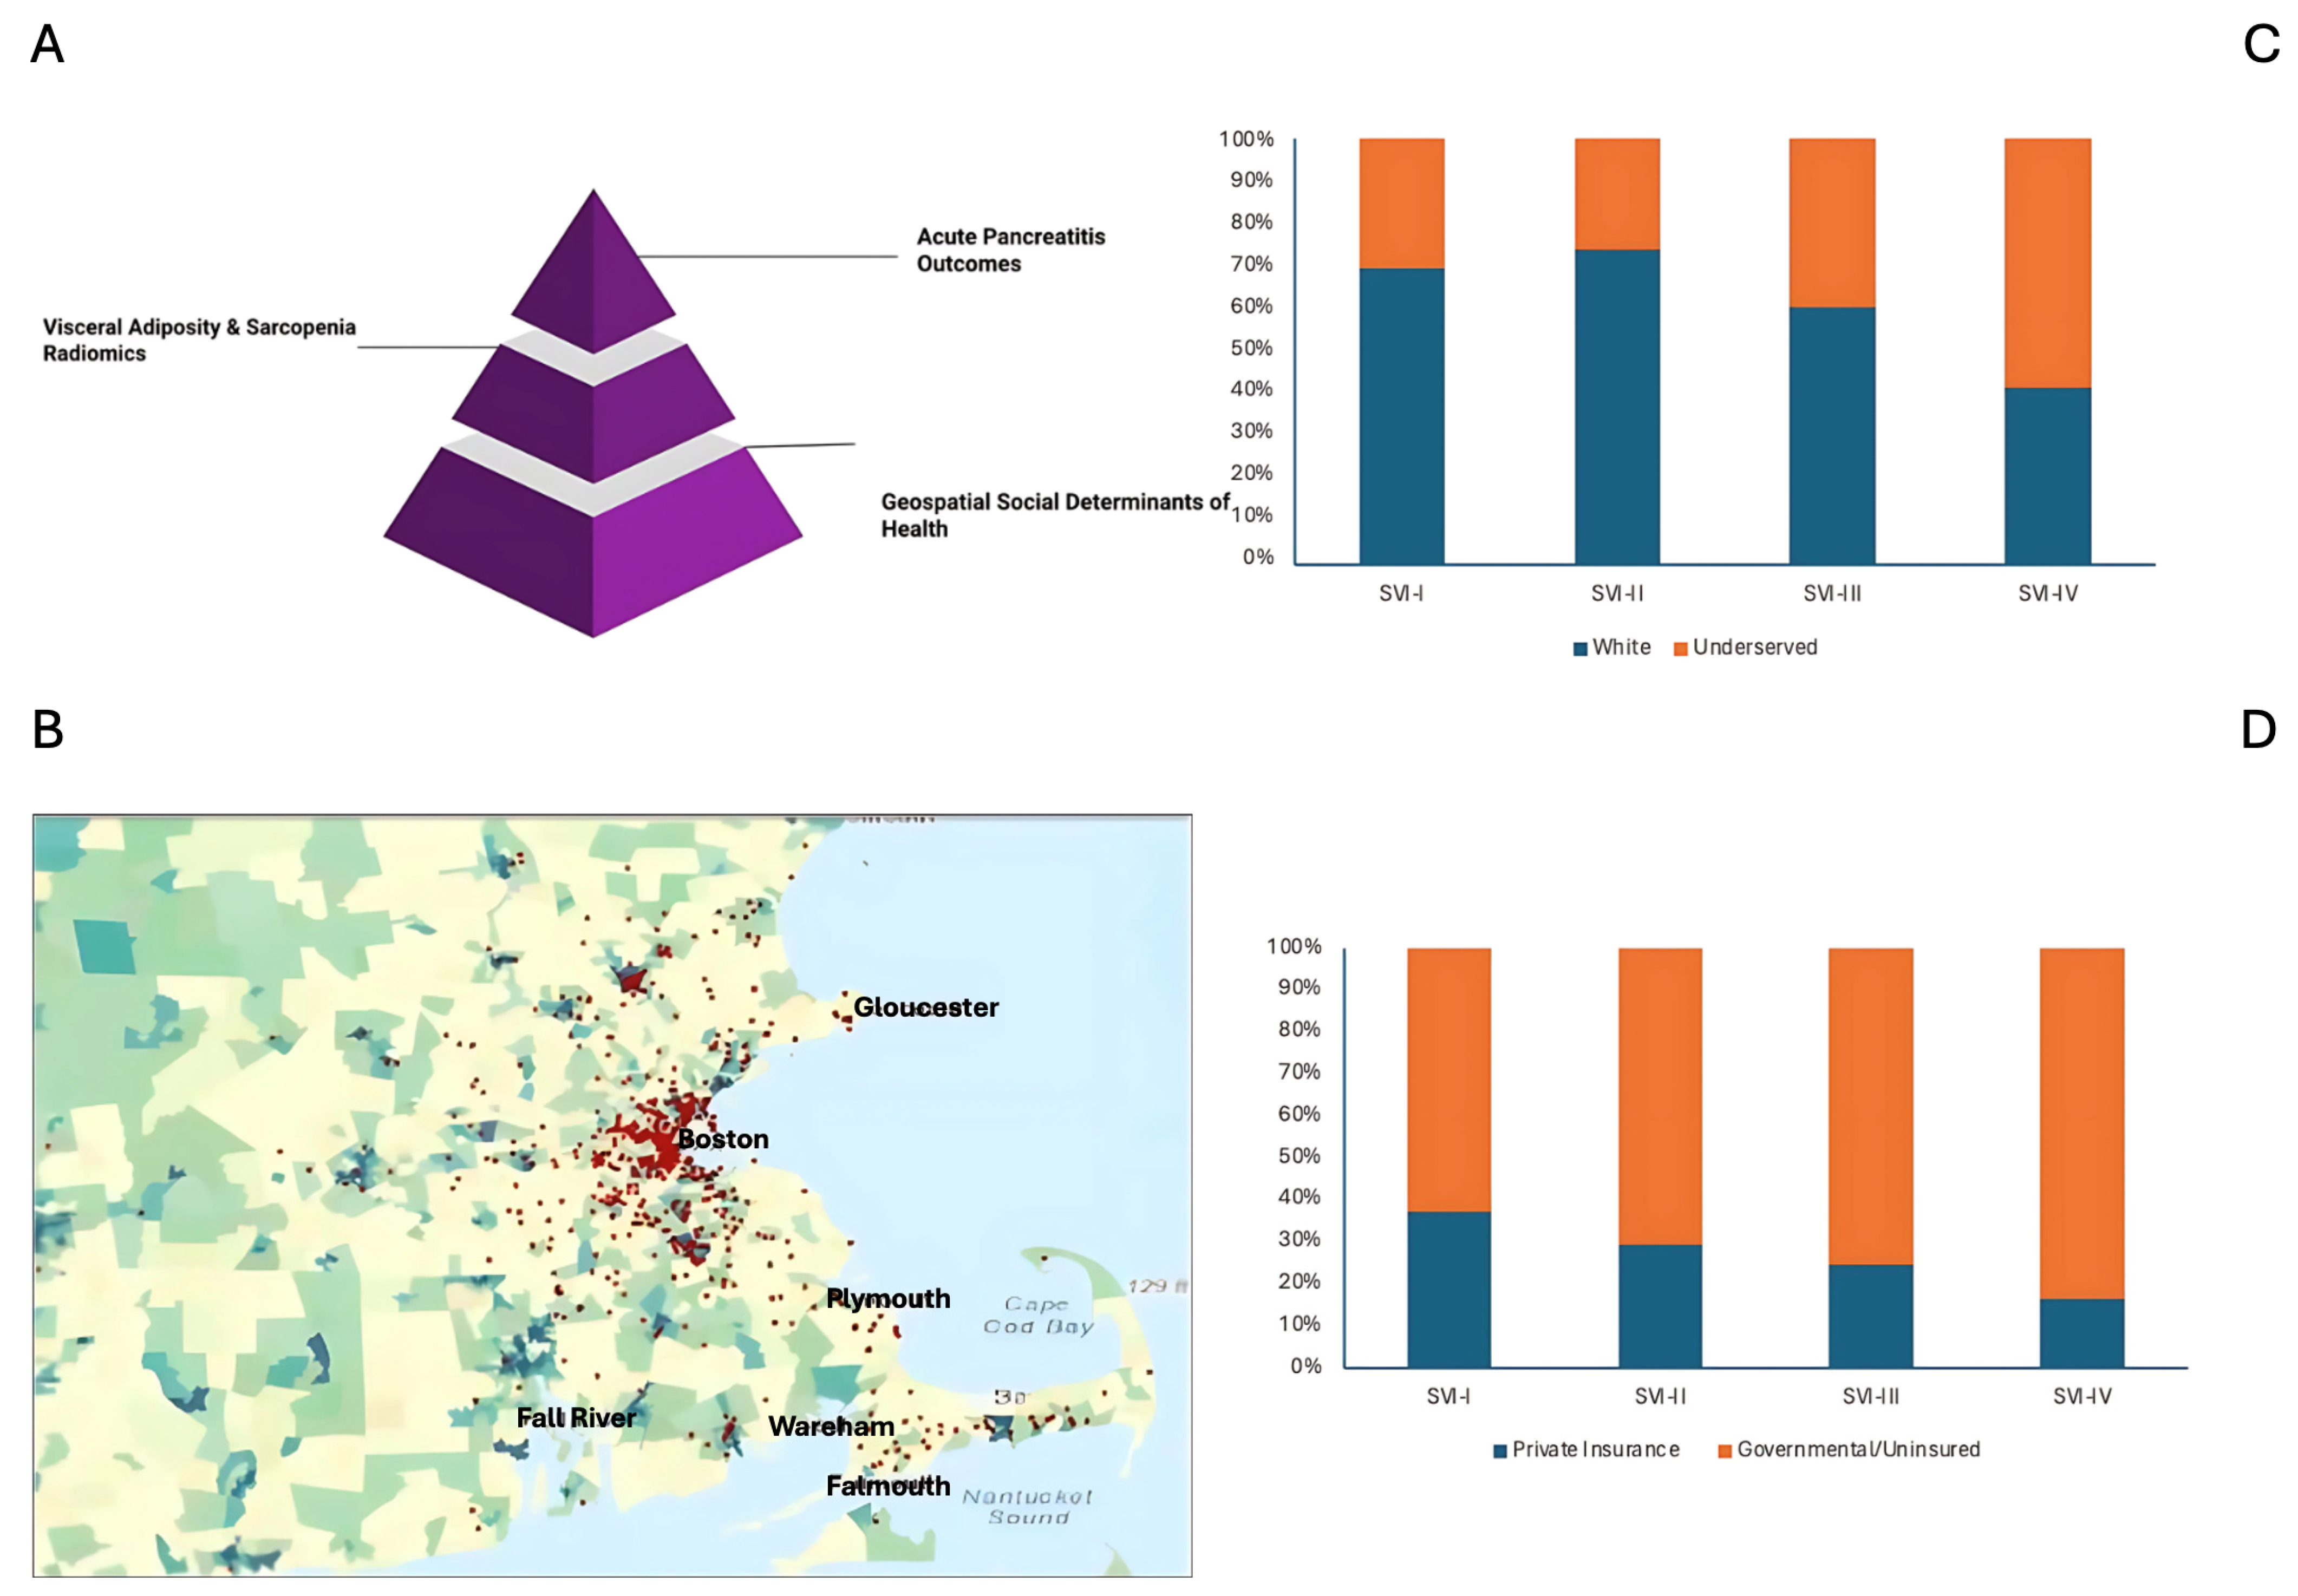
2.4. Geocoding and Social Vulnerability Index
2.5. Radiological Features Assessment
2.6. Statistical Analysis
3. Results
3.1. Demographics
3.2. Clinical Characteristics
3.3. Radiological Features
3.4. Regression Analysis
4. Discussion
5. Conclusions
Author Contributions
Funding
Institutional Review Board Statement
Informed Consent Statement
Data Availability Statement
Conflicts of Interest
Abbreviations
| BMI | Body mass index |
| CT | Computed tomography scans |
| (CDC)’s | Centers for Disease Control and Prevention |
| CCI | Charlson comorbidity index |
| EHR | Electronic health records |
| HUAC | Hounsfield unit average calculation |
| LOS | Length of hospital stay |
| MME | Morphine equivalent units |
| VA/TA | Ratio of visceral to total adiposity |
| SVI | Social vulnerability index |
| SA | Subcutaneous adiposity |
| SIRS | Systemic inflammatory response syndrome |
| VA | Visceral adiposity |
| VAS | Visual analog scale |
References
- Peery, A.F.; Crockett, S.D.; Murphy, C.C.; Jensen, E.T.; Kim, H.P.; Egberg, M.D.; Lund, J.L.; Moon, A.M.; Pate, V.; Barnes, E.L.; et al. Burden and Cost of Gastrointestinal, Liver, and Pancreatic Diseases in the United States: Update 2021. Gastroenterol. 2022, 162, 621. [Google Scholar] [CrossRef] [PubMed]
- Boxhoorn, L.; Voermans, R.P.; Bouwense, S.A.; Bruno, M.J.; Verdonk, R.C.; Boermeester, M.A.; van Santvoort, H.C.; Besselink, M.G. Acute pancreatitis. Lancet 2020, 396, 726–734. [Google Scholar] [CrossRef] [PubMed]
- Sternby, H.; Bolado, F.; Canaval-Zuleta, H.J.; Marra-López, C.; Hernando-Alonso, A.I.; Del-Val-Antoñana, A.; García-Rayado, G.; Rivera-Irigoin, R.; Grau-García, F.J.; Oms, L. Determinants of Severity in Acute Pancreatitis: A Nation-wide Multicenter Prospective Cohort Study. Ann. Surg. 2019, 270, 348–355. [Google Scholar] [CrossRef] [PubMed]
- Iannuzzi, J.P.; King, J.A.; Leong, J.H.; Quan, J.; Windsor, J.W.; Tanyingoh, D.; Coward, S.; Forbes, N.; Heitman, S.J.; Shaheen, A.-A.; et al. Global Incidence of Acute Pancreatitis Is Increasing Over Time: A Systematic Review and Meta-Analysis. Gastroenterology 2022, 162, 122–134. [Google Scholar] [CrossRef]
- NCD (Noncommunicable diseases) Risk Factor Collaboration. Worldwide trends in underweight and obesity from 1990 to 2022: A pooled analysis of 3663 population-representative studies with 222 million children, adolescents, and adults. Lancet 2024, 403, 1027–1050. [Google Scholar] [CrossRef]
- Janssen, I.; Katzmarzyk, P.T.; Ross, R. Body mass index, waist circumference, and health risk: Evidence in support of current National Institutes of Health guidelines. Arch. Intern. Med. 2002, 162, 2074–2079. [Google Scholar] [CrossRef]
- Navina, S.; Acharya, C.; DeLany, J.P.; Orlichenko, L.S.; Baty, C.J.; Shiva, S.S.; Durgampudi, C.; Karlsson, J.M.; Lee, K.; Bae, K.T.; et al. Lipotoxicity causes multisystem organ failure and exacerbates acute pancreatitis in obesity. Sci. Transl. Med. 2011, 3, 107ra110. [Google Scholar] [CrossRef]
- Patel, K.; Trivedi, R.N.; Durgampudi, C.; Noel, P.; Cline, R.A.; DeLany, J.P.; Navina, S.; Singh, V.P. Lipolysis of visceral adipocyte triglyceride by pancreatic lipases converts mild acute pancreatitis to severe pancreatitis independent of necrosis and inflammation. Am. J. Pathol. 2015, 185, 808–819. [Google Scholar] [CrossRef]
- Ross, R.; Neeland, I.J.; Yamashita, S.; Shai, I.; Seidell, J.; Magni, P.; Santos, R.D.; Arsenault, B.; Cuevas, A.; Hu, F.B.; et al. Waist circumference as a vital sign in clinical practice: A Consensus Statement from the IAS and ICCR Working Group on Visceral Obesity. Nat. Rev. Endocrinol. 2020, 16, 177–189. [Google Scholar] [CrossRef]
- Tan, R.; Ng, Z.Q.; Misur, P.; Wijesuriya, R. Relationship of computed tomography quantified visceral adiposity with the severity and complications of acute pancreatitis: A systematic review. Jacute Pancreatitisanese J. Radiol. 2023, 41, 1104–1116. [Google Scholar] [CrossRef]
- Farquhar, R.; Matthews, S.; Baxter, N.; Rayers, G.; Ratnayake, C.B.B.; Robertson, F.P.; Nandhra, S.; Lim, W.B.; Witham, M.; Pandanaboyana, S. Sarcopenia and Sarcopenic Obesity on Body Composition Analysis is a Significant Predictor of Mortality in Severe Acute Pancreatitis: A Longitudinal Observational Study. World J. Surg. 2023, 47, 2825–2833. [Google Scholar] [CrossRef] [PubMed]
- Boutin, R.D.; Yao, L.; Canter, R.J.; Lenchik, L. Sarcopenia: Current Concepts and Imaging Implications. AJR Am. J. Roentgenol. 2015, 205, W255–W266. [Google Scholar] [CrossRef] [PubMed]
- Boutin, R.D.; Katz, J.; Chaudhari, A. Significance of sarcopenia in soft-tissue sarcoma patients: Do skeletal muscle and fat measures of body composition on routine CT exams help predict clinical outcomes? In Proceedings of the Radiological Society of North America Meeting (RSNA 2014), Chicago, IL, USA, 2 December 2014; Available online: http://archive.rsna.org/2014/14011743.html (accessed on 7 May 2015).
- Najjar, N.; Opolka, C.B.; Fitzpatrick, A.M.; Grunwell, J.R. Geospatial Analysis of Social Determinants of Health Identifies Neighborhood Hot Spots Associated With Pediatric Intensive Care Use for Acute Respiratory Failure Requiring Mechanical Ventilation. Pediatr. Crit. Care Med. 2022, 23, 606–617. [Google Scholar] [CrossRef] [PubMed]
- Chang, J.; Deng, Q.; Hu, P.; Guo, M.; Lu, F.; Su, Y.; Sun, J.; Qi, Y.; Long, Y.; Liu, J. Geogracute pancreatitishic Variation in Mortality of Acute Myocardial Infarction and Association With Health Care Accessibility in Beijing, 2007 to 2018. J. Am. Heart Assoc. 2023, 12, e029769. [Google Scholar] [CrossRef]
- Centers for Disease Control and Prevention/Agency for Toxic Substances and Disease Registry/Geospatial Research, Analysis, and Services Program. CDC/ATSDR Social Vulnerability Index [2020] Database US. Available online: https://www.atsdr.cdc.gov/place-health/php/svi/index.html (accessed on 31 January 2024).
- von Elm, E.; Altman, D.G.; Egger, M.; Pocock, S.J.; Gotzsche, P.C.; Vandenbroucke, J.P. Strengthening the Reporting of Observational Studies in Epidemiology (STROBE) statement: Guidelines for reporting observational studies. BMJ 2007, 335, 806–808. [Google Scholar] [CrossRef]
- Banks, P.A.; Bollen, T.L.; Dervenis, C.; Gooszen, H.G.; Johnson, C.D.; Sarr, M.G.; Tsiotos, G.G.; Vege, S.S. Classification of acute pancreatitis-2012: Revision of the Atlanta classification and definitions by international consensus. Gut 2013, 62, 102–111. [Google Scholar] [CrossRef]
- McHenry, N.B.; Shah, I.; Ahmed, A.; Freedman, S.D.; Kothari, D.J.; Sheth, S.G. Racial Variations in Pain Management and Outcomes in Hospitalized Patients With Acute Pancreatitis. Pancreas 2022, 51, 1248–1250. [Google Scholar] [CrossRef]
- Anderson, K.L.; Shah, I.; Tintara, S.; Ahmed, A.; Freedman, S.D.; Kothari, D.J.; Sheth, S.G. Evaluating the Clinical Characteristics and Outcomes of Idiopathic Acute Pancreatitis: Comparison With Nonidiopathic Acute Pancreatitis Over a 10-Year Period. Pancreas 2022, 51, 1167–1170. [Google Scholar] [CrossRef]
- Charlson, M.E.; Pompei, P.; Ales, K.L.; MacKenzie, C.R. A new method of classifying prognostic comorbidity in longitudinal studies: Development and validation. J. Chronic. Dis. 1987, 40, 373–383. [Google Scholar] [CrossRef]
- Wu, B.U.; Johannes, R.S.; Sun, X.; Tabak, Y.; Conwell, D.L.; A Banks, P. The early prediction of mortality in acute pancreatitis: A large population-based study. Gut 2008, 57, 1698–1703. [Google Scholar] [CrossRef]
- Gao, W.; Yang, H.X.; Ma, C.E. The Value of BISAP Score for Predicting Mortality and Severity in Acute Pancreatitis: A Systematic Review and Meta-Analysis. PLoS ONE 2015, 10, e0130412. [Google Scholar] [CrossRef] [PubMed]
- Yoo, T.; Lo, W.D.; Evans, D.C. Computed tomography measured psoas density predicts outcomes in trauma. Surg. 2017, 162, 377–384. [Google Scholar] [CrossRef] [PubMed]
- Dirks, R.C.; Edwards, B.L.; Tong, E.; Schaheen, B.; Turrentine, F.E.; Shada, A.; Smith, P.W. Sarcopenia in emergency abdominal surgery. J. Surg. Res. 2017, 207, 13–21. [Google Scholar] [CrossRef] [PubMed]
- Jain, V.; Al Rifai, M.; Khan, S.U.; Kalra, A.; Rodriguez, F.; Samad, Z.; Pokharel, Y.; Misra, A.; Sperling, L.S. Association Between Social Vulnerability Index and Cardiovascular Disease: A Behavioral Risk Factor Surveillance System Study. J. Am. Heart Assoc. 2022, 11, e024414. [Google Scholar] [CrossRef] [PubMed] [PubMed Central]
- Park, E.; Ko, Y. Socioeconomic Vulnerability Index and Obesity among Korean Adults. Int. J. Env. Res. Public Health 2021, 18, 13370. [Google Scholar] [CrossRef] [PubMed] [PubMed Central]
- Wild, L.E.; Walters, M.; Powell, A.; James, K.A.; Corlin, L.; Alderete, T.L. County-Level Social Vulnerability Is Positively Associated with Cardiometabolic Disease in Colorado. Int. J. Environ. Res. Public Health. 2022, 19, 2202. [Google Scholar] [CrossRef] [PubMed] [PubMed Central]
- Loney, T.; Nagelkerke, N.J. The individualistic fallacy, ecological studies and instrumental variables: A causal interpretation. Emerg. Themes Epidemiol. 2014, 11, 18. [Google Scholar] [CrossRef]
- Greenland, S.; Morgenstern, H. Ecological bias, confounding, and effect modification. Int. J. Epidemiol. 1989, 18, 269–274. [Google Scholar] [CrossRef]
- Fazel, S.; Geddes, J.R.; Kushel, M. The health of homeless people in high-income countries: Descriptive epidemiology, health consequences, and clinical and policy recommendations. Lancet 2014, 384, 1529–1540. [Google Scholar] [CrossRef]
- Doran, K.M.; Boyer, A.P.; Raven, M.C. Health Care for People Experiencing Homelessness-What Outcomes Matter? JAMA Netw. Open 2021, 4, e213837. [Google Scholar] [CrossRef]


| Patients with Acute Pancreatitis | ||||||
| Parameter | Total (n = 484) | SVI-I (n = 162) | SVI-II (n = 128) | SVI-III (n = 87) | SVI-IV (n = 107) | p Value |
| Age [median (IQR)] | 54.2 (42.6–64.6) | 56.9 (43.0–67.9) | 53.4 (39.1–66) | 56.0 (44.7–61.2) | 50.3 (41.1.–61.8) | 0.22 |
| Sex [(Female); n (%)] | 207 (42.8%) | 65 (40.1%) | 56 (43.8%) | 38 (43.7%) | 48 (44.9%) | 0.87 |
| BMI [median (IQR)] | 26.8 (22.9–30.6) | 27.5 (22.8–30.7) | 25.1 (22.8–29.1) | 27.4 (23.1–31.5) | 26.8 (22.6–30.8) | 0.19 |
| Uninsured/Reliant on Governmental insurance agencies [n (%)] | 193 (41.0) | 54 (33.8) | 37 (29.4) | 39 (47.6) | 63 (61.2) | 0.001 |
| Ethno-racially underserved patients [n (%)] | 354 (73.1) | 108 (66.7) | 89 (69.5) | 65 (74.7) | 92 (86.0) | 0.003 |
| Alcohol [n (%)] | 203 (41.94%) | 65 (40.12%) | 58 (45.31%) | 33 (37.93%) | 47 (43.93%) | 0.71 |
| Smoking [n (%)] | 160 (33.06%) | 46 (28.40%) | 41 (32.03%) | 29 (33.33%) | 44 (41.12%) | 0.41 |
| Recurrent acute pancreatitis [n (%)] | 75 (15.50%) | 20 (12.35%) | 24 (18.75%) | 13 (14.94%) | 18 (16.82%) | 0.49 |
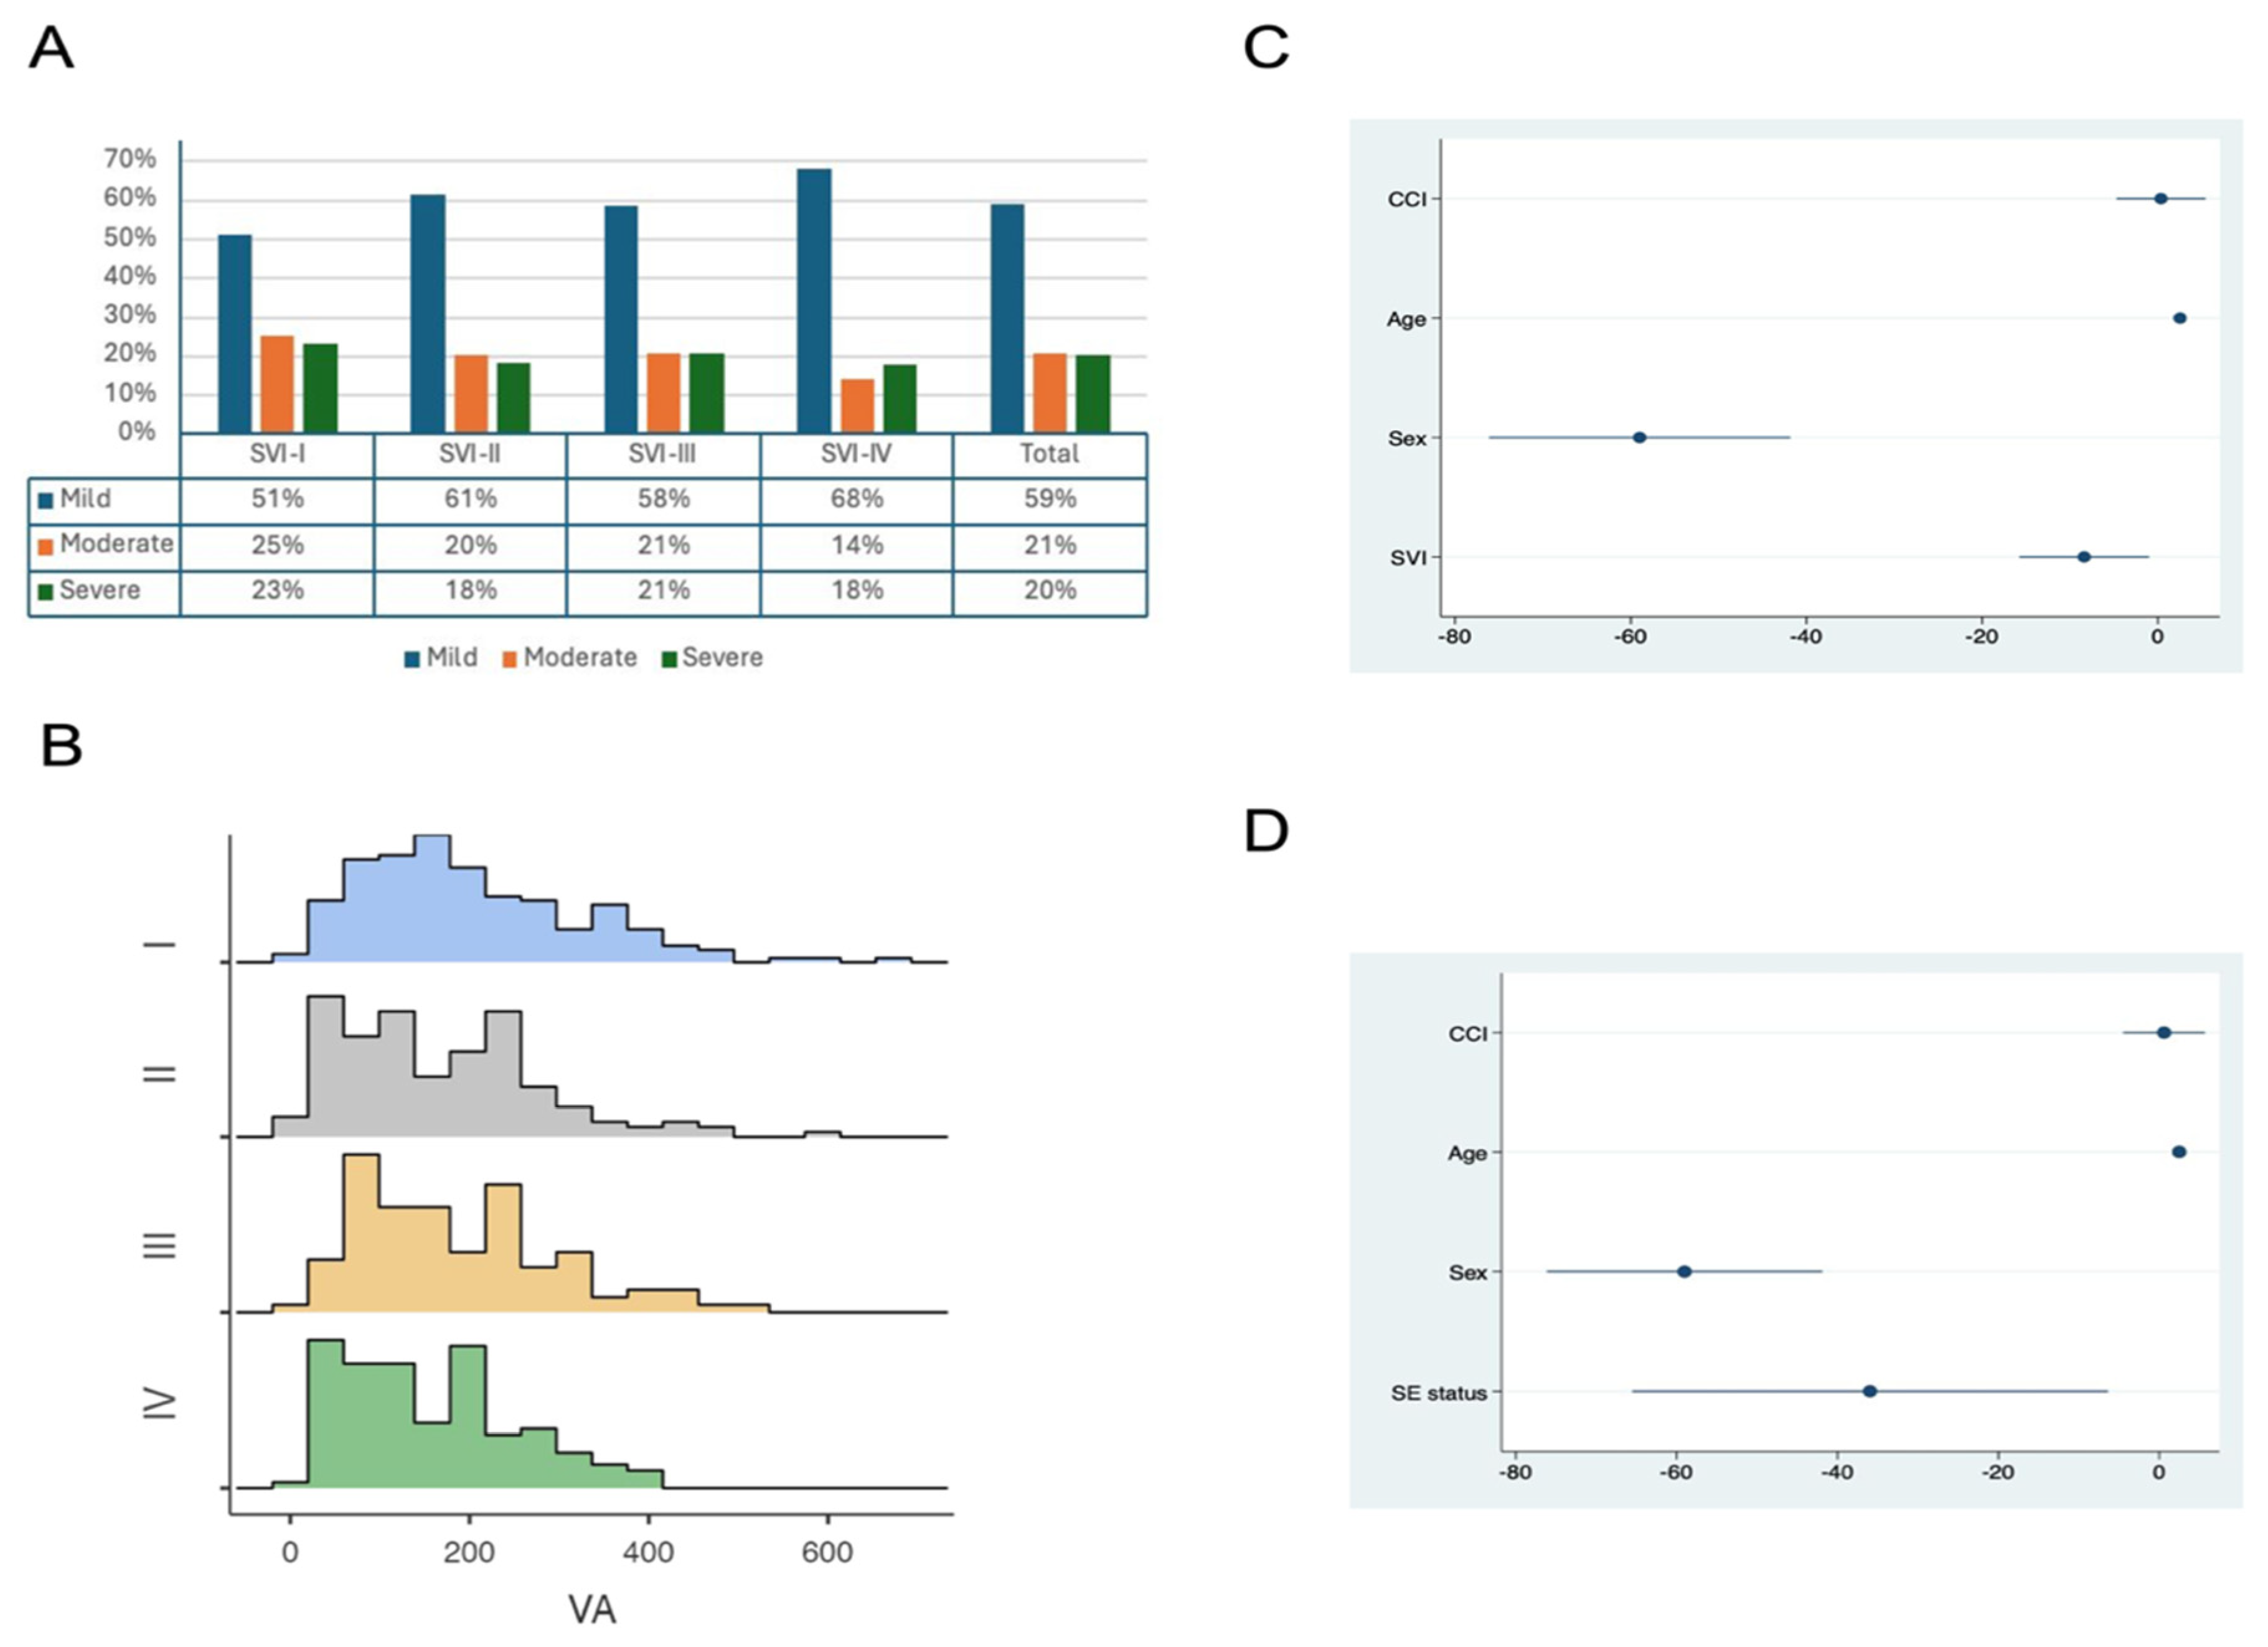
| Visceral Adiposity [median (IQR)] | 176 (100–251) | 188.5 (119–275) | 165.5 (82.9–243.5) | 185 (108–251) | 151 (88.3–216) | 0.03 |
| Subcutaneous adiposity [median (IQR)] | 209.5 (138.5–307) | 213 (139–295) | 183 (128–293) | 209 (148–288) | 231 (144–341) | 0.27 |
| Visceral/Total Adiposity ratio [median (IQR)] | 43.5 (32.3–55.3) | 43.8 (34.6–56.4) | 43.5 (30.5–55.3) | 45.0 (33.9–58) | 40.4 (27.7–50.8) | 0.04 |
| Hounsfield Unit Average Calculation: Muscle Mass [median (IQR)] | 51.3 (44.4–58.9) | 50.6 (44.1–57.8) | 52.7 (58.7–45.0) | 49.3 (43.4–58.9) | 53.7 (46.5–60.7) | 0.17 |
| Acute Pancreatitis-Related Hospitalizations | ||||||
| Parameter | Total (n = 592) | SVI-I (n = 193) | SVI-II (n =1 58) | SVI-III (n = 106) | SVI-IV (n = 135) | p Value |
| Etiology [n (%)] | Biliary: 155 (26.2) Alcohol: 135 (22.8) Idiopathic: 131 (22.1) Anatomic: 124 (21.0) Iatrogenic: 18 (3.0) Drug: 11 (1.9) HTG: 10 (1.7) Genetic: 8 (1.3) | Biliary: 46 (23.3) Alcohol: 37 (19.2) Idiopathic: 37 (17.6) Anatomic: 50 (25.9) Iatrogenic: 7 (1.6) Drug: 6 (2.1) HTG: 6 (3.1) Genetic: 4 (0.5) | Biliary: 47 (29.8) Alcohol: 38 (24.1) Idiopathic: 38 (24.1) Anatomic: 25 (15.8) Iatrogenic: 7 (4.4) Drug: 3 (3.2) HTG: 2 (1.3) Genetic: 0 (0.0) | Biliary: 31 (29.3) Alcohol: 27 (25.5) Idiopathic: 20 (18.9) Anatomic: 23 (21.7) Iatrogenic: 1 (0.9) Drug: 1 (0.9) HTG: 1 (0.9) Genetic: 2 (1.9) | Biliary: 32 (23.7) Alcohol: 33 (24.4) Idiopathic: 36 (26.7) Anatomic: 26 (19.3) Iatrogenic: 4 (3,0) Drug: 1 (0.7) HTG: 1 (0.7) Genetic: 2 (1.5) | 0.35 |
| Acute Pancreatitis Severity [n (%)] | Mild: 350 (59.1) Mod: 122 (20.6) Sev: 120 (20.3) | Mild: 99 (51.3) Mod: 49 (25.4) Sev: 45 (23.3) | Mild: 97 (61.4) Mod: 32 (20.2) Sev: 29 (18.4) | Mild: 62 (58.5) Mod: 22 (20.8) Sev: 22 (20.8) | Mild: 92 (68.1) Mod: 19 (14.1) Sev: 24 (17.8) | 0.10 |
| Length of Stay [median (IQR)] | 5 (3–8.9) | 5 (3–9) | 5 (3–8) | 4 (3–11) | 4 (3–8) | 0.59 |
| ICU Stay [n (%)] | 118 (19.9) | 45 (23.3) | 27 (17.1) | 21 (19.8) | 25 (18.5) | 0.50 |
| AKI requiring dialysis [n (%)] | 50 (8.4) | 19 (9.8) | 10 (6.3) | 12 (11.3) | 9 (6.7) | 0.36 |
| Delirium [n (%)] | 30 (5.1) | 10 (5.2) | 12 (7.6) | 5 (4.7) | 3 (2.2) | 0.22 |
| Social Vulnerability Index | ||||
|---|---|---|---|---|
| Parameter | Coefficient | p Value | Adjusted Coefficient # | p Value |
| VA | −11.68 [−20.41–−2.94] | 0.009 | −9.0 [−17.95–0.05] | 0.04 |
| SA | 9.11 [95%CI: −1.11–19.35] | 0.081 | - | |
| VA/TA Ratio | −1.53 [95%CI: −2.75–0.30] | 0.01 | −0.84 [95%CI: −2.11–0.42] | 0.19 |
| HUAC | 0.34 [95%CI: −0.55–1.23] | 0.45 | - | - |
| Parameter | Coefficient | p Value | Adjusted Coefficient | p Value |
|---|---|---|---|---|
| Socioeconomic status | −51.90 [95%CI: −86.89–−16.91] | 0.004 | −39.78 [95%CI: −75.88–−3.70] | 0.03 |
| Household composition | −15.86 [95%CI: −47.67–15.94] | 0.33 | −16.90 [95%CI: −49.02–15.21] | 0.30 |
| Minority status and language | −48.22 [95%CI: −84.80–−11.64] | 0.01 | −32.84 [−71.04–5.35] | 0.09 |
| Housing type and transportation | −33.86 [95%CI: −70.80–3.07] | 0.07 | −33.95 [−71.50–3.60] | 0.08 |
Disclaimer/Publisher’s Note: The statements, opinions and data contained in all publications are solely those of the individual author(s) and contributor(s) and not of MDPI and/or the editor(s). MDPI and/or the editor(s) disclaim responsibility for any injury to people or property resulting from any ideas, methods, instructions or products referred to in the content. |
© 2025 by the authors. Licensee MDPI, Basel, Switzerland. This article is an open access article distributed under the terms and conditions of the Creative Commons Attribution (CC BY) license (https://creativecommons.org/licenses/by/4.0/).
Share and Cite
Chhoda, A.; Bohara, M.; Liyen Cartelle, A.; Manoj, M.A.; Noriega, M.A.; Olivares, M.; Kelly, J.; Brook, O.; Freedman, S.D.; Bezuidenhout, A.F.; et al. Association of Visceral Adiposity and Sarcopenia with Geospatial Analysis and Outcomes in Acute Pancreatitis. J. Clin. Med. 2025, 14, 3005. https://doi.org/10.3390/jcm14093005
Chhoda A, Bohara M, Liyen Cartelle A, Manoj MA, Noriega MA, Olivares M, Kelly J, Brook O, Freedman SD, Bezuidenhout AF, et al. Association of Visceral Adiposity and Sarcopenia with Geospatial Analysis and Outcomes in Acute Pancreatitis. Journal of Clinical Medicine. 2025; 14(9):3005. https://doi.org/10.3390/jcm14093005
Chicago/Turabian StyleChhoda, Ankit, Manisha Bohara, Anabel Liyen Cartelle, Matthew Antony Manoj, Marco A. Noriega, Miriam Olivares, Jill Kelly, Olga Brook, Steven D. Freedman, Abraham F. Bezuidenhout, and et al. 2025. "Association of Visceral Adiposity and Sarcopenia with Geospatial Analysis and Outcomes in Acute Pancreatitis" Journal of Clinical Medicine 14, no. 9: 3005. https://doi.org/10.3390/jcm14093005
APA StyleChhoda, A., Bohara, M., Liyen Cartelle, A., Manoj, M. A., Noriega, M. A., Olivares, M., Kelly, J., Brook, O., Freedman, S. D., Bezuidenhout, A. F., & Sheth, S. G. (2025). Association of Visceral Adiposity and Sarcopenia with Geospatial Analysis and Outcomes in Acute Pancreatitis. Journal of Clinical Medicine, 14(9), 3005. https://doi.org/10.3390/jcm14093005