Article

Cardiopulmonary Exercise Testing Correlates with Quantitative Left Ventricular [99mTc]-DPD Uptake in Transthyretin Amyloid Cardiomyopathy

1
Division of Cardiology, Department of Internal Medicine II, Medical University of Vienna, 1090 Vienna, Austria
2
Division of Cardiovascular and Interventional Radiology, Department of Biomedical Imaging and Image-Guided-Therapy, Medical University of Vienna, 1090 Vienna, Austria
3
Division of Nuclear Medicine, Department of Biomedical Imaging and Image-Guided Therapy, Medical University of Vienna, 1090 Vienna, Austria
*
Author to whom correspondence should be addressed.
These authors contributed equally to this work.
J. Clin. Med. 2025, 14(9), 2999; https://doi.org/10.3390/jcm14092999
Submission received: 1 April 2025 / Revised: 23 April 2025 / Accepted: 24 April 2025 / Published: 26 April 2025
(This article belongs to the Section Cardiovascular Medicine)

Abstract

:
Background/Objectives: Patients with transthyretin amyloid cardiomyopathy (ATTR-CM) often experience significantly reduced functional capacity due to myocardial involvement. Cardiopulmonary exercise testing (CPET) is the gold standard to quantify functional capacity, and 99mTc-DPD scintigraphy and SPECT/CT have proven to be highly effective tools for diagnostic and disease monitoring. We aimed to investigate the complementary role and correlation between both methods, focusing on their combined potential as a strong prognostic framework for monitoring disease progression and evaluating treatment efficacy. Methods: A total of 44 patients with diagnosed ATTR-CM, who underwent 99mTc-DPD scintigraphy and SPECT/CT imaging as well as CPET, were included. All patients were divided into two groups based on the median DPD retention index (low DPD uptake: ≤5.0, n = 22; high DPD uptake: >5.0, n = 22). Results: The mean age was 78 years, with 82% of participants being male. Significant correlations were observed between peak VO2 and DPD retention index (r = −0.355, p = 0.018) as well as between peak VO2 at anaerobic threshold with DPD retention index (r = −0.391, p = 0.009). Interestingly, there was no strong correlation between VE/VCO2 slope and the retention index. A strong association was identified between cardiac biomarkers and peak VO2, specifically for NT-proBNP (r = −0.530, p < 0.001) and Troponin T (r = −0.431, p < 0.001). Conclusions: In ATTR-CM, significant correlations were observed between key CPET parameters and quantitative cardiac DPD uptake, which further reflects on disease severity and functional impairment. Our findings highlight the utility of integrating CPET and SPECT/CT for comprehensive patient assessment in ATTR-CM.

Graphical Abstract

1. Introduction

Transthyretin amyloid cardiomyopathy (ATTR-CM) is a progressive condition characterized by the extracellular deposition of misfolded transthyretin proteins, leading to myocardial dysfunction [1]. These deposits disrupt the myocardial architecture, causing diastolic dysfunction, reduced cardiac output, and severe heart failure (HF) [2]. ATTR-CM is often an underdiagnosed cause of HF, with a recent study estimating its prevalence to be up to 25% in heterogeneous population cohorts [3]. Diagnostic delays are still common, given the overlap of symptoms with other cardiac conditions and the limited awareness of the disease. Early diagnosis of ATTR-CM is crucial, as timely interventions can mitigate disease progression and improve patient outcomes [4]. Advances in bone scintigraphy and non-invasive imaging have improved detection rates, yet functional evaluation through cardiopulmonary exercise testing (CPET) remains underutilized in this context.
Quantitative single-photon emission computed tomography (SPECT/CT) using tracers [99mTc]-3,3-diphosphono-1,2-propanodicarboxylic acid (DPD) or [99mTc]-pyrophosphate (PYP) has emerged as the gold standard in the diagnosis of ATTR-CM. These methods enable the visualization and quantification of amyloid deposits [5,6], with high amyloid burden correlating with worse outcomes [7]. However, patients diseased with ATTR-CM are experiencing a progressive shortness of breath and reduced functional capacity (FC), and imaging alone may not fully capture the functional implications of amyloid burden. While DPD scintigraphy provides a robust method for visualizing and quantifying amyloid deposits, it alone may not fully capture the functional implications of amyloid burden on the patient’s daily activities and exercise capacity. To bridge this gap, CPET should be used as a complementary tool.
CPET has been shown to be valuable in the assessment of patients with ATTR-CM [8,9,10]. Among evaluated parameters, peak oxygen consumption (VO2) and the ventilation to carbon dioxide production (VE/VCO2) slope have been shown to improve the evaluation of disease severity and functional impairment in patients with cardiac amyloidosis [8,11,12]. Based on the findings of Hwang et al. [13], cardiovascular magnetic resonance (CMR) and CPET together serve as a strong complementary predictor of clinical outcomes in patients with hypertrophic cardiomyopathy. However, no studies have comprehensively examined the correlation and role of CPET and quantitative DPD SPECT/CT, especially in patients with ATTR-CM.
Thus, this study aimed to explore the relationship between structural imaging and functional assessment by investigating the correlation between CPET-derived parameters and quantitative DPD SPECT/CT imaging and how these two diagnostic approaches affect patient outcome.

2. Materials and Methods

2.1. Setting and Study Design

The present study was conducted in the frame of a clinical registry (EC #1918/2019 and 1079/2023) at the Department of Internal Medicine II, Division of Cardiology at the Medical University of Vienna. This study was approved by the Ethics Committee of the Medical University of Vienna and conducted according to good clinical practice as outlined in the Declaration of Helsinki. All study participants gave written informed consent prior to enrolment.

2.2. Study Population

Patients with a confirmed diagnosis of ATTR-CM based on validated criteria between 2019 and 2023 at our specialized amyloidosis outpatient clinic were invited to participate in a prospective, clinical follow-up program. The program included regular clinical evaluations and systematic assessments of cardiac function. Eligibility for inclusion required participants (i) to be able to undergo CPET and [99mTc]-DPD bone scintigraphy with additional quantitative thoracic SPECT/CT imaging; (ii) Perugini grade 2 or 3 cardiac uptakes on [99mTc]-DPD bone scintigraphy in the absence of an abnormal serum free light chain ratio and monoclonal immunoglobulin in the serum and urine by immunofixation; and (iii) absence of disease-specific therapy prior to CPET assessment and quantitative [99mTc]-DPD SPECT/CT imaging.

2.3. Diagnosis of Cardiac Transthyretin Amyloidosis

The diagnosis of ATTR-CM was determined based on the presence of HF symptoms combined with imaging findings consistent with ATTR-CM. Planar DPD bone scintigraphy was performed in accordance with the proposed recommendations previously reported by Gillmore et al. [5]. Aside from bone scintigraphy, all patients underwent mandatory screening for paraprotein and monoclonal protein, including the following laboratory tests: serum free light chain assay, as well as serum and urine immunofixation. Gene sequencing was performed if patients had given written consent for genetic analysis.

2.4. Cardiopulmonary Exercise Testing

CPET was conducted using individualized ramp protocols tailored to each patient’s functional status based on subjective daily physical activity and results of the 6MWT at baseline. Data acquisition included breath-by-breath gas analysis (Dual-Monitor Vyntus CPX SN 42600071, Carl Reiner, Vienna, Austria) and continuous ECG and heart monitoring (GE CAM USB CardioSoft 12-channel-PC-ECG, GE Healthcare, Wauwatosa, WI, USA), based on protocols previously described by Willixhofer et al. [8].
All parameters were assessed for up to two minutes during rest, during exercise, and up to 3 minutes during recovery. Analyzed CPET variables included peak VO2, VO2 at anaerobic threshold (AT), peak pulmonary ventilation (VE), peak oxygen pulse (peak O2 pulse), as well as VE/VCO2 slope. Peak VO2 was defined as the highest 30-s value reached and identified by the disproportionate rise in VE relative to VO2. The AT was determined using the V-slope method and validated by ventilatory equivalent and end-tidal methods [14]. Peak O2 pulse was determined by dividing VO2 (mL/min) by heart rate (beats/min). The VE/VCO2 slope was calculated as the slope of the linear relationship between VE and carbon dioxide production (VCO2) from the beginning of loaded exercise to the end of the isocapnic buffering period [15]. Peak VE was calculated by multiplying the respiratory rate by the volume of air exhaled during each breathing cycle (tidal volume).

2.5. Imaging Assessments

2.5.1. DPD Scintigraphy and SPECT/CT Imaging

Nuclear imaging was conducted at the Division of Nuclear Medicine, Medical University of Vienna, using a Symbia Intevo SPECT/CT system (Siemens Medical Solutions AG, Erlangen, Germany). Planar whole-body scintigraphy was performed 2.5 h after intravenous [99mTc]-DPD injection (720.0 MBq), followed by thoracic SPECT/CT imaging at 3.0 h. Imaging used a 180° configuration, 64 views (20 s/view), a 256 × 256 matrix, and a 15% energy window around the 142 keV photopeak. Low-dose CT was acquired for attenuation correction. Reconstruction used xSPECT/CT QUANT technology to standardize uptake values [16]. Planar images were visually graded per the Perugini classification [17], and left ventricle (LV) [99mTc]-DPD uptake on SPECT/CT images was quantified using specialized software (Hermes Hybrid 3D software, Version 2.0, Hermes Medical Solutions, Stockholm, Sweden) on SPECT/CT images. As previously reported, the [99mTc]-DPD retention index was calculated by the ratio of the standardized uptake value (SUV) of peak cardiac uptake to the SUV of peak vertebral uptake, multiplied by the SUV of peak paraspinal muscle uptake [18]. This index provides a normalized measure of amyloid deposition in the heart relative to other tissues, enhancing the specificity of [99mTc]-DPD SPECT/CT imaging for quantifying cardiac LV involvement in amyloidosis.

2.5.2. Cardiac Magnetic Resonance Imaging

Patients underwent cardiac magnetic resonance (CMR) imaging on a 1.5 Tesla scanner (Avanto Fit, Siemens Healthcare GmbH, Erlangen, Germany) according to standard protocols [19]. This included late gadolinium enhancement imaging using gadobutrol (Gadovist, Bayer Vital GmbH, Leverkusen, Germany) and T1-mapping to determine the extracellular volume (ECV).

2.5.3. Transthoracic Echocardiography

Transthoracic echocardiography (TTE) was conducted by certified professionals using state-of-the-art equipment (GE Vivid E95, Vivid E9, and Vivid 7, GE Healthcare, Wauwatosa, WI, USA) following current guidelines [20]. Image interpretation was carried out after the assessment on a contemporary offline clinical workstation equipped with specialized software Version 204 (EchoPAC, GE Healthcare, Wauwatosa, WI, USA) by certified cardiologists.

2.6. Outcome Measures

A systematic search of the Austrian electronic health record system was conducted to assess the vital status and occurrence of heart failure-related hospitalizations among all 44 patients. These data were collected to support the outcome analysis, with the primary outcome defined as a composite of heart failure hospitalization or all-cause death.

2.7. Statistical Analysis

The analyses were performed using SPSS version 29.0 (IBM Corp, New York, NY, USA). Continuous variables were calculated as median and interquartile range (IQR), and categorical variables were reported as numbers and percentages. Comparisons of differences between variables among the two groups were made by the Chi-square test for categorical variables or the Mann–Whitney U test for continuous variables. Spearman correlation coefficients were used for correlation analysis. Survival was analyzed using Cox proportional hazards regression, with results presented as hazard ratios (HR) and corresponding Kaplan–Meier survival curves. Separate univariate and multivariate Cox regression models were used to evaluate the impact of key clinical, CPET, and imaging variables on the composite outcome endpoint. Kaplan–Meier estimate cut-off values for peak VO2 and VE/VCO2 slope were set at 14 mL/kg/min and 40, respectively, as previously reported by Badr Eslam et al. [9]. A significance level of p ≤ 0.05 was adopted for all hypothesis tests.

3. Results

3.1. Study Participants and Baseline Characteristics

The initial cohort consisted of 226 patients diagnosed with cardiac amyloidosis. Further detailed assessment of the cohort based on eligibility for this study led to a substantial reduction in the cohort size. A detailed flow of patient inclusion and exclusion throughout this study is depicted in Figure 1. The final study cohort included 44 patients with ATTR-CM, of whom 82% were male, with a median age of 78 (73.0–78.0) years. TTR gene sequencing identified 5 patients (11%) with a variant form (ATTRv-CM). In our cohort, the following mutations were observed: His108Arg (n = 4), Thr69Ile (n = 1). Study participants were divided into two cohorts based on the median [99mTc]-DPD retention index– low uptake cohort (≤5.0, n = 22) and high uptake cohort (>5.0, n = 22).
Baseline characteristics were assessed for the overall group and the two subgroups (Table 1). Key demographic data such as age, sex, and mean body mass index (BMI) showed no significant differences between the groups. Participants demonstrated varying degrees of functional impairment, as reflected in the distribution across New York Heart Association (NYHA) classes II and III, with 50 and 36%, respectively. The median distance covered in the 6 min walk test (6MWT) was 422.0 m (IQR: 366.1–458.3). TTE demonstrated a highly thickened interventricular septum (18.0 mm, IQR: 17.4–20.2) and a preserved ejection fraction (51.0%; IQR: 47.1–53.0). Left ventricular dimensions remained stable, with an end-diastolic diameter of 43.0 mm (IQR: 42.0–45.5). However, left ventricular global longitudinal strain was notably reduced (12.0%; IQR: 13.5–11.4), which indicates a myocardial dysfunction.
The prevalence of coronary artery disease was significant between the low and high DPD uptake groups (45.0% vs. 14.0%, p = 0.045). Cardiac biomarker analysis showed a notable difference in NT-proBNP level (1364.0 vs. 2341.0 pg/mL, p = 0.029). CPET results indicated impaired functional capacity, with a median peak VO2 of 16.1 in the low uptake group and 12.7 mL/min/kg in the high uptake group, and VE/VCO2 slope of 39.2 and 39.7, respectively. Furthermore, peak workload was more impaired in the high uptake group with only 56 Watts, compared to the low uptake cohort, which reached 90 Watts (p = 0.003).

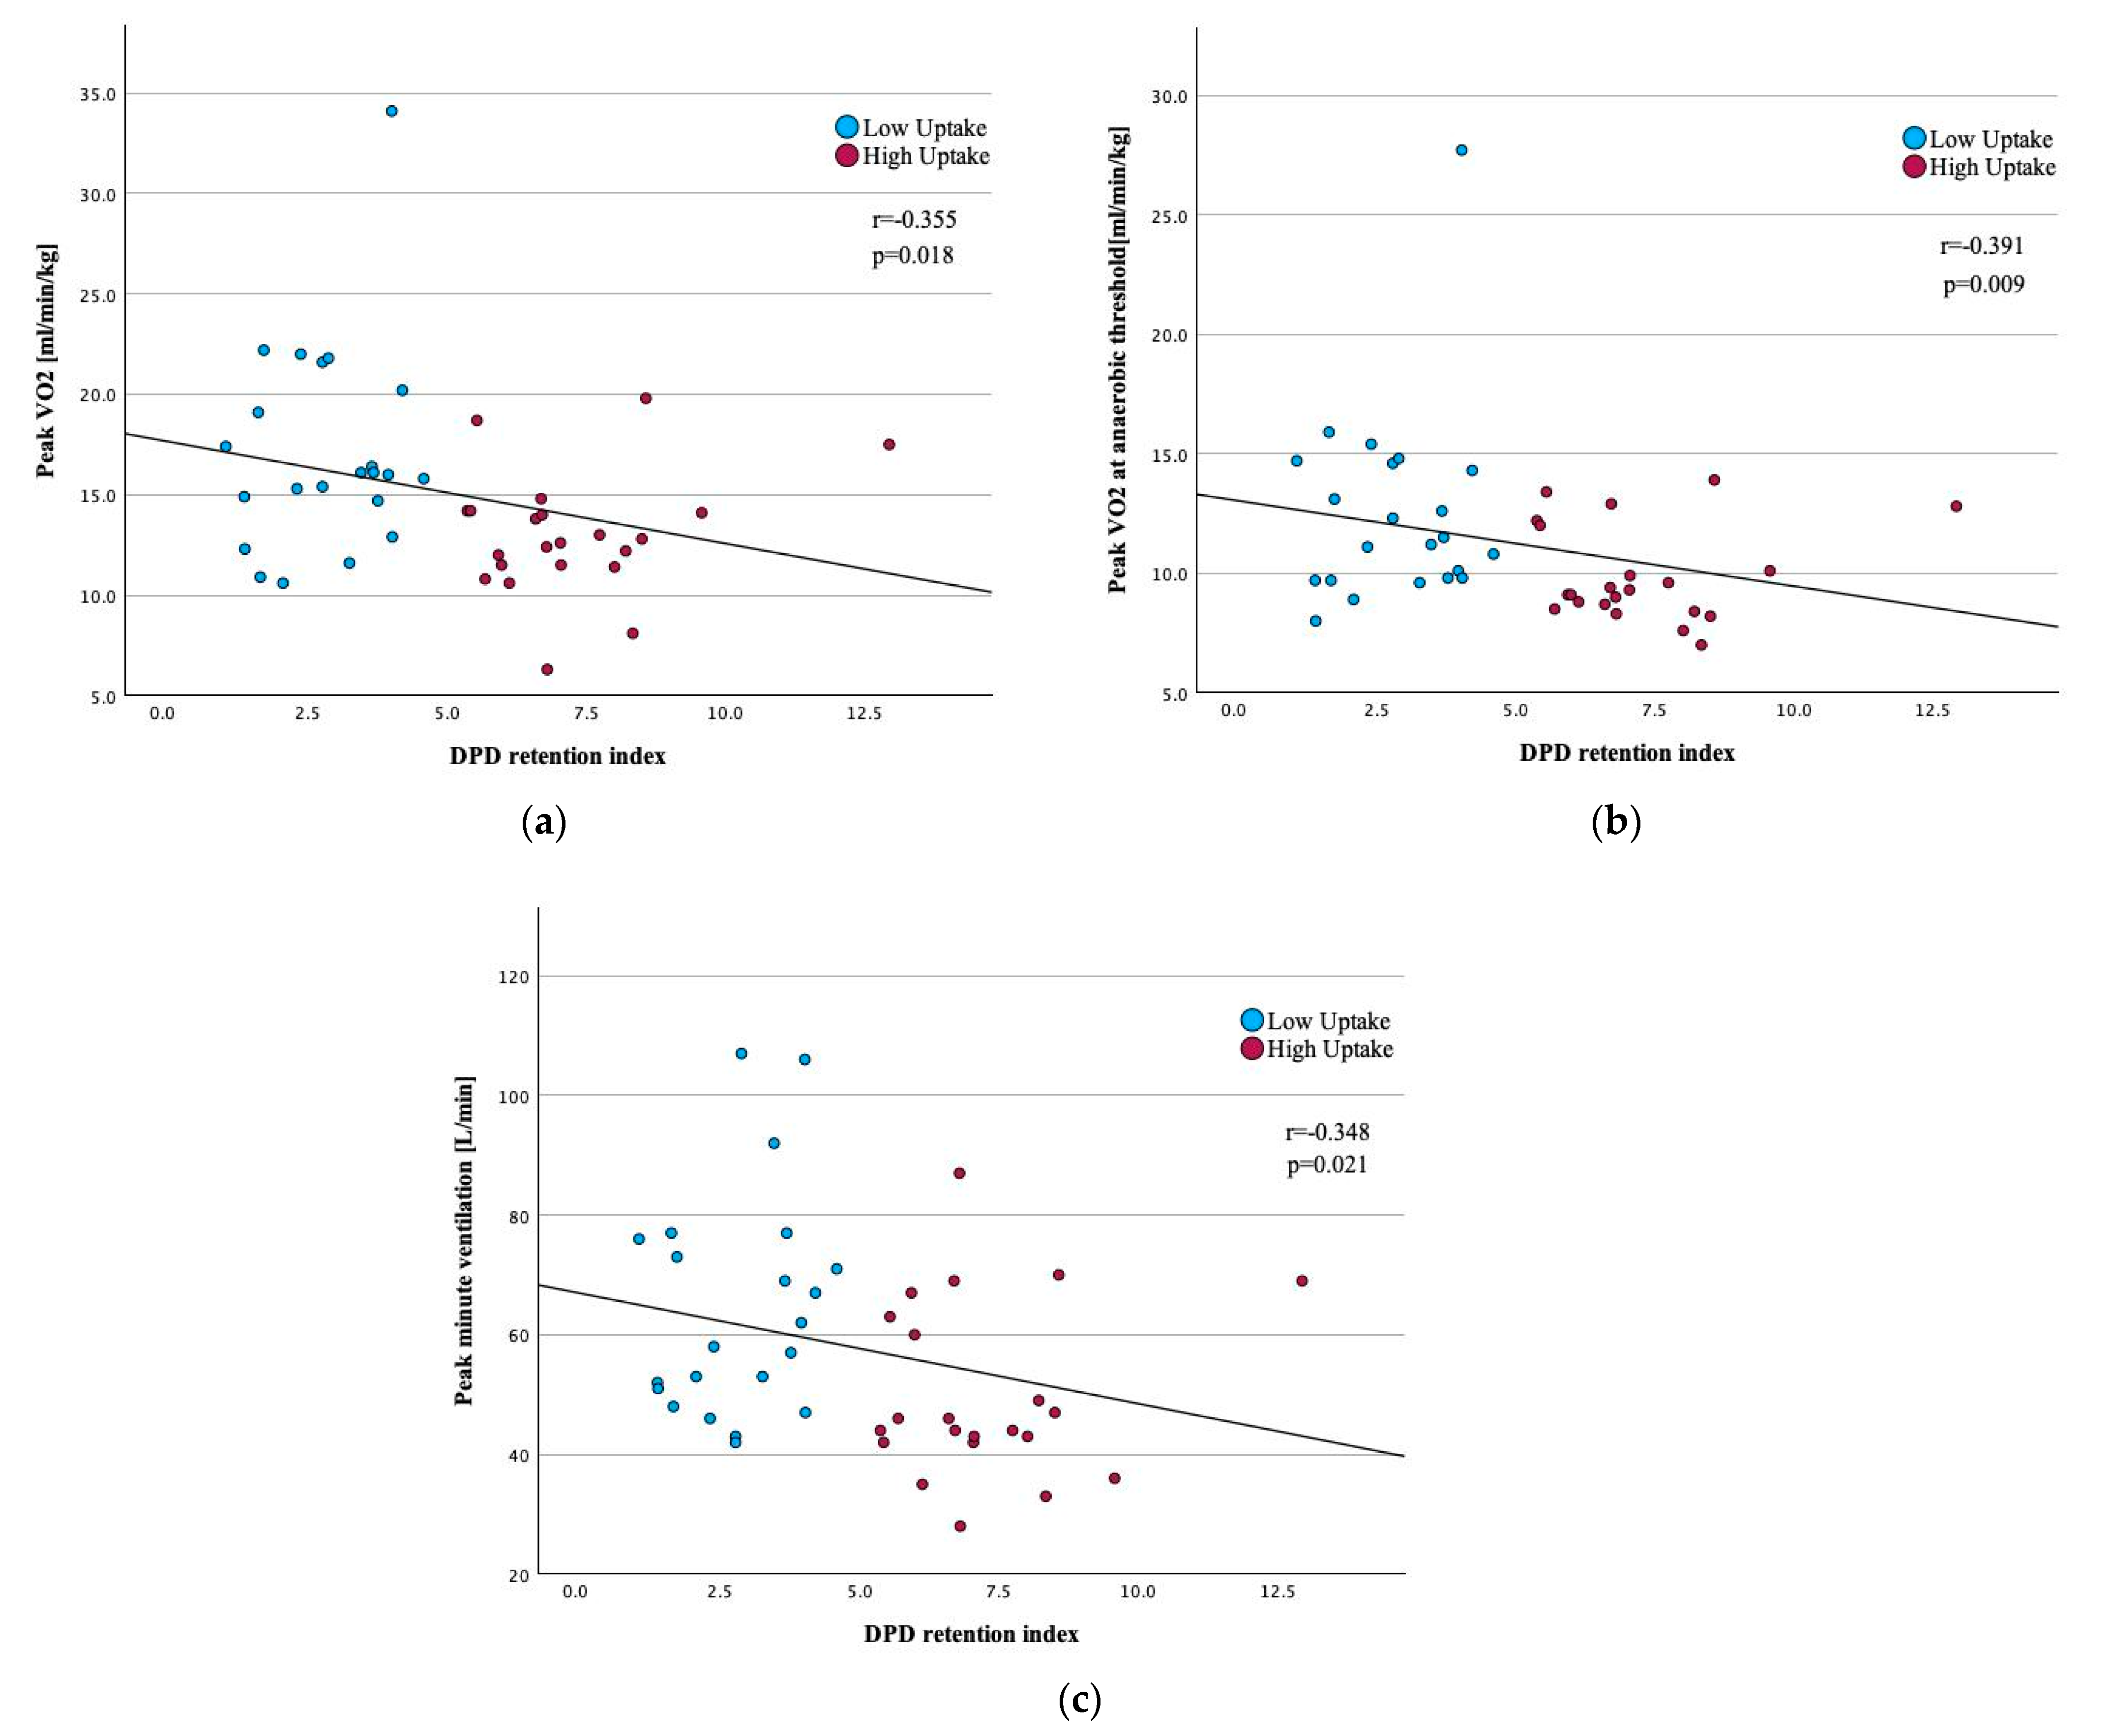
3.2. Correlation Between CPET Variables and Quantitative LV [99mTc]-DPD Uptake

The correlation between CPET variables and the [99mTc]-DPD retention index revealed a significant relationship, which indicates the impact of amyloid burden on functional capacity in patients with ATTR-CM. Peak VO2 demonstrated a moderate negative correlation with [99mTc]-DPD retention index (r = −0.355, p = 0.018), as illustrated in Figure 2a. Similarly, VO2 at AT showed a stronger negative correlation (r = −0.391, p = 0.009), depicted in Figure 2b. Additionally, peak VE correlated negatively with quantitative LV [99mTc]-DPD uptake (r = −0.348, p = 0.021), as shown in Figure 2c. Further correlation results are provided in Table 2.

3.3. Correlation Between CPET, LV [99mTc]-DPD Quantification and Key Clinical, Laboratory, and Imaging Parameters

Considering the multifaceted impact of transthyretin amyloidosis, significant correlations were observed between key CPET parameters, [99mTc]-DPD retention index, and various clinical, laboratory, and imaging metrics. Notably, an advanced stage of HF showed a significant negative correlation with peak VO2 (r = −0.549, p < 0.001). Conversely, this parameter positively correlated with VE/VCO2 slope as well as [99mTc]-DPD retention index (r = 0.324, p = 0.032). Expectedly, both CPET parameters correlated with the 6MWT distance (peak VO2: r = 0.384, p = 0.010, VE/VCO2 slope: r = −0.451, p < 0.001).
Markers of cardiac and renal function were also evaluated and showed significant correlations with CPET-derived variables. Higher NT-proBNP levels were strongly associated with lower peak VO2 (r = −0.530, p < 0.001) and higher VE/VCO2 slope (r = 0.348, p = 0.022). Troponin T, similarly, correlated negatively with peak VO2 (r = −0.431, p < 0.001) and positively with VE/VCO2 slope (r = 0.587, p < 0.001). eGFR displayed a positive correlation with peak VO2 (r = 0.402, p < 0.001) and negative with VE/VCO2 slope (r = −0.390, p < 0.001).
While most echocardiographic measures showed no significant correlation with CPET or quantitative [99mTc]-DPD indices, right ventricle global longitudinal strain exhibited a negative correlation with peak VO2 (r = −0.350, p = 0.023). Interestingly, only the right ventricle ejection fraction and native T1 time showed a notable correlation with peak VO2 and VE/VCO2 slope (r = 0.374, p = 0.038 and r = 0.464, p < 0.001, respectively). Further information is provided in Table 3.

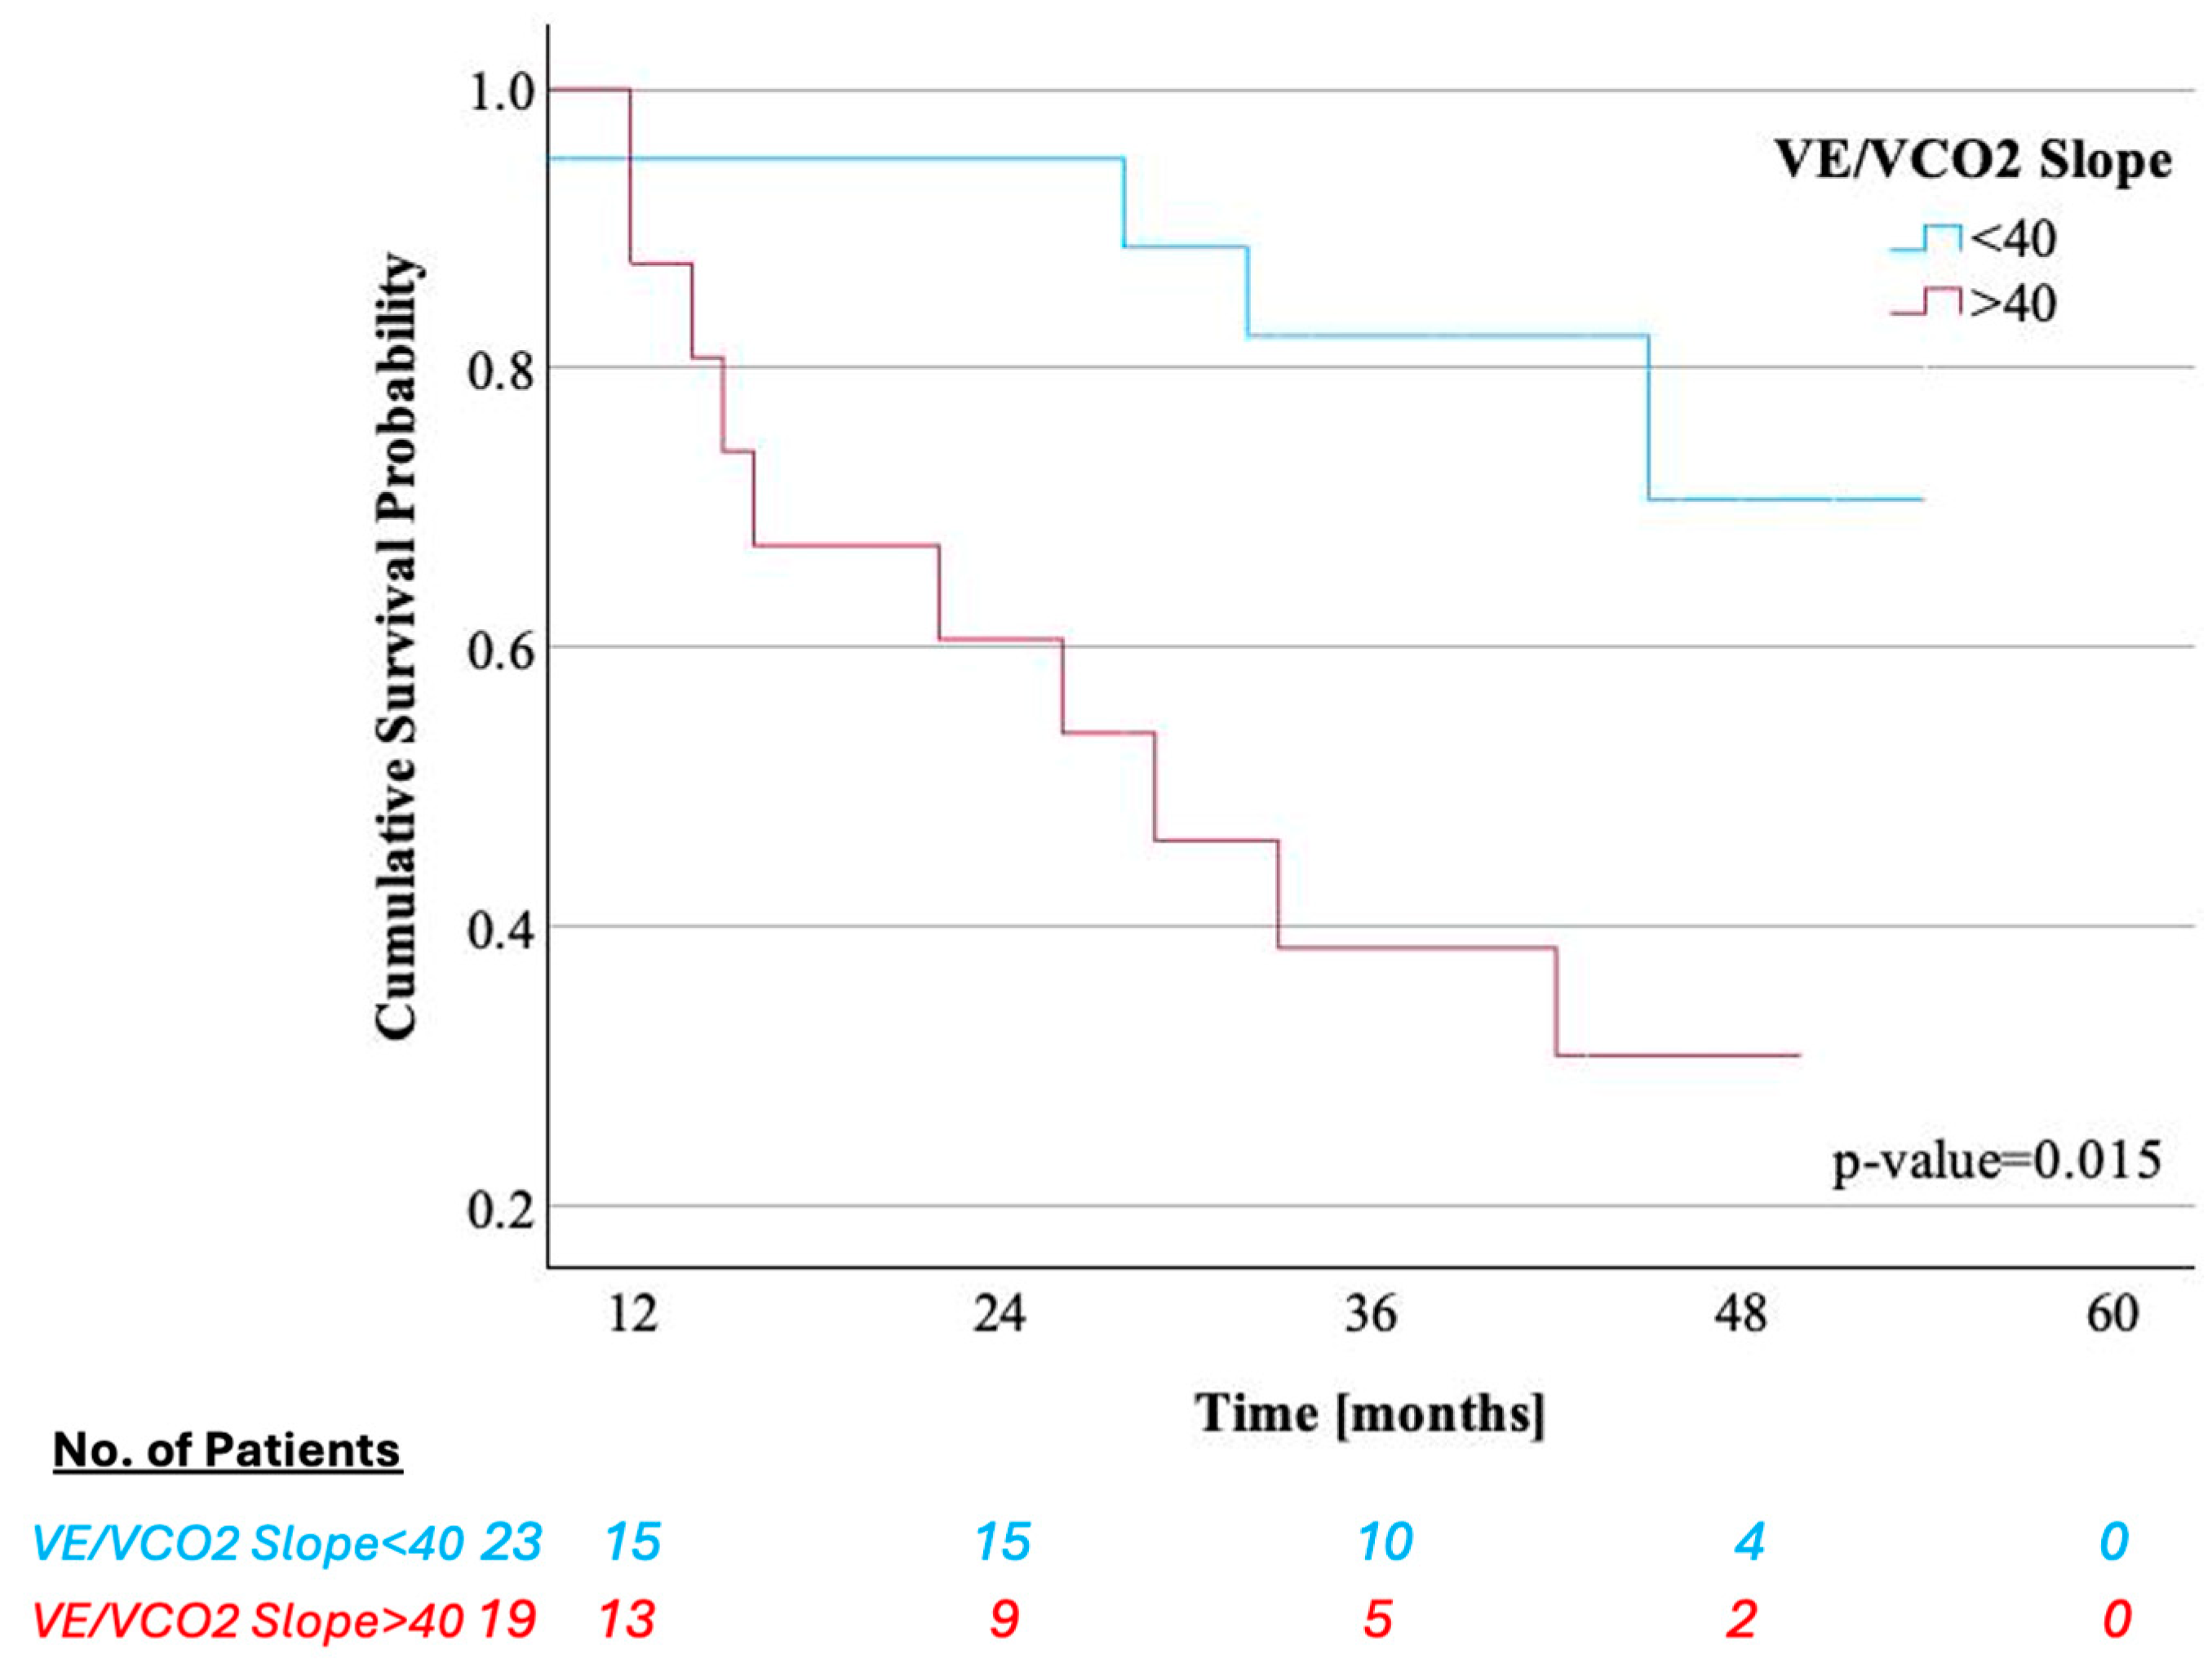
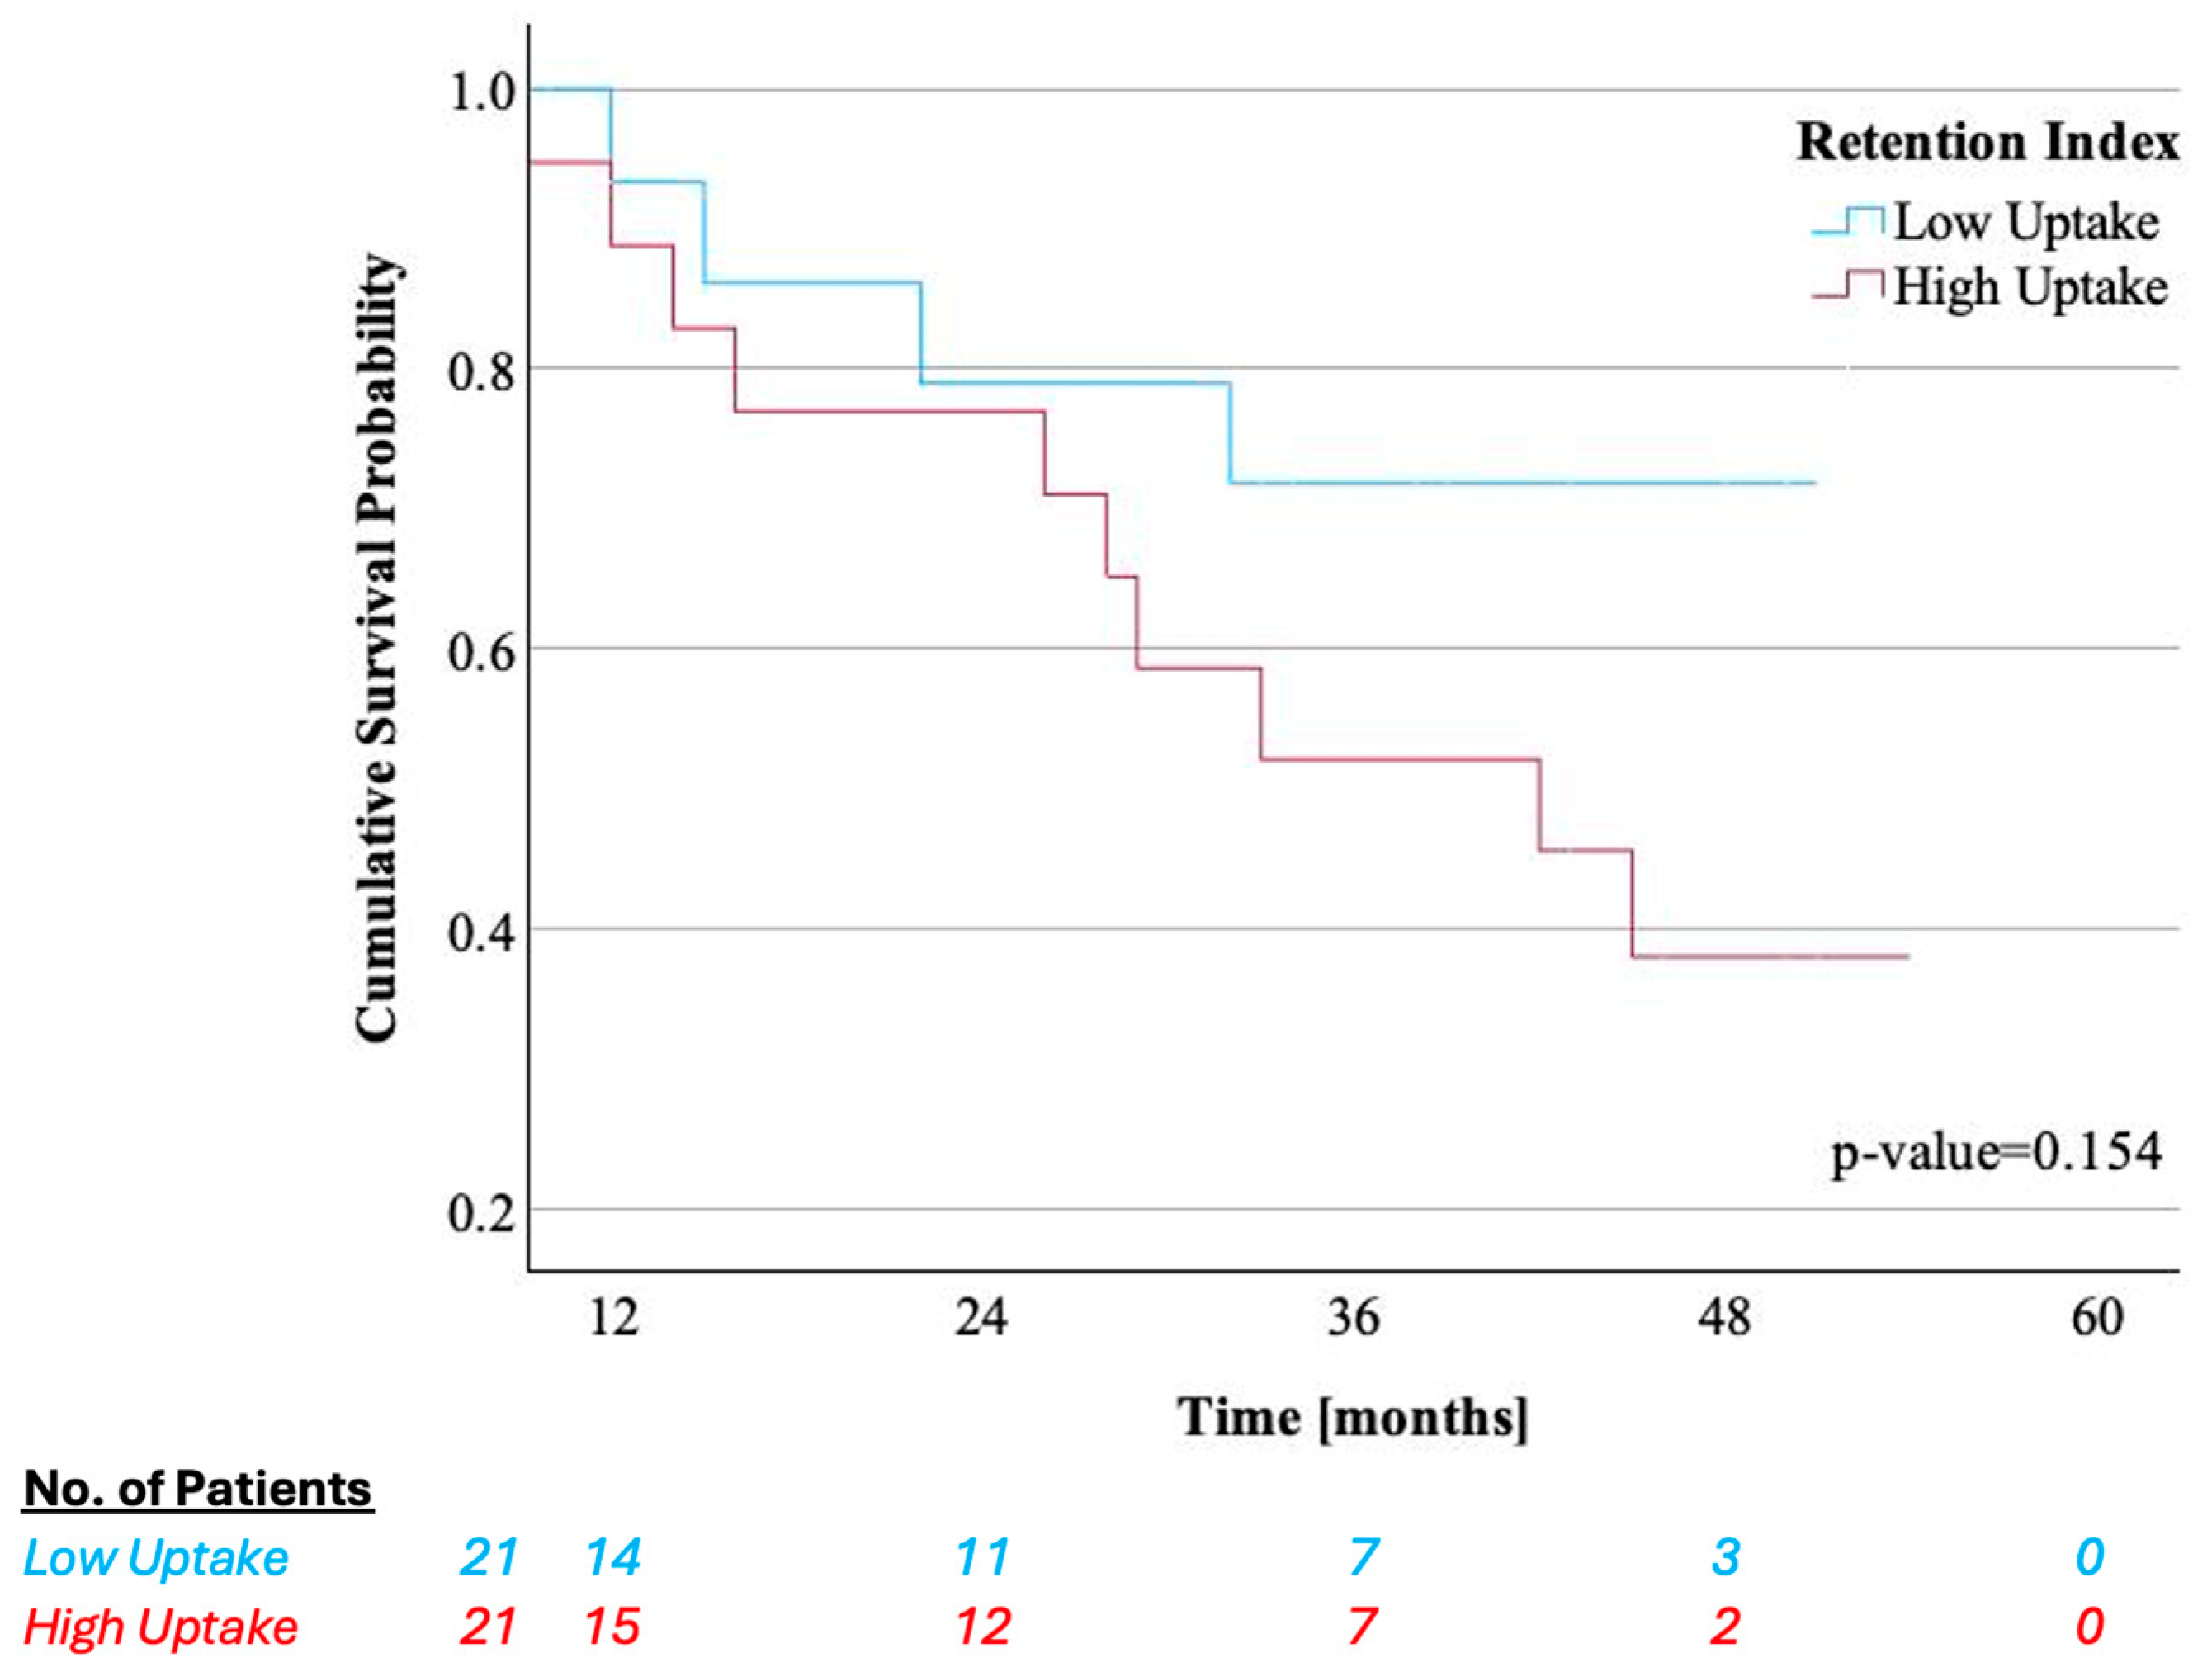
3.4. Association of Key CPET Variables and Quantitative LV [99mTc]-DPD Uptake with Survival and HF Hospitalizations

In the overall study cohort of 44 patients diagnosed with ATTR-CM, over a median follow-up period of 28.0 months (IQR: 8.0–43.0), there were 14 composite events of cardiovascular death or HF hospitalization. Among the patients (n = 19) with a peak VO2 below 14 mL/min/kg, nine patients (47%) reached the combined endpoint. In contrast, among those with a peak VO2 above 14, only 5 patients (20%) experienced the combined endpoint. Although the difference was not statistically significant, a positive trend toward event-free survival was observed for the patients with better baseline peak VO2 in Kaplan–Meier analysis [p = 0.076, HR 0.384 (95% Confidence interval (CI):0.128–1.151), p = 0.088], as illustrated in Figure A1.
The Kaplan–Meier survival curves illustrated clear survival discrepancies between the two groups defined by VE/VCO2 slope with a cut-off of 40. The group with a poorer VE/VCO2 slope (n = 20) demonstrated notably lower survival probability compared to the other group with a better VE/VCO2 slope, with 50% (n = 10) of patients reaching the combined endpoint [p = 0.015, HR 3.843 (95% CI:1.193–12.381), p = 0.024], as depicted in Figure A2.
Among the groups defined by [99mTc]-DPD retention index, each consisting of 22 patients, the high [99mTc]-DPD uptake cohort experienced a greater number of events [n = 10 (45.5%) vs. n = 4 (18%)]. The higher event rate in the high [99mTc]-DPD group highlights a trend toward worse outcomes, though the difference was not statistically significant [p-value = 0.154, HR 2.274 (95% CI: 0.711–7.272), p = 0.166]. The Kaplan–Meier curves are represented in Figure A3.
Univariable Cox regression analysis for the combined endpoint demonstrated that following laboratory parameters: Troponin T (p = 0.017), eGFR (p = 0.007), along with CMR imaging native T1 time (p = 0.004), as well as CPET parameters such as peak VO2 (p = 0.019) and VO2 at anaerobic threshold (p = 0.016), were significant predictors of worse outcomes. After adjusting for these variables in a multivariable Cox regression model, only T1-Mapping remained as a significant predictor of adverse outcomes (p = 0.011). Detailed information can be found in Table A1.

4. Discussion

In this study, we investigated the relationship between functional capacity, as assessed by CPET, and quantitative LV [99mTc]-DPD uptake in patients with ATTR-CM. Our analyses were focused on the interactions between these diagnostic and disease monitoring tools and their predictive capabilities for patient outcomes.
This is the first study that describes a significant inverse correlation between CPET-derived metrics, such as peak VO2, and [99mTc]-DPD retention index, highlighting a functional impairment with rising myocardial amyloid burden. The second highlight of this study is a strong association between CPET metrics and essential clinical parameters, such as NYHA functional class and 6MWT. Furthermore, we demonstrated that higher quantitative cardiac [99mTc]-DPD uptake and poorer CPET metrics were linked to a notably increased risk of adverse clinical outcomes.
The reduction in functional capacity due to amyloid burden is not merely a marker of disease severity but also a direct contributor to the symptomatic profile of ATTR-CM [21]. Patients with higher amyloid load, as defined by the greater LV [99mTc]-DPD uptake, typically experience worse clinical outcomes and reduced quality of life due to diminished physical capacity [18,22]. Previous studies [23,24] have described that the amyloid proteins deposited in the extracellular matrix increase myocardial stiffness, which further directly impairs the ability of the heart to pump effectively and fill adequately during the cardiac cycle. These physiological changes significantly impact patients’ physical capacity, manifesting as reduced exercise tolerance that can be quantitatively measured through CPET metrics such as peak VO2 and VE/VCO2 slope [8,12]. By integrating both tools into patient monitoring, clinicians can assess the visible and functional amyloid burden more effectively. For example, a decline in CPET metrics alongside an increase in LV [99mTc]-DPD uptake might indicate a progression of disease before clinical symptoms worsen, prompting earlier intervention. Conversely, improvements in CPET metrics could reflect a positive response to therapy, even before changes in LV [99mTc]-DPD uptake are evident. Thus, our findings suggest that the combined use of CPET and quantitative [99mTc]-DPD SPECT/CT, alongside clinical, laboratory, and imaging assessments, can provide a comprehensive assessment by correlating the extent of amyloid deposition with its functional impact.
To assess FC, we performed not only CPET as the gold standard, but also 6MWT. Despite similar 6MWT performance between groups, CPET parameters identified a remarkable difference between the two study groups, as shown in Table 1. While 6MWT is a submaximal test, it primarily reflects the patient’s ability to perform daily activities. It lacks the sensitivity to distinguish subtle differences in cardiopulmonary function between patients at varying stages of disease. In contrast, CPET is a maximal effort test that provides an integrated assessment of the cardiovascular, pulmonary, and muscular systems. Key CPET-derived metrics offer detailed physiological insight into both cardiac and peripheral muscle/metabolic limitations to exercise. This allows CPET to uncover impairments even when 6MWT shows preserved performance.
In our study, patients in the high LV [99mTc]-DPD uptake cohort exhibited significantly elevated levels of NT-proBNP, reflecting increased myocardial wall stress and disease severity, and reduced eGFR compared to those in the low LV [99mTc]-DPD uptake cohort (Table 1). Elevated NT-proBNP, a marker of cardiac stress and dysfunction, and decreased eGFR, indicative of renal impairment, are both reflective of the advanced disease stage, as previously introduced by Gillmore et al. [25]. In cardiac amyloidosis, amyloid deposition stiffens the ventricular walls, impairing diastolic filling and resulting in elevated intracardiac pressures. This hemodynamic burden, especially under conditions of volume overload, is a major stimulus for NT-proBNP synthesis and release. Our analysis also revealed that the parameters used in the National Amyloidosis Center staging system correlate significantly with CPET outcomes. Higher NT-proBNP and lower eGFR were associated with worse CPET metrics, such as reduced peak VO2 and higher VE/VCO2 slope (Table 3). These correlations are evident in our data and underscore the CPET’s ability to reflect broader exercise physiological disruptions caused by amyloidosis.
Further exacerbating the clinical scenario is the NYHA classification, where more patients in the high DPD uptake group were classified as NYHA Class III. The predominance of NYHA Class III in the high uptake group underscores the severity of heart failure in these patients and the substantial impact of amyloid deposition on cardiac function [26]. In our study, we observed a significant correlation between higher NYHA classes and both increased [99mTc]-DPD uptake and poor CPET metrics. This correlation is pivotal because it links quantitative measures of myocardial amyloid burden and functional impairment directly with patient-reported symptom severity.
Consistent with findings from previous studies, our analysis confirmed the impairment of the right ventricle in patients with ATTR-CM [27,28]. This early dysfunction is particularly manifest in the reduced strain and ejection fraction of the right ventricle, which are sensitive indicators of early myocardial damage before overt clinical symptoms become apparent. The relationship between reduced peak VO2 and right ventricle dysfunction underscores the systemic nature of cardiac amyloidosis, where amyloid deposition not only affects myocardial stiffness and ventricular filling but also the contractile efficiency of the heart.
In ATTR-CM, understanding the relationship between disease progression and patient outcomes is crucial for effective management. In our study, we explored the implications of cardiac functional assessments and myocardial amyloid burden on the outcomes of patients with ATTR-CM. Many studies have demonstrated the useful prognostic utility of key CPET parameters in patients with cardiac amyloidosis [9,29,30]. Based on the established cut-off of 14 mL/min/kg for peak VO2 [9,31], we were able to confirm this in our study cohort. Patients with peak VO2 above this threshold generally exhibited better survival rates, underscoring peak VO2 as a crucial indicator of physical health and cardiac function in ATTR-CM (Figure A1).
Another important prognostic CPET marker, VE/VCO2 Slope, provides insight into ventilatory efficiency and has been shown in our study to significantly impact survival (Figure A2). Patients with VE/VCO2 Slope greater than 40 had markedly worse survival, which also corresponded with a few previous studies [9,32].
Recent findings by Pugliatti et al. have shown that CPET is a sensitive tool for detecting functional improvement following tafamidis therapy, even when echocardiographic parameters remain unchanged. This reinforces the value of CPET not only for baseline risk stratification but also for longitudinal monitoring of treatment response [33].
Although the prognostic value and accuracy of LV [99mTc]-DPD quantification with SPECT/CT imaging have been established in several studies [18,34], we could show only a trend towards poorer survival in the high uptake cohort. Despite the lack of statistical significance, which may be attributed to the small sample size, this diagnostic tool remains crucial for patient risk stratification.

5. Limitations

This study, while providing valuable insights into the prognostic utility of CPET and DPD SPECT/CT imaging in ATTR-CM, has several limitations that must be mentioned. First, the data were collected from a single center, which may limit the generalizability of the findings. The patient population at a single institution may not fully represent the broader demographic and genetic diversity of ATTR-CM patients. Multicenter studies would be beneficial to validate our findings across diverse populations and healthcare settings. Secondly, the small sample size of our cohort limits the statistical power of this study, which may contribute to the lack of significant findings in some of the survival analyses. This limitation is particularly relevant when assessing the impact of high DPD uptake on survival, where the trend observed did not reach statistical significance. Another potential limitation of our study is the influence of polyneuropathy on CPET performance. Since peripheral neuropathy can impair muscle strength and coordination, it may affect the exercise capacity independently of cardiac function. However, in our cohort, the prevalence of polyneuropathy was comparable between the low and high DPD uptake groups, minimizing the risk of confounding in our comparative analysis.

6. Conclusions

Our findings suggest that the assessment of myocardial amyloid burden through LV [99mTc]-DPD uptake quantification, coupled with regular CPET evaluations, should be considered integral to the management of ATTR-CM. Such an approach not only aids in diagnosing and staging the disease but also provides valuable prognostic information that can guide clinical decisions aimed at improving patient outcomes.

Author Contributions

Conceptualization, N.E., R.R., R.W., C.K. and R.B.E.; methodology, N.E., R.R., R.C. and R.B.E.; validation, J.B.-K. and R.B.E.; formal analysis, M.P., L.M.S., F.D., C.B., D.B., C.L., M.H. and A.K.; investigation, J.B.-K., R.C. and R.B.E.; resources, M.P., L.M.S., M.E., D.B., C.L. and M.H.; data curation, A.K., J.K., J.B.-K., R.C. and R.B.E.; writing—original draft preparation, N.E. and R.R.; writing—reviewing and editing, N.E., R.R., R.W., C.K., M.P., L.M.S., F.D., C.B., R.C. and R.B.E.; visualization, N.E. and R.R.; supervision, R.C. and R.B.E.; project administration, R.B.E.; funding acquisition, R.B.E. All authors have read and agreed to the published version of the manuscript.

Funding

This research was funded by the Mayor of Vienna, grant number 22005.

Institutional Review Board Statement

This study was conducted in accordance with the Declaration of Helsinki and approved by the Institutional Ethics Committee of the Medical University of Vienna (EC #1918/2019 on 20 November 2019 and 1079/2023 on 27 July 2023).

Informed Consent Statement

Informed consent was obtained from all subjects involved in this study.

Data Availability Statement

Data will be shared upon reasonable request to the corresponding author.

Acknowledgments

We want to thank all our personnel and participants for their contribution to this study.

Conflicts of Interest

The authors declare no conflicts of interest.

Abbreviations

The following abbreviations are used in this manuscript:
6MWT6 min walk test
ATTR-CMTransthyretin amyloid cardiomyopathy
ATAnaerobic threshold
BMIBody mass index
CMRCardiac magnetic resonance
CPETCardiopulmonary exercise testing
[99mTc]-DPD[99mTc]-3,3-diphosphono-1,2-propanodicarboxylic acid
ECVExtracellular volume
FCFunctional capacity
HFHeart failure
LVLeft ventricle
NYHANew York Heart Association
[99mTc]-PYP[99mTc]-pyrophosphate
SPECT/CTSingle photon emission computed tomography/computed tomography
TTETransthoracic echocardiography
VCO2Carbon dioxide production
VEPulmonary ventilation
VE/VCO2 slopeVentilation to carbon dioxide production
VO2Oxygen consumptions

Appendix A

Table A1. Cox regression analysis for the composite endpoint.
Variables Hazard Ratio (95% CI) p-Value Hazard Ratio (95% CI) p-Value
Univariable RegressionMultivariable Regression
Demographic and clinical parameters
Age, years 0.965 (0.908–1.026)0.252
Sex, Male 0.553 (0.173–1.768)0.318
Body Mass Index, kg/m21.015 (0.923–1.116)0.762
NYHA Functional Class ≥ III 2.216 (0.740–6.636)H00.155
6-min Walk Distance, m 0.999 (0.995–1.003)0.694
Concomitant medication
Beta-blockers 0.947 (0.316–2.842)0.923
MRA 2.849 (0.791–10.262)0.109
Diuretics 3.404 (0.444–26.077)0.238
Laboratory parameters
NT-proBNP, pg/mL 1.000 (1.000–1.000)0.422
Troponin T, ng/L 1.022 (1.004–1.041)0.0171.026 (0.985–1.069)0.213
eGFR, mL/min/1.73 m20.967 (0.944–0.991)0.0070.985 (0.927–1.045)0.612
Cardiopulmonary Exercise Testing
Peak VO2, mL/min/kg 0.831 (0.712–0.970)0.0190.681 (0.327–1.415)0.303
VO2 at AT, mL/min/kg 0.593 (0.387–0.908)0.0161.016 (0.431–2.397)0.970
Peak O2 Pulse, mL/beat 0.860 (0.726–1.018)0.079
VE/VCO2 slope 1.040 (0.979–1.104)0.206
Peak workload, Watt 0.988 (0.968–1.008)0.230
Peak VE, L/min 0.981 (0.951–1.012)0.234
Nuclear imaging parameters
Perugini Grading Scale 2.287 (0.637–8.210)0.205
DPD retention index 1.164 (0.951–1.423)0.141
Transthoracic echocardiography parameters
Interventricular septum, mm 0.985 (0.874–1.110)0.802
LV ejection fraction, % 0.992 (0.939–1.048)0.776
LV end-diastolic diameter, mm 1.013 (0.932–1.101)0.760
LV global longitudinal strain, -% 1.058 (0.919–1.218)0.430
RV end-diastolic diameter, mm 1.016 (0.924–1.116)0.750
RV global longitudinal strain, -% 1.048 (0.947–1.159)0.366
Cardiac magnetic resonance imaging parameters n = 32n = 17n = 15
Interventricular septum, mm 1.039 (0.943–1.146)0.438
LV ejection fraction, % 1.013 (0.956–1.074)0.653
RV ejection fraction, % 1.001 (0.947–1.057)0.979
MOLLI-ECV, % 1.043 (0.975–1.115)0.218
Native T1 time, ms 1.011 (1.004–1.019)0.0041.017 (1.004–1.030)0.011
Abbreviations: AT, anaerobic threshold; CI, confidence interval; DPD, [99mTc]-3,3-diphosphono-1,2-propanodicarboxylic acid; ECV, extracellular volume; eGFR, estimated glomerular filtration rate; LV, left ventricle; MRA, mineralocorticoid receptor antagonist; NT-proBNP, N-terminal prohormone of brain natriuretic peptide, NYHA, New York Heart Association functional class; RV, right ventricle; VE, minute ventilation; VE/VCO2 ventilation to cardon dioxide production; VO2, oxygen consumption.

Appendix B

Figure A1. Kaplan–Meier estimates for the composite outcome (heart failure hospitalization or all-cause death) with peak oxygen uptake cut-off.
Jcm 14 02999 g0a1
Figure A2. Kaplan–Meier estimates for the composite outcome (heart failure hospitalization or all-cause death) with VE/VCO2 slope cut-off.
Jcm 14 02999 g0a2
Figure A3. Kaplan–Meier estimates for the composite outcome (heart failure hospitalization or all-cause death) with DPD retention index.
Jcm 14 02999 g0a3

References

  1. Bloom, M.W.; Gorevic, P.D. Cardiac Amyloidosis. Ann. Intern. Med. 2023, 176, Itc33–Itc48. [Google Scholar] [CrossRef]
  2. Kittleson, M.M.; Ruberg, F.L.; Ambardekar, A.V.; Brannagan, T.H.; Cheng, R.K.; Clarke, J.O.; Dember, L.M.; Frantz, J.G.; Hershberger, R.E.; Maurer, M.S.; et al. 2023 ACC Expert Consensus Decision Pathway on Comprehensive Multidisciplinary Care for the Patient with Cardiac Amyloidosis: A Report of the American College of Cardiology Solution Set Oversight Committee. J. Am. Coll. Cardiol. 2023, 81, 1076–1126. [Google Scholar] [CrossRef] [PubMed]
  3. Achten, A.; van Empel, V.P.M.; Weerts, J.; Mourmans, S.; Beckers-Wesche, F.; Spanjers, M.; Gingele, A.; Rocca, H.-P.B.-L.; Wijk, S.S.-V.; Knackstedt, C. Changes in the diagnostic trajectory of transthyretin cardiac amyloidosis over six years. Heart Vessel. 2024, 39, 857–866. [Google Scholar] [CrossRef] [PubMed]
  4. Gertz, M.A.; Benson, M.D.; Dyck, P.J.; Grogan, M.; Coelho, T.; Cruz, M.; Berk, J.L.; Plante-Bordeneuve, V.; Schmidt, H.H.J.; Merlini, G. Diagnosis, Prognosis, and Therapy of Transthyretin Amyloidosis. J. Am. Coll. Cardiol. 2015, 66, 2451–2466. [Google Scholar] [CrossRef]
  5. Gillmore, J.D.; Maurer, M.S.; Falk, R.H.; Merlini, G.; Damy, T.; Dispenzieri, A.; Wechalekar, A.D.; Berk, J.L.; Quarta, C.C.; Grogan, M.; et al. Nonbiopsy Diagnosis of Cardiac Transthyretin Amyloidosis. Circulation 2016, 133, 2404–2412. [Google Scholar] [CrossRef] [PubMed]
  6. Khor, Y.M.; Cuddy, S.A.M.; Singh, V.; Falk, R.H.; Di Carli, M.F.; Dorbala, S. (99m)Tc Bone-Avid Tracer Cardiac Scintigraphy: Role in Noninvasive Diagnosis of Transthyretin Cardiac Amyloidosis. Radiology 2023, 306, e221082. [Google Scholar] [CrossRef]
  7. Mehta, P.; Chapel, D.B.; Goyal, N.; Yu, D.B.; Mor-Avi, V.; Narang, A.; Addetia, K.; Sarswat, N.; Lang, R.M.; Husain, A.N.; et al. A histopathologic schema to quantify the burden of cardiac amyloidosis: Relationship with survival and echocardiographic parameters. Echocardiography 2019, 36, 285–291. [Google Scholar] [CrossRef]
  8. Willixhofer, R.; Rettl, R.; Kronberger, C.; Ermolaev, N.; Gregshammer, B.; Duca, F.; Binder, C.; Kammerlander, A.; Alasti, F.; Kastner, J.; et al. Cardiopulmonary exercise testing in transthyretin amyloid cardiomyopathy patients: A long-term follow-up study. J. Cardiovasc. Med. 2024, 25, 704–712. [Google Scholar] [CrossRef]
  9. Badr Eslam, R.; Öztürk, B.; Rettl, R.; Capelle, C.D.J.; Qin, H.; Binder, C.; Dachs, T.-M.; Ligios, L.C.; Duca, F.; Dalos, D.; et al. Impact of Tafamidis and Optimal Background Treatment on Physical Performance in Patients with Transthyretin Amyloid Cardiomyopathy. Circ. Heart Fail. 2022, 15, e008381. [Google Scholar] [CrossRef]
  10. Willixhofer, R.; Ermolaev, N.; Kronberger, C.; Eslami, M.; Vilsmeier, J.; Rettl, R.; Nitsche, C.; Kammerlander, A.; Bergler-Klein, J.; Kastner, J.; et al. Prognostic Value of Submaximal Cardiopulmonary Exercise Testing in Patients with Cardiac Amyloidosis. Circ. Rep. 2025, 7, 76–85. [Google Scholar] [CrossRef]
  11. McDonagh, T.A.; Metra, M.; Adamo, M.; Gardner, R.S.; Baumbach, A.; Böhm, M.; Burri, H.; Butler, J.; Čelutkienė, J.; Chioncel, O.; et al. 2021 ESC Guidelines for the diagnosis and treatment of acute and chronic heart failure. Eur. Heart J. 2021, 42, 3599–3726. [Google Scholar] [CrossRef] [PubMed]
  12. Nicol, M.; Deney, A.; Lairez, O.; Vergaro, G.; Emdin, M.; Carecci, A.; Inamo, J.; Montfort, A.; Neviere, R.; Damy, T.; et al. Prognostic value of cardiopulmonary exercise testing in cardiac amyloidosis. Eur. J. Heart Fail. 2021, 23, 231–239. [Google Scholar] [CrossRef]
  13. Hwang, J.W.; Lee, S.C.; Kim, D.; Kim, J.; Kim, E.K.; Chang, S.A.; Park, S.-J.; Kim, S.M.; Choe, Y.H.; Park, S.W. Role of cardiovascular magnetic resonance imaging and cardiopulmonary exercise test in predicting composite clinical outcomes in patients with hypertrophic cardiomyopathy. PLoS ONE 2023, 18, e0285887. [Google Scholar] [CrossRef] [PubMed]
  14. Carriere, C.; Corrà, U.; Piepoli, M.; Bonomi, A.; Merlo, M.; Barbieri, S.; Salvioni, E.; Binno, S.; Mapelli, M.; Righini, F.; et al. Anaerobic Threshold and Respiratory Compensation Point Identification During Cardiopulmonary Exercise Tests in Chronic Heart Failure. Chest 2019, 156, 338–347. [Google Scholar] [CrossRef]
  15. Tabet, J.Y.; Beauvais, F.; Thabut, G.; Tartière, J.M.; Logeart, D.; Cohen-Solal, A. A critical appraisal of the prognostic value of the VE/VCO2 slope in chronic heart failure. Eur. J. Cardiovasc. Prev. Rehabil. 2003, 10, 267–272. [Google Scholar] [CrossRef]
  16. Ramsay, S.C.; Lindsay, K.; Fong, W.; Patford, S.; Younger, J.; Atherton, J. Tc-HDP quantitative SPECT/CT in transthyretin cardiac amyloid and the development of a reference interval for myocardial uptake in the non-affected population. Eur. J. Hybrid Imaging 2018, 2, 17. [Google Scholar] [CrossRef]
  17. Perugini, E.; Guidalotti, P.L.; Salvi, F.; Cooke, R.M.; Pettinato, C.; Riva, L.; Leone, O.; Farsad, M.; Ciliberti, P.; Bacchi-Reggiani, L.; et al. Noninvasive etiologic diagnosis of cardiac amyloidosis using 99mTc-3,3-diphosphono-1,2-propanodicarboxylic acid scintigraphy. J. Am. Coll. Cardiol. 2005, 46, 1076–1084. [Google Scholar] [CrossRef]
  18. Rettl, R.; Duca, F.; Kronberger, C.; Binder, C.; Willixhofer, R.; Ermolaev, N.; Poledniczek, M.; Hofer, F.; Nitsche, C.; Hengstenberg, C.; et al. Prognostic implication of DPD quantification in transthyretin cardiac amyloidosis. Eur. Heart J. Cardiovasc. Imaging 2025, 26, 251–260. [Google Scholar] [CrossRef] [PubMed]
  19. Kramer, C.M.; Barkhausen, J.; Bucciarelli-Ducci, C.; Flamm, S.D.; Kim, R.J.; Nagel, E. Standardized cardiovascular magnetic resonance imaging (CMR) protocols: 2020 update. J. Cardiovasc. Magn. Reson. 2020, 22, 17. [Google Scholar] [CrossRef]
  20. Lang, R.M.; Badano, L.P.; Mor-Avi, V.; Afilalo, J.; Armstrong, A.; Ernande, L.; Flachskampf, F.A.; Foster, E.; Goldstein, S.A.; Kuznetsova, T.; et al. Recommendations for cardiac chamber quantification by echocardiography in adults: An update from the American Society of Echocardiography and the European Association of Cardiovascular Imaging. J. Am. Soc. Echocardiogr. 2015, 16, 233–271. [Google Scholar]
  21. Patel, R.K.; Bandera, F.; Venneri, L.; Porcari, A.; Razvi, Y.; Ioannou, A.; Chacko, L.; Martinez-Naharro, A.; Rauf, M.U.; Knight, D.; et al. Cardiopulmonary Exercise Testing in Evaluating Transthyretin Amyloidosis. JAMA Cardiol. 2024, 9, 367–376. [Google Scholar] [CrossRef]
  22. Zhuang, C.; Luo, X.; Wang, Q.; Wang, W.; Sun, R.; Zhang, X.; Yu, J. The effect of exercise training and physiotherapy on diastolic function, exercise capacity and quality of life in patients with heart failure with preserved ejection fraction: A systematic review and meta-analysis. Kardiol. Pol. 2021, 79, 1107–1115. [Google Scholar] [CrossRef] [PubMed]
  23. Pislaru, C.; Alashry, M.M.; Ionescu, F.; Petrescu, I.; Pellikka, P.A.; Grogan, M.; Dispenzieri, A.; Pislaru, S.V. Increased Myocardial Stiffness Detected by Intrinsic Cardiac Elastography in Patients with Amyloidosis: Impact on Outcomes. JACC Cardiovasc. Imaging 2019, 12, 375–377. [Google Scholar] [CrossRef]
  24. Duca, F.; Rettl, R.; Kronberger, C.; Binder, C.; Mann, C.; Dusik, F.; Schrutka, L.; Dalos, D.; Öztürk, B.; Dachs, T.M.; et al. Myocardial structural and functional changes in cardiac amyloidosis: Insights from a prospective observational patient registry. Eur. Heart J. Cardiovasc. Imaging 2023, 25, 95–104. [Google Scholar] [CrossRef] [PubMed]
  25. Gillmore, J.D.; Damy, T.; Fontana, M.; Hutchinson, M.; Lachmann, H.J.; Martinez-Naharro, A.; Quarta, C.C.; Rezk, T.; Whelan, C.J.; Gonzalez-Lopez, E.; et al. A new staging system for cardiac transthyretin amyloidosis. Eur. Heart J. 2018, 39, 2799–2806. [Google Scholar] [CrossRef]
  26. Nies, R.J.; Ney, S.; Kindermann, I.; Bewarder, Y.; Zimmer, A.; Knebel, F.; Hahn, K.; Spethmann, S.; Luedike, P.; Michel, L.; et al. Real-world characteristics and treatment of cardiac transthyretin amyloidosis: A multicentre, observational study. ESC Heart Fail. 2024, 12, 1203–1216. [Google Scholar] [CrossRef] [PubMed]
  27. Tana, M.; Tana, C.; Palmiero, G.; Mantini, C.; Coppola, M.G.; Limongelli, G.; Schiavone, C.; Porreca, E. Imaging findings of right cardiac amyloidosis: Impact on prognosis and clinical course. J. Ultrasound 2023, 26, 605–614. [Google Scholar] [CrossRef]
  28. Licordari, R.; Minutoli, F.; Recupero, A.; Campisi, M.; Donato, R.; Mazzeo, A.; Dattilo, G.; Baldari, S.; Vita, G.; Zito, C.; et al. Early Impairment of Right Ventricular Morphology and Function in Transthyretin-Related Cardiac Amyloidosis. J. Cardiovasc. Echogr. 2021, 31, 17–22. [Google Scholar] [CrossRef]
  29. Cantone, A.; Serenelli, M.; Sanguettoli, F.; Maio, D.; Fabbri, G.; Dal Passo, B.; Agostoni, P.; Grazzi, G.; Campo, G.; Rapezzi, C. Cardiopulmonary exercise testing predicts prognosis in amyloid cardiomyopathy: A systematic review and meta-analysis. ESC Heart Fail. 2023, 10, 2740–2744. [Google Scholar] [CrossRef]
  30. Dalia, T.; Acharya, P.; Chan, W.-C.; Sauer, A.J.; Weidling, R.; Fritzlen, J.; Goyal, A.; Miller, D.; Knipper, E.; Porter, C.B.; et al. Prognostic Role of Cardiopulmonary Exercise Testing in Wild-Type Transthyretin Amyloid Cardiomyopathy Patients Treated with Tafamidis. J. Card. Fail. 2021, 27, 1285–1289. [Google Scholar] [CrossRef]
  31. Bartolini, S.; Baldasseroni, S.; Fattirolli, F.; Silverii, M.V.; Piccioli, L.; Perfetto, F.; Marchionni, N.; Di Mario, C.; Martone, R.; Taborchi, G.; et al. Poor right ventricular function is associated with impaired exercise capacity and ventilatory efficiency in transthyretin cardiac amyloid patients. Intern. Emerg. Med. 2021, 16, 653–660. [Google Scholar] [CrossRef] [PubMed]
  32. Yunis, A.; Doros, G.; Luptak, I.; Connors, L.H.; Sam, F. Use of Ventilatory Efficiency Slope as a Marker for Increased Mortality in Wild-Type Transthyretin Cardiac Amyloidosis. Am. J. Cardiol. 2019, 124, 122–130. [Google Scholar] [CrossRef] [PubMed]
  33. Pugliatti, P.; Trimarchi, G.; Barocelli, F.; Pizzino, F.; Di Spigno, F.; Tedeschi, A.; Piccione, M.C.; Irrera, P.; Aschieri, D.; Niccoli, G.; et al. Advancing Cardiac Amyloidosis Care Through Insights from Cardiopulmonary Exercise Testing. J. Clin. Med. 2024, 13, 7285. [Google Scholar] [CrossRef] [PubMed]
  34. Kessler, L.; Costa, P.F.; Kersting, D.; Jentzen, W.; Weber, M.; Lüdike, P.; Carpinteiro, A.; Oubari, S.; Hagenacker, T.; Thimm, A.; et al. Quantitative (99m)Tc-DPD-SPECT/CT assessment of cardiac amyloidosis. J. Nucl. Cardiol. 2023, 30, 101–111. [Google Scholar] [CrossRef]
Figure 1. Total amyloidosis cohort and reasons for study exclusion. Abbreviations: CPET, cardiopulmonary exercise testing; DPD, [99mTc]-3,3-diphosphono-1,2-propanodicarboxylic acid; SPECT/CT, Single-photon emission computed tomography. Figure was created with lucid.app.
Jcm 14 02999 g001
Figure 2. (a) Correlation between peak oxygen uptake and left ventricular [99mTc]-DPD retention index; (b) Correlation between peak oxygen uptake at anaerobic threshold and left ventricular [99mTc]-DPD retention index. (c) Correlation between peak minute ventilation and left ventricular [99mTc]-DPD retention index. Abbreviations: [99mTc]-DPD, [ 99mTc]-3,3-diphosphono-1,2-propanodicarboxylic acid; VO2, oxygen consumption.
Jcm 14 02999 g002
Table 1. Baseline characteristics of our study cohort.
Variables All
(n = 44)
Low [99mTc]-DPD Uptake
(n = 22)
High [99mTc]-DPD Uptake (n = 22) p-Value
Demographic and clinical parameters
Age, years 78.0 (73.0–78.0)79.0 (72.0–80.0)75.0 (71.0–79.0)0.689
Sex, Male 36 (82.0)20 (91.0)16 (73.0)0.240
Body Mass Index, kg/m227.0 (25.1–28.7)24.5 (24.0–27.3)28.0 (25.1–31.8)0.124
NYHA Functional Class 0.025
Class I 6 (14.0)5 (23.0)1 (4.0)
Class II 22 (50.0)13 (59.0)9 (41.0)
Class III 16 (36.0)4 (18.0)12 (55.0)
6 min Walk Distance, m 422.0 (366.1–458.3)458.0 (347.0–496.1)405.0 (341.2–462.1)0.222
ATTRv 5 (11.0)2 (9.0)3 (14.0)1.000
Comorbidities
Arterial hypertension 24 (54.0)10 (45.0)14 (64.0)0.364
Atrial fibrillation or flutter 26 (59.0)13 (59.0)13 (59.0)1.000
Coronary artery disease 13 (29.0)10 (45.0)3 (14.0)0.045
Carpal tunnel syndrome 25 (57.0)13 (59.0)12 (54.0)1.000
Polyneuropathy 30 (68.0)14 (64.0)16 (73.0)0.747
Concomitant medication
Beta-blockers 18 (41.0)9 (41.0)9 (41.0)1.000
MRA 23 (52.0)9 (41.0)14 (64.0)0.227
Diuretics 30 (68.0)13 (59.0)17 (77.0)0.332
Anticoagulants 26 (59.0)13 (59.0)13 (59.0)1.000
Statins 21 (48.0)11 (50.0)10 (45.5)1.000
Laboratory parameters
NT-proBNP, pg/mL 1876.0 (1611.0–2595.3)1364.0 (1051.0–2063.0)2341.0 (1844.0–3506.4)0.029
Troponin T, ng/L 41.0 (39.2–57.3)39.0 (33.7–62.0)46.0 (36.1–61.2)0.916
eGFR, mL/min/1.73 m268.1 (59.1–75.4)79.0 (64.0–85.0)58.0 (47.0–72.2)0.126
Cardiopulmonary Exercise Testing
Peak VO2, mL/min/kg 15.0 (15.0–18.0)16.1 (15.0–19.4)12.7 (11.7–14.4)0.002
VO2 at AT, mL/min/kg 10.0 (10.2–12.3)11.4 (10.7–14.3)9.2 (9.0–10.8)0.003
Peak O2 Pulse, mL/beat 11.4 (10.4–12.4)11.4 (10.2–13.6)11.4 (9.3–12.3)0.379
VE/VCO2 slope 39.4 (36.9–41.6)39.3 (35.1–43.0)39.7 (36.5–42.5)0.606
Peak workload, Watt 80.0 (68.2–88.2)90.0 (77.3–108.1)56.0 (53.0–73.4)0.003
Peak VE, L/min 52.5 (52.0–63.2)60.0 (57.0–73.2)45.0 (43.8–57.0)0.004
Nuclear imaging parameters
Perugini Grading Scale 0.760
2 18 (41.0)8 (36.0)10 (45.0)
3 26 (59.0)14 (64.0)12 (54.0)
[99mTc]-DPD retention index 5.0 (4.3–6.0)2.8 (2.4–3.3)6.8 (6.5–8.0)<0.001
Transthoracic echocardiography parameters
Interventricular septum, mm 18.0 (17.4–20.2)19.0 (17.1–21.3)17.0 (16.4–20.5)0.540
LV ejection fraction, % 51.0 (47.1–53.0)52.0 (47.3–54.4)50.0 (44.4–53.4)0.518
LV end-diastolic diameter, mm 43.0 (42.0–45.5)43.0 (40.5–46.0)44.0 (41.0–47.2)0.556
LV global longitudinal strain, -% 12.0 (13.5–11.4)13.2 (15.0–11.5)12.0 (13.0–10.4)0.162
RV end-diastolic diameter, mm 34.0 (32.3–36.0)34.0 (31.2–35.5)34.0 (32.0–37.0)0.787
RV global longitudinal strain, -% 15.0 (16.1–13.0)16.3 (18.1–13.4)12.0 (15.3–11.2)0.166
Cardiac magnetic resonance imaging parameters (n = 32)
Interventricular septum, mm 18.3 (16.4–21.1)19.0 (15.2–21.0)17.6 (15.1–24.4)0.737
LV ejection fraction, % 47.1 (43.4–52.0)46.0 (40.3–52.0)49.0 (42.2–56.0)0.766
RV ejection fraction, % 47.5 (42.0–51.0)45.3 (42.0–53.0)50.0 (36.4–54.0)0.518
MOLLI-ECV, % 45.0 (41.0–51.0)43.0 (35.3–51.0)46.0 (42.1–56.0)0.450
T1-Mapping, ms 1112.0 (1089.4–1158.3)1113.0 (1069.1–1166.0)1110.0 (1069.1–1166.0)0.734
Continuous variables are presented as median and interquartile range (IQR), and categorical variables as numbers and percentages. Abbreviations: AT, anaerobic threshold; ATTRv, variant transthyretin amyloid; [99mTc]-DPD, [99mTc]-3,3-diphosphono-1,2-propanodicarboxylic acid; ECV, extracellular volume; eGFR, estimated glomerular filtration rate; LV, left ventricle; MRA, mineralocorticoid receptor antagonist; NT-proBNP, N-terminal prohormone of brain natriuretic peptide, NYHA, New York Heart Association functional class; RV, right ventricle; VE, minute ventilation; VE/VCO2 ventilation to cardon dioxide production; VO2, oxygen consumption.
Table 2. Correlations between CPET and LV [99mTc]-DPD retention index.
CPET Variable Correlation Coefficient p-Value
Peak VO2, mL/min/kg −0.3550.018
VO2 at AT, mL/min/kg −0.3910.009
Peak O2 Pulse, mL/beat 0.0750.629
VE/VCO2 slope 0.1250.419
Peak workload, Watt 0.2620.082
Peak VE, L/min −0.3480.021
Variables are presented as median and interquartile range (IQR). Abbreviations: LV, left ventricle; VE, minute ventilation; VE/VCO2, ventilation to carbon dioxide production; VO2, oxygen consumption.
Table 3. Correlation between CPET, quantitative [99mTc]-DPD LV uptake, and key clinical, laboratory, and imaging parameters.
Variables Peak VO2, mL/min/kg VE/VCO2 Slope [99mTc]-DPD Retention Index
Clinical parameters Correlation coefficientCorrelation coefficientCorrelation coefficient
Body Mass Index, kg/m2−0.197−0.0850.299 *
NYHA Functional Class ≥ III −0.549 **0.324 *0.324 *
6-min Walk Distance, m 0.384 *−0.451 **0.012
Laboratory parameters
NT-proBNP, pg/mL −0.530 **0.348 *0.261
Troponin T, ng/L −0.431 **0.587 **0.028
eGFR, mL/min/1.73 m20.402 **−0.390 **−0.138
Transthoracic echocardiography parameters
Interventricular septum, mm −0.0410.312 *0.119
LV ejection fraction, % 0.2830.0330.062
LV end-diastolic diameter, mm −0.1020.299 *−0.001
LV global longitudinal strain, -% −0.2820.2360.283
RV end-diastolic diameter, mm −0.2540.032−0.031
RV global longitudinal strain, -% −0.350 *0.2890.291
Cardiac magnetic resonance imaging parameters n = 32n = 17n = 15
Interventricular septum, mm −0.1030.2140.250
LV ejection fraction, % 0.211−0.0160.048
RV ejection fraction, % 0.374 *−0.104−0.003
MOLLI-ECV, % −0.1490.3020.315
Native T1 time, ms −0.2760.464 **0.231
Table 3 shows the simple correlation between key CPET, [99mTc]-DPD retention index, and key clinical, laboratory, and imaging parameters. Correlations were assessed using the Spearman coefficient, which is reported in the table. * p-value < 0.05, ** p-value < 0.001. Abbreviations: [99mTc]-DPD, [99mTc]-3,3-diphosphono-1,2-propanodicarboxylic acid; ECV, extracellular volume; eGFR, estimated glomerular filtration rate; LV, left ventricle; NT-proBNP, N-terminal prohormone of brain natriuretic peptide, NYHA, New York Heart Association functional class; RV, right ventricle; VE, minute ventilation; VE/VCO2 ventilation to cardon dioxide production; VO2, oxygen consumption.
Disclaimer/Publisher’s Note: The statements, opinions and data contained in all publications are solely those of the individual author(s) and contributor(s) and not of MDPI and/or the editor(s). MDPI and/or the editor(s) disclaim responsibility for any injury to people or property resulting from any ideas, methods, instructions or products referred to in the content.

